airborne measurements of organic bromine compounds … · airborne measurements of organic bromine...
TRANSCRIPT
Correction
EARTH, ATMOSPHERIC, AND PLANETARY SCIENCESCorrection for “Airborne measurements of organic bromine com-pounds in the Pacific tropical tropopause layer,” byMaria A. Navarro,Elliot L. Atlas, Alfonso Saiz-Lopez, Xavier Rodriguez-Lloveras,Douglas E. Kinnison, Jean-Francois Lamarque, Simone Tilmes,Michal Filus, Neil R. P. Harris, Elena Meneguz, Matthew J. Ashfold,Alistair J. Manning, Carlos A. Cuevas, Sue M. Schauffler, andValeria Donets, which appeared in issue 45, November 10, 2015,of Proc Natl Acad Sci USA (112:13789–13793; first publishedOctober 26, 2015; 10.1073/pnas.1511463112).The authors note that, due to a printer’s error, in the Abstract,
lines 12–13, and on page 13789, right column, second full para-graph, line 12, “parts per thousand” should instead appear as “partsper trillion.”
www.pnas.org/cgi/doi/10.1073/pnas.1522889113
www.pnas.org PNAS | December 22, 2015 | vol. 112 | no. 51 | E7155
CORR
ECTION
Airborne measurements of organic brominecompounds in the Pacific tropical tropopause layerMaria A. Navarroa,1, Elliot L. Atlasa, Alfonso Saiz-Lopezb, Xavier Rodriguez-Lloverasb, Douglas E. Kinnisonc,Jean-Francois Lamarquec, Simone Tilmesc, Michal Filusd,e, Neil R. P. Harrisd,e, Elena Meneguzf, Matthew J. Ashfoldg,Alistair J. Manningf, Carlos A. Cuevasb, Sue M. Schaufflerc, and Valeria Donetsa
aDepartment of Atmospheric Sciences, Rosenstiel School of Marine and Atmospheric Science, University of Miami, Miami, FL 33149; bAtmospheric Chemistryand Climate Group, Institute of Physical Chemistry Rocasolano, Consejo Superior de Investigaciones Cientificas, 28006 Madrid, Spain; cAtmosphericChemistry Observation and Modeling, National Center for Atmospheric Research, Boulder, CO 80307; dCentre for Atmospheric Science, ChemistryDepartment, University of Cambridge, Cambridge CB2 1EW, United Kingdom; eDepartment of Chemistry, University of Cambridge, Cambridge CB2 1EW,United Kingdom; fMet Office, Exeter EX1 3PB, United Kingdom; and gSchool of Biosciences, University of Nottingham, 43500 Semenyih, Selangor, Malaysia
Edited by Susan Solomon, Massachusetts Institute of Technology, Cambridge, MA, and approved September 28, 2015 (received for review June 11, 2015)
Very short-lived brominated substances (VSLBr) are an importantsource of stratospheric bromine, an effective ozone destructioncatalyst. However, the accurate estimation of the organic andinorganic partitioning of bromine and the input to the stratosphereremains uncertain. Here, we report near-tropopause measurementsof organic brominated substances found over the tropical Pacificduring the NASA Airborne Tropical Tropopause Experiment cam-paigns. We combine aircraft observations and a chemistry−climatemodel to quantify the total bromine loading injected to the strato-sphere. Surprisingly, despite differences in vertical transport be-tween the Eastern and Western Pacific, VSLBr (organic + inorganic)contribute approximately similar amounts of bromine [∼6 (4−9) partsper thousand] to the stratospheric input at the tropical tropopause.These levels of bromine cause substantial ozone depletion in thelower stratosphere, and any increases in future abundances (e.g., asa result of aquaculture) will lead to larger depletions.
bromine | ATTREX | tropopause
Until the end of the last century, it was believed that onlylong-lived species, like bromomethane (CH3Br) and halons,
contributed to the global burden of stratospheric bromine. How-ever, disagreement between the observed amount of reactivestratospheric bromine and the sources of long-lived trace gasessuggested the existence of an additional contributor: Very short-livedbrominated substances (VSLorg) [VSLorg = bromoform (3CHBr3) +dibromomethane (2CH2Br2) + minorVSLBr, where minorVSLBr =bromochloromethane (CH2BrCl) + dibromochloromethane(2CHBr2Cl) + bromodichloromethane (CHBrCl2)] that originatemainly from ocean biogenic sources (1, 2).Several studies have described the processes involved in the
transformation of biogenic bromocarbons to inorganic bromine,and their transport through the tropical tropopause layer (TTL)(1–5). These studies have led to significant progress in modelingthe VSLorg contribution to the formation of stratospheric in-organic bromine (Bry) (3, 4, 6–11). However, the scarcity ofobservations to constrain the emissions, the impact of deepconvection, and the effect of dehydration processes limit theprediction of short-lived source gases that reach the stratosphere(3). On the other hand, atmospheric observations of VSLorg havebeen provided by ground measurements and cruise, balloon, andairborne campaigns (12–14), but the different instruments usedbetween campaigns, and the low spatial and temporal coverageof each study, contribute to the uncertainties in the estimationsof total bromine and its partitioning (15). In an attempt to re-duce these limitations, we present unique measurements of or-ganic bromine substances carried out with the same instrument,the Global Hawk Whole Air Sampler (GWAS), deployed duringthe NASA Airborne Tropical Tropopause Experiment (ATTREX),which covered the tropical Pacific region during 2013 and 2014 (seeSI Text for details of the campaign).
Because coastal areas of tropical waters (like the MaritimeContinent) are an important source for VSLorg (16–18) and highlyconvective zones can transport air masses from the troposphere intothe stratosphere through the TTL (19), we focus this study on ob-servations taken over the Western Pacific (120°E−165°E) and theEastern Pacific (187°E−268°E) (Fig. S1). We compared theseregions in terms of VSLorg mixing ratios at the tropopause level(∼17 km; Fig. S2), which defines the chemical composition of airthat enters the stratosphere.Whole air samples were collected during two deployments of
the ATTREX campaigns, on board the unmanned aerial vehicleGlobal Hawk. Measurements of VSLorg were carried out in thefield using a combination of gas chromatography with mass se-lective, flame ionization, and electron capture detectors (Mate-rials and Methods). Fig. 1 A and B displays the observations ofCHBr3, CH2Br2, and minorVSLBr, as well as the total organicbromine mixing ratio, in the upper troposphere/lower strato-sphere (UTLS) of the Western and Eastern Pacific. GWAS ob-servations indicate that the total amount of VSLorg that enters thestratosphere over the Western and Eastern Pacific is approxi-mately similar, 3.27 ± 0.47 parts per thousand (ppt) and 2.96 ±0.42 ppt, respectively. These observations are compared with thestate-of-the-art Community Atmosphere Model (CAM-Chem)simulations (4, 20) (see Materials and Methods). The results showgood agreement with the measurements, and simulate the injectionof VSLorg to the stratosphere of 3.84 ± 0.64 ppt and 3.18 ± 1.49 ppt
Significance
This study reports an extensive set of in situ measurements ofnatural organic bromine species at the tropical tropopause.Compared with prior estimates, this study reduces the uncertaintyof the contribution of reactive bromine to stratospheric ozonedepletion. We compare measurements over the Eastern andWestern Pacific, two regions characterized by different transportdynamics, to show the influence of convective events on thechemistry of the tropopause region. Using measurements andmodeling, we describe the budget and partitioning of bromine atthe tropical tropopause and evaluate the contribution of bromineto ozone destruction in the lower stratosphere.
Author contributions: M.A.N. and E.L.A. performed research; M.A.N., E.L.A., A.S.-L., X.R.-L.,D.E.K., J.-F.L., S.T., M.F., N.R.P.H., E.M., M.J.A., A.J.M., C.A.C., S.M.S., and V.D. analyzed data;M.A.N. wrote the paper; E.L.A. Principal Investigator of GWAS; A.S.-L., X.R.-L., D.E.K., J.-F.L.,S.T., and C.A.C. performed CAM-Chem model; M.F., N.R.P.H., E.M., M.J.A., and A.J.M. per-formed NAME model; and S.M.S. and V.D. analyzed GWAS data.
The authors declare no conflict of interest.
This article is a PNAS Direct Submission.1To whom correspondence should be addressed. Email: [email protected].
This article contains supporting information online at www.pnas.org/lookup/suppl/doi:10.1073/pnas.1511463112/-/DCSupplemental.
www.pnas.org/cgi/doi/10.1073/pnas.1511463112 PNAS | November 10, 2015 | vol. 112 | no. 45 | 13789–13793
EART
H,A
TMOSP
HER
IC,
ANDPL
ANET
ARY
SCIENCE
S

organic Br for the Western and Eastern Pacific, respectively (Fig. 1A and B).Although negligible differences of the organic fraction of
VSLBr were observed between the Western and Eastern Pacific,we quantified the inorganic fraction coming from the degrada-tion of VSLorg. Estimations of inorganic bromine (Bry = Br +BrO +HOBr + BrONO2 + HBr + BrCl + 2Br2 + BrNO2 + IBr),with a focus at ∼17 km, were calculated with the CAM-Chemmodel using assimilated meteorological fields for each GlobalHawk flight. According to these simulations, the amount of Bryover the Eastern Pacific is 3.02 ± 1.90 ppt, whereas, in theWestern Pacific, the mixing ratio of Bry is 1.97 ± 0.21 ppt (Fig. 1C and D). Bry/VSLorg ratios show that at ∼17 km, the abundanceof Bry over the Western Pacific is almost half the amount ofVSLorg, in contrast to the Eastern Pacific, where the abundanceof Bry is similar to the value of VSLorg (Table 1).We evaluated these different Bry/VSLorg ratios with 12-d back-
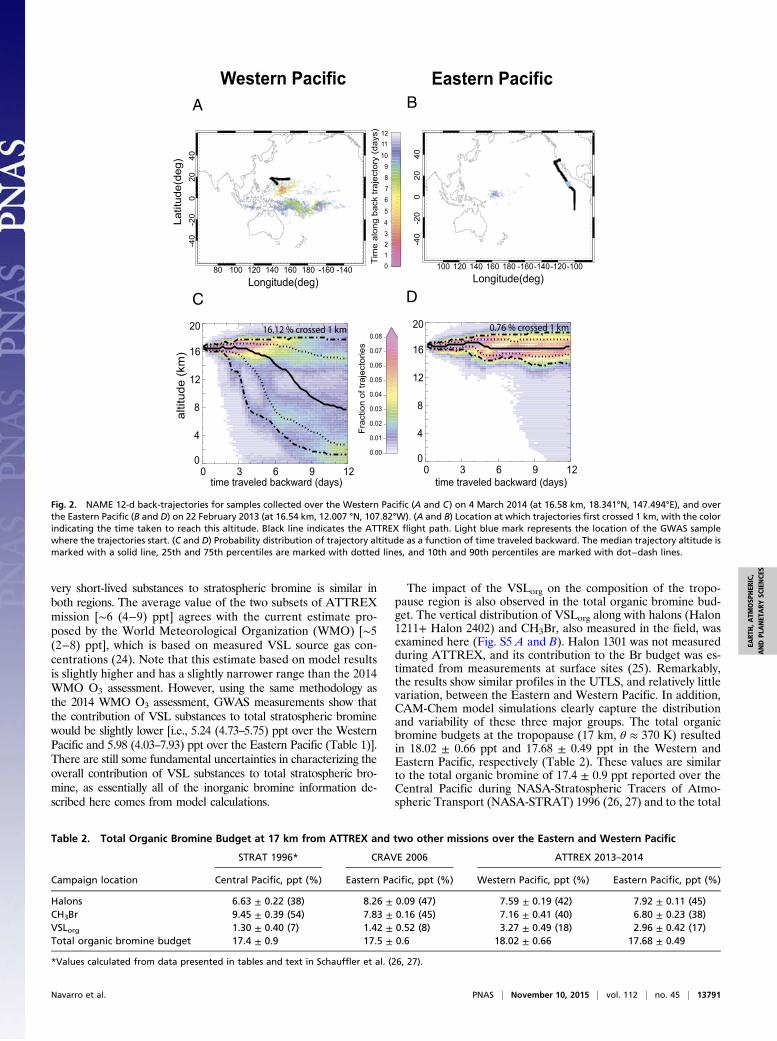
trajectory analyses using the Numerical Atmospheric dispersionModeling Environment (NAME) (21) (see Materials and Meth-ods). These analyses indicate that a variety of source regionsinfluenced our samples in the TTL during the ATTREX flights(see SI Text for details). However, the majority of air transportedto the tropopause region (∼17 km) of the Eastern and WesternPacific last encountered the boundary layer in the area between90°E and −140°E (Fig. S3). Fig. 2 A and B shows two repre-sentative cases of the locations where the back-trajectories firstcrossed the 1-km-altitude surface for samples collected over theWestern and Eastern Pacific, respectively. This similarity on thesource location of the air mass could explain the similar amountof VSLorg observed over both the Western and Eastern Pacific.
The NAME analysis indicates that the mean time for theboundary layer (<1 km) air to reach the air sampled at 17 km was9.8 d in the West Pacific samples and 11.1 d in the East Pacific.This difference in mean times, along with the difference betweenEast and West Pacific in the fraction of trajectories that reach 1 km,is consistent with the observed differences in the mixing ratios of theshorter-lived gases such as methyl iodide, bromoform, and propane(Table S1). Our analysis suggests that the air encountered aroundthe tropopause was composed of two well-mixed fractions: a“young” one, containing fresh emissions transported recently fromthe boundary layer and low troposphere within the previous days,and an “aged” fraction, which had been in the TTL for weeks tomonths (e.g., Fig. 2C and Fig. S4D). This is supported by 30-d back-trajectories calculated by NAME, which show that the influence ofconvective events between days 12 and 30 was small. The sameanalyses show that differences of Bry could be due to transportdynamics, mixing processes, and age of air masses targeted duringthe field campaigns. Flights over the Western Pacific tracked freshair from the air masses detrained into the TTL by Tropical StormFaxai and air from the South Pacific Convection Zone. Thus, mostof the air masses that reached ∼17 km during these two eventsmoved from the boundary layer to the upper troposphere (UT)rather than following the horizontal pattern seen on most of the airmasses tracked over the Eastern Pacific (Fig. 2 C and D). Wesuggest that these “fresh” air masses, quickly transported to the UT,limit the chemistry that leads to the formation of Bry, and reducetheir abundance over the Western Pacific. From another point ofview, the higher stratospheric injection of Br over the Eastern Pa-cific could be also related to transport time and distance. For ex-ample, as the air masses travel from West to East, heterogeneousrecycling reactions could put more Br back into the tropospherethan washout is removing. Previous studies have pointed out thatrapid uplift of air masses, due to convection events, as well as thecolder temperatures within the TTL, can considerably enhance theefficiency of heterogeneous reactions relative to complete washoutor ice removal (3, 4, 22, 23). However, the impact of heterogeneousreactions depends on several factors, including the microphysicalenvironment and the partitioning of the inorganic bromine spe-cies. Hence, further analysis of the Bry chemical speciation overthe Eastern and Western Pacific could provide insight into thesefundamental processes.Based on the CAM-Chem simulation results, the overall contri-
bution of VSL substances (VSLorg + Bry) to total stratosphericbromine, quantified at ∼17 km, show 5.81 (5.14–6.48) ppt overthe Western Pacific and 6.20 (3.79–8.61) ppt over the EasternPacific (Table 1).These results point out that although the pro-duction of Bry seems to be slightly different between the Easternand Western Pacific (within ±1 std dev), the overall contribution of
18
17
16
15
14
0 1 2 3 4 5 6 7 8 9 10
18
17
16
15
140 1 2 3 4 5 6 7 8 9 10
Mixing ratio (ppt)
Alti
tude
(km
)
Western Pacific Eastern PacificVSLorgCH2Br2
A B
CHBr3Minor VSLorgBry
(3.84 ± 0.64) ppt
1.97 ± 0.21 ppt
(3.18 ± 1.49) ppt
3.02 ± 1.90 ppt
GWAS= 2.96 ± 0.42 ppt GWAS= 3.27 ± 0.47 ppt
C D
Fig. 1. GWAS measurements and CAM-Chem simulations ±1 SD. Filledsymbols are the 1 km average bins from GWAS measurements. Lines are theCAM-Chem simulation. Values from the arrows represent the mean mixingratio (ppt) of VSLorg and Bry at the tropopause level (∼17 km) derived fromCAM-Chem simulations. (A and B) Organic brominated species multiplied bytheir atomicity for (A) Western Pacific and (B) Eastern Pacific. (C and D) CAM-Chem estimations of inorganic bromine (Bry) from measured brominatedVSLS with shaded ±1 SD for (C) Western Pacific and (D) Eastern Pacific.
Table 1. Organic and inorganic ratio of bromine over theWestern and Eastern Pacific Ocean at ∼17 km and total VSLBrcontributions
Values at 17 km Western Pacific Eastern Pacific
From CAM-ChemVSLorg, ppt 3.84 ± 0.64 3.18 ± 1.49Bry, ppt 1.97 ± 0.21 3.02 ± 1.90Bry/VSLorg 0.51 ± 0.04 0.95 ± 0.32VSLBr (Bry + VSLorg),* ppt 5.81 ± 0.67 6.20 ± 2.41
From GWASVSLorg, ppt 3.27 ± 0.47 2.96 ± 0.42VSLBr (Bry + VSLorg),
† ppt 5.24 ± 0.51 5.98 ± 1.95
*VSLBr from CAM-Chem. Both VSLorg and Bry are estimates from CAM-Chemmodel.†VSLBr from GWAS. VSLorg are the measurements from GWAS, and Bry areestimates from CAM-Chem model.
13790 | www.pnas.org/cgi/doi/10.1073/pnas.1511463112 Navarro et al.
very short-lived substances to stratospheric bromine is similar inboth regions. The average value of the two subsets of ATTREXmission [∼6 (4−9) ppt] agrees with the current estimate pro-posed by the World Meteorological Organization (WMO) [∼5(2−8) ppt], which is based on measured VSL source gas con-centrations (24). Note that this estimate based on model resultsis slightly higher and has a slightly narrower range than the 2014WMO O3 assessment. However, using the same methodology asthe 2014 WMO O3 assessment, GWAS measurements show thatthe contribution of VSL substances to total stratospheric brominewould be slightly lower [i.e., 5.24 (4.73–5.75) ppt over the WesternPacific and 5.98 (4.03–7.93) ppt over the Eastern Pacific (Table 1)].There are still some fundamental uncertainties in characterizing theoverall contribution of VSL substances to total stratospheric bro-mine, as essentially all of the inorganic bromine information de-scribed here comes from model calculations.
The impact of the VSLorg on the composition of the tropo-pause region is also observed in the total organic bromine bud-get. The vertical distribution of VSLorg along with halons (Halon1211+ Halon 2402) and CH3Br, also measured in the field, wasexamined here (Fig. S5 A and B). Halon 1301 was not measuredduring ATTREX, and its contribution to the Br budget was es-timated from measurements at surface sites (25). Remarkably,the results show similar profiles in the UTLS, and relatively littlevariation, between the Eastern and Western Pacific. In addition,CAM-Chem model simulations clearly capture the distributionand variability of these three major groups. The total organicbromine budgets at the tropopause (17 km, θ ≈ 370 K) resultedin 18.02 ± 0.66 ppt and 17.68 ± 0.49 ppt in the Western andEastern Pacific, respectively (Table 2). These values are similarto the total organic bromine of 17.4 ± 0.9 ppt reported over theCentral Pacific during NASA-Stratospheric Tracers of Atmo-spheric Transport (NASA-STRAT) 1996 (26, 27) and to the total
0 3 6 9 12time traveled backward (days)
0
4
8
12
16
20
0.00
0.01
0.02
0.03
0.04
0.05
0.06
0.07
0.08
Frac
tion
of tr
ajec
torie
s
100 120 140 160 180 -160-140-120-100
20.90
0 3 6 9 12time traveled backward (days)
0
4
8
12
16
20
altit
ude
(km
)
80 100 120 140 160 180 -160 -140
-40
-20
020
40
Western Pacific Eastern PacificA B
C DLongitude (deg)Longitude (deg)
Latit
ude (
deg)
16.12 % crossed 1 km 0.76 % crossed 1 km
Tim
e al
ong
back
traj
ecto
ry (d
ays)
-40
-20
020
40
012345
6789
10
1112
Fig. 2. NAME 12-d back-trajectories for samples collected over the Western Pacific (A and C) on 4 March 2014 (at 16.58 km, 18.341°N, 147.494°E), and overthe Eastern Pacific (B and D) on 22 February 2013 (at 16.54 km, 12.007 °N, 107.82°W). (A and B) Location at which trajectories first crossed 1 km, with the colorindicating the time taken to reach this altitude. Black line indicates the ATTREX flight path. Light blue mark represents the location of the GWAS samplewhere the trajectories start. (C and D) Probability distribution of trajectory altitude as a function of time traveled backward. The median trajectory altitude ismarked with a solid line, 25th and 75th percentiles are marked with dotted lines, and 10th and 90th percentiles are marked with dot−dash lines.
Table 2. Total Organic Bromine Budget at 17 km from ATTREX and two other missions over the Eastern and Western Pacific
STRAT 1996* CRAVE 2006 ATTREX 2013–2014
Campaign location Central Pacific, ppt (%) Eastern Pacific, ppt (%) Western Pacific, ppt (%) Eastern Pacific, ppt (%)
Halons 6.63 ± 0.22 (38) 8.26 ± 0.09 (47) 7.59 ± 0.19 (42) 7.92 ± 0.11 (45)CH3Br 9.45 ± 0.39 (54) 7.83 ± 0.16 (45) 7.16 ± 0.41 (40) 6.80 ± 0.23 (38)VSLorg 1.30 ± 0.40 (7) 1.42 ± 0.52 (8) 3.27 ± 0.49 (18) 2.96 ± 0.42 (17)Total organic bromine budget 17.4 ± 0.9 17.5 ± 0.6 18.02 ± 0.66 17.68 ± 0.49
*Values calculated from data presented in tables and text in Schauffler et al. (26, 27).
Navarro et al. PNAS | November 10, 2015 | vol. 112 | no. 45 | 13791
EART
H,A
TMOSP
HER
IC,
ANDPL
ANET
ARY
SCIENCE
S
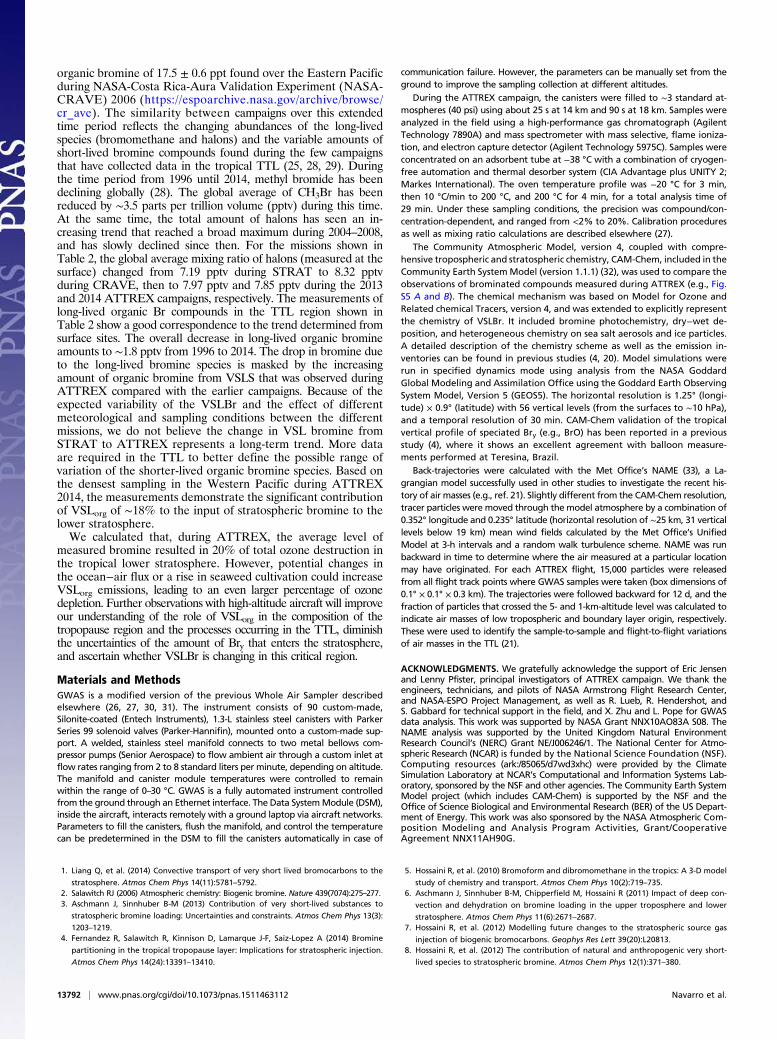
organic bromine of 17.5 ± 0.6 ppt found over the Eastern Pacificduring NASA-Costa Rica-Aura Validation Experiment (NASA-CRAVE) 2006 (https://espoarchive.nasa.gov/archive/browse/cr_ave). The similarity between campaigns over this extendedtime period reflects the changing abundances of the long-livedspecies (bromomethane and halons) and the variable amounts ofshort-lived bromine compounds found during the few campaignsthat have collected data in the tropical TTL (25, 28, 29). Duringthe time period from 1996 until 2014, methyl bromide has beendeclining globally (28). The global average of CH3Br has beenreduced by ∼3.5 parts per trillion volume (pptv) during this time.At the same time, the total amount of halons has seen an in-creasing trend that reached a broad maximum during 2004–2008,and has slowly declined since then. For the missions shown inTable 2, the global average mixing ratio of halons (measured at thesurface) changed from 7.19 pptv during STRAT to 8.32 pptvduring CRAVE, then to 7.97 pptv and 7.85 pptv during the 2013and 2014 ATTREX campaigns, respectively. The measurements oflong-lived organic Br compounds in the TTL region shown inTable 2 show a good correspondence to the trend determined fromsurface sites. The overall decrease in long-lived organic bromineamounts to ∼1.8 pptv from 1996 to 2014. The drop in bromine dueto the long-lived bromine species is masked by the increasingamount of organic bromine from VSLS that was observed duringATTREX compared with the earlier campaigns. Because of theexpected variability of the VSLBr and the effect of differentmeteorological and sampling conditions between the differentmissions, we do not believe the change in VSL bromine fromSTRAT to ATTREX represents a long-term trend. More dataare required in the TTL to better define the possible range ofvariation of the shorter-lived organic bromine species. Based onthe densest sampling in the Western Pacific during ATTREX2014, the measurements demonstrate the significant contributionof VSLorg of ∼18% to the input of stratospheric bromine to thelower stratosphere.We calculated that, during ATTREX, the average level of
measured bromine resulted in 20% of total ozone destruction inthe tropical lower stratosphere. However, potential changes inthe ocean−air flux or a rise in seaweed cultivation could increaseVSLorg emissions, leading to an even larger percentage of ozonedepletion. Further observations with high-altitude aircraft will improveour understanding of the role of VSLorg in the composition of thetropopause region and the processes occurring in the TTL, diminishthe uncertainties of the amount of Bry that enters the stratosphere,and ascertain whether VSLBr is changing in this critical region.
Materials and MethodsGWAS is a modified version of the previous Whole Air Sampler describedelsewhere (26, 27, 30, 31). The instrument consists of 90 custom-made,Silonite-coated (Entech Instruments), 1.3-L stainless steel canisters with ParkerSeries 99 solenoid valves (Parker-Hannifin), mounted onto a custom-made sup-port. A welded, stainless steel manifold connects to two metal bellows com-pressor pumps (Senior Aerospace) to flow ambient air through a custom inlet atflow rates ranging from 2 to 8 standard liters per minute, depending on altitude.The manifold and canister module temperatures were controlled to remainwithin the range of 0–30 °C. GWAS is a fully automated instrument controlledfrom the ground through an Ethernet interface. The Data SystemModule (DSM),inside the aircraft, interacts remotely with a ground laptop via aircraft networks.Parameters to fill the canisters, flush the manifold, and control the temperaturecan be predetermined in the DSM to fill the canisters automatically in case of
communication failure. However, the parameters can be manually set from theground to improve the sampling collection at different altitudes.
During the ATTREX campaign, the canisters were filled to ∼3 standard at-mospheres (40 psi) using about 25 s at 14 km and 90 s at 18 km. Samples wereanalyzed in the field using a high-performance gas chromatograph (AgilentTechnology 7890A) and mass spectrometer with mass selective, flame ioniza-tion, and electron capture detector (Agilent Technology 5975C). Samples wereconcentrated on an adsorbent tube at −38 °C with a combination of cryogen-free automation and thermal desorber system (CIA Advantage plus UNITY 2;Markes International). The oven temperature profile was −20 °C for 3 min,then 10 °C/min to 200 °C, and 200 °C for 4 min, for a total analysis time of29 min. Under these sampling conditions, the precision was compound/con-centration-dependent, and ranged from <2% to 20%. Calibration proceduresas well as mixing ratio calculations are described elsewhere (27).
The Community Atmospheric Model, version 4, coupled with compre-hensive tropospheric and stratospheric chemistry, CAM-Chem, included in theCommunity Earth SystemModel (version 1.1.1) (32), was used to compare theobservations of brominated compounds measured during ATTREX (e.g., Fig.S5 A and B). The chemical mechanism was based on Model for Ozone andRelated chemical Tracers, version 4, and was extended to explicitly representthe chemistry of VSLBr. It included bromine photochemistry, dry−wet de-position, and heterogeneous chemistry on sea salt aerosols and ice particles.A detailed description of the chemistry scheme as well as the emission in-ventories can be found in previous studies (4, 20). Model simulations wererun in specified dynamics mode using analysis from the NASA GoddardGlobal Modeling and Assimilation Office using the Goddard Earth ObservingSystem Model, Version 5 (GEOS5). The horizontal resolution is 1.25° (longi-tude) × 0.9° (latitude) with 56 vertical levels (from the surfaces to ∼10 hPa),and a temporal resolution of 30 min. CAM-Chem validation of the tropicalvertical profile of speciated Bry (e.g., BrO) has been reported in a previousstudy (4), where it shows an excellent agreement with balloon measure-ments performed at Teresina, Brazil.
Back-trajectories were calculated with the Met Office’s NAME (33), a La-grangian model successfully used in other studies to investigate the recent his-tory of air masses (e.g., ref. 21). Slightly different from the CAM-Chem resolution,tracer particles were moved through themodel atmosphere by a combination of0.352° longitude and 0.235° latitude (horizontal resolution of ∼25 km, 31 verticallevels below 19 km) mean wind fields calculated by the Met Office’s UnifiedModel at 3-h intervals and a random walk turbulence scheme. NAME was runbackward in time to determine where the air measured at a particular locationmay have originated. For each ATTREX flight, 15,000 particles were releasedfrom all flight track points where GWAS samples were taken (box dimensions of0.1° × 0.1° × 0.3 km). The trajectories were followed backward for 12 d, and thefraction of particles that crossed the 5- and 1-km-altitude level was calculated toindicate air masses of low tropospheric and boundary layer origin, respectively.These were used to identify the sample-to-sample and flight-to-flight variationsof air masses in the TTL (21).
ACKNOWLEDGMENTS. We gratefully acknowledge the support of Eric Jensenand Lenny Pfister, principal investigators of ATTREX campaign. We thank theengineers, technicians, and pilots of NASA Armstrong Flight Research Center,and NASA-ESPO Project Management, as well as R. Lueb, R. Hendershot, andS. Gabbard for technical support in the field, and X. Zhu and L. Pope for GWASdata analysis. This work was supported by NASA Grant NNX10AO83A S08. TheNAME analysis was supported by the United Kingdom Natural EnvironmentResearch Council’s (NERC) Grant NE/J006246/1. The National Center for Atmo-spheric Research (NCAR) is funded by the National Science Foundation (NSF).Computing resources (ark:/85065/d7wd3xhc) were provided by the ClimateSimulation Laboratory at NCAR’s Computational and Information Systems Lab-oratory, sponsored by the NSF and other agencies. The Community Earth SystemModel project (which includes CAM-Chem) is supported by the NSF and theOffice of Science Biological and Environmental Research (BER) of the US Depart-ment of Energy. This work was also sponsored by the NASA Atmospheric Com-position Modeling and Analysis Program Activities, Grant/CooperativeAgreement NNX11AH90G.
1. Liang Q, et al. (2014) Convective transport of very short lived bromocarbons to the
stratosphere. Atmos Chem Phys 14(11):5781–5792.2. Salawitch RJ (2006) Atmospheric chemistry: Biogenic bromine. Nature 439(7074):275–277.3. Aschmann J, Sinnhuber B-M (2013) Contribution of very short-lived substances to
stratospheric bromine loading: Uncertainties and constraints. Atmos Chem Phys 13(3):
1203–1219.4. Fernandez R, Salawitch R, Kinnison D, Lamarque J-F, Saiz-Lopez A (2014) Bromine
partitioning in the tropical tropopause layer: Implications for stratospheric injection.
Atmos Chem Phys 14(24):13391–13410.
5. Hossaini R, et al. (2010) Bromoform and dibromomethane in the tropics: A 3-D model
study of chemistry and transport. Atmos Chem Phys 10(2):719–735.6. Aschmann J, Sinnhuber B-M, Chipperfield M, Hossaini R (2011) Impact of deep con-
vection and dehydration on bromine loading in the upper troposphere and lower
stratosphere. Atmos Chem Phys 11(6):2671–2687.7. Hossaini R, et al. (2012) Modelling future changes to the stratospheric source gas
injection of biogenic bromocarbons. Geophys Res Lett 39(20):L20813.8. Hossaini R, et al. (2012) The contribution of natural and anthropogenic very short-
lived species to stratospheric bromine. Atmos Chem Phys 12(1):371–380.
13792 | www.pnas.org/cgi/doi/10.1073/pnas.1511463112 Navarro et al.
9. Hossaini R, et al. (2013) Evaluating global emission inventories of biogenic bromo-carbons. Atmos Chem Phys 13(23):11819–11838.
10. Liang Q, et al. (2010) Finding the missing stratospheric Br y: A global modeling studyof CHBr 3 and CH 2 Br 2. Atmos Chem Phys 10(5):2269–2286.
11. Warwick N, et al. (2006) Global modeling of biogenic bromocarbons. J Geophys Res111(D24):D24305.
12. Cicerone RJ, Heidt LE, Pollock WH (1988) Measurements of atmospheric methyl bro-mide and bromoform. J Geophys Res 93(D4):3745–3749.
13. Sturges WT, Oram DE, Carpenter LJ, Penkett SA, Engel A (2000) Bromoform as asource of stratospheric bromine. Geophys Res Lett 27(14):2081–2084.
14. Yokouchi Y, et al. (1997) Distribution of methyl iodide, ethyl iodide, bromoform, anddibromomethane over the ocean (east and southeast Asian seas and the westernPacific). J Geophys Res 102(D7):8805–8809.
15. Wisher A, et al. (2014) Very short-lived bromomethanes measured by the CARIBICobservatory over the North Atlantic, Africa and Southeast Asia during 2009–2013.Atmos Chem Phys 14(7):3557–3570.
16. Brinckmann S, Engel A, Bönisch H, Quack B, Atlas E (2012) Short-lived brominatedhydrocarbons—Observations in the source regions and the tropical tropopause layer.Atmos Chem Phys 12(3):1213–1228.
17. Quack B, et al. (2004) Oceanic bromoform sources for the tropical atmosphere.Geophys Res Lett 31(23):L23S05.
18. Tegtmeier S, et al. (2012) Emission and transport of bromocarbons: From the WestPacific Ocean into the stratosphere. Atmos Chem Phys 12(22):10633–10648.
19. Sala S, et al. (2014) Deriving an atmospheric budget of total organic bromine usingairborne in situ measurements from the western Pacific area during SHIVA. AtmosChem Phys 14(13):6903–6923.
20. Ordóñez C, et al. (2012) Bromine and iodine chemistry in a global chemistry-climatemodel: Description and evaluation of very short-lived oceanic sources. Atmos ChemPhys 12(3):1423–1447.
21. Ashfold M, Harris N, Atlas E, Manning A, Pyle J (2012) Transport of short-lived speciesinto the Tropical Tropopause Layer. Atmos Chem Phys 12(14):6309–6322.
22. Sinnhuber B-M, Folkins I (2006) Estimating the contribution of bromoform to
stratospheric bromine and its relation to dehydration in the tropical tropopause
layer. Atmos Chem Phys 6(12):4755–4761.23. Williams JE, van Zadelhoff G-J, Scheele M (2009) The Effect of Updating Scavenging
and Conversion Rates on Cloud Droplets and Ice Particles in the TM Global Chemistry
Transport Model (Koninklijk Nederlands Meteorol Inst, De Bilt, The Netherlands).24. Carpenter LJ, et al. (2014) Ozone-Depleting Substances (ODSs) and Other Gases of
Interest to the Montreal Protocol. Scientific Assessment of Ozone Depletion: 2014,
Global Ozone Research and Monitoring Project–Report No. 55 (World Meteorological
Organization, Geneva), pp 1.1–1.78.25. Prinn R, et al. (2000) A history of chemically and radiatively important gases in air
deduced from ALE/GAGE/AGAGE. J Geophys Res 105(D14):17751–17792.26. Schauffler S, et al. (1998) Measurements of bromine containing organic compounds
at the tropical tropopause. Geophys Res Lett 25(3):317–320.27. Schauffler S, et al. (1999) Distributions of brominated organic compounds in the
troposphere and lower stratosphere. J Geophys Res 104(D17):21513–21535.28. Montzka S, Butler J, Hall B, Mondeel D, Elkins J (2003) A decline in tropospheric or-
ganic bromine. Geophys Res Lett 30(15):1826.29. Montzka SA, et al. (1996) Decline in the tropospheric abundance of halogen from halo-
carbons: Implications for stratospheric ozone depletion. Science 272(5266):1318–1322.30. Daniel J, et al. (1996) On the age of stratospheric air and inorganic chlorine and
bromine release. J Geophys Res 101(D11):16757–16770.31. Heidt L, Vedder J, Pollock W, Lueb R, Henry B (1989) Trace gases in the Antarctic
atmosphere. J Geophys Res 94(D9):11599–11611.32. Lamarque JF, et al. (2012) CAM-chem: Description and evaluation of interactive atmo-
spheric chemistry in the Community Earth System Model. Geosci Model Dev 5(2):369–411.33. Jones A, Thomson D, Hort M, Devenish B (2007) The UK Met Office’s Next-Generation
Atmospheric Dispersion Model, NAME III. Air Pollution Modeling and Its Application
(Springer, New York), Vol XVII, pp 580–589.
Navarro et al. PNAS | November 10, 2015 | vol. 112 | no. 45 | 13793
EART
H,A
TMOSP
HER
IC,
ANDPL
ANET
ARY
SCIENCE
S