air quality objectives review - epd.gov.hk · a summary of the findings from reviewing the studies...
TRANSCRIPT

Annex C of AS&H Paper 2/2017
Air Quality Objectives Review
Methodology Paper for
Health and Economic Impact Assessment (HEIA)

Environmental Protection Department
Agreement No. CE 15/2016 (EP)
Review of the Air Quality Objectives - Feasibility Study
Methodology Paper for Health and Economic Impact Assessment (HEIA)
June 2017
Name Signature
Prepared: Prof. Tze Wai WONG
Checked: Marcus IP
Approved: Freeman CHEUNG
Version: 07a Date: 5 June 2017
AECOM Asia Company Limited

Agreement No. CE 15/2016(EP) Review of the Air Quality Objectives - Feasibility Study
Environmental Protection Department Methodology Paper for Health and Economic Impact Assessment
Table of Contents
List of Acronyms and Abbreviations
1 INTRODUCTION ........................................................................................................................ 1
1.1 Background ................................................................................................................... 1 1.2 Purpose of this Paper.................................................................................................... 1
2 OVERVIEW OF HEALTH AND ECONOMIC IMPACT ASSESSMENT ................................... 2
3 PROPOSED APPROACH AND METHODOLOGY OF HEIA ................................................... 4
3.1 Overview of the Approach ............................................................................................. 4 3.2 Pollutant-Health Outcome Pairs .................................................................................... 4 3.3 Methods for Health Impact Assessment (HIA) .............................................................. 5 3.4 Economic Impact Assessment (EIA) ............................................................................. 9 3.5 Recommended Adjustments to the HEIA Tool for the Study ...................................... 10
4 ASSUMPTIONS AND LIMITATIONS OF THE HIA AND EIA ................................................ 11
4.1 Assumptions ................................................................................................................ 11 4.2 Uncertainties and Limitations of HEIA ........................................................................ 11
5 DATA REQUIREMENTS ......................................................................................................... 13
5.1 Data Acquisition .......................................................................................................... 13
6 REFERENCES ......................................................................................................................... 15
List of Figures Figure 1 Overview of Proposed Approach to Health and Economic Impact Assessment List of Tables Table 1 Review of Studies on Health Impacts of Air Pollutants of Concern Table 2 Overview of the Studied Air Pollutants and Health Outcomes Table 3 Relative Risks for Air Pollutants and Their Respective Morbidities Table 4 Relative Risks for Air Pollutants and Their Respective Mortalities
AECOM i June 2017

Agreement No. CE 15/2016(EP) Review of the Air Quality Objectives - Feasibility Study
Environmental Protection Department Methodology Paper for Health and Economic Impact Assessment
List of Acronyms and Abbreviations
A&E Accident and Emergency
AF Attributable Fraction
AIC Akaike Information Criteria
AQGs Air Quality Guidelines
AQOs Air Quality Objectives
AS&H Sub-group Air Science and Health Sub-group, AQO Review Working Group
BIC Bayesian Information Criteria
C&SD Census and Statistics Department
CL Confidence Level
CO Carbon Monoxide
COMEAP Committee on the Medical Effects of Air Pollution, United Kingdom
COPD Chronic Obstructive Pulmonary Disease
CR Concentration-Response
CUHK The Chinese University of Hong Kong
DEC (NSW) Department of Environment and Conservation, New South Wales, Australia (currently known as Office of Environment and Heritage)
DH Department of Health
E&PG Sub-group Energy and Power Generation Sub-group, AQO Review Working Group
EIA Economic Impact Assessment
EPD Environmental Protection Department
EU European Union
FHB Food and Health Bureau
FSP Fine Suspended Particulates, i.e. particulate matters with aerodynamic diameter less than or equal to 2.5 micrometres, also known as PM2.5
GDP Gross Domestic Product
GOPC General Outpatient Clinic
GP General Practitioner
HA Hospital Authority
HEIA Health and Economic Impact Assessment
HIA Health Impact Assessment
HRAPIE Project Health Risks of Air Pollution in Europe Project
ICD International Statistical Classification of Diseases and Related Health Problems
ICD-9 International Statistical Classification of Diseases and Related Health Problems 9
th Revision
ICD-10 International Statistical Classification of Diseases and Related Health Problems 10
th Revision
MT Sub-group Marine Transportation Sub-group, AQO Review Working Group
NA Not Applicable
NO2 Nitrogen Dioxide
NS Statistically Not Significant
O3 Ozone
PAPA Study Public Health and Air Pollution in Asia (PAPA): Coordinated Studies of Short-Term Exposure to Air Pollution and Daily Mortality in Four Cities
AECOM a June 2017
Agreement No. CE 15/2016(EP) Review of the Air Quality Objectives - Feasibility Study
Environmental Protection Department Methodology Paper for Health and Economic Impact Assessment
List of Acronyms and Abbreviations
PM Particulate Matter
PM2.5 Particulate matters with aerodynamic diameter less than or equal to 2.5 micrometres, also known as fine suspended particulates (FSP)
PM10 Particulate matters with aerodynamic diameter less than or equal to 10 micrometres, also known as respirable suspended particulates (RSP)
RR Relative Risk
RT Sub-group Road Transportation Sub-group, AQO Review Working Group
RSP Respirable Suspended Particulates, i.e. particulate matters with aerodynamic diameter less than or equal to 10 micrometres, also known as PM10
SO2 Sulphur Dioxide
TAP Toxic Air Pollutants
UK United Kingdom
URTI Upper Respiratory Tract Infection
US United States
USA United States of America
USEN Under Secretary for the Environment
USEPA United States Environmental Protection Agency
VOSL Value of Statistical Live
WHO World Health Organization
AECOM b June 2017

1 INTRODUCTION
1.1 Background
Agreement No. CE 15/2016(EP) Review of the Air Quality Objectives - Feasibility Study
Environmental Protection Department Methodology Paper for Health and Economic Impact Assessment
1.1.1 AECOM Asia Company Limited (AECOM) was commissioned by Environmental Protection Department (EPD) on 24 November 2016 to undertake Review of the Air Quality Objectives (AQO Review) - Feasibility Study (Agreement No: CE 15/2016 (EP)) (the “Study”).
1.1.2 For the present AQO Review, an Air Quality Objectives Review Working Group (Working Group), which is led by the Under Secretary for the Environment (USEN), has been established to gather views via dedicated sub-groups on four key aspects, namely Air Science and Health (AS&H), emission reduction in Energy and Power Generation (E&PG), as well as Road Transportation (RT), and Marine Transportation (MT). One of the focuses of the AS&H Sub-group is to advise on the methodologies of air science and health assessment. It is in this context that the Health and Economic Impact Assessment (HEIA) Task Force has been set up under the AS&H Sub-group in December 2016 to steer and advise the approach of HEIA associated with air pollution in Hong Kong in this Study.
1.1.3 As one of the assigned tasks, an HEIA under the cost and benefit analysis will be conducted in this Study. The assessment will make reference to the assessment tool developed under a separate study “Developing an Instrument for Assessing the Health and Economic Impacts of Air Pollution in Hong Kong” (“the Tool”) conducted by Professor WONG Tze Wai of the Chinese University of Hong Kong (CUHK) for EPD which was completed in 2016. This Tool was developed based on the internationally accepted methodologies incorporating the local health statistics and air quality data. When the Tool was first developed, it was intended to serve as a generic instrument to enable the estimation of health and economic impact of different criteria air pollutants at different levels based on different control strategies.
1.1.4 The Study will use the most up-to-date health and air quality data on the subject air pollutants (PM2.5, NO2 and O3) for this Study for estimating the health benefits of implementing various potential air quality improvement measures. Local concentration-response (CR) functions are adopted in the Tool as far as practicable. Otherwise, CR functions recommended by the World Health Organization (WHO) (WHO, 2013) will be adopted.
1.1.5 In the economic valuation, we shall estimate costs of the health impact of air pollution using the direct-cost approach (i.e., the cost arising from the treatment of an illness) and the indirect ‘Willingness To Pay’ (WTP) approach. The latter is a comprehensive assessment of all costs incurred, both direct and indirect. Loss of life was estimated using the ‘value of statistical life’ (VOSL) approach, with upper and lower bound estimates based on different sources.
1.2 Purpose of this Paper
1.2.1 This paper describes the proposed method for HEIA and outlines the data required when conducting the HEIA. The methodology will be subsequently incorporated in the Technical Report (5) (Cost and Benefit Analysis) of this Study. An overview of the overseas practice is provided in Section 2 as background information of HEIA.
AECOM 1 June 2017

Agreement No. CE 15/2016(EP) Review of the Air Quality Objectives - Feasibility Study
Environmental Protection Department Methodology Paper for Health and Economic Impact Assessment
2 OVERVIEW OF HEALTH AND ECONOMIC IMPACT ASSESSMENT
2.1.1 Health impact assessment (HIA) makes use of epidemiological methods to evaluate the potential effects of policies (e.g., environmental, urban development or energy policies), programmes (e.g., air pollution control programmes) or projects (e.g., major infrastructural developments) on the health of the community. Economic impact assessment (EIA) monetizes the respective impacts (benefits or harms) on community health.
2.1.2 As the definition of health is broad and the environmental determinants of health are multiple and complex, there are wide variations in the use of HIA where different countries have institutionalized HIA to varying extent (Lee et al., 2013). Some countries or administrative unit (e.g. Quebec of Canada, the United States (US), Thailand and European Commission) adopt legislation mandating HIA. Others routinely adopt HIA in major projects that significantly affect the health of the community concerned. In recent years, the WHO has published reports and papers that assist countries that has not yet developed and institutionalized the HIA process, by providing methodologies for HIA to systematize the process (WHO, 2013, 2016).
2.1.3 A review of HIA reports on the effects of air pollution published in major developed countries show that the dominant health impacts are mortality (i.e., premature deaths attributed to air pollution) and morbidity (hospital admissions for cardiovascular and respiratory diseases, increased incidence of specific diseases that are now known to be associated with air pollution – bronchial asthma and chronic obstructive pulmonary diseases, COPD). Some reports also include specific diseases where information is available, e.g., acute bronchitis, and sickness absence in their HIA. Some health outcomes, such as reduced pulmonary function attributed to air pollution, are not included because of the difficulty in assigning monetary value to them, even though the cause-effect association between pulmonary function is well established. A summary of the findings from reviewing the studies in United Kingdom (UK), Australia, France, Switzerland, and the US is presented in Table 1.
2.1.4 Despite the wide coverage of air pollutants and health outcomes, the role of PM2.5 on mortality had been emphasized as the most important exposure-outcome pair in the HIA. As a general rule, health impact from short-term exposure (such as higher risk of mortalities, hospitalizations, asthmatic attacks, incidence of respiratory symptoms, and doctor visits for minor illnesses) have been associated with air pollutant concentrations measured on a shorter timescale (e.g., mean 24-hour concentrations of PM2.5, NO2 and SO2, and daily maximum 8-hour concentrations of O3), while longer term exposures (e.g., annual mean concentrations of PM2.5 and NO2) are associated with mortality.
2.1.5 Differences in the HIA methodologies are in the choice of health outcomes, the CR functions and pollutant-health outcome pairs. Their choices are subject to the availability of relevant local baseline health data, CR data and an assessment of the strength of evidence for the specific pollutant-health outcome associations.
2.1.6 On the other hand, the use of EIA to assist policy decision has been controversial, owing to differences in opinion on the monetization of life and health. It is a statutory requirement in the US
1 to conduct HIA and EIA for policies or programmes with significant economic impact on
the community. EIA has been conducted in developed countries in Europe and Australia, as supporting evidence for air pollution control policies or initiatives. As mortality is the most important and irreversible result of the impact of air pollution, an estimate of the monetary value of life – the VOSL has been devised by health economists. There are different methods to estimate VOSL. Regardless of differences in the methodology, VOSL varies widely across countries and is known to be affected by socioeconomic and cultural factors. In general, VOSL is proportional to the per capita gross domestic product (GDP) of a country. For example, the VOSL in the US is higher than that in European countries. Within Europe, in a report by the WHO Regional Office for Europe (WHO, 2015), the VOSL of US$3 million has been recommended. The individual country is recommended to adjust this value according to its own per capital GDP in its EIA. In general, the monetization of life comprises the largest component of the share of EIA among all health outcomes. Direct medical costs of illness (such as the costs of hospitalization and medical treatment) vary widely between countries, but
1 Section 312 of the Clean Air Act
AECOM 2 June 2017
Agreement No. CE 15/2016(EP) Review of the Air Quality Objectives - Feasibility Study
Environmental Protection Department Methodology Paper for Health and Economic Impact Assessment
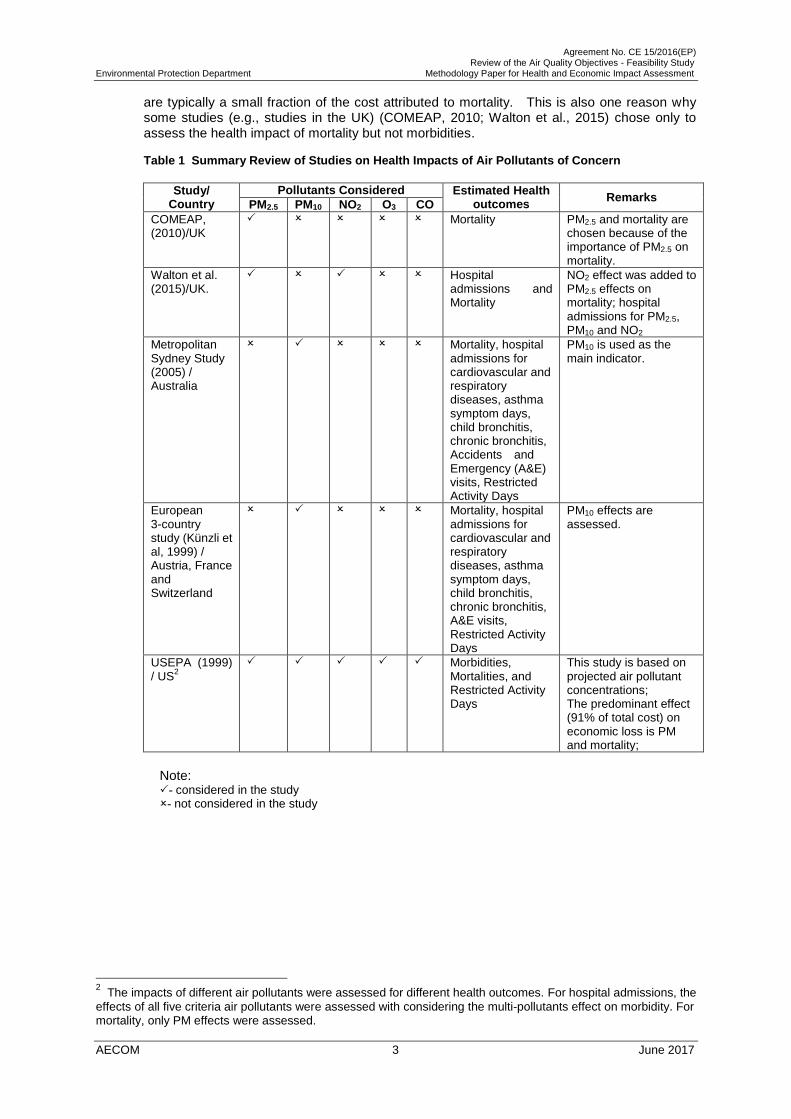
are typically a small fraction of the cost attributed to mortality. This is also one reason why some studies (e.g., studies in the UK) (COMEAP, 2010; Walton et al., 2015) chose only to assess the health impact of mortality but not morbidities.
Table 1 Summary Review of Studies on Health Impacts of Air Pollutants of Concern
Study/ Pollutants Considered Estimated Health outcomes
Remarks Country PM2.5 PM10 NO2 O3 CO
COMEAP, (2010)/UK
Mortality PM2.5 and mortality are chosen because of the importance of PM2.5 on mortality.
Walton et al. (2015)/UK.
Hospital admissions and Mortality
NO2 effect was added to PM2.5 effects on mortality; hospital admissions for PM2.5, PM10 and NO2
Metropolitan Sydney Study (2005) / Australia
Mortality, hospital admissions for cardiovascular and respiratory diseases, asthma symptom days, child bronchitis, chronic bronchitis, Accidents and Emergency (A&E) visits, Restricted Activity Days
PM10 is used as the main indicator.
European 3-country study (Künzli et al, 1999) / Austria, France and Switzerland
Mortality, hospital admissions for cardiovascular and respiratory diseases, asthma symptom days, child bronchitis, chronic bronchitis, A&E visits, Restricted Activity Days
PM10 effects are assessed.
USEPA (1999) / US
2 Morbidities,
Mortalities, and Restricted Activity Days
This study is based on projected air pollutant concentrations; The predominant effect (91% of total cost) on economic loss is PM and mortality;
Note: - considered in the study - not considered in the study
The impacts of different air pollutants were assessed for different health outcomes. For hospital admissions, the
effects of all five criteria air pollutants were assessed with considering the multi-pollutants effect on morbidity. For mortality, only PM effects were assessed.
AECOM 3 June 2017
2

Agreement No. CE 15/2016(EP) Review of the Air Quality Objectives - Feasibility Study
Environmental Protection Department Methodology Paper for Health and Economic Impact Assessment
3 PROPOSED APPROACH AND METHODOLOGY OF HEIA
3.1 Overview of the Approach
3.1.1 To assess the impact of outdoor air pollution on health, information on air pollution concentrations and exposure, the population groups exposed, the background incidence of mortality and morbidity, and concentration–response (CR) functions of each air pollutant for the corresponding health outcome will be gathered. The choice of which health outcomes to include in the assessment may be determined by the strength of available studies, the accessibility of health information, and the importance of the impact from a health and economic perspective. Most analyses conducted to date indicate that effects on mortality, particularly those relating to long-term exposure to air pollutants, tend to dominate the estimated economic effects (WHO, 2006b). The HIA that is being proposed will follow the conventional methodology used in the literature (COMEAP, 2010; Künzli et al., 1999; NSW Department of Environment and Conservation, 2005; WHO, 2014, 2016; Walton et al., 2015). The broad workflow is presented in Figure 1 below.
Figure 1 Overview of Proposed Approach to Health and Economic Impact Assessment
Change in air pollution level (to be derived by air quality assessment
under the AQO Review)
Exposure of the population (to be determined based on air quality
modelling output)
Health effect from expsure to air pollutant of concern (e.g. mortality,
hospital admissions, general practitioner visits)
Monetisation of health effects (based on value of statistical life for mortality impact, and enumeration of medical costs involved for morbidity impact)
3.2 Pollutant-Health Outcome Pairs
3.2.1 Mortality and morbidity from air pollution-related illnesses are the two major health outcomes that will be assessed. Both have been well documented to be causally linked to air pollution. ‘All-cause mortality’, which refers to death from any cause, has been widely used in HIA studies, because of the availability of mortality statistics as an integral part of national vital statistics. Table 2 provides an overview of the HIA to be undertaken for various air pollutants and health outcomes for the current Study. The choice of morbidities attributable to air pollution depends on the strength of evidence between exposure to air pollution and the health outcomes, and more importantly, on the availability of the relevant health statistics. These endpoints will be elaborated in the following sections.
AECOM 4 June 2017

Agreement No. CE 15/2016(EP) Review of the Air Quality Objectives - Feasibility Study
Environmental Protection Department Methodology Paper for Health and Economic Impact Assessment
Table 2 Overview of the Studied Air Pollutants and Health Outcomes
Key Pollutants of Concern Mortality Morbidities
Impact from Short-term Exposure to Air Pollutants3
PM2.5 NO2 O3
SO2 Impact from Long-term Exposure to Air Pollutants
PM2.5 CR functions are not
available
NO2 O3
SO2
Note: - impact to be studied - impact not to be studied
3.2.2 The major criteria air pollutants in Hong Kong are particulate matter (PM) of aerodynamic
diameter less than 10 m (PM10) and 2.5 m (PM2.5); nitrogen dioxide (NO2); sulphur dioxide (SO2); and ozone (O3). These pollutants have similar short-term effects on health, as shown in many local and overseas epidemiological studies (Wong et al, 2010). However, concentrations of both PM10 and PM2.5 are strongly correlated with NO2, and to a lesser extent, with SO2. The high correlations between these air pollutants make it difficult for the user to interpret the results if all three were included in the HIA, as there will inevitably be double-counting of health effects. In terms of the magnitude of health risk from short-term exposure, the gaseous air pollutants such as NO2 and O3 would be dominant among the criteria air pollutants in Hong Kong, with higher relative risks (RR) than PM and SO2.
3.2.3 The effects attributable to long-term exposure to SO2 on mortality and morbidity will not be assessed. This approach is in line with the recommendations of the WHO (WHO, 2013). SO2
is strongly correlated with PM and assessing the effects of both would result in the overlapping of effects. A more important reason for the omission of SO2 in the assessment of its long-term impact is that there has been no internationally accepted CR function for the long-term effects of SO2 on mortality and morbidity (WHO, 2013).
3.2.4 On the other hand, the overlapping effects of NO2 and PM2.5 on health outcomes have been discussed in a WHO expert meeting on the methods and tools for assessing the health risks at different levels (WHO, 2014). In an earlier report by WHO (WHO, 2013), it is mentioned that the overlapping effect on mortality from long-term exposure is likely to range from 0 to 33%. A conservative estimate of a 30% overlap in mortality from long-term exposure was assumed and has been used in a London study (Walton et al., 2015) to assess the health risk of air pollution. The HEIA Tool Study (Wong et al., 2016) also adopted this approach.
3.3 Methods for Health Impact Assessment (HIA)
3.3.1 An important step in HIA is the derivation of the proportions of health outcomes (mortalities and morbidities) that are estimated to be the results of exposure to air pollution. This proportion is known as the ‘attributable fraction’ (AF) in epidemiology. The AF is related to the relative risk (RR) of the health outcome that results from exposure to air pollution (i.e., the risk of premature death or the risk of being ill resulting in air pollution) by the formula:
3.3.2 To assess the impact of a change in the air pollution level from the current level (x g/m3) to a
target level (y g/m3), often termed the ‘counterfactual’, it is necessary to determine the RR of
this change (i.e., instead of a unit change in concentration, the RR is now expressed as that
3 The largest effect among the air pollutants with significant RRs will be chosen for assessment.
AECOM 5 June 2017

Agreement No. CE 15/2016(EP) Review of the Air Quality Objectives - Feasibility Study Environmental Protection Department Methodology Paper for Health and Economic Impact Assessment
from a change from x to y). The changes in mean air pollution concentration between the base year (2015) and the target years (i.e. 2020 and 2025) will be used in the HEIA of this Study.
3.3.3 This process will yield the AF for any specified change in concentration of any air pollutant
under study. The health impact of this change is given by the formula:
3.3.4 The baseline health outcome data refer to the daily and annual number of non-accidental
deaths, emergency hospital admissions for cardiovascular and respiratory diseases, asthma and COPD also the general practitioner (GP) and General Outpatient Clinic (GOPC) visits for upper respiratory tract infections (URTI). The AF refers to the fraction of a specified health outcome (deaths / hospitalizations / GP visits / GOPC visits) for a specified change in the air pollutant concentrations.
Morbidities
3.3.5 The following morbidities attributable to short-term exposure to air pollutants have been assessed in the HEIA Tool Study:
• Emergency hospital admissions for respiratory and cardiovascular diseases, asthma and COPD in all public hospitals under the Hospital Authority (HA);
• New episodes of URTI seen by GPs; and • New episodes of URTI seen at the GOPCs of the HA.
3.3.6 CR functions (expressed as RRs of morbidities for a unit increase in air pollutant concentration)
for the health outcomes listed in Table 3 are extracted from the local time series studies on air pollution and morbidities (Wong et al., 2010; Ko et al., 2007a,b; Wong et al., 2006; Tam et al., 2014; Qiu et al., 2013 ).
AECOM 6 June 2017

Agreement No. CE 15/2016(EP) Review of the Air Quality Objectives - Feasibility Study
Environmental Protection Department Methodology Paper for Health and Economic Impact Assessment
Table 3 Relative Risks for Air Pollutants and Their Respective Morbidities
Health Outcome Relative Risks per 10 g/m
3 (95% CL)
PM2.5
Daily mean NO2
Daily Mean O3
Daily 8-hr maximum
Emergency hospital admissions
Cardiovascular diseases
1.00664
(1.0036 – 1.0097) 1.0100
5
(1.0073 – 1.0126)
NS (statistically not
significant)
Respiratory diseases*
1.00976
(1.0065 – 1.0129) 1.0075
7
(1.0050 – 1.0100)
1.0081 7
(1.0058 – 1.0104)
Asthma7 1.021
(1.015 – 1.028) 1.028
(1.021 – 1.034) 1.034
(1.029 – 1.039)
Chronic obstructive pulmonary disease
8
1.031 (1.026 – 1.036)
1.026 (1.022 – 1.031)
1.034 (1.030 – 1.040)
New episodes of URTI
GP visits9 1.021
(1.010 – 1.032) 1.030
(1.020 – 1.040) 1.025
(1.012 – 1.038)
GOPC visits10 1.005
(1.002 – 1.009) 1.010
(1.006 – 1.013) 1.009
(1.006 – 1.012)
Note: *As no individual local RRs are available for "influenza and pneumonia”, these two groups are considered under “Respiratory disease”.
3.3.7 The RRs are based on single-pollutant models that do not take into account the overlapping effects of different air pollutants, whose effects on hospital admissions are similar. The conventional and recommended method to assess the health impact is to choose the largest effect among the air pollutants with significant RRs (Wong et al., 2010). Adding the effects of individual pollutants will result in substantial overlapping of the estimates. This is also true for the RRs for URTI episodes seen by GPs and GOPCs. We shall follow this principle and adopted the methodology developed in the HEIA Tool Study (Wong et al., 2016) to assess the morbidities attributed to the largest effect of the criteria air pollutants, i.e., PM2.5, NO2 and O3. As the RR for SO2 is insignificant (from PAPA Study, Wong et al., 2010), its effects will not be assessed.
3.3.8 Data on individual respiratory diseases other than URTI are not available in the outpatient setting and these diseases will not be separately assessed. Other morbidities/morbidity-associated impacts, such as sickness absence for hospital admissions for cardiovascular and respiratory diseases and for URTI seen by GPs, the A&E attendances for asthma and other respiratory and cardiovascular diseases, the prevalence of acute bronchitis, and days of reduced activities will not be assessed, as local statistics on these parameters are unavailable.
3.3.9 The time scale of the HEIA depends on the latest data available. We have chosen the latest population statistics, health statistics and air quality data in this Study. Hospital admissions data and death statistics for year 2015 will be acquired from the Hospital Authority (HA) and Census and Statistics Department (C&SD). Hence, air quality data in the corresponding year, i.e. 2015, will be used for HEIA. Data from 2011 to 2014 will be requested as the data from
4 RR for cardiovascular diseases is obtained through the personal communications with Dr. Hong Qiu with
reference to the information in a research paper published (Qiu et al, 2013). The RR was presented for each interquartile increase in PM2.5 in the published paper. Dr. Qiu was requested to provide instead the RR for each 10 μg/m
3 increase in PM2.5 concentration, i.e. 1.0066 as quoted above.
5 Wong et al., 2010. Public Health and Air Pollution in Asia (PAPA) Study.
6 RR for respiratory diseases is obtained through the personal communications with Dr. Hong Qiu. The ERs of
mortality reported by PAPA Study (Wong et al, 2010) with PM10 were 0.63% and 0.69% (equivalent to RRs of 1.0063 and 1.0069) and were somewhat lower than the RR for PM2.5, as the effect of PM10 on health is smaller than that of PM2.5.
7 Ko et al., 2007a
8 Ko et al., 2007b
9 Wong et al., 2006
10 Tam et al., 2014
AECOM 7 June 2017

Agreement No. CE 15/2016(EP) Review of the Air Quality Objectives - Feasibility Study
Environmental Protection Department Methodology Paper for Health and Economic Impact Assessment
years before 2015 will be used to conduct sensitivity tests to assess the stability of the estimates.
3.3.10 Estimated visits to private GPs for new episodes of URTI in 2015 will be based on the methodology developed in the HEIA Tool Study, and using limited published data on the percentages of new URTI visits in GP clinics and estimated number of annual GP visits. The latter estimates are challenging, as there would have wide variations of percentages of new URTI visits in GP clinics by years. Routine health statistics for local GP consultations in the private sector is also not comprehensive, as in most countries (other than the UK and Canada). References will be made from published studies, and the thematic household surveys conducted by the Government.Different approaches have been adopted in the choice of lag time. In the past, researchers have used the lag time that best fits the statistical model, using various statistical parameters (e.g., minimum value of the Akaike Information Criteria (AIC) or the Bayesian Information Criteria (BIC), maximum value of the chi square statistic, etc.). The current approach is to use ‘a priori’ criteria for time lag. In PAPA Study (Wong et al, 2010), a cumulative time lag of day 0 and day 1 was used. We shall follow this time lag as the RR that reported is based on this time lag.
Mortality
3.3.11 Mortality has been unequivocally shown to be causally associated with air pollution. Mortalities caused by cardiovascular and respiratory diseases (including lung cancer) have been specifically linked to air pollution, the most common approach in the assessment of mortality is to use the CR function for ‘all-cause mortality’. This approach makes it much easier to interpret the HIA results than to separately present ‘cause-specific’ mortalities which is in line with the international practice.
3.3.12 In common with the morbidity assessment, the magnitude of the impact hinges on the difference between the baseline air pollutant concentrations and the targets to be achieved, which differ from the respective air pollution control strategies to be considered. The methods and formulae for assessing the mortality impact attributed by air pollution have been presented in Sections 3.3.1 to 3.3.4. The adopted RRs are shown as Table 4.
Table 4 Relative Risks for Air Pollutants and Their Respective Mortalities
Mortality (all-cause) Relative Risks per 10 g/m
3 (95% Confidence Level)
PM2.5
Annual mean / Daily mean NO2
Annual mean / Daily mean O3
Daily 8-hr maximum
Long-term exposure (Aged 30 and above)
1.06211
(1.040 – 1.0833) 1.039
12
(1.022 – 1.056) NA
Short-term exposure (All ages)
1.00409713
(1.001806-1.006394) 1.0103
7
(1.0069-1.0137) 1.0034
7
(1.0002-1.0066)
Mortality from Short-term Exposure to Air Pollutants
3.3.13 RRs of mortality from short-term exposure to air pollutants are one order of magnitude smaller than that from long-term exposure. The impact of long-term exposure to two air pollutants (where RRs are available): PM2.5 and NO2, have already included the mortality impact from short-term exposure to these pollutants. We shall estimate the mortality impact of short-term exposure to these two pollutants, but to avoid double counting, these numbers cannot and will not be added to the estimates from long-term exposure. We shall separately assess the mortality impact attributed to short-term exposure to O3. However, this estimation is additive to the total death toll (impact from long-term exposure) estimated for PM2.5 and NO2. We shall adopt the short-term RR for O3 from the WHO (HRAPIE Report, WHO, 2013 It is expected that the effect attributed to short-term exposure to O3 (probably less than 5% of the total attributable mortality) is well within the error margin of the estimates of the long-term impact by the other two air pollutants. The wide error margin can be explained by the 95% confidence
11 Hoek et al, 2013
12 WHO, 2013 (the overlapping effect on PM has been considered)
13 RR of all-cause, cardiovascular and respiratory mortality from Prof. Wilson Tam, 2016, unpublished data,
based on time series of PM2.5 on all-cause mortality, 2001-2010.
AECOM 8 June 2017

Agreement No. CE 15/2016(EP) Review of the Air Quality Objectives - Feasibility Study
Environmental Protection Department Methodology Paper for Health and Economic Impact Assessment
intervals of the RR for all the air pollutants. We shall also assess the mortality impact of short-term exposure to SO2 (as well as PM2.5 and NO2), but we shall not add up the effects of individual air pollutants, because the RRs in time series studies (e.g., PAPA study) are derived from single-pollutant models, hence considerable overlaps (e.g., between pollutants that are highly correlated to each other, e.g., NO2 with PM2.5 and SO2, but much less so with O3).
Mortality from Long-term Exposure to Air Pollutants
3.3.14 PM2.5 is the most important air pollutant in terms of mortality impact (Pope et al, 2002; WHO, 2006a). As mentioned above, there is considerable overlap between PM2.5 and NO2 effects, owing to their high correlations. This can be considered by adjusting the RR for NO2 (multiplied by 30%), and is a conservative estimate.
3.3.15 In the estimate of mortality impact, it would be assumed that the RRs for all ages are equal to the RR derived from adults aged 30 years and above, which introduces uncertainty but such uncertainty is likely to be small and is considered as a fair approximation.
3.3.16 Time lag is not a factor for consideration in the assessment mortality from long-term exposure. While the exact latency period between exposure and mortality is unknown, an equilibrium state is generally assumed whereby exposure is assumed to occur continuously, and mortality effect may occur years to decades later. In principle, the benefits of air pollution control is cumulative over time, but the HEIA offers a snapshot of the change in mortality risk on an annual basis, rather than provide an actuarial estimate of the health benefits accrued through time.
3.3.17 We shall use the all-cause mortality (excluding external causes) in 2015 as baseline health outcome data. The annual mean concentrations of PM2.5 and NO2 will be used as baseline air quality data for the assessment of their long-term impact.
3.4 Economic Impact Assessment (EIA)
3.4.1 Mortality is the single most important economic impact that arises from all the adverse health outcomes from air pollution, accounting for over 90% of the total cost. By contrast, direct costs attributable to air pollution related morbidities are small. This is one reason why in some HIA studies, mortality is the only health outcome considered. The EIA of air pollution varies according to the social and economic development of the country/jurisdiction concerned. For mortality estimates, the VOSL varies widely among countries of different socio-economic development, being much higher in developed countries than developing countries.
Mortality
3.4.2 When developing the Tool, references were made to different overseas sources for the VOSL to be adopted in Hong Kong, owing to the lack of relevant local data. Two values were used in the Tool: the VOSL recommended by the WHO European Region for its member countries (which vary in their per capita GDP) and the VOSL in China (Wang, 2010). Both values have been adjusted for the per capita GPD of Hong Kong, the former at US$2.87 million and the latter at US$1.17 million respectively. These estimates represented a range where the “true” VOSL in Hong Kong is likely to fall within.
3.4.3 Calculation of economic impact of mortality using VOSL is straightforward, by multiplying the VOSL by the number of attributable deaths estimated.
3.4.4 An alternative approach is the direct cost of mortality. This only takes into consideration the loss of productivity of the deceased. As mortality attributed to air pollution occurs predominantly among the elderly, this loss of productivity is comparatively small, as those aged 65 and above are considered to be economically inactive (and their death results in no loss of productivity).
3.4.5 We shall estimate both the total cost based on the two estimates of VOSL, as well as the ‘direct cost’ – that attributed to loss of productivity, using the methodology developed in the HEIA Tool Study.
Morbidity
AECOM 9 June 2017

Agreement No. CE 15/2016(EP) Review of the Air Quality Objectives - Feasibility Study
Environmental Protection Department Methodology Paper for Health and Economic Impact Assessment
3.4.6 The total cost of morbidity cannot be estimated without relevant local data from health economic studies. Hence, it was limited to the estimation of direct costs in the HEIA Tool Study. We shall follow this approach for the same reason. Calculation of direct health care cost is simple. First, all the costs – the cost for a hospital bed-day, the cost of a GOPC consultation and GP visit, and the associated productivity loss, are multiplied by the annual attributable numbers of hospitalizations and the average length of stay per patient, the annual number of GP and GOPC visits, using published economic data from the HA and C&SD respectively. A summation of all the costs will provide the EIA, for a given target air pollutant concentration to be achieved.
3.5 Recommended Adjustments to the HEIA Tool for the Study
3.5.1 The only change in the present approach that the HEIA tool has not been covered is the additional assessment of the mortality effects of short-term exposure to O3 using daily all-cause mortality and daily concentrations of O3 in 2015, to obtain the annualized number of premature deaths attributable to O3. To assess the effects of short-term exposure to O3 (as suggested by some members of the AS&H Sub-group), it is necessary to separately calculate the total number of premature all-cause mortalities attributable to O3 on a daily basis, on days in the year of assessment when the mean of the daily 8-hour maximum O3 concentration exceeds the AQO and WHO Air Quality Guideline (AQG), using the mortalities in the corresponding days as baseline. The mortalities attributed to O3 can then be added to the figures estimated for PM2.5 and NO2 that will be estimated using the Tool
3.5.2 The effects on morbidities attributed to air pollutants such as PM2.5, O3, and NO2, have already been included in the Tool. In addition, while the health impact of influenza and pneumonia are grouped under respiratory diseases, other specific respiratory diseases such as asthma and COPD will be separately assessed. All the data on air pollution, health outcomes and costs that are applicable to the year 2015 will be updated.
AECOM 10 June 2017

Agreement No. CE 15/2016(EP) Review of the Air Quality Objectives - Feasibility Study
Environmental Protection Department Methodology Paper for Health and Economic Impact Assessment
4 ASSUMPTIONS AND LIMITATIONS OF THE HIA AND EIA
4.1 Assumptions
4.1.1 There are several important assumptions in the HIA. First, the average ambient concentrations of air pollutants have been used as proxies of population exposure instead of a location-specific concentration. It has been shown in many studies that the majority of the population stay indoors (where the concentrations of PM2.5 and NO2 are typically lower than the ambient outdoor level). However, the CR functions (the RRs used for HIA) reported in major epidemiological studies have been derived using outdoor, ambient concentrations as proxies of exposure. Hence, it is scientifically valid to use outdoor, ambient air pollutant concentrations in HIA, without the theoretical problem of over-estimating the exposure. Another important assumption for HIA is that other risk factors for mortalities and cardio-pulmonary morbidities (e.g., the prevalence of cigarette smoking) do not change significantly over a relative short time span (less than 5 years). Over a longer time span (10 years or longer), results of HIA might be affected by long-term time trends (often called “secular changes”) in risk factors of diseases and mortality. Uncertainties in the assessment results will rise accordingly. In the HIA Report of the HEIA Tool Study, it has been assumed that the RR of mortality for PM2.5 (derived from a population above the age of 30), at 1.06, also applies to those aged below 30. Strictly speaking, this extrapolation is epidemiologically invalid. If HIA is performed only for those aged 30 and above, the result will underestimate the risk in the entire community. However, since the annual total mortality among those aged below 30 is small, this under-estimation will be small and insignificant. On the other hand, the application of the same RR of all-cause mortality to this age group will result in an estimate more close to the ‘true value’, as the RR for this age group, while probably smaller than 1.06 (RR for the ‘30 and above’ age group), is unlikely to be one (i.e., no risk). Hence, we think that it is appropriate to maintain this assumption (that the same RR also applies to this younger age group).
4.1.2 Routine health statistics for local GP consultations in the private sector is also not comprehensive. The HIA on GP visits for upper respiratory infections are based on estimated annual total number of visits using different sources (e.g., reports published by the Food and Health Bureau (FHB), Department of Health (DH) and HA, papers on the pattern of illnesses among GP consultations from local journals, etc.). These estimates vary widely, and both the range and the mean values were presented in the HIA Report. We shall search the relevant data (including survey results from the general household surveys) and make an up-to-date estimate based on these data. The uncertainty margins will be wide. Data on attendances to GOPCs, on the other hand, have been regularly published by the HA. We shall obtain the latest available statistics on annual GOPC visits for the HIA.
4.1.3 The baseline health outcome data will be assumed to be constant from the base year to future years.
4.2 Uncertainties and Limitations of HEIA
4.2.1 As with all HIA and EIA, the HEIA of this Project is limited by the availability of certain health and economic data for the estimation of the risks and costs of specific diseases such as asthma and COPD. The choice of health outcomes is partly limited by insufficient epidemiological evidence of a cause-effect relationship, and partly by the wide variations in the RRs of some pollutant-disease pairs reported in different studies. Examples of health outcomes not assessed owing to the lack of data include the effect of air pollution on restricted physical activity and the duration of sickness absence from work after an episode of illness. The effect of air pollution on lung function has been well established. Despite the availability of local data on CR functions, we shall exclude it from the HIA because of the difficulty of equating a certain percentage loss of lung function with a definitive illness. Hence, any HIA on air pollution and health is likely to be a conservative estimate of the real impact. With the accumulation of evidence, more pollutant-disease pairs will be included in the HIA.
4.2.2 Another limitation in the estimate of the morbidity impact is the unavailability of data on emergency hospital admissions for cardiovascular and respiratory diseases into the private hospitals. This group comprises about 10% of the total number of hospital beds in Hong Kong. Moreover, not all private hospitals provide accident and emergency services. Hence,
AECOM 11 June 2017
Agreement No. CE 15/2016(EP) Review of the Air Quality Objectives - Feasibility Study
Environmental Protection Department Methodology Paper for Health and Economic Impact Assessment
the estimate of hospital admissions from air pollution in the HIA Report of the HEIA Tool Study is limited to public hospitals only. As hospital admissions data by diagnostic categories are not available from these hospitals, and the percentage contribution of private hospitals on the total number of emergency hospital admissions for cardiovascular and respiratory diseases cannot be quantified. Hence, an estimate of the total impact has not been made in the HEIA Study. Instead, the results for emergency hospital admissions attributed to air pollution should be interpreted to represent the health impact of the majority of the population that use public hospitals.
4.2.3 For air pollutants, the omission of the effects of toxic air pollutants (TAPs), specific organic and inorganic compounds that are monitored on a regular basis but with a more limited network of monitoring stations, also results in the under-estimation of the overall health risk. However, as the concentrations of these pollutants are low compared to the criteria air pollutants, their effects are considered insignificant.
4.2.4 All the results will be expressed as central estimates of a range, represented by the upper and lower bound of the 95% confidence interval. This represents the uncertainty that can be mathematically expressed from the epidemiological data. Other estimates of uncertainty on health outcomes are less precise, including the aforementioned uncertainties in the number of GP visits and the number of admissions (for cardiorespiratory diseases) into private hospitals. The VOSL is the single most important source of uncertainty in the EIA. Other processes in the Study, such as the impact of air pollution control measures from modelling also contribute to the overall uncertainty of HIA and EIA results. Quantifiable uncertainties will be expressed as a range, while those parameters not easily quantifiable will be presented as such and discussed.
AECOM 12 June 2017

Agreement No. CE 15/2016(EP) Review of the Air Quality Objectives - Feasibility Study
Environmental Protection Department Methodology Paper for Health and Economic Impact Assessment
5 DATA REQUIREMENTS
5.1 Data Acquisition
5.1.1 The measured air quality data of subject pollutants from EPD and the estimated concentration from the air quality modelling in this Study will be used to pair with the health outcomes in the HEIA.
5.1.2 The following is a list of data on mortality and hospital admissions that we have planned for EPD to acquire from C&SD and HA, respectively. Other health, economic and population data required for the HEIA, with the sources and estimated time required for acquisition of such data, are also listed.
(i) Mortality
a) Daily number of deaths from all-causes and from cardiovascular (ICD code I00 – I99) and respiratory diseases (ICD-10 code: J00 – J99), cerebrovascular diseases (ICD-10 code: I60 – I69.8), ischaemic heart disease (ICD-10 code: I20 – I25.9), chronic obstructive pulmonary disease (ICD-10 code: J41 – J44.9), asthma (ICD-10 code: J45 and J46), and lung cancer (ICD-10 code: C33 – C34.9), stratified by age groups: 0 – 4 years, 5 – 64 years, and 65 years and above, from 2011 to 2015.
b) Annual mean number of deaths by the above diagnostic categories by age group, as specified above, from 2011 to 2015.
Source: C&SD
Estimated time required for data acquisition: 4 months (the relevant data was acquired by EPD on 29 March 2017)
(ii) Hospital admissions
a) Daily numbers of hospital admissions through A&E Departments of all major hospitals equipped with A&E, for the following diagnostic categories / diagnoses:
Cardiovascular diseases as a group (ICD-9 code: 390 – 459);
Specific cardiovascular diseases: Cerebrovascular diseases (ICD-9 code: 430 – 438), ischaemic heart disease (ICD-9 code: 410 – 414);
Respiratory diseases as a group (ICD-9 code: 460 – 519);
Specific respiratory diseases: Chronic obstructive pulmonary disease (ICD-9 code: 490 – 496), chronic bronchitis and emphysema (ICD-code: 491 – 492), asthma (ICD-9 code: 493), and lung cancer (ICD-9 code: 162).
All statistics should be stratified by age groups: 0 – 4 years, 5 – 64 years, and 65 years and above, from 2011 to 2015.
b) Annual mean number of hospital admissions by the above diagnostic categories by age group, as specified above, from 2011 to 2015.
c) Mean length of stay in hospital (in days) for admissions in 2015 under the two broad diagnostic categories (cardiovascular and respiratory groups), and for specific diseases [specific cardiovascular diseases: cerebrovascular diseases (ICD-9 code: 430 – 438), ischaemic heart disease (ICD-9 code: 410 – 414); specific respiratory diseases: chronic obstructive pulmonary disease (ICD-9 code: 490 – 496), chronic bronchitis and emphysema (ICD-code: 491 – 492), asthma (ICD-9 code: 493), and lung cancer (ICD-9 code: 162)].
Source: HA
Estimated time required for data acquisition: 6 months
AECOM 13 June 2017

Agreement No. CE 15/2016(EP) Review of the Air Quality Objectives - Feasibility Study
Environmental Protection Department Methodology Paper for Health and Economic Impact Assessment
(iii) Annual General Out-patient Clinic attendances
Annual total number of attendances at General Out-patient Clinics, and total no. of attendances for upper respiratory infections (if available) run by HA, by clinic by district, for the past 5 years (2011 to 2015).
Source: HA
Estimated time required for data acquisition: 4 months
(iv) The most up-to-date daily hospital bed charges (non-subsidized) and daily A&E attendance charges (non-subsidized) published by HA
a) Data on no. of practising GPs in Hong Kong
Source: HA / Government Gazette
Estimated time required for data acquisition: 1 month
b) Data on the annual total no. of GP visits for upper respiratory tract infections in Hong Kong
Sources: FHB website, HA and DH reports, and ad hoc surveys by Hong Kong Medical Association (if conducted)
Estimated time required for data acquisition: 2 months
c) Estimated total no. of GP consultations
Source: General household surveys from reports by C&SD
Estimated time required for data acquisition: 2 months
(v) The most up-to-date data available for median income
Source: C&SD reports
Estimated time required for data acquisition: 1 month
(vi) Population statistics
The mid-year population of Hong Kong by age groups in 2015
Source: C&SD reports
Estimated time required for data acquisition: 1 month
AECOM 14 June 2017

6
Agreement No. CE 15/2016(EP) Review of the Air Quality Objectives - Feasibility Study
Environmental Protection Department Methodology Paper for Health and Economic Impact Assessment
REFERENCES
Committee on the Medical Effects of Air Pollution (COMEAP). The Mortality Effects of Long-Term Exposure to Particulate Air Pollution in the United Kingdom. A Report by the Committee on Medical Effects of Air Pollution. Health Protection Agency, United Kingdom, 2010.
Hoek G, Krishnan RM, Beelen R, Peters A, Ostro B, Brunekreef B and Kaufman JD. Long-term air pollution exposure and cardio-respiratory mortality: a review. Environmental Health 2013; 12:43
Ko FWS, Tam W, Chan DPS, Wong TW, Tung AH, Lai CKW, Hui DSC. Temporal relationship between air pollutants and hospital admissions for chronic obstructive pulmonary disease in Hong Kong. Thorax 2007; 62:779-784.
Ko FWS, Tam WS, Wong TW, Lai CKW, Wong GWK, Leung TF, Ng S, Hui DSC. Effects of air pollution on asthma hospitalization rates in different age groups in Hong Kong. Clinical and Experimental Allergy 2007; 37:1312-1319.
Künzli N, Kaiser R, Medina S, Studnicka M, Oberfeld G, Horak F. Health costs due to road traffic-related air pollution – an assessment project of Austria, France and Switzerland. Prepared for the Third Ministerial Conference for Environment and Health, London, 1999.
Lee JH, Röbbel N and Dora C. Cross-country analysis of the institutionalization of Health Impact Assessment. Social Determinants of Health. Discussion Paper Series 8 (Policy & Practice). Geneva, World Health Organization, 2013.
NSW Department of Environment and Conservation (DEC). Air Pollution Economics: Health costs of air pollution in the Greater Sydney Metropolitan Region, Sydney, 2005.
Pope CA, Burnett RT, Thun MJ, Calle EE, Krewski D, Ito K, Thurston GD. Lung cancer, cardiopulmonary mortality, and long-term exposure to fine particulate air pollution. Journal of the American Medical Association 2002; 287(9):1132-41.
Qiu H, Yu ITS, Wang XR, Tian LW, Tse LA, Wong TW. Differential Effects of Fine and Coarse Particles on Daily Emergency Cardiac Hospitalizations in Hong Kong. Atmospheric Environment 2013; 64:296-302
Tam WWS, Wong TW, Ng L, Wong SYS, Wong AHS. Association between air pollution and general outpatient clinic consultations for upper respiratory tract infection in Hong Kong. PLOS ONE 2014; 9(1) e86913:1-6.
US Environmental Protection Agency. The Benefits and Costs of the Clean Air Act 1990 to 2010. EPA Report to Congress, US Environmental Protection Agency, 1999.
Walton H, Dajnak D, Beevers S, Williams M, Watkiss P, Hunt A. Understanding the Health Impact of Air Pollution in London. King’s College, London, 2015.
Wang H, He J. The value of statistical life: a contingent investigation in China. Policy Research Working Paper 5421, Washington D C: World Bank, 2010.
Wong CM, Thach TQ, Chau PYK, Chan EKP, Chung RYN, Ou C-Q, Yang L, Peiris JSM, Thomas GN, Lam TH, Wong TW, Hedley AJ 2010. Part 4. Interaction between Air Pollution and Respiratory Viruses: Time Series Study of Daily Mortality and Hospital Admissions in Hong Kong. In: Public Health and Air Pollution in Asia (PAPA): Coordinated Studies of Short-Term Exposure to Air Pollution and Daily Mortality in Four Cities. HEI Research Report 154, Health Effects Institute, Boston, MA.
Wong TW, Tam W, Yu ITS, Wun YT, Wong AHS, Wong CM. Association between Air Pollution and General Practitioner Visits for Respiratory Diseases in Hong Kong. Thorax 2006; 61:585-591.
Wong TW, Tam WWS, Wong AHS, Liu S. Developing an instrument for assessing the health and economic impacts of air pollution in Hong Kong. Final Report, The Chinese University of Hong Kong, 2016.
World Health Organization (WHO). Air Quality Guidelines Global Update 2005. World Health Organization Regional Office for Europe, Copenhagen, 2006a.
AECOM 15 June 2017

Agreement No. CE 15/2016(EP) Review of the Air Quality Objectives - Feasibility Study
Environmental Protection Department Methodology Paper for Health and Economic Impact Assessment
World Health Organization (WHO). Air quality guidelines for particulate matter, ozone, nitrogen dioxide and sulfur dioxide – Global update 2005 – Summary of risk assessment. WHO, Geneva, 2006b.
World Health Organization (WHO). Health risks of air pollution in Europe – HRAPIE project. Recommendations for concentration-response functions for cost-benefit analysis of particulate matter, ozone and nitrogen dioxide, 2013. Accessed at:
http://www.euro.who.int/__data/assets/pdf_file/0006/238956/Health-risks-of-air-pollution-in-Eu rope-HRAPIE-project,-Recommendations-for-concentrationresponse-functions-for-costbenefit -analysis-of-particulate-matter,-ozone-and-nitrogen-dioxide.pdf
World Health Organization (WHO). WHO Expert Meeting: Methods and tools for assessing the health risk of air pollution at the local, national and international level. Meeting Report, Bonn Germany, 12-13 May 2014, WHO Regional Office for Europe, 2014.
WHO Regional Office for Europe, OECD. Economic cost of the health impact of air pollution in Europe: Clean air, health and wealth, Copenhagen: WHO Regional Office for Europe, 2015.
World Health Organization (WHO). Health risk assessment of air pollution – general principles. Copenhagen: WHO Regional Office for Europe, 2016.
AECOM 16 June 2017