air pollution - afed · arab environment in 10 years the global costs of air pollution:...
TRANSCRIPT
Prof. Farid B. Chaaban
AIR POLLUTION
ARAB ENVIRONMENT IN 10 YEARS
ARAB ENVIRONMENT IN 10 YEARS
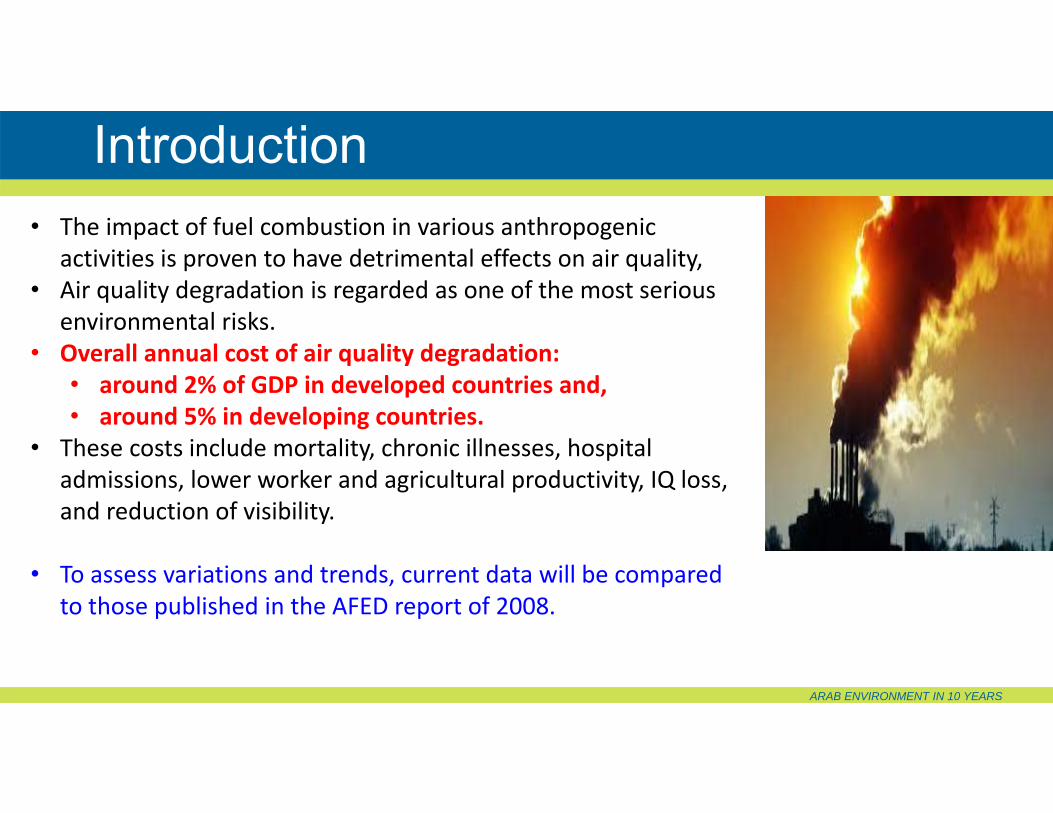
• The impact of fuel combustion in various anthropogenic activities is proven to have detrimental effects on air quality,
• Air quality degradation is regarded as one of the most serious environmental risks.
• Overall annual cost of air quality degradation: • around 2% of GDP in developed countries and,• around 5% in developing countries.
• These costs include mortality, chronic illnesses, hospital admissions, lower worker and agricultural productivity, IQ loss, and reduction of visibility.
• To assess variations and trends, current data will be compared to those published in the AFED report of 2008.
Introduction
ARAB ENVIRONMENT IN 10 YEARS

ARAB ENVIRONMENT IN 10 YEARS
The global costs of air pollution:• Premature deaths: USD 3 trillion in 2015 and projected to increase to USD 18‐25 trillion in 2060.
• Suffering and illnesses, including restricted activity and hospital admissions: USD 300 billion in 2015 and will increase to around USD 2.2 trillion in 2060.
• Hospital admissions: 3.6 million in 2010 and expected to increase to around 11 million in 2060.
Global View- Organization for Economic Co‐operation and Development (OECD),
ARAB ENVIRONMENT IN 10 YEARS
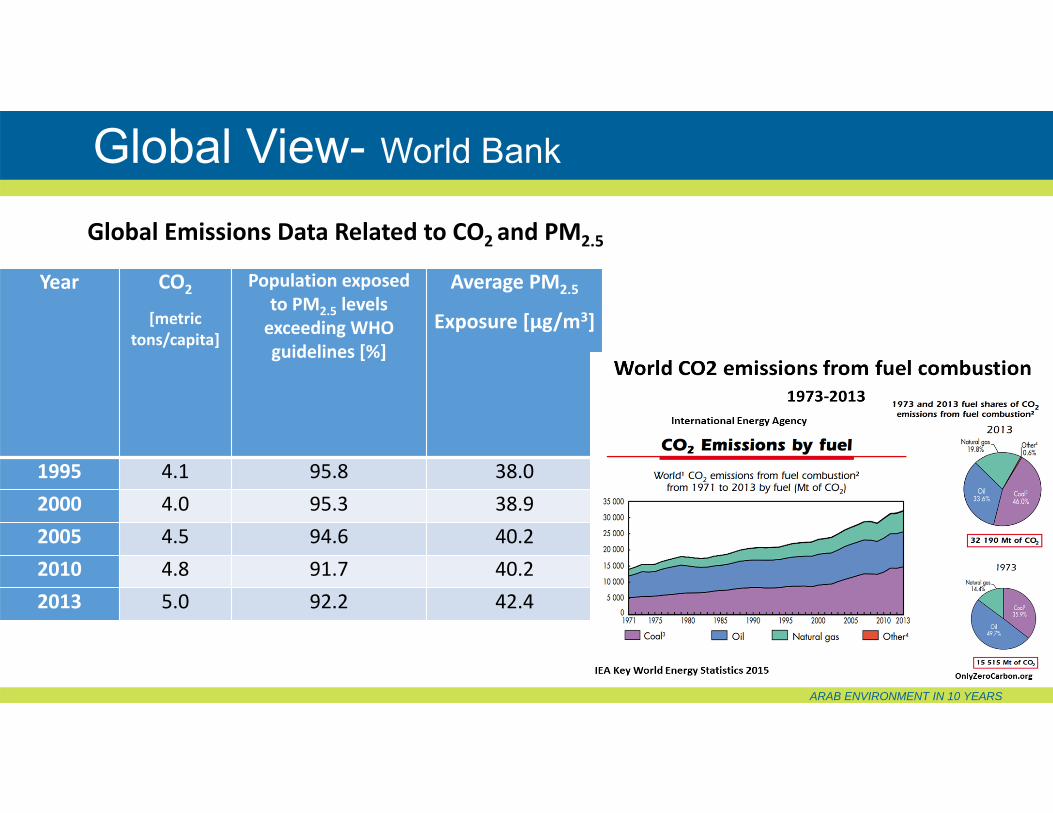
Global Emissions Data Related to CO2 and PM2.5
Global View- World Bank
Year CO2
[metric tons/capita]
Population exposed to PM2.5 levels exceeding WHO guidelines [%]
Average PM2.5
Exposure [µg/m3]
1995 4.1 95.8 38.02000 4.0 95.3 38.92005 4.5 94.6 40.22010 4.8 91.7 40.22013 5.0 92.2 42.4
ARAB ENVIRONMENT IN 10 YEARS
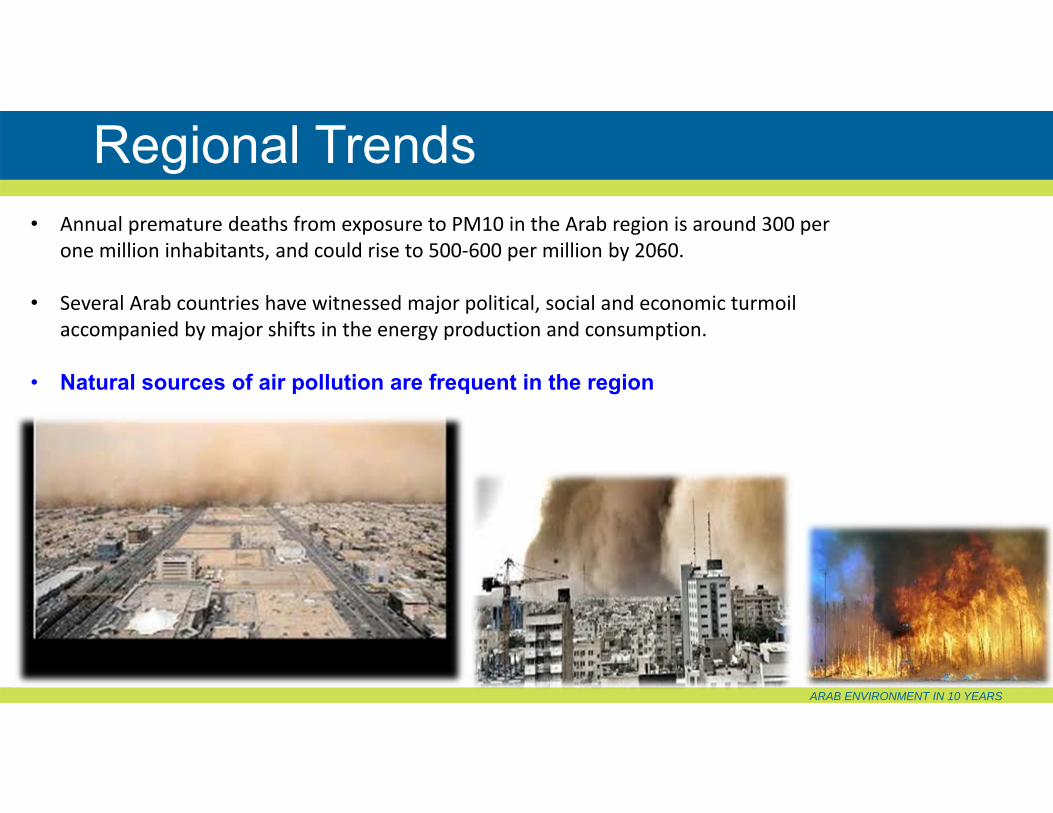
• Annual premature deaths from exposure to PM10 in the Arab region is around 300 per one million inhabitants, and could rise to 500‐600 per million by 2060.
• Several Arab countries have witnessed major political, social and economic turmoil accompanied by major shifts in the energy production and consumption.
• Natural sources of air pollution are frequent in the region
Regional Trends
ARAB ENVIRONMENT IN 10 YEARS
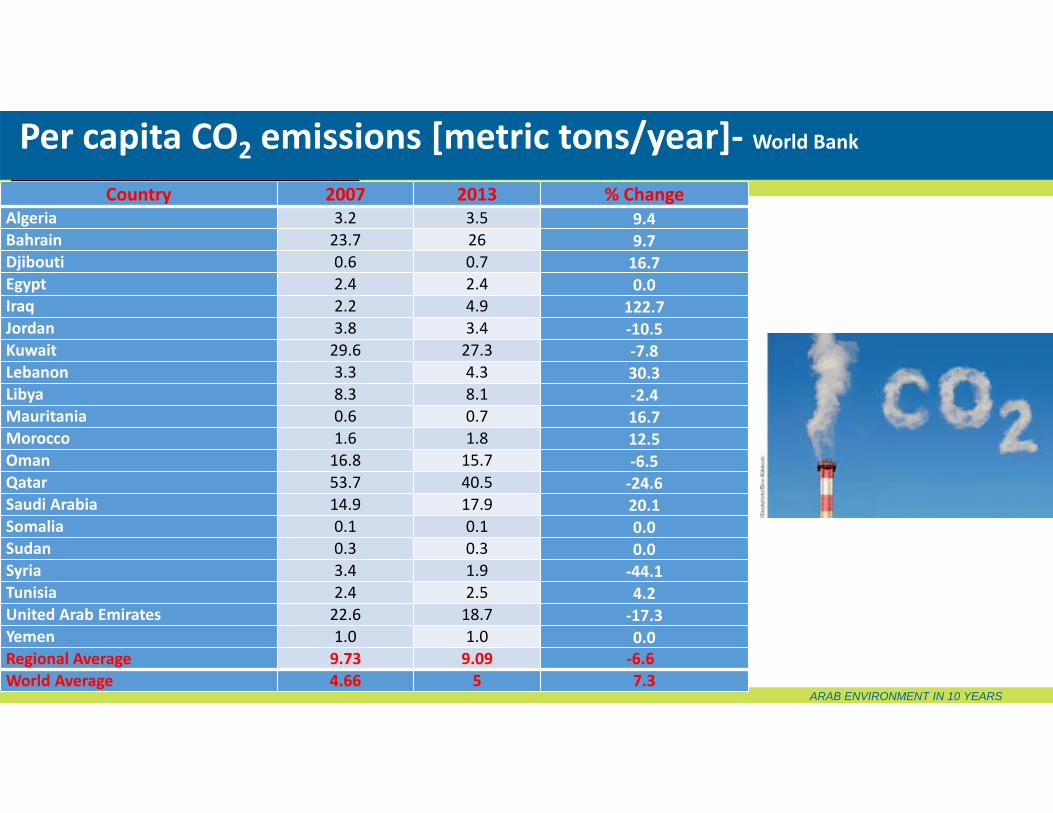
Per capita CO2 emissions [metric tons/year]‐ World Bank
Country 2007 2013 % ChangeAlgeria 3.2 3.5 9.4Bahrain 23.7 26 9.7Djibouti 0.6 0.7 16.7Egypt 2.4 2.4 0.0Iraq 2.2 4.9 122.7Jordan 3.8 3.4 ‐10.5Kuwait 29.6 27.3 ‐7.8Lebanon 3.3 4.3 30.3Libya 8.3 8.1 ‐2.4Mauritania 0.6 0.7 16.7Morocco 1.6 1.8 12.5Oman 16.8 15.7 ‐6.5Qatar 53.7 40.5 ‐24.6Saudi Arabia 14.9 17.9 20.1Somalia 0.1 0.1 0.0Sudan 0.3 0.3 0.0Syria 3.4 1.9 ‐44.1Tunisia 2.4 2.5 4.2United Arab Emirates 22.6 18.7 ‐17.3Yemen 1.0 1.0 0.0Regional Average 9.73 9.09 ‐6.6World Average 4.66 5 7.3
ARAB ENVIRONMENT IN 10 YEARS
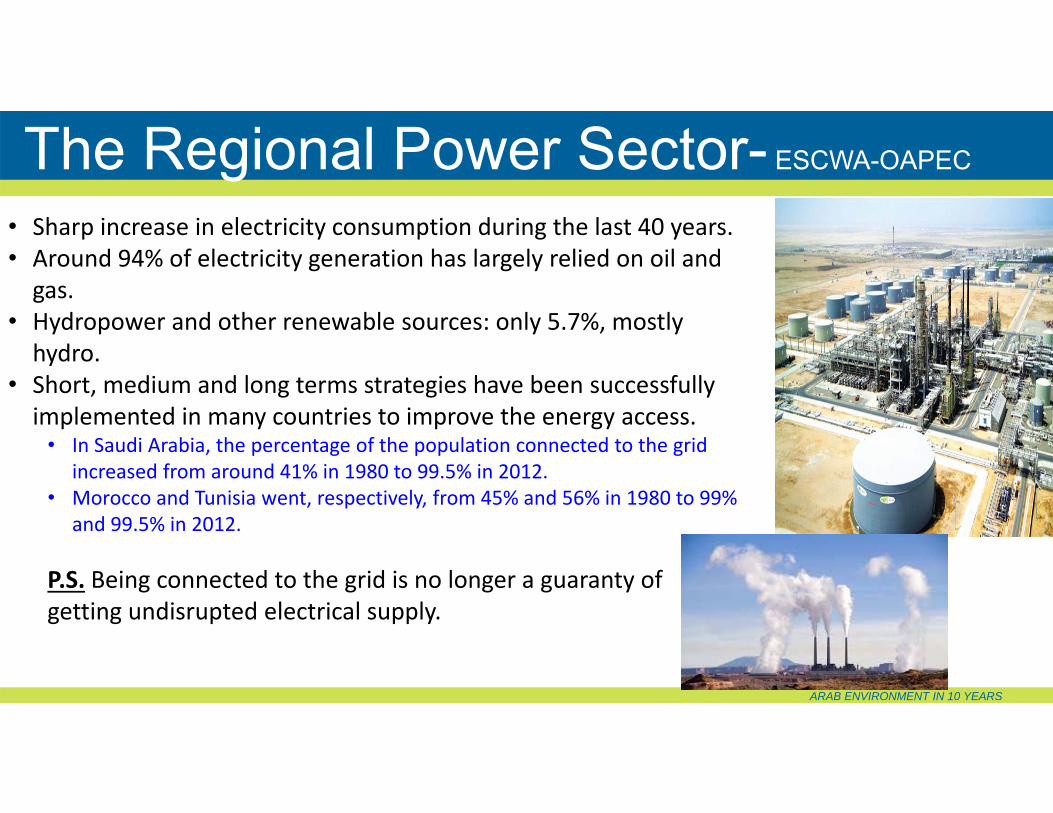
• Sharp increase in electricity consumption during the last 40 years.• Around 94% of electricity generation has largely relied on oil and gas.
• Hydropower and other renewable sources: only 5.7%, mostly hydro.
• Short, medium and long terms strategies have been successfully implemented in many countries to improve the energy access.
• In Saudi Arabia, the percentage of the population connected to the grid increased from around 41% in 1980 to 99.5% in 2012.
• Morocco and Tunisia went, respectively, from 45% and 56% in 1980 to 99% and 99.5% in 2012.
P.S. Being connected to the grid is no longer a guaranty of getting undisrupted electrical supply.
The Regional Power Sector- ESCWA-OAPEC
ARAB ENVIRONMENT IN 10 YEARS
•
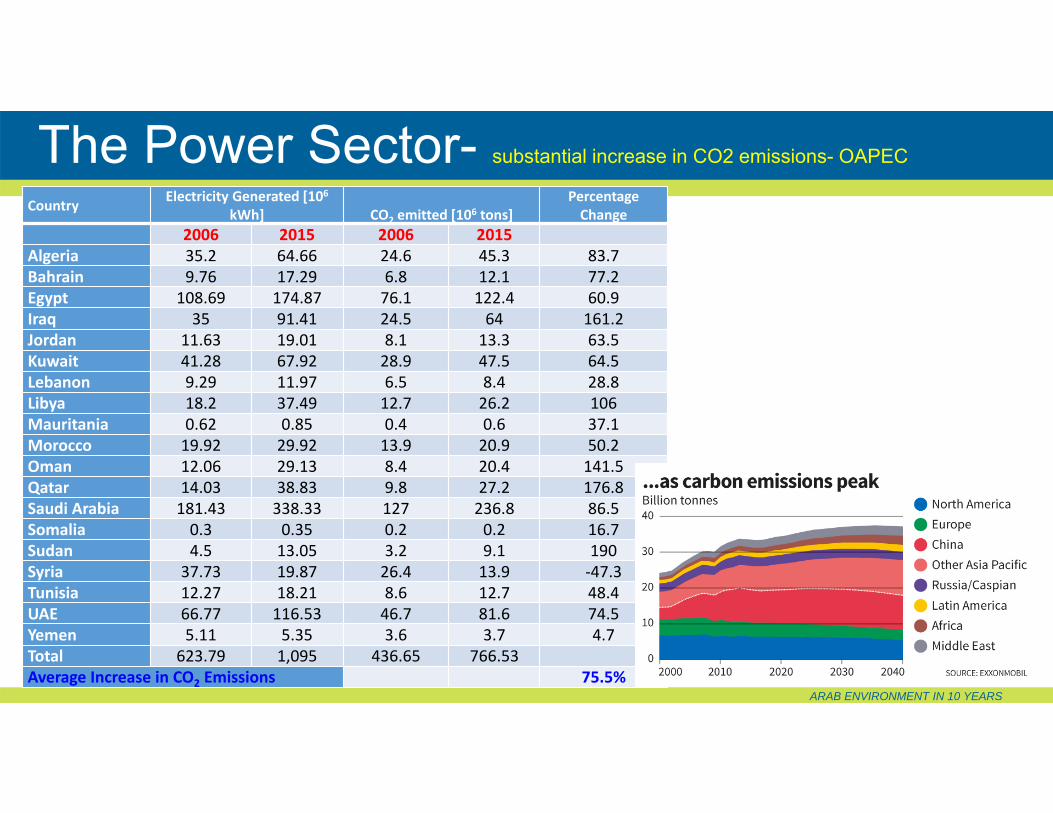
The Power Sector- substantial increase in CO2 emissions- OAPEC
Country Electricity Generated [106kWh] tons]610emitted [2CO
Percentage Change
2006 2015 2006 2015Algeria 35.2 64.66 24.6 45.3 83.7Bahrain 9.76 17.29 6.8 12.1 77.2Egypt 108.69 174.87 76.1 122.4 60.9Iraq 35 91.41 24.5 64 161.2Jordan 11.63 19.01 8.1 13.3 63.5Kuwait 41.28 67.92 28.9 47.5 64.5Lebanon 9.29 11.97 6.5 8.4 28.8Libya 18.2 37.49 12.7 26.2 106Mauritania 0.62 0.85 0.4 0.6 37.1Morocco 19.92 29.92 13.9 20.9 50.2Oman 12.06 29.13 8.4 20.4 141.5Qatar 14.03 38.83 9.8 27.2 176.8Saudi Arabia 181.43 338.33 127 236.8 86.5Somalia 0.3 0.35 0.2 0.2 16.7Sudan 4.5 13.05 3.2 9.1 190Syria 37.73 19.87 26.4 13.9 ‐47.3Tunisia 12.27 18.21 8.6 12.7 48.4UAE 66.77 116.53 46.7 81.6 74.5Yemen 5.11 5.35 3.6 3.7 4.7Total 623.79 1,095 436.65 766.53Average Increase in CO2 Emissions 75.5%
ARAB ENVIRONMENT IN 10 YEARS
• Impacts are more substantial compared to the power sector because they are emitted at ground level and in highly populated cities and provinces.
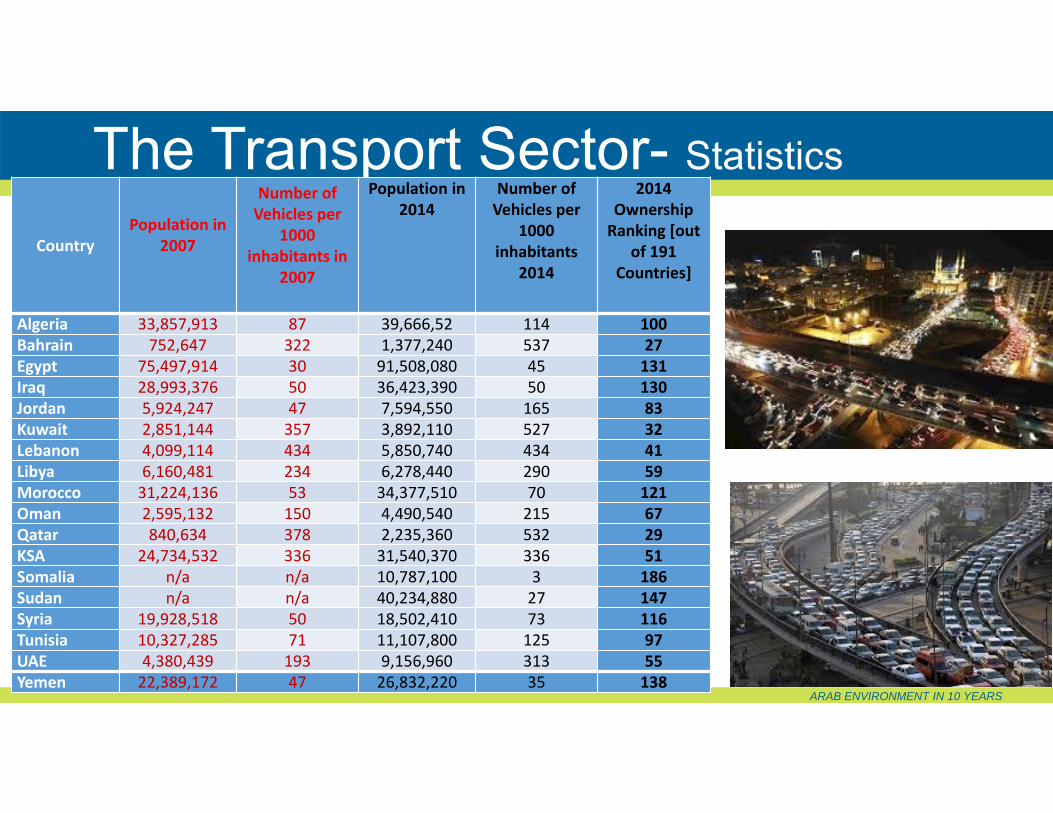
The Transport Sector- Statistics
CountryPopulation in
2007
Number of Vehicles per
1000 inhabitants in
2007
Population in 2014
Number of Vehicles per
1000 inhabitants
2014
2014 Ownership Ranking [out
of 191 Countries]
Algeria 33,857,913 87 39,666,52 114 100Bahrain 752,647 322 1,377,240 537 27Egypt 75,497,914 30 91,508,080 45 131Iraq 28,993,376 50 36,423,390 50 130Jordan 5,924,247 47 7,594,550 165 83Kuwait 2,851,144 357 3,892,110 527 32Lebanon 4,099,114 434 5,850,740 434 41Libya 6,160,481 234 6,278,440 290 59Morocco 31,224,136 53 34,377,510 70 121Oman 2,595,132 150 4,490,540 215 67Qatar 840,634 378 2,235,360 532 29KSA 24,734,532 336 31,540,370 336 51Somalia n/a n/a 10,787,100 3 186Sudan n/a n/a 40,234,880 27 147Syria 19,928,518 50 18,502,410 73 116Tunisia 10,327,285 71 11,107,800 125 97UAE 4,380,439 193 9,156,960 313 55Yemen 22,389,172 47 26,832,220 35 138
ARAB ENVIRONMENT IN 10 YEARS
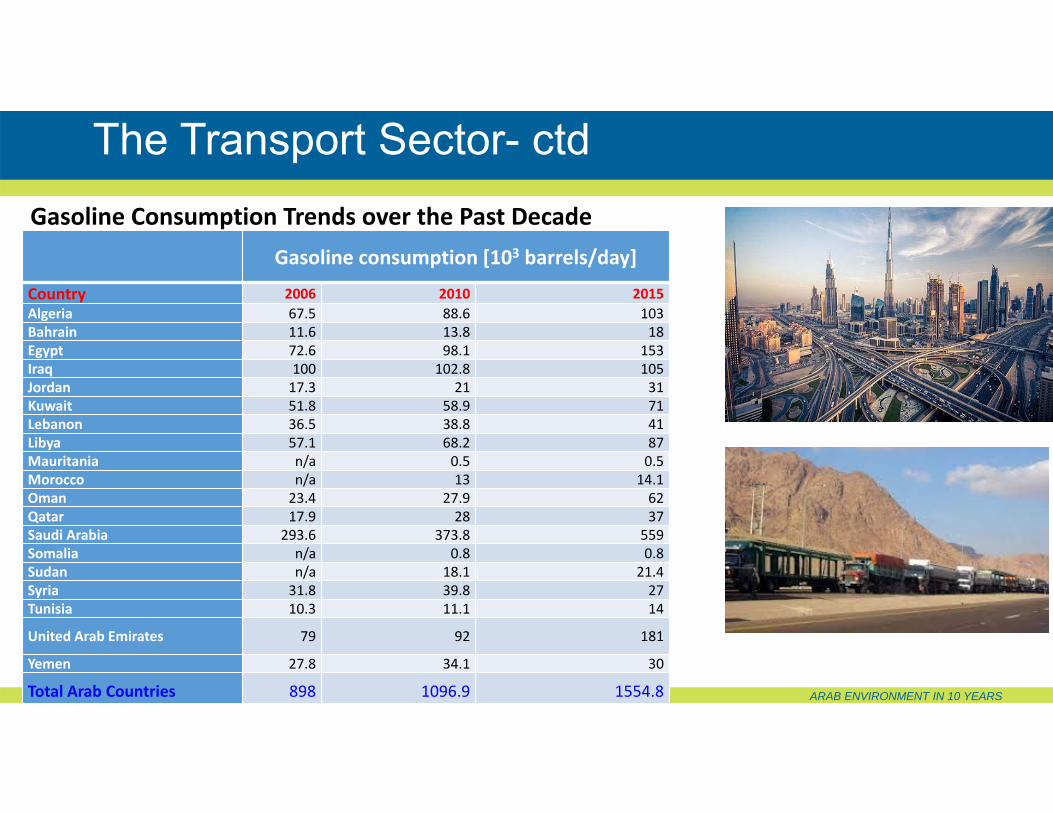
Gasoline Consumption Trends over the Past Decade
The Transport Sector- ctd
Gasoline consumption [103 barrels/day]
Country 2006 2010 2015Algeria 67.5 88.6 103Bahrain 11.6 13.8 18Egypt 72.6 98.1 153Iraq 100 102.8 105Jordan 17.3 21 31Kuwait 51.8 58.9 71Lebanon 36.5 38.8 41Libya 57.1 68.2 87Mauritania n/a 0.5 0.5Morocco n/a 13 14.1Oman 23.4 27.9 62Qatar 17.9 28 37Saudi Arabia 293.6 373.8 559Somalia n/a 0.8 0.8Sudan n/a 18.1 21.4Syria 31.8 39.8 27Tunisia 10.3 11.1 14
United Arab Emirates 79 92 181
Yemen 27.8 34.1 30
Total Arab Countries 898 1096.9 1554.8

ARAB ENVIRONMENT IN 10 YEARS
• Air pollution has globally risen by 8 percent in the past five years, (WHO),
• This will lead to around 3 million premature deaths a year. • Urban air quality data, collected between 2011 and 2015, reveals that
98% of cities with over 100,000 inhabitants in low‐ and middle‐income countries do not meet WHO air quality guidelines.
WHO Concentration Limits
Air Pollution Standards – WHO Guidelines
Pollutant PM10 PM2.5 Ozone NO2 SO2
Annual mean 20 10 4024‐ hour mean 50 25 20
8‐ hour mean 1001‐ hour mean 200
10‐minutemean
500
ARAB ENVIRONMENT IN 10 YEARS
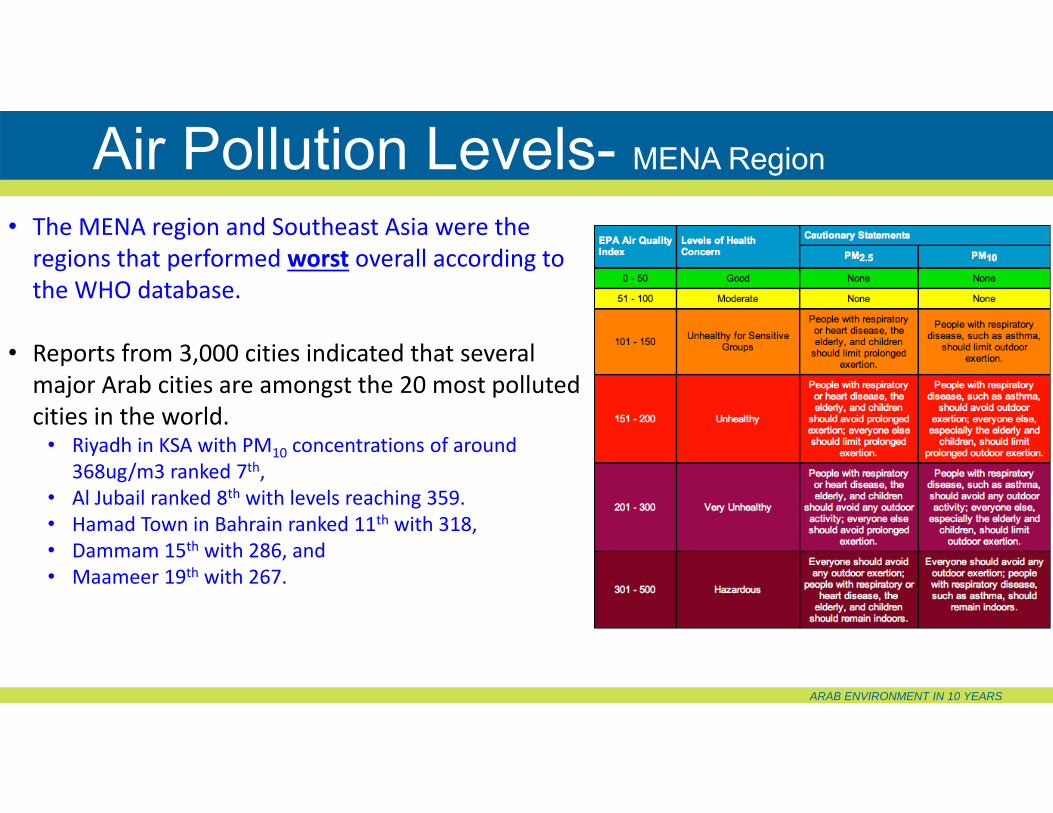
• The MENA region and Southeast Asia were the regions that performed worst overall according to the WHO database.
• Reports from 3,000 cities indicated that several major Arab cities are amongst the 20 most polluted cities in the world.
• Riyadh in KSA with PM10 concentrations of around 368ug/m3 ranked 7th,
• Al Jubail ranked 8th with levels reaching 359. • Hamad Town in Bahrain ranked 11th with 318, • Dammam 15th with 286, and • Maameer 19th with 267.
Air Pollution Levels- MENA Region
ARAB ENVIRONMENT IN 10 YEARS
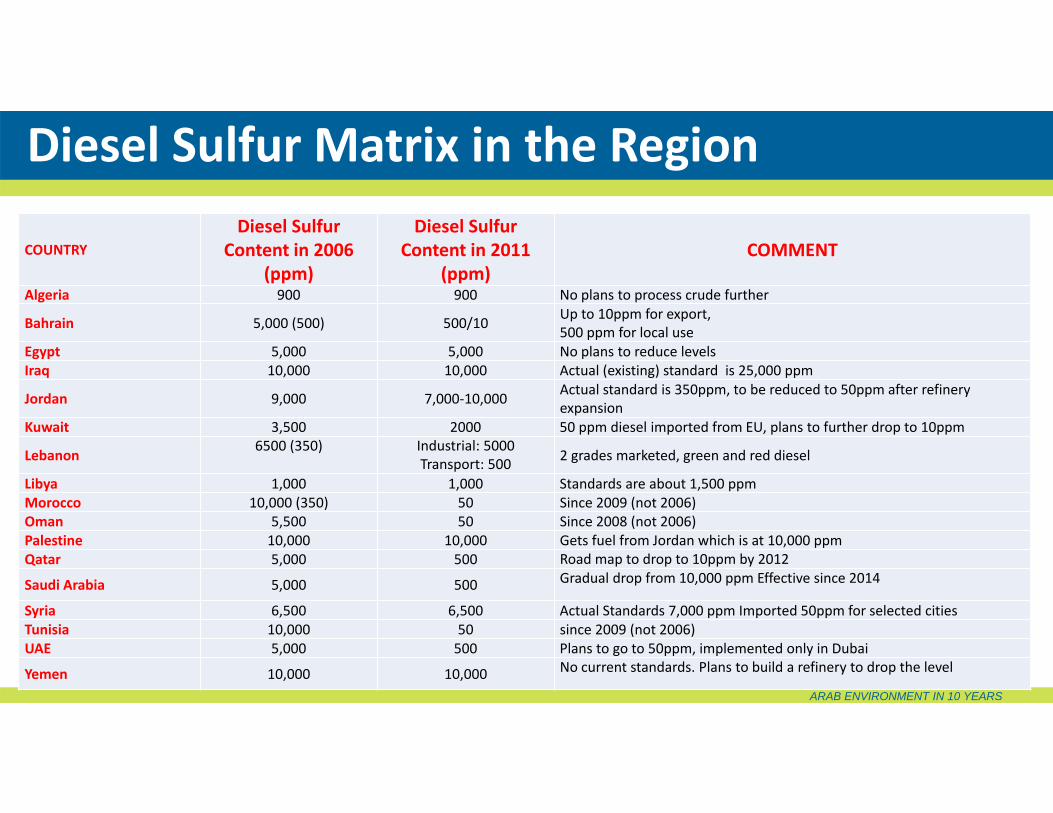
Diesel Sulfur Matrix in the Region
COUNTRYDiesel Sulfur
Content in 2006 (ppm)
Diesel Sulfur Content in 2011
(ppm)COMMENT
Algeria 900 900 No plans to process crude further
Bahrain 5,000 (500) 500/10 Up to 10ppm for export, 500 ppm for local use
Egypt 5,000 5,000 No plans to reduce levelsIraq 10,000 10,000 Actual (existing) standard is 25,000 ppm
Jordan 9,000 7,000‐10,000 Actual standard is 350ppm, to be reduced to 50ppm after refinery expansion
Kuwait 3,500 2000 50 ppm diesel imported from EU, plans to further drop to 10ppm
Lebanon6500 (350) Industrial: 5000
Transport: 500 2 grades marketed, green and red diesel
Libya 1,000 1,000 Standards are about 1,500 ppm Morocco 10,000 (350) 50 Since 2009 (not 2006)Oman 5,500 50 Since 2008 (not 2006)Palestine 10,000 10,000 Gets fuel from Jordan which is at 10,000 ppm Qatar 5,000 500 Road map to drop to 10ppm by 2012
Saudi Arabia 5,000 500 Gradual drop from 10,000 ppm Effective since 2014
Syria 6,500 6,500 Actual Standards 7,000 ppm Imported 50ppm for selected citiesTunisia 10,000 50 since 2009 (not 2006) UAE 5,000 500 Plans to go to 50ppm, implemented only in Dubai
Yemen 10,000 10,000 No current standards. Plans to build a refinery to drop the level

ARAB ENVIRONMENT IN 10 YEARS
• Researchers from Germany and KSA has found in 2015 that pollution levels over several major cities in the region are dropping due to economic and political unrest and war.
• Some cities have witnessed declines of 20 to 50%, due to legislation enforced to reduce pollution.
• The power sector condition drastically deteriorated and people opted for distributed small‐scale diesel generators to be used during the power cut‐off intervals.
Air Pollution Drop

ARAB ENVIRONMENT IN 10 YEARS
• A substantial decrease in NO2 concentrations was reported in Baghdad and central Iraq since 2013, and in Egypt during political unrest of 2011.
• In sharp contrast, the report found a 20‐30% increase in NO2 levels in Lebanon in 2014, which is linked to over 1.5 million Syrian refugees that have moved into the country.
• Drops in pollution levels in other parts of the region, such as KSA, Kuwait and the UAE, are attributed to the introduction of air quality control systems and devices.
• The Middle East air pollution control equipment market was around USD 103.4 million in 2009 reached around USD 155 million by 2014.
Air Pollution Drop- ctd

ARAB ENVIRONMENT IN 10 YEARS
• Considerable potential for renewable energy technologies, stimulated by the rapid drop in their prices, mainly of PV cells.
• Most regional countries including Egypt, Jordan, Lebanon, Mauritania, Morocco, and the UAE are developing a viable market for RE investments.
• Between 2012 and 2015, total renewable installed capacity witnessed a 150% increase, exceeding 3GW, excluding hydropower, compared to 1.2GW in 2012.
• In 2015, renewable power production (including hydropower) contributed to around 6% of the total generation capacity.
Mitigation Options- The Power Sector

ARAB ENVIRONMENT IN 10 YEARS
• Most sustainable transportation strategies fall into one of three categories:
• Vehicle technology changes,• Fuel quality, • Roads managements. (driving modes)
• The implementation of fuel standards and vehicle inspection measures can be found in most Arab nations, though they are not strictly implemented.
• The implementation of effective mass transport systems can only be found in countries such as Egypt, Algeria, Tunisia, and the UAE.
Mitigation Options- The Transport Sector
ARAB ENVIRONMENT IN 10 YEARS
Two contradicting trends:
1‐ On one side, mitigation measures such as adopting cleaner fuels for transport and integrating renewable and cleaner fuels technologies in the power sector have led to a drop in emissions from these sectors.
2‐ On the other hand, the demographic and economic growth witnessed in most countries has led to an increase in demand for power and motor vehicles.
There is an overall increase in fuel combustion and hence GHG emissions in most countries.
Conclusions- Recommendations

ARAB ENVIRONMENT IN 10 YEARS
• In the Power Sector: Renewable Energy technologies for power generation
at a much wider scale is very promising. Energy Efficiency is also very viable option.
• In the Transport Sector: 3 categories: Vehicle technology. Fuel quality. Driving modes.
• Viable options include hybrid vehicles and modernmass transport.
Conclusions- Recommendations

Thank You
ARAB ENVIRONMENT IN 10 YEARS