air cargo economics - massachusetts institute of technology
TRANSCRIPT
MIT ICATMIT ICAT
Air Cargo Economics
Prof. John-Paul Clarke
16.886Air Transportation Systems Architecting
February 24, 2004
MIT ICATMIT ICAT Lecture Outline
• Air Cargo Industry– Types of air cargo and air cargo carriers– Largest air cargo carriers
• Demand for Air Cargo Services– Drivers of air cargo growth– Constraints on growth
• Recent Trends in Air Cargo– Traffic and tariffs– Industry structure– Impacts of recent recession and 9/11
• Breakdown of Cargo Revenue and Cost
MIT ICATMIT ICAT Air Cargo Industry
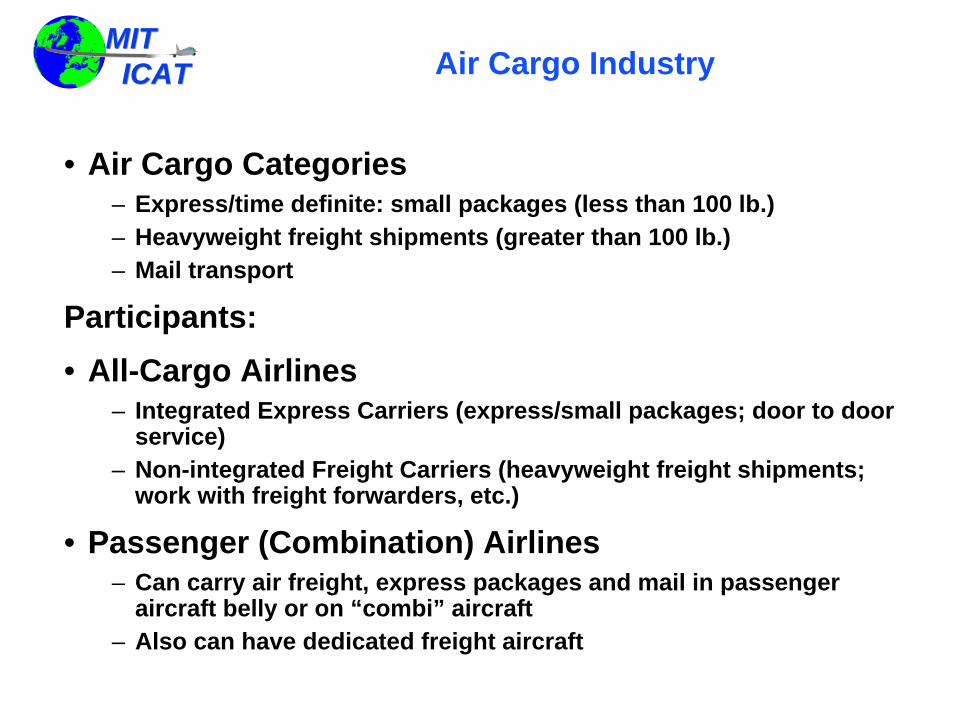
• Air Cargo Categories– Express/time definite: small packages (less than 100 lb.)– Heavyweight freight shipments (greater than 100 lb.)– Mail transport
Participants:• All-Cargo Airlines
– Integrated Express Carriers (express/small packages; door to door service)
– Non-integrated Freight Carriers (heavyweight freight shipments; work with freight forwarders, etc.)
• Passenger (Combination) Airlines– Can carry air freight, express packages and mail in passenger
aircraft belly or on “combi” aircraft– Also can have dedicated freight aircraft
MIT ICATMIT ICAT
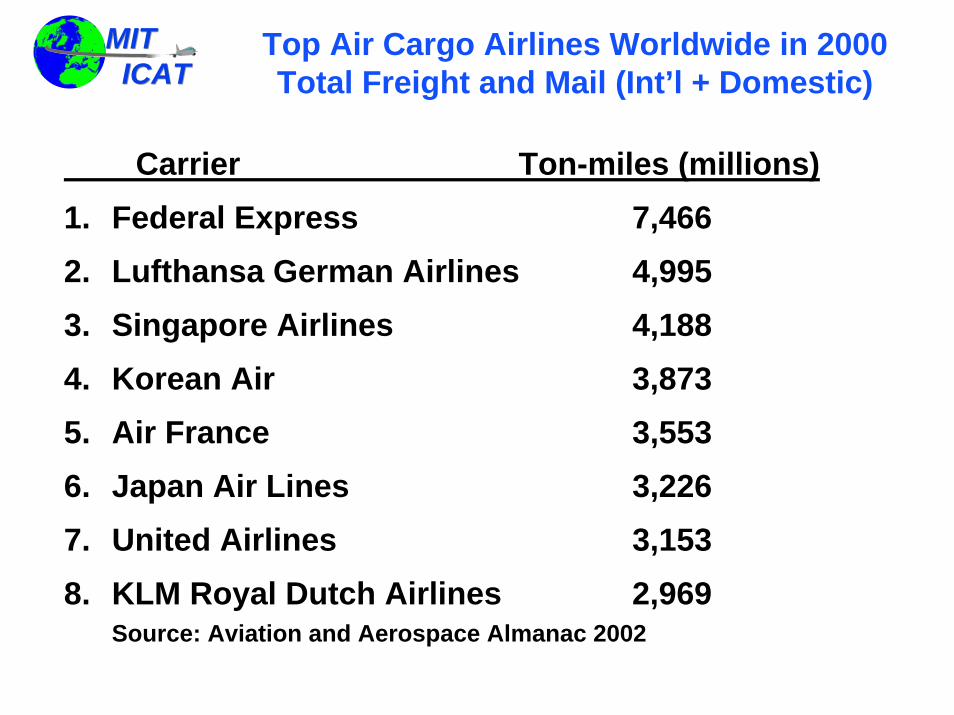
Top Air Cargo Airlines Worldwide in 2000 Total Freight and Mail (Int’l + Domestic)
Carrier Ton-miles (millions)1. Federal Express 7,4662. Lufthansa German Airlines 4,9953. Singapore Airlines 4,1884. Korean Air 3,8735. Air France 3,5536. Japan Air Lines 3,2267. United Airlines 3,1538. KLM Royal Dutch Airlines 2,969
Source: Aviation and Aerospace Almanac 2002
MIT ICATMIT ICAT
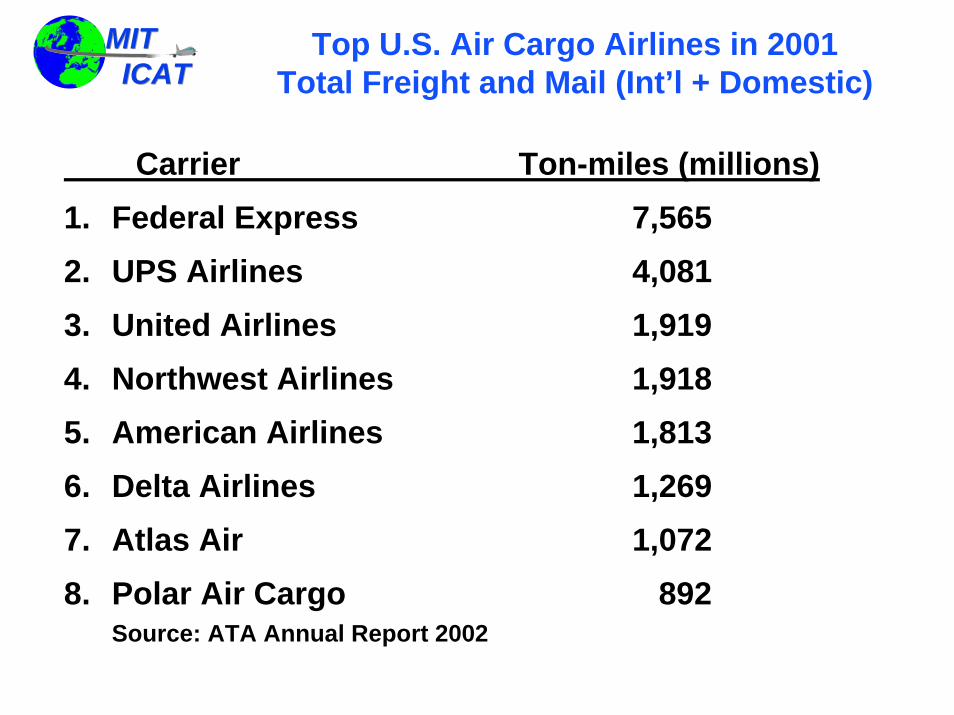
Top U.S. Air Cargo Airlines in 2001 Total Freight and Mail (Int’l + Domestic)
Carrier Ton-miles (millions)1. Federal Express 7,5652. UPS Airlines 4,0813. United Airlines 1,9194. Northwest Airlines 1,9185. American Airlines 1,8136. Delta Airlines 1,2697. Atlas Air 1,0728. Polar Air Cargo 892
Source: ATA Annual Report 2002
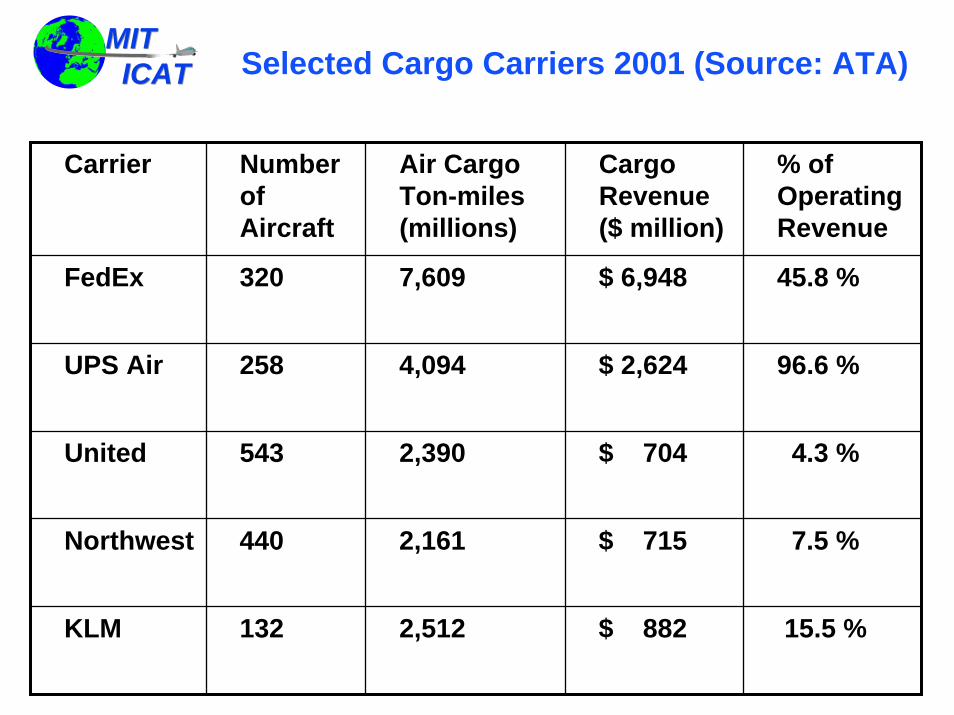
MIT ICATMIT ICAT Selected Cargo Carriers 2001 (Source: ATA)
Carrier Number of Aircraft
Air Cargo Ton-miles (millions)
Cargo Revenue ($ million)
% of Operating Revenue
FedEx 320 7,609 $ 6,948 45.8 %
UPS Air 258 4,094 $ 2,624 96.6 %
United 543 2,390 $ 704 4.3 %
Northwest 440 2,161 $ 715 7.5 %
KLM 132 2,512 $ 882 15.5 %
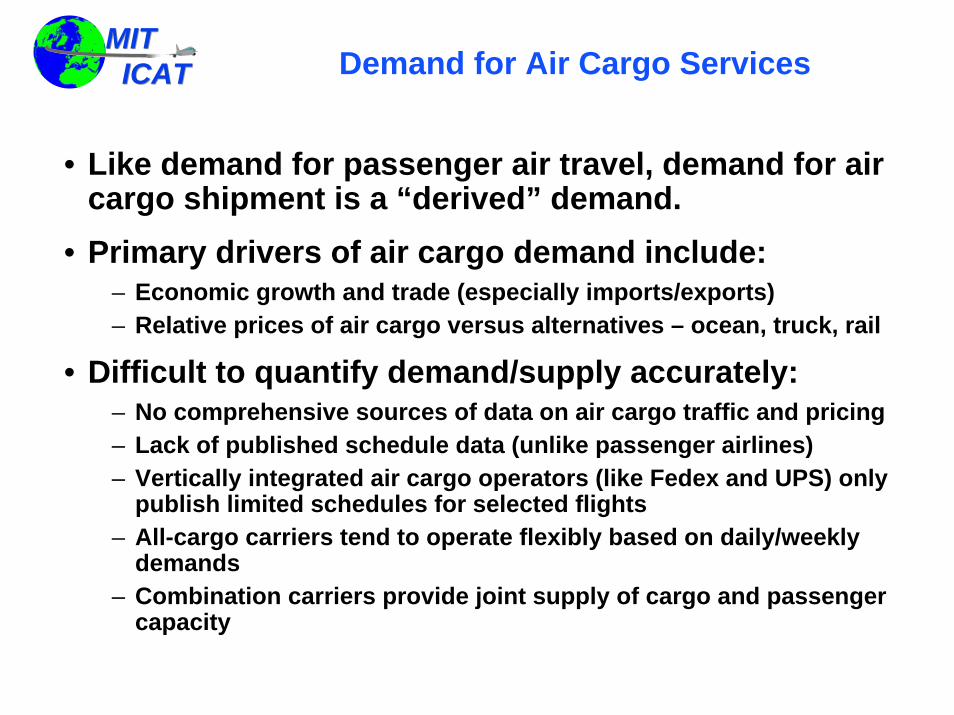
MIT ICATMIT ICAT Demand for Air Cargo Services
• Like demand for passenger air travel, demand for air cargo shipment is a “derived” demand.
• Primary drivers of air cargo demand include:– Economic growth and trade (especially imports/exports)– Relative prices of air cargo versus alternatives – ocean, truck, rail
• Difficult to quantify demand/supply accurately:– No comprehensive sources of data on air cargo traffic and pricing– Lack of published schedule data (unlike passenger airlines)– Vertically integrated air cargo operators (like Fedex and UPS) only
publish limited schedules for selected flights– All-cargo carriers tend to operate flexibly based on daily/weekly
demands– Combination carriers provide joint supply of cargo and passenger
capacity
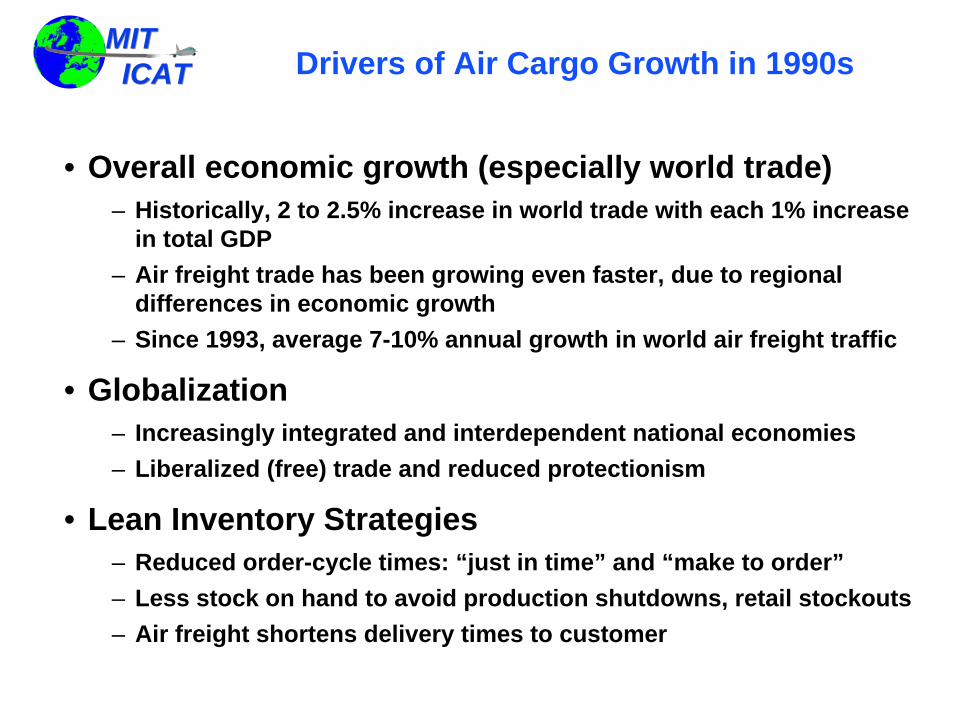
MIT ICATMIT ICAT Drivers of Air Cargo Growth in 1990s
• Overall economic growth (especially world trade)– Historically, 2 to 2.5% increase in world trade with each 1% increase
in total GDP– Air freight trade has been growing even faster, due to regional
differences in economic growth– Since 1993, average 7-10% annual growth in world air freight traffic
• Globalization– Increasingly integrated and interdependent national economies– Liberalized (free) trade and reduced protectionism
• Lean Inventory Strategies– Reduced order-cycle times: “just in time” and “make to order”– Less stock on hand to avoid production shutdowns, retail stockouts– Air freight shortens delivery times to customer

MIT ICATMIT ICAT Constraints on Air Cargo Growth
• Economic recession– Reduced production, demand for goods, international trade
• Trade barriers– Tariffs or protectionism designed to limit free trade
• Aircraft regulations– Air cargo operators have used older aircraft that are most affected
by new regulations on noise, emissions and safety– For example, noise hush-kits reduce cargo payloads
• Modal competition– Air freight has tremendous speed advantage for long distances, but
is highest-cost option– Trucks very competitive for short haul (1000 miles, overnight)– Development of new “fast ships” for ocean cargo
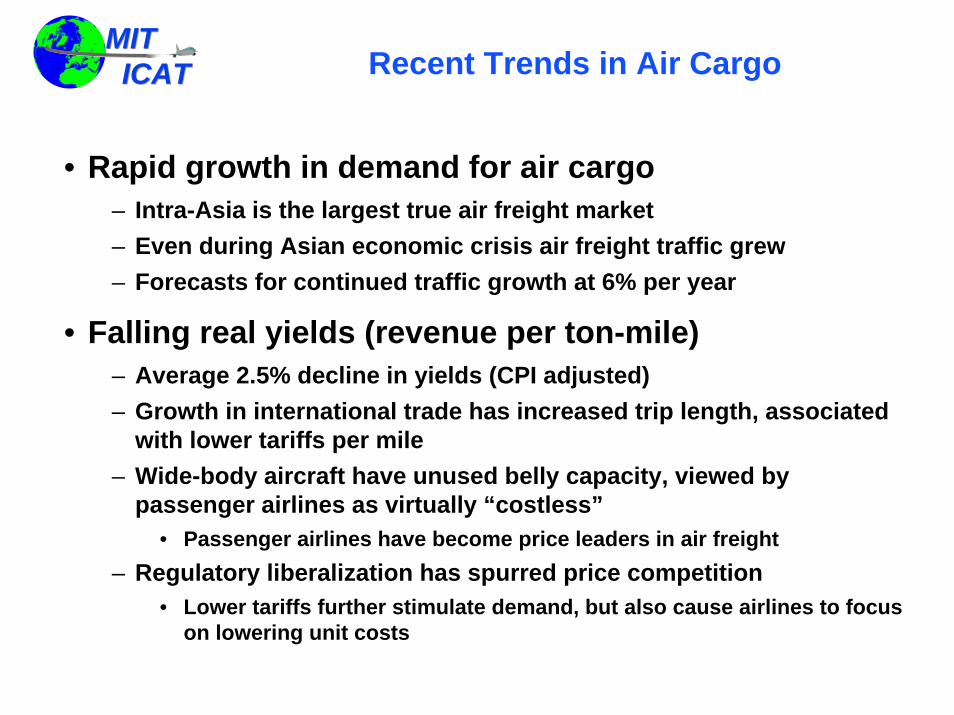
MIT ICATMIT ICAT Recent Trends in Air Cargo
• Rapid growth in demand for air cargo– Intra-Asia is the largest true air freight market– Even during Asian economic crisis air freight traffic grew– Forecasts for continued traffic growth at 6% per year
• Falling real yields (revenue per ton-mile)– Average 2.5% decline in yields (CPI adjusted)– Growth in international trade has increased trip length, associated
with lower tariffs per mile– Wide-body aircraft have unused belly capacity, viewed by
passenger airlines as virtually “costless”• Passenger airlines have become price leaders in air freight
– Regulatory liberalization has spurred price competition• Lower tariffs further stimulate demand, but also cause airlines to focus
on lowering unit costs
MIT ICATMIT ICAT Trends in Air Cargo (cont’d)
• Integrator expansion– Integrated express carriers own air and ground assets to handle
entire shipment journey– Fedex and UPS, facing competition and decreasing yields in
express documents, expanded to international markets– With limited international small package growth, carry standard air
freight (airport to airport) as “filler”– Trying to develop products for higher-yield industrial traffic
• Consolidation of freight forwarders– Non-integrated carriers receive majority of traffic from freight
forwarders – FFs handle retail marketing and pick-up/delivery– Number of mid-sized freight forwarders has been shrinking, leaving
largest operators and niche competitors

MIT ICATMIT ICAT Air Cargo Outlook (Source: Al Haggerty)
• Global AIRLINE PAX TRAFFIC forecast to grow @ 4.5% per year between 1999 and 2010
• Global AIR FREIGHT forecast to grow @ 6.0% per year between 1999 and 2010
• ASIA-PACIFIC REGION expected to dominate air freight market
• UNIT COSTS declined at an average annual rate of 3.0% between 1960 and 1999
• Larger, more efficient freighters are making air freight more competitive

MIT ICATMIT ICAT Operating Profit (Domestic Cargo Carriers)
Operating Profit Margin, Year 2000
-6
-4
-2
0
2
4
6
8
DHL Fedex UPS Passenger Majors
Ope
ratin
g P
rofit
Mar
gin
(%)

MIT ICATMIT ICAT Load Factors (Domestic Cargo Carriers)
Ton Load Factor for Scheduled Cargo Service
50
52
54
56
58
60
62
64
DHL Fedex UPS
Ton
Load
Fac
tor (
%)
MIT ICATMIT ICAT
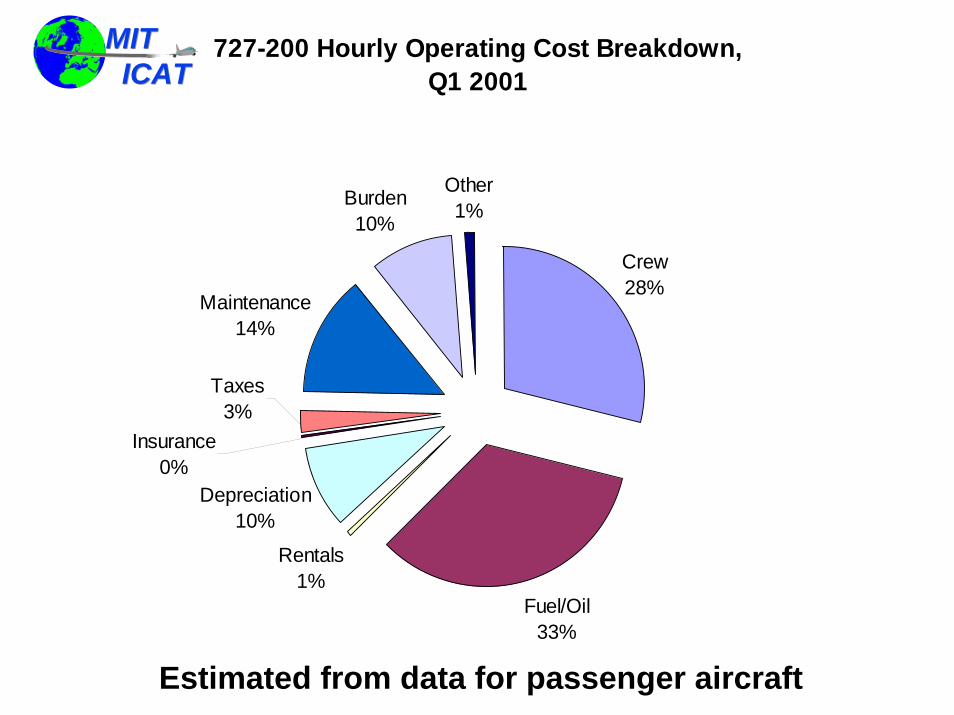
727-200 Hourly Operating Cost Breakdown,Q1 2001
Crew28%
Fuel/Oil33%
Rentals1%
Depreciation10%
Maintenance14%
Burden10%
Other1%
Taxes3%
Insurance0%
Estimated from data for passenger aircraft
MIT ICATMIT ICAT
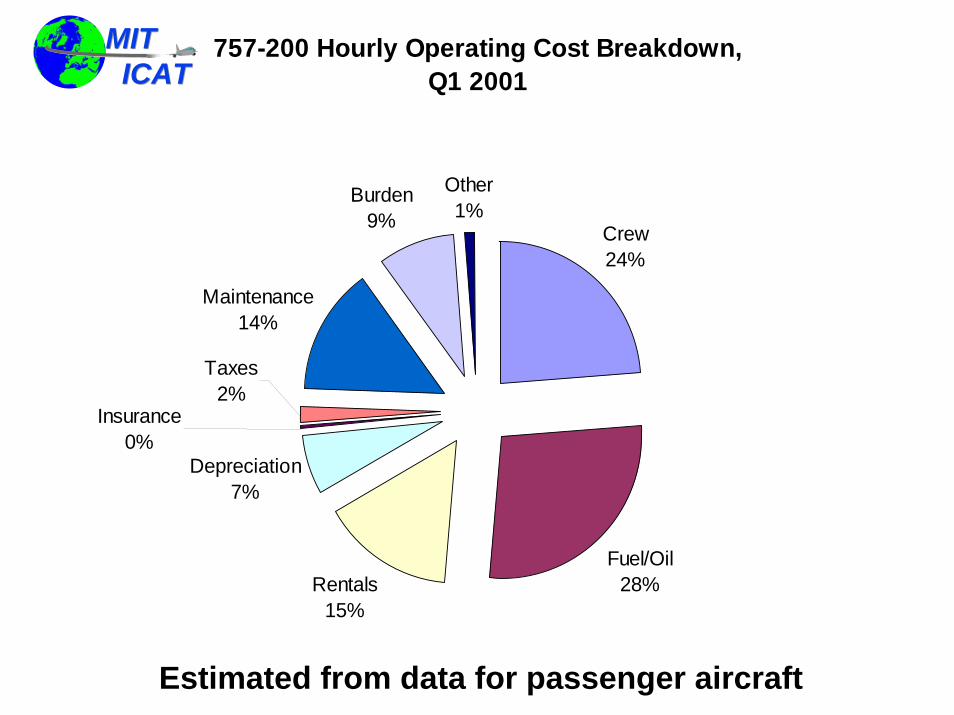
757-200 Hourly Operating Cost Breakdown,Q1 2001
Crew24%
Fuel/Oil28%Rentals
15%
Depreciation7%
Maintenance14%
Burden9%
Other1%
Taxes2%
Insurance0%
Estimated from data for passenger aircraft

MIT ICATMIT ICAT
767-200 Hourly Operating Cost Breakdown,Q1 2001
Crew26%
Fuel/Oil31%
Rentals3%
Depreciation7%
Maintenance18%
Burden10%
Other3%
Taxes2%
Insurance0%
Estimated from data for passenger aircraft

MIT ICATMIT ICAT
767-300 Hourly Operating Cost Breakdown,Q1 2001
Crew28%
Fuel/Oil34%
Rentals13%
Depreciation5%
Maintenance8%
Burden9%
Other1%
Insurance0%
Taxes2%
Estimated from data for passenger aircraft

MIT ICATMIT ICAT
DC-10-30 Hourly Operating Cost Breakdown,Q1 2001
Crew15%
Fuel/Oil34%
Rentals6%
Depreciation9%
Maintenance25%
Burden9%
Other1%
Insurance0%
Taxes1%
Estimated from data for passenger aircraft
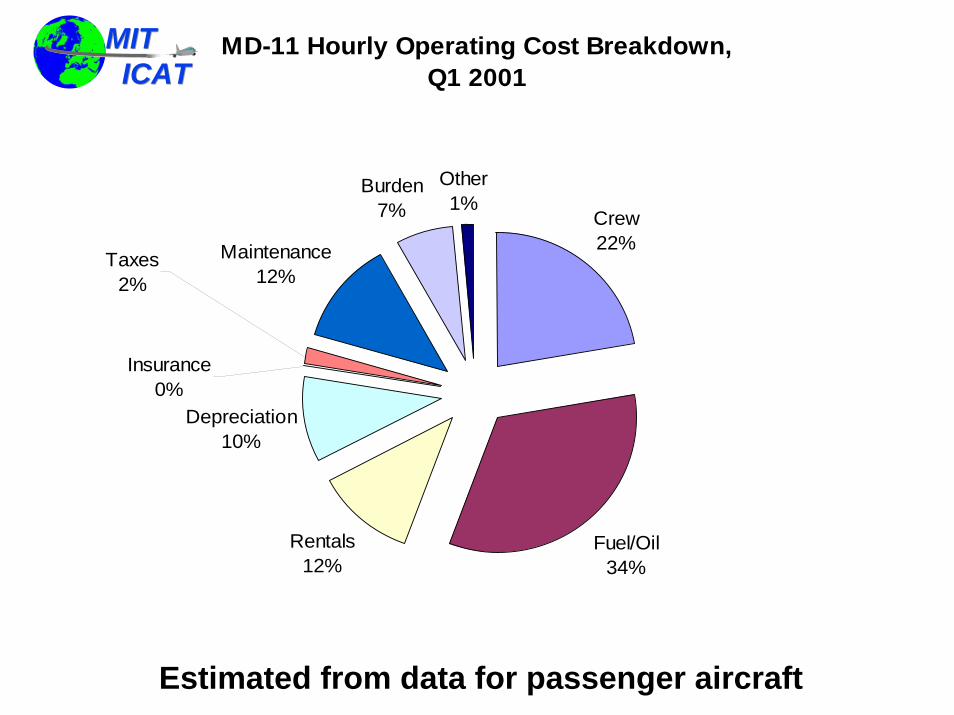
MIT ICATMIT ICAT
MD-11 Hourly Operating Cost Breakdown,Q1 2001
Crew22%
Fuel/Oil34%
Rentals12%
Depreciation10%
Maintenance12%
Burden7%
Other1%
Insurance0%
Taxes2%
Estimated from data for passenger aircraft

MIT ICATMIT ICAT
747-200 Hourly Operating Cost Breakdown,Q1 2001
Crew18%
Fuel/Oil34%
Rentals7%
Depreciation4%
Maintenance15%
Burden20%
Other1%
Insurance0%
Taxes1%
Estimated from data for passenger aircraft
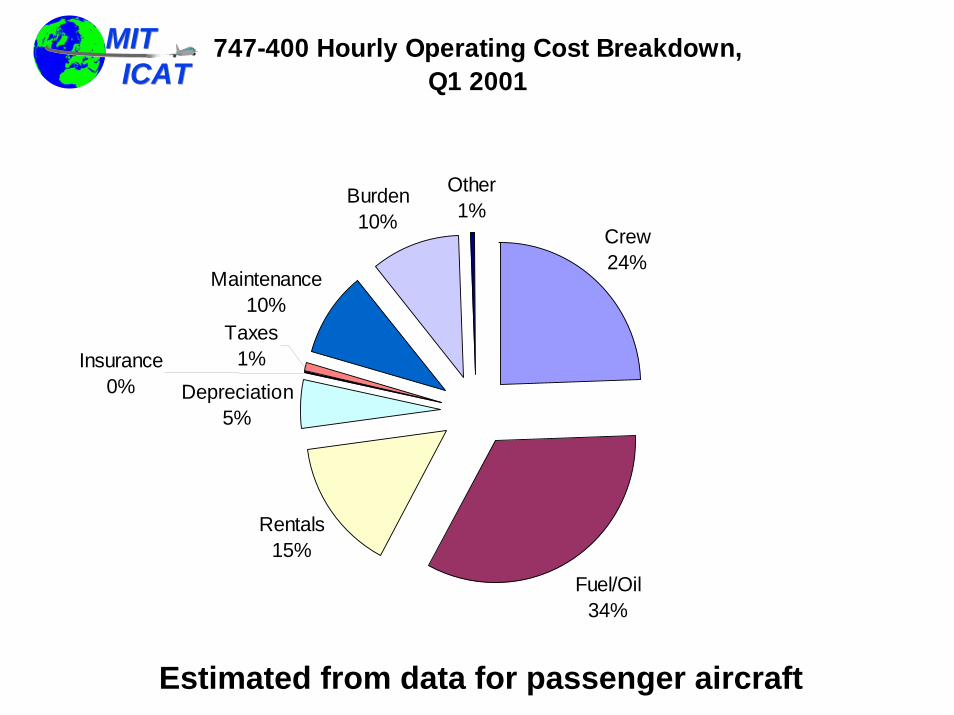
MIT ICATMIT ICAT
747-400 Hourly Operating Cost Breakdown,Q1 2001
Crew24%
Fuel/Oil34%
Rentals15%
Depreciation5%
Maintenance10%
Burden10%
Other1%
Taxes1%Insurance
0%
Estimated from data for passenger aircraft

MIT ICATMIT ICAT Number of Aircraft (Narrow Body)
• Payload less than 60,000 lbs– 727-100 215– 727-200 283– 737-200/300 35– Bae 146 25– DC-9 104
• Payload between 60,000 & 120,000 lbs (narrow body)– 707-320 55– 757-200 80– DC-8-50/60 103– DC-8-70 103
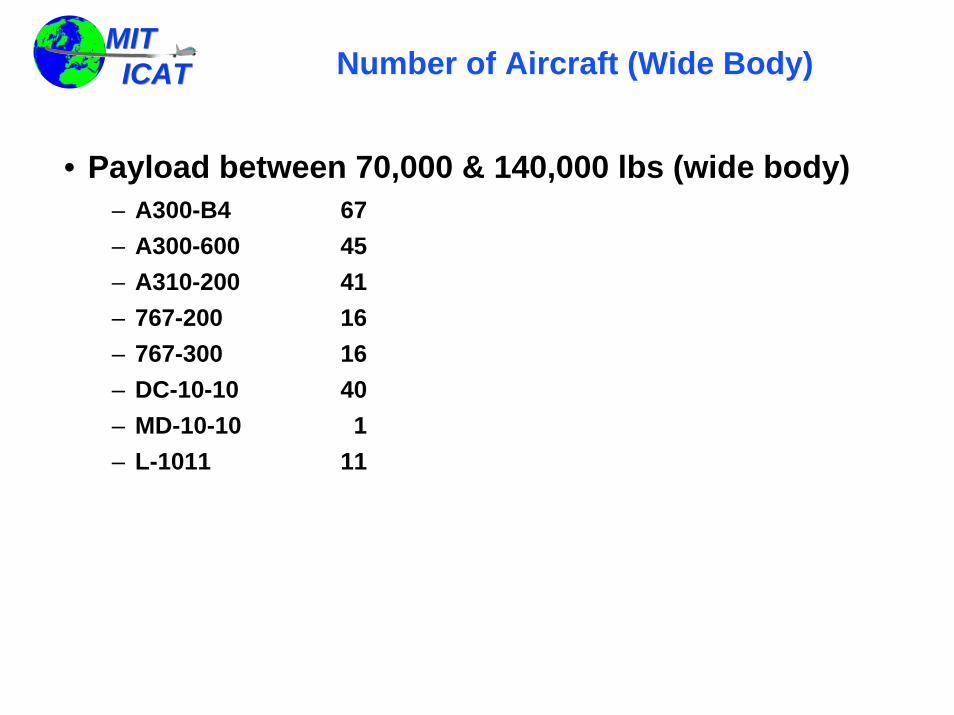
MIT ICATMIT ICAT Number of Aircraft (Wide Body)
• Payload between 70,000 & 140,000 lbs (wide body)– A300-B4 67– A300-600 45– A310-200 41– 767-200 16– 767-300 16– DC-10-10 40– MD-10-10 1– L-1011 11
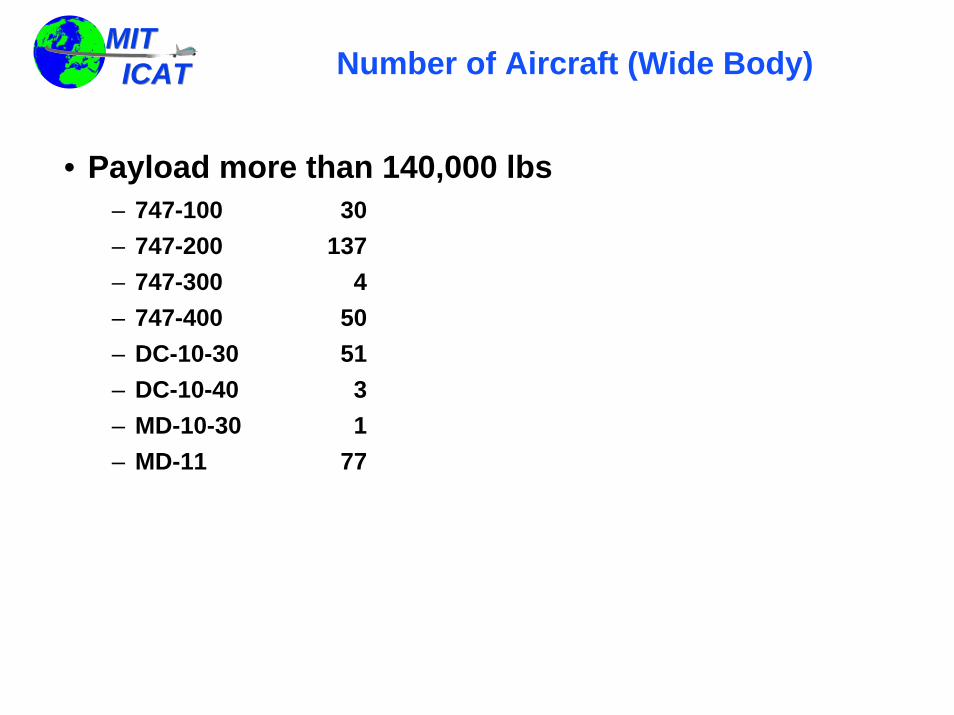
MIT ICATMIT ICAT Number of Aircraft (Wide Body)
• Payload more than 140,000 lbs– 747-100 30– 747-200 137– 747-300 4– 747-400 50– DC-10-30 51– DC-10-40 3– MD-10-30 1– MD-11 77
MIT ICATMIT ICAT Key Questions
• Where can an air cargo carrier reduce cost?
• If you could automate aircraft operations, which aircraft type would give you the best leverage?
• Is there any specific segment of the air cargo market that is primed for growth?
• How would you “grow” this market segment?