aim: what are station models?. i. station models - use symbols to represent weather conditions in...
TRANSCRIPT
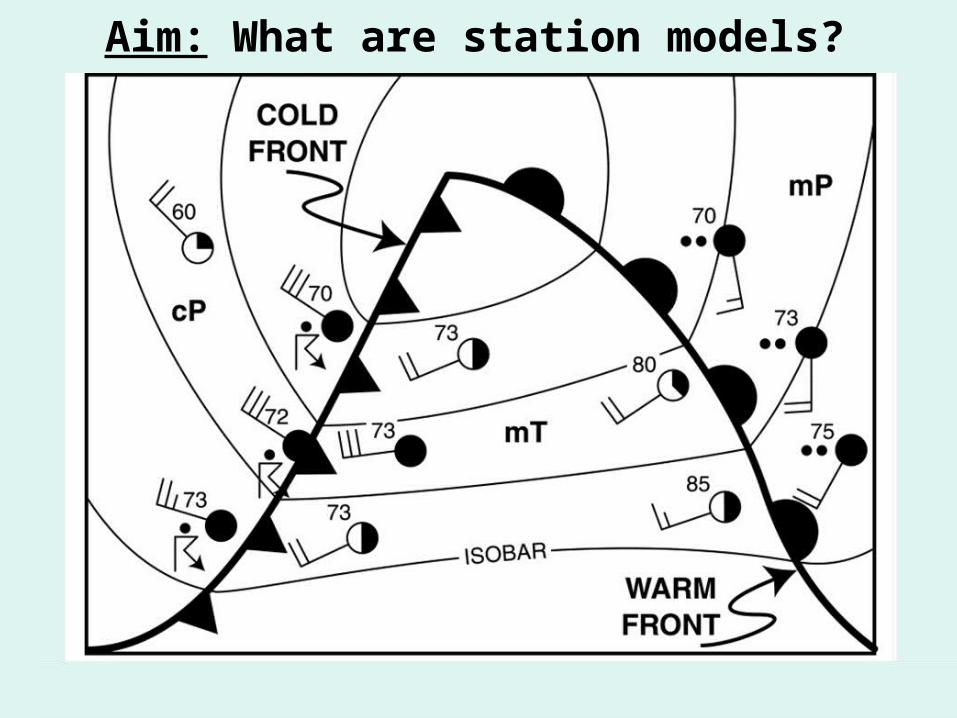
Aim: What are station models?
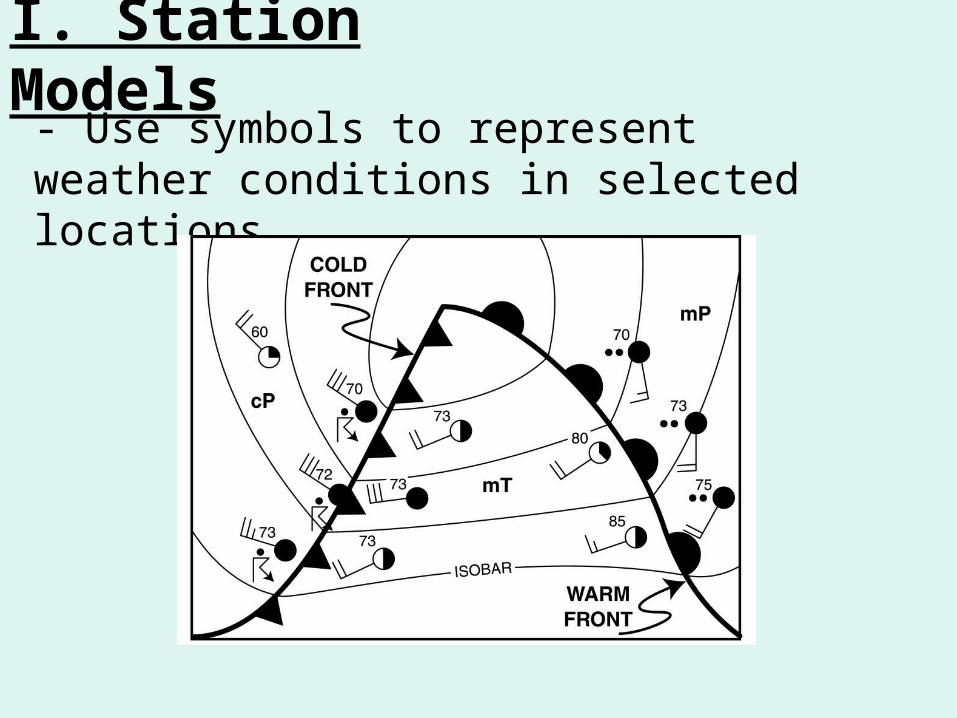
I. Station Models- Use symbols to represent weather conditions in selected locations.
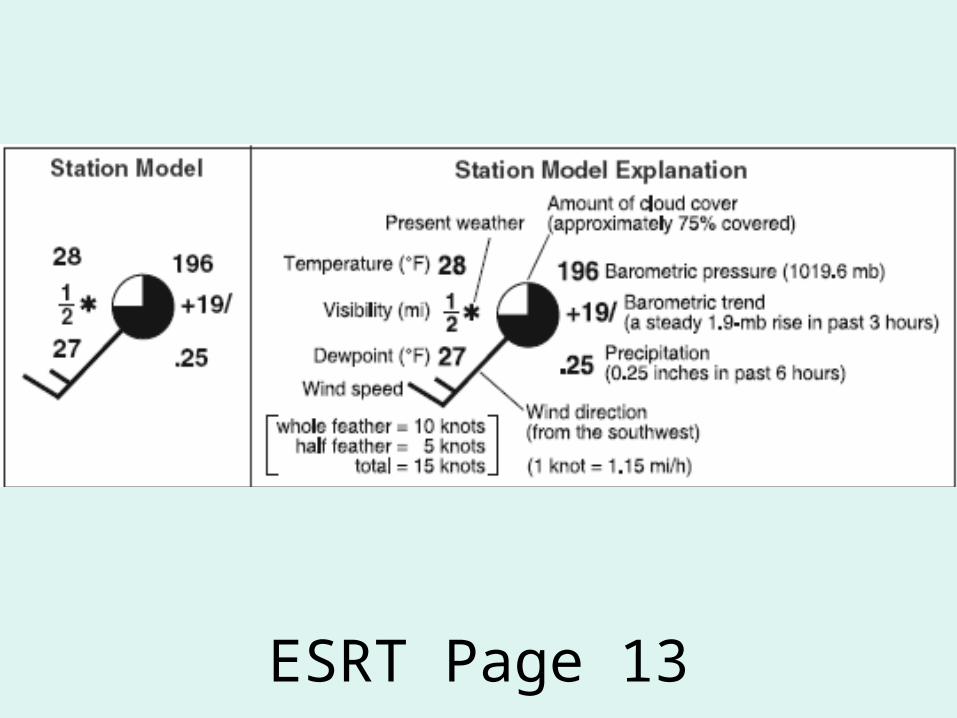
ESRT Page 13
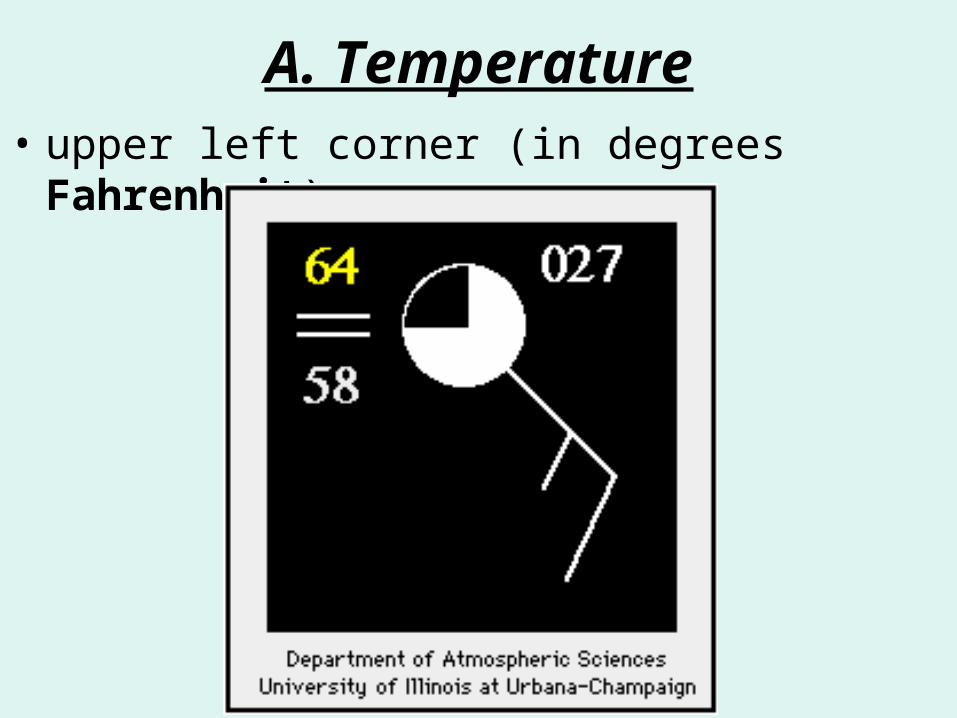
A. Temperature• upper left corner (in degrees
Fahrenheit).
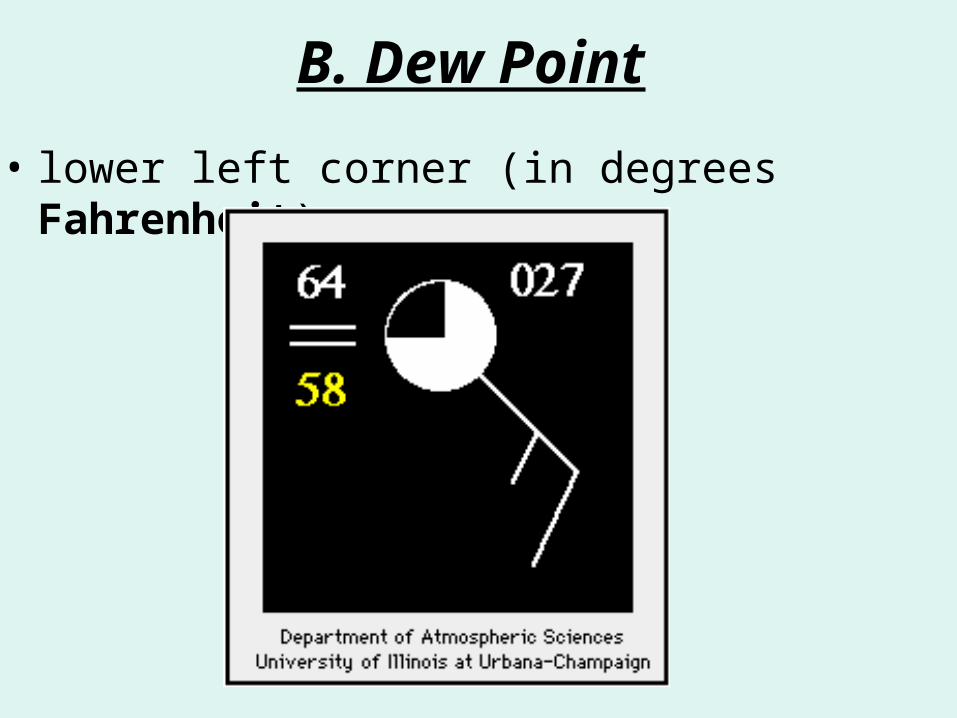
B. Dew Point
• lower left corner (in degrees Fahrenheit).

C. Wind Speed and Direction
• The stick that comes off the circle is the "Wind Barb and Feathers”, which indicates speed and direction.
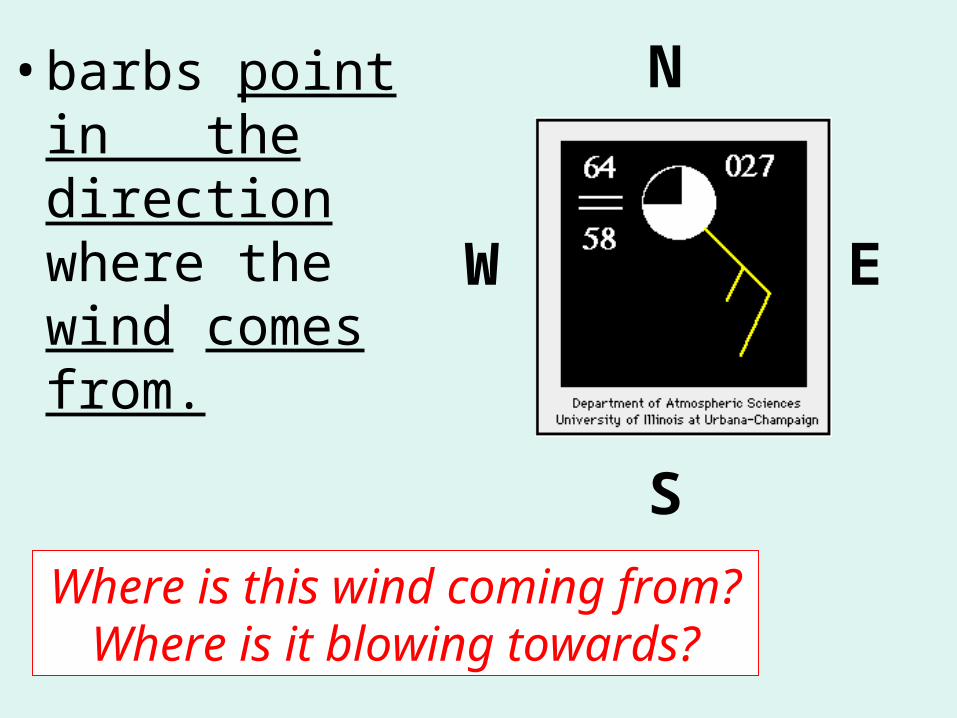
•barbs point in the direction where the wind comes from.
W E
N
S
Where is this wind coming from? Where is it blowing towards?
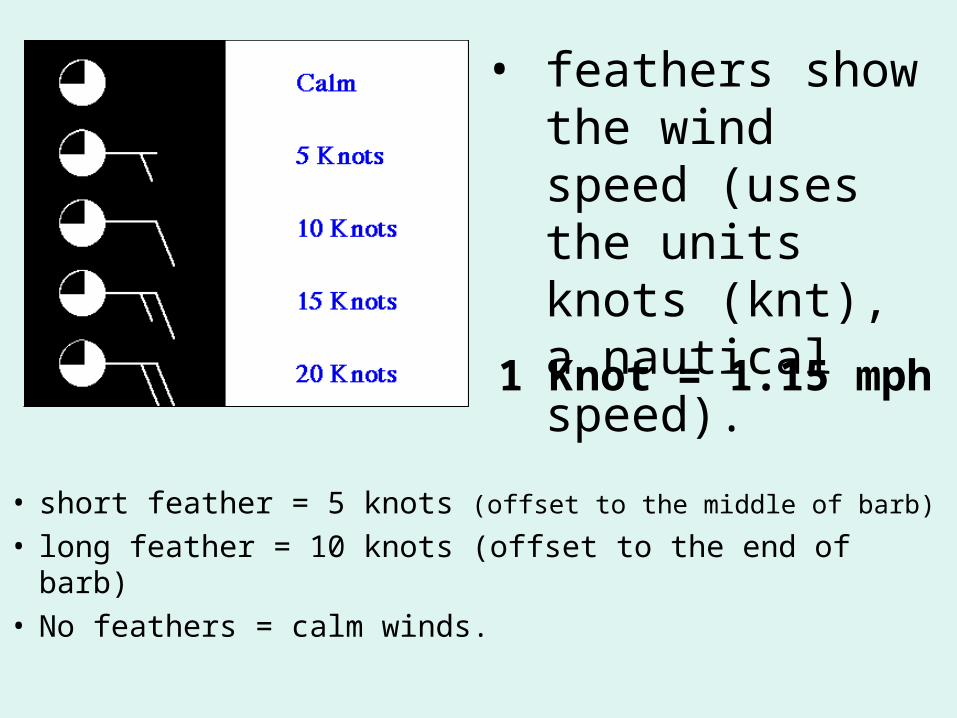
• short feather = 5 knots (offset to the middle of barb)
• long feather = 10 knots (offset to the end of barb)• No feathers = calm winds.
• feathers show the wind speed (uses the units knots (knt), a nautical speed).
1 Knot = 1.15 mph
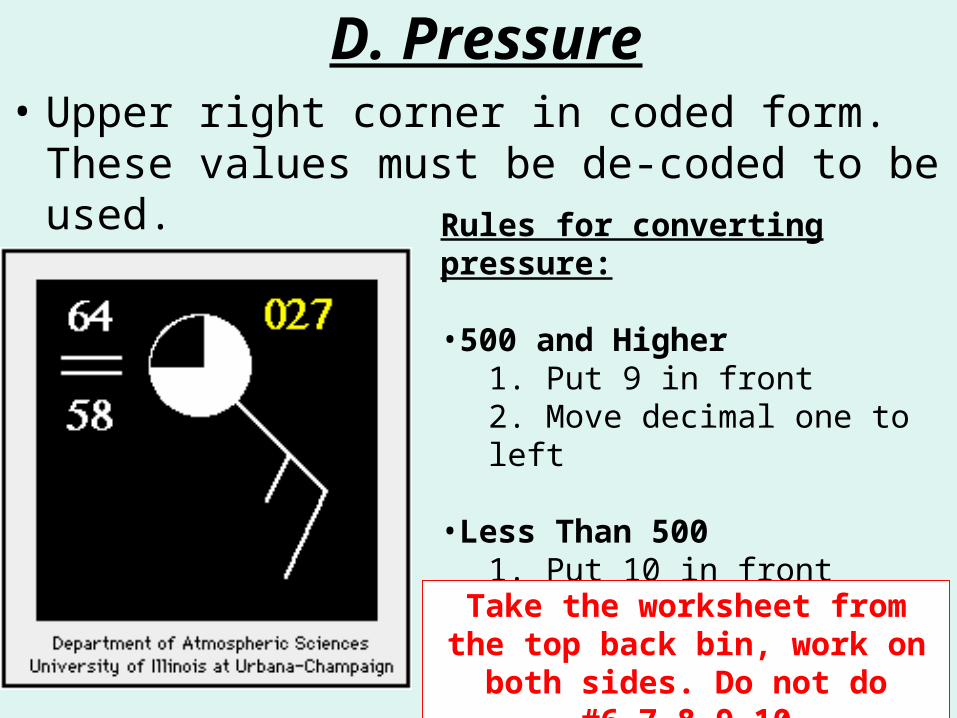
D. Pressure• Upper right corner in coded form. These
values must be de-coded to be used.Rules for converting pressure:
•500 and Higher1. Put 9 in front2. Move decimal one to left
•Less Than 5001. Put 10 in front2. Move decimal one to left
Take the worksheet from the top back bin, work on both sides. Do
not do #6,7,8,9,10
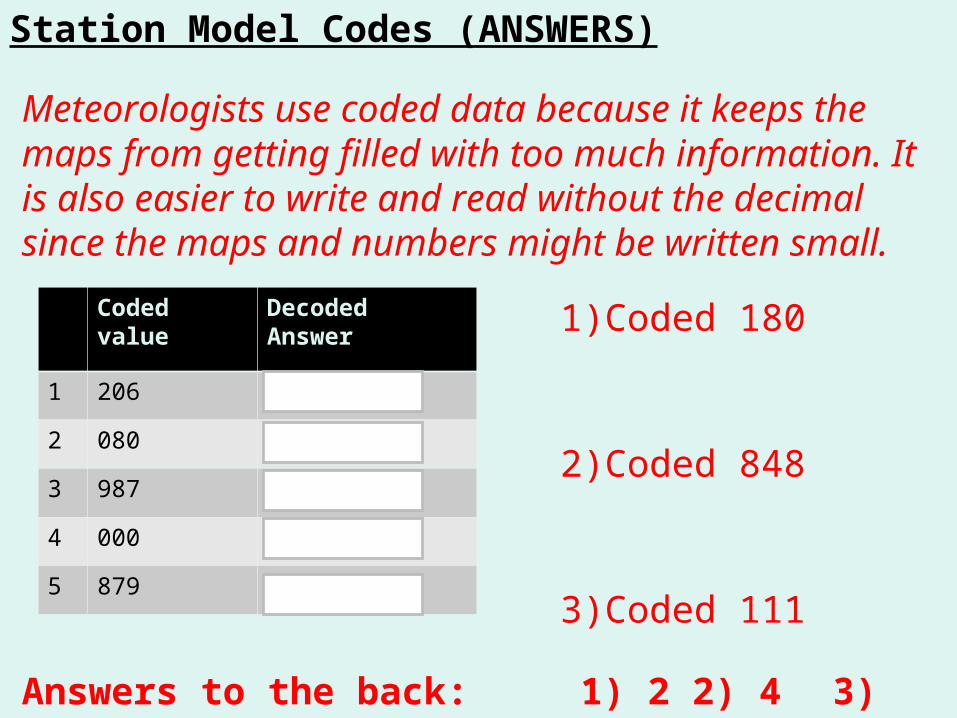
Station Model Codes (ANSWERS)
Meteorologists use coded data because it keeps the maps from getting filled with too much information. It is also easier to write and read without the decimal since the maps and numbers might be written small.
Coded value
Decoded Answer
1 206 1020.6
2 080 1008.0
3 987 998.7
4 000 1000.0
5 879 987.9
1)Coded 180
2)Coded 848
3)Coded 111
Answers to the back: 1) 2 2) 4 3) 1002.1 mb
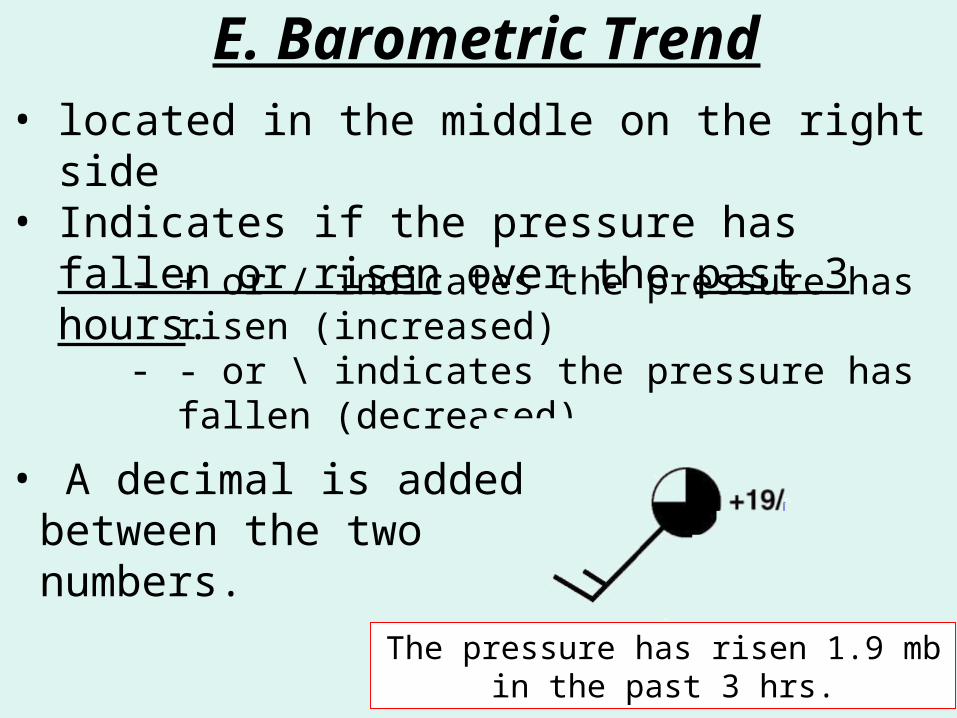
• located in the middle on the right side• Indicates if the pressure has fallen or risen
over the past 3 hours.- + or / indicates the pressure has risen
(increased)- - or \ indicates the pressure has fallen
(decreased)
E. Barometric Trend
The pressure has risen 1.9 mb in the past 3 hrs.
• A decimal is added between the two numbers.
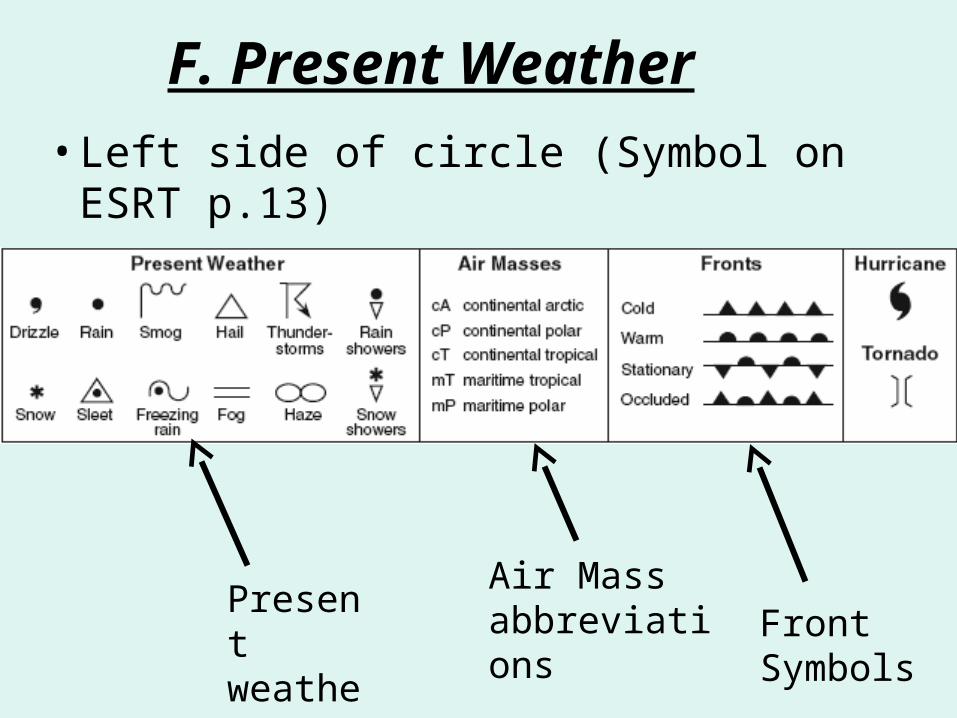
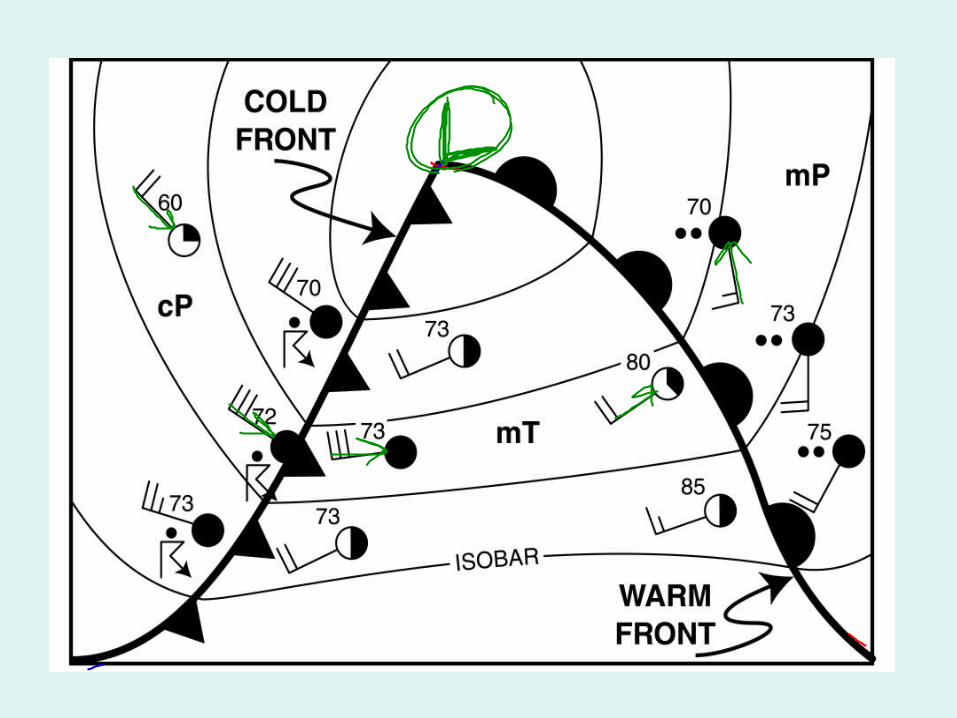
F. Present Weather
Air Mass abbreviations Front
Symbols
Present weather
• Left side of circle (Symbol on ESRT p.13)
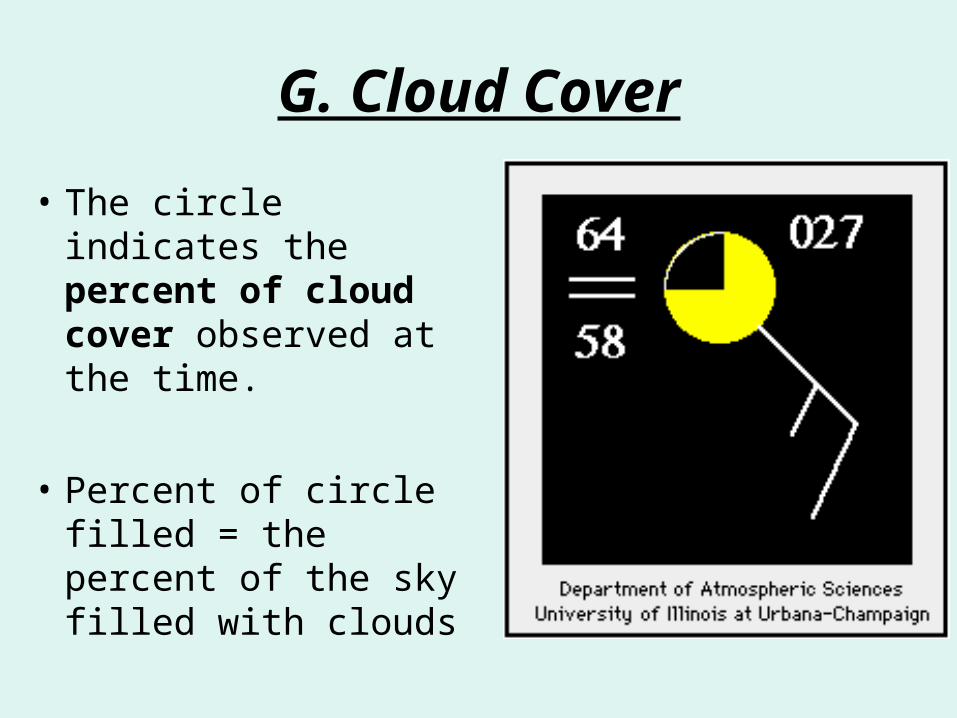
G. Cloud Cover
• The circle indicates the percent of cloud cover observed at the time.
• Percent of circle filled = the percent of the sky filled with clouds

H. Precipitation
- Shown on the bottom right.- Indicates the amount of precipitation over the last 6 hours
I. Visibility- Shown on outside middle left.- Indicates how far horizontally you can see.
Closure:
Obtain a “Reading and Drawing Station Models” worksheet from the bottom bin.
Use the notes and your ESRT to complete the worksheet.