ai for social good: key techniques, applications, and results · pdf filekey techniques,...
TRANSCRIPT

AI for Social Good:
Key Techniques, Applications, and Results
MILIND TAMBE and ERIC RICE
Founding Co-directors,
USC Center for Artificial Intelligence in Society (CAIS)
University of Southern California


USC Center for Artificial Intelligence in Society (CAIS.USC.EDU)
9/8/2017 6

Mission Statement: Advancing AI research driven by…
Grand Challenges of Social Work
Ensure healthy development for all youth
Close the health gap
Stop family violence
Advance long and productive lives
End homelessness
Achieve equal opportunity and justice
…
9/8/2017 7

Overview of CAIS Project Areas
AI for Assisting Low Resource Communities
Social networks: Spread HIV information, influence maximization
Real-world pilot tests: Big improvements
9/8/2017 8

Overview of CAIS Project Areas
9/8/2017 9
Machine learning/planning: Predicting poaching spots, patrols
Real-world: Uganda, South Asia…
AI for Earth

Game theory: security resource optimization
Real-world: US Coast Guard, US Federal Air Marshals Service…
Overview of CAIS Project Areas
9/8/2017 10
AI for Public Safety and Security

Partnerships
9/8/2017 11
AAMAS, AAAI, IJCAI
Low Resource Communities
Public Safety and Security
Wildlife Conservation

Key Takeaways
Significant potential: AI for low resource communities, emerging markets
Not just applications; novel research challenges:
Fundamental computational challenges from use-inspired research
Designing AI systems in society:
• Interpretability
• Complementing human autonomy
Methodological challenges:
Encourage interdisciplinary research: measures impact in society
9/8/2017 12

Partnerships
9/8/2017 13
Low Resource Communities
Public Safety and Security
Wildlife Conservation
PhD students/postdocs
Outline
Introduction
Low resource communities (homeless youth)
Public Safety and Security
Wildlife Conservation
9/8/2017 14

AI Program: HEALER
9/8/2017 15

Outline: HIV Information & Homeless Youth
Domain of homeless youth and HIV information dissemination
Real World Challenges in Influence Maximization
Sequential Decision Making under Uncertainty
Pilot Study
9/8/2017 16

• Random Samples: 1.7 million at least one night homelessness
• From Ringwalt’s 1998 work – National sample
7% of 12 to 17 years olds
• Street Counts: In LAHSA Point in Time 2017
57,794 homeless persons
5979 youth age 13-24 unaccompanied
Adolescent homelessness in the USA

The brief survey


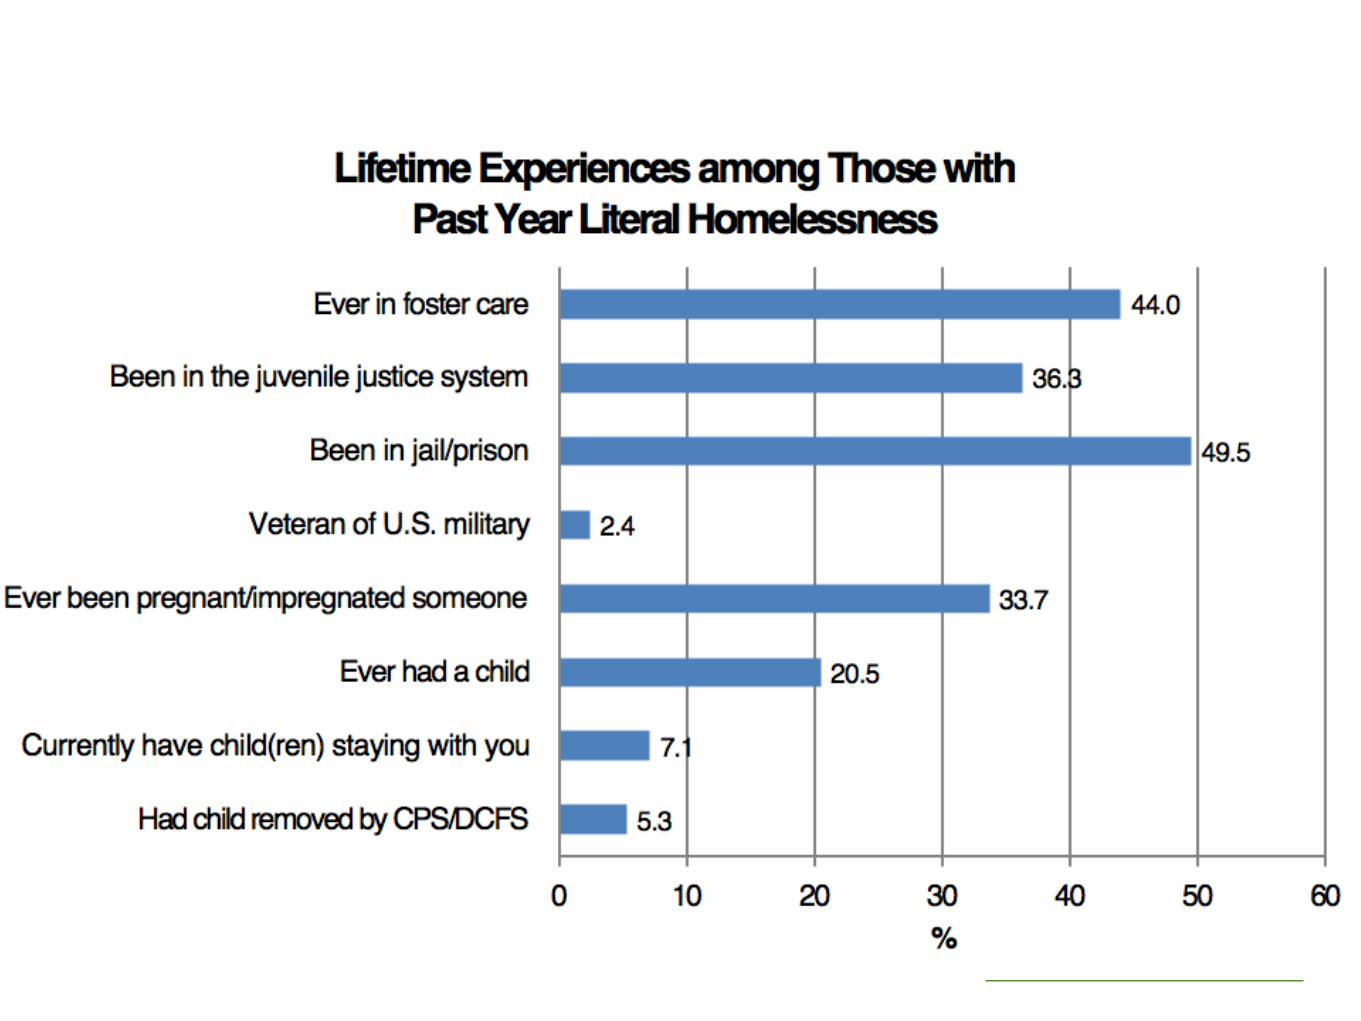

•HIV prevalence has been reported as high as 11.5%
•2016 data suggests 7% of youth in LA drop-in centers are HIV+
•Nationally 0.3% of 15-24 year olds are HIV+
HIV and Homeless Youth

HIV and Homeless Youth

Date: 9/8/2017 26

How stable are these networks over time?
HIV and Homeless Youth

But how certain are we about these networks?
These ties we are certain are real

But all these other ties could be real too!

So what do we need now?
Some way to deal with the uncertainty and instability of these
networks
A way to pick the “right” peer leaders – meaning what set of 15-
20% of youth can diffuse messages to the rest of the population of
youth?
Public health work says “pick the 10-15% most popular” – which
means degree centrality (the most ties to others)
Enter Milind Tambe and Amulya Yadav

Outline: HIV Information & Homeless Youth
Domain of homeless youth and HIV information dissemination
Real World Challenges in Influence Maximization
Sequential Decision Making under Uncertainty
Pilot Study
9/8/2017 31

Influence Maximization Background
Input:
Graph G
Influence Model I
Choose K nodes per time step
Number of time steps for influence spread T
Output:
K nodes per time step maximizing expected # influenced nodes
9/8/2017 32
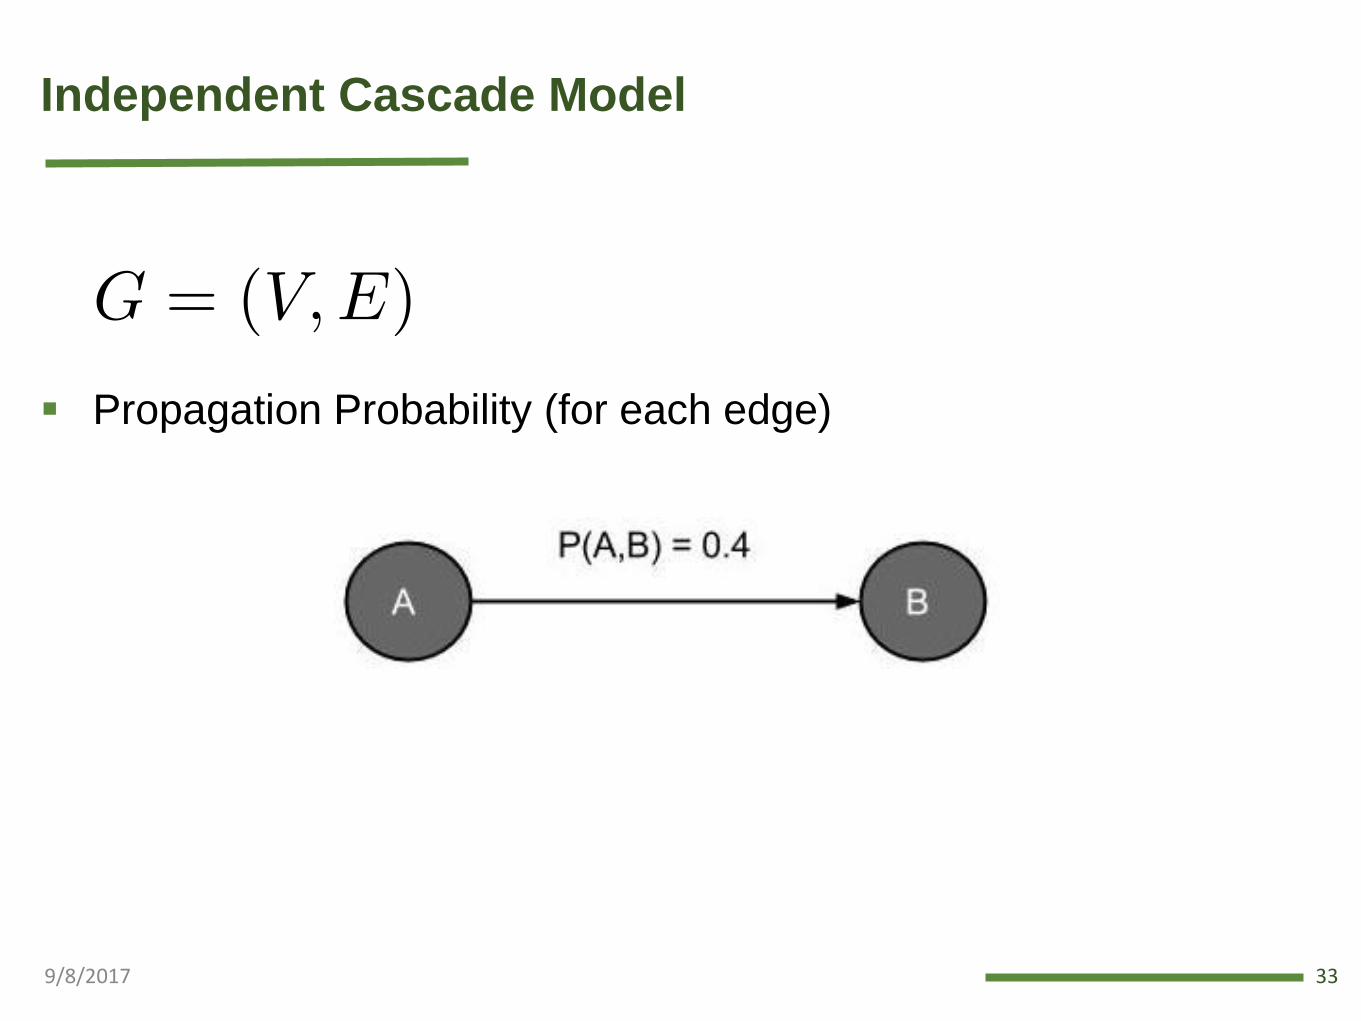
Independent Cascade Model
Propagation Probability (for each edge)
9/8/2017 33

Real World Challenges
Uncertain network state
Uncertainty in network structure
Adaptive selection
9/8/2017 34

Challenge 1: Uncertain Network State
B
C
9/8/2017 35
A

Challenge 2: Uncertain Network Structure
9/8/2017 36

Independent Cascade Model
Propagation Probability (for each edge)
Existence Probability (for uncertain edges only)
9/8/2017 37

HIV Prevention Programs:Using Social Networks to Spread HIV Information
9/8/2017 38

Challenge: Adaptive selection in Uncertain Network
K = 5
1st time step
9/8/2017 39

409/8/2017

Challenge: Adaptive selection in Uncertain Network
K = 5
2nd time step
9/8/2017 41
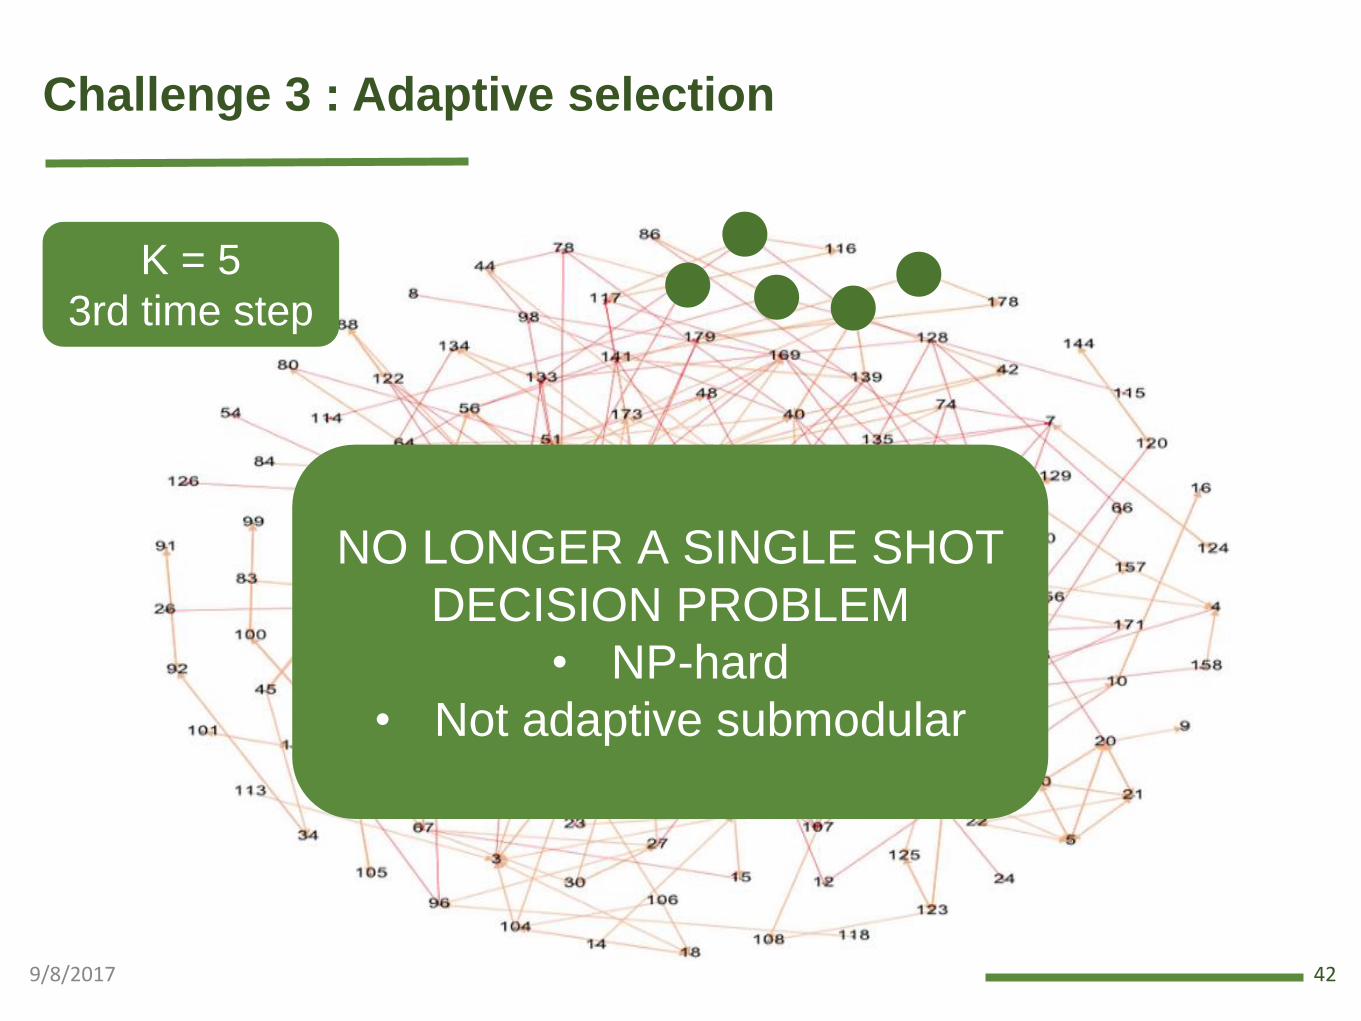
Challenge 3 : Adaptive selection
K = 5
3rd time step
9/8/2017 42
NO LONGER A SINGLE SHOT
DECISION PROBLEM
• NP-hard
• Not adaptive submodular

Outline: HIV Information & Homeless Youth
Domain of homeless youth and HIV information dissemination
Real World Challenges in Influence Maximization
Sequential Decision Making under Uncertainty
Pilot Study
9/8/2017 43
9/8/2017 44
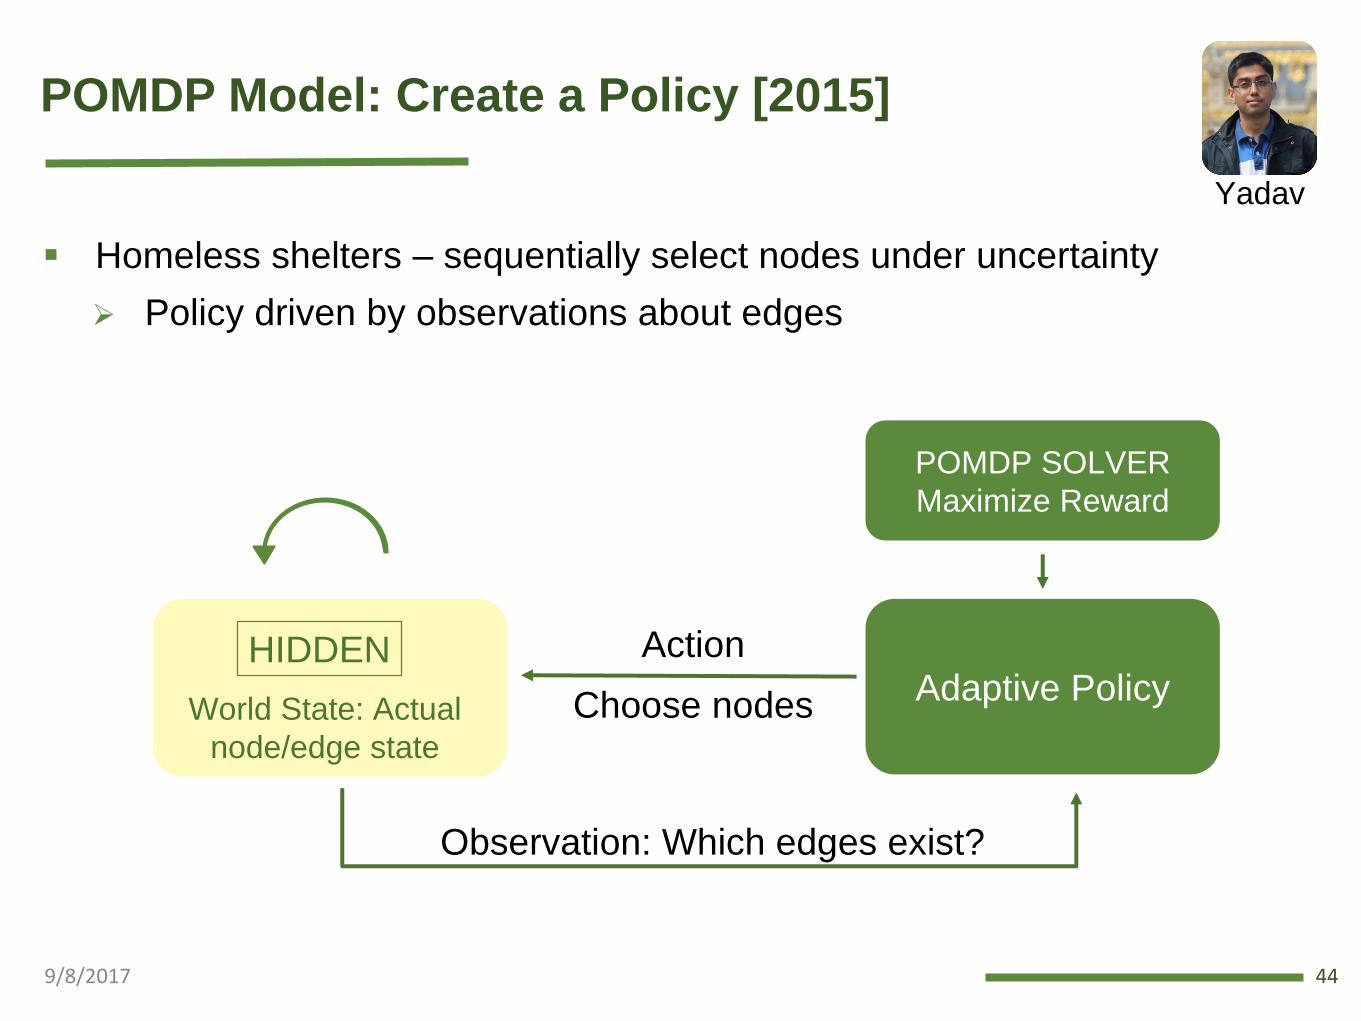
POMDP Model: Create a Policy [2015]
Homeless shelters – sequentially select nodes under uncertainty
Policy driven by observations about edges
Action
Choose nodes
Observation: Which edges exist?
Adaptive Policy
POMDP SOLVER
Maximize Reward
HIDDEN
World State: Actual
node/edge state
Yadav

9/8/2017 45
Optimal Policy at Real world scale: Why is it hard to solve?
2300 states150C6 actions
Current offline and online
POMDP solvers unable to
scale
Yadav

Real world scale: Why is it hard to solve?
9/8/2017 46

POMDP HeuristicsReal world networks have community structure
Graph Partitioning
9/8/2017 47
Yadav

9/8/2017 48
HEALER v1: Hierarchical Ensembling [2016]
GRAPH PARTITION TOOL
. . . .
. . . .
GRAPH SAMPLER
ORIGINAL POMDP
Intermediate
POMDP
Sampled
POMDP
Sampled
POMDP
Sampled
POMDP
HEALER
Graph
SamplingGraph
Sampling
Graph
Sampling
Intermediate
POMDP
Intermediate
POMDP
Yadav

HEALER v1: Partitioned Policies Combined for Final Result
qINTERMEDIATE
POMDP POLICY
9/8/2017 49
Cross Community
Edges Ignored

Real Networks – Simulation Results [2016-2017]
9/8/2017 50
0
10
20
30
40
50
60
70
80
90
Venice Hollywood
Ind
irec
t In
flu
ence
Degree CR PSINET HEALER-1 HEALER-2

Outline: HIV Information & Homeless Youth
Domain of homeless youth and HIV information dissemination
Real World Challenges in Influence Maximization
Sequential Decision Making under Uncertainty
Pilot Study
9/8/2017 51

Pilot Tests
with 170 Homeless Youth [2017]
Recruited youths:
Preliminary network —> HEALER
Bring 4 youth for training, get edge data —> HEALER
Bring 4 youth for training, get edge data —> HEALER
Bring 4 youth for training
HEALER HEALER++ DEGREE CENTRALITY
62 56 55
9/8/2017 52
Yoshioka-
MaxwellCraddockPetering

Safe Place for Youth
Collaborating with Safe Place for Youth (SPY)
539/8/2017
Yoshioka-
MaxwellCraddockPetering

Safe Place for Youth
Collaborating with Safe Place for Youth (SPY)
549/8/2017
Yoshioka-
MaxwellCraddockPetering

Results: Pilot Studies
9/8/2017 55
0
20
40
60
80
100
HEALER HEALER++ Degree
Percent of non-Peer Leaders
Informed Not Informed
0
20
40
60
80
100
HEALER HEALER++ Degree
Informed Non-Peer Leaders Who Started Testing for HIV
Testing Non-Testing
Yoshioka-
MaxwellCraddockPeteringWilderYadav

Analysis: Pilot Studies
9/8/2017 56
0
5
10
15
20
25
HEALER HEALER++ Degree
% of edges between peer leaders
0
20
40
60
80
100
120
HEALER HEALER++ Degree
% Coverage of communities in 1st stage
Yoshioka-
MaxwellCraddockPeteringWilderYadav

Date: 9/8/2017 57

AI Program: HEALER
9/8/2017 58

Next Steps
900 youth study begun at three locations in Los Angeles
300 enrolled in HEALER/HEALER++
300 enrolled in no condition
300 in Degree centrality
9/8/2017 59

Phebe’s Section
Date: 9/8/2017 60

Outline
Introduction
Low resource communities (homeless youth)
Public Safety and Security
Wildlife Conservation
9/8/2017 61

9/8/2017 62
ARMOR: Assigning Limited Security Resources
Optimizing Security Resource Allocation [2007]
2007
Airports
Canine patrol at
LAX (ARMOR)
PitaJain

9/8/2017 63
AI-based DECISION AIDS TO ASSIST IN SECURITY

Game Theory
2007
Airports
-1, 1 0, 0 1, -1
1, -1 -1, 1 0, 0
Player B
Player A
Paper Rock Scissors
Paper
Rock
Scissors
0, 0 1,-1 -1,1
AI-based DECISION AIDS TO ASSIST IN SECURITY

9/8/2017 65
Terminal #1 Terminal #2
Terminal #1 4, -3 -1, 1
Terminal #2 -5, 5 2, -1
Adversary
Model: Stackelberg Security Games
Defender
Set of targets, payoffs based on targets covered or not…
Security optimization: Not 100% security; increase cost/uncertainty to attackers
Challenges faced: Massive scale games; difficult for a human planner
Kiekintveld
Stackelberg: Defender commits to randomized strategy, adversary responds

IRIS: FEDERAL AIR MARSHALS SERVICE [2009]
Visiting TSA Freedom Center
66/

67
2007
Airports Air Marshals
2009
Security Game Deployments [2009]
9/8/2017
Jain

9/8/2017 68
Security Game Deployments
Security Games
2007 2011
Ports
2009
Airports Air Marshals
Fang

9/8/2017 69
PROTECT: Ferry Protection Deployed [2013-]

9/8/2017 70
Global presence of Security using Game Theory [2015-2017]

Threat Screening Games (TSG) [2016-2017]
71
TSA: ~640 million passengers per year; “TSA Pre”
New concept: More passenger categories using flight & risk level
TSG: Tailor screening to categories, balance efficiency & effectiveness
S1 S4S3S2 S5 S6
XRAY
WTMD
XRAY
AIT
(SLOW)
32
1
Low Risk High Risk
Sinha Schlenker
33% XRAY+AIT
66% XRAY+WTMD100% XRAY+AIT
9/8/2017

9/8/2017 72
Security Games in Cyberdefense:
New MURI Project [2017-]
University of
Southern CaliforniaRealizing Cyber Inception: Towards a Science of Personalized
Deception for Cyber DefenseCarnegie Mellon
University
University of Texas
El Paso
Arizona State
University
North Carolina State
University
University of
North Carolina
Chapel Hill

9/8/2017 73
Avata Intelligence
University of
Southern California
Los Angeles Sheriff’s
Department
Glendale PD
Los Angeles Unified
School District Police
RAND Corporation
US Coast Guard
Operational Efficiency Through AI
PitaJain
Outline
Introduction
Low resource communities (homeless youth)
Public Safety and Security
Wildlife Conservation
9/8/2017 74
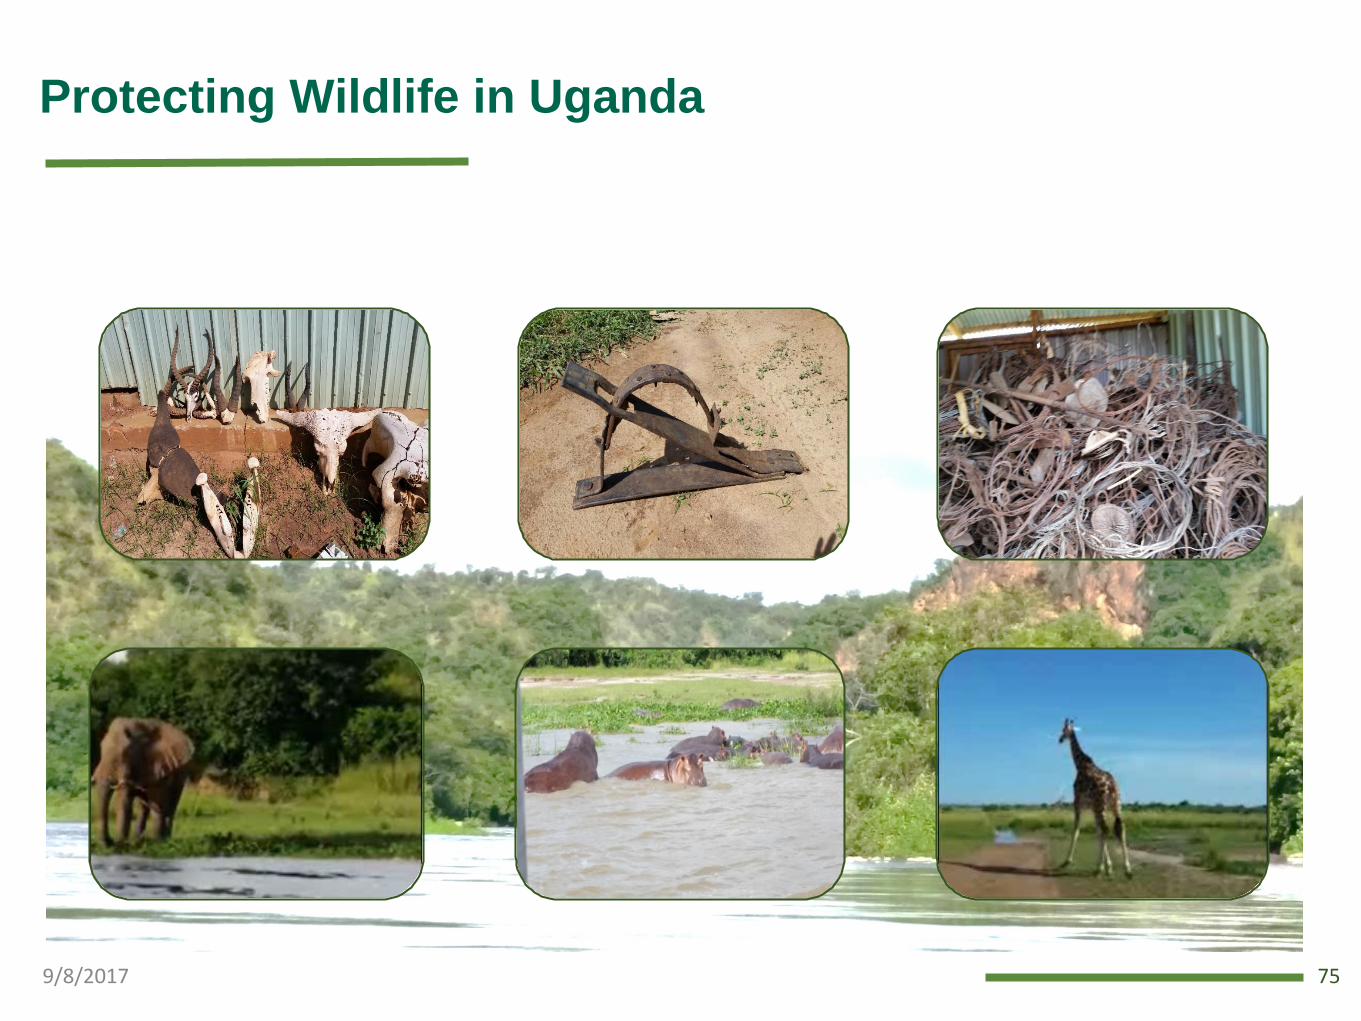
Protecting Wildlife in Uganda
9/8/2017 75

Predicting Poaching from Past Crime Data
PAWS: Applying AI for protecting wildlife
Poacher Behavior Prediction
9/8/2017 76
Nguyen

Data from Queen Elizabeth National Park, Uganda
Poacher behavior prediction [2016]
Number of poaching attacks over 12 years: ~1000
How likely is an
attack on
a grid Square
Ranger patrol
frequency
Animal density
Distance to
rivers / roads
Area habitat
Area slope
…
9/8/2017 77
Nguyen

9/8/2017 78
Boost in “heavily monitored” regions of the park:
Improve accuracy
Learn local poachers’ behavior; distinct parameters
Boost Decision Tree Ensembles with
with Behavioral Game Theory Models
Classifier 1 Classifier 2 Classifier 3
0 1 1
Aggregation Rule
1
Majority
1
Decision Tree
Decision Tree
+ Behavioral modelBehavioral model
Gholami Kar Ford

0
0.5
1
1.5
2
2.5
3
3.5
4
4.5
5
L&L
Uniform Random SVM CAPTURE Decision Tree Our Best Model
Poacher Behavior Prediction
Poacher Attack Prediction [2017]
Results from 2015
9/8/2017 79

Real-world Deployment (1 month)
Two 9-sq. km patrol areas
Where there were infrequent patrols
Where no previous hot spots
9/8/2017 80
Kar Ford

9/8/2017 81
Real-world Deployment: (1 month)

Real-world Deployment: Results
Two 9 sq KM patrol areas: Predicted hot spots with infrequent patrols
Trespassing: 19 signs of litter etc.
Snaring: 1 active snare
Poached Animals: Poached elephant
Snaring: 1 elephant snare roll
Snaring: 10 Antelope snares
Hit rates (per month)
Ours outperforms 91% of months
Historical Base Hit
RateOur Hit Rate
Average: 0.73 3
9/8/2017 82

9/8/2017 83
Real-world Deployment: Field Test 2 (6 months) [2017]
2 experiment groups (27 areas of 9 sq KM each)
1:HIGH >= 50% attack prediction rate
• 5 areas
2: LOW < 50% attack prediction rate
• 22 areas
FordGholami

9/8/2017 84
0
0.02
0.04
0.06
0.08
0.1
0.12
High (1) Low (2)
Cat
ch p
er
Un
it E
ffo
rt
Experiment Group
Real-world Deployment: Field Test 2 (6 months)
Catch Per Unit Effort (CPUE)
Unit Effort = km walked
Our high CPUE: 0.11
Our low CPUE: 0.01
Historical CPUE: 0.04

9/8/2017 85
Green Security Games:
Patrolling From the Sky [2017 ongoing]
UAV Patrolling: cheaper and more flexible
Credit: Arvind Iyer, AirShepherd Credit: Liz Bondi
Bondi

AI for Social Good
9/8/2017 86

THANK YOU
CAIS.USC.EDU

Overview of CAIS Project Areas
AI for Assisting Low Resource Communities
Substance abuse, suicide prevention…
Modeling gang violence, matching homeless and homes…
9/8/2017 88

AI for Social Good:Essential Nature of Human Machine Partnership
Build decision aids/assistants (“wrapping humans”):
Humans focus on their expertise, e.g., social workers interact with youth
AI systems focus on complementary tasks, e.g., select influential youth
Lessons in Building Assistants:
Right level of autonomy for humans vs machines
Explanation of output
Individual and organization level partnership:
Immersion opens up our eyes; builds up trust over time
9/8/2017 89