agriculture and food industry in south eastern europe
TRANSCRIPT

Agriculture and Food Industry in South Eastern Europe
“Chances and Challenges of Investments and Co-
operations along the Value Chain”
The survey has been issued in the framework of the business network project SEE of the Committee on Eastern European Economic Relations. The project is conducted by the
Committee on Eastern European Economic Relations and is financed by the German Federal Ministry on Economic Cooperation and Development.

2
Regional Rural Development Standing Working Group in SEE
Imprint Committee on Eastern European Economic Relations Breite Str. 29, 10178 Berlin, Germany Tel: +49 30 2028 1452; Fax: +49 30 2028 2452 www.ost-ausschuss.de
Publisher Committee on Eastern European Economic Relations/ Ost-Ausschuss der Deutschen Wirtschaft (OA) Authors Regional Rural Development Standing Working Group in South Eastern Europe,(SWG), Dragan Angelovski Editorial Staff Antje Müller, Dr. Valentina Knezevic, Katerina Dzartovska
While every care has been taken in drafting this survey we accept no liability for the completeness and accuracy of the information provided, or for it being up to date.
All rights reserved. 2013 ©

3
Regional Rural Development Standing Working Group in SEE
About the Author
The Regional Rural Development Standing Working Group for South Eastern Europe (SWG RRD) is
an international intergovernmental organization, consisting of members from governmental institutions
in South Eastern Europe (SEE) responsible for agriculture and rural development in respective
member countries and territories. The SWG vision is to promote innovative and sustainable agriculture
and rural development through regional cooperation, to improve rural livelihoods in the SEE countries.
The general objective of the SWG is to facilitate close cooperation among the ministries of agriculture
and other stakeholders in the field of agriculture and rural development and to support EU integration.
The SWG is responsible for the development of the methodology and conducting the survey/profiling in
the selected agricultural sectors from the four SEE countries.
About the publisher
The Committee on Eastern European Economic Relations (Ost-Ausschuss der Deutschen Wirtschaft -
OA) was founded in 1952 as the oldest regional initiative of the German economy. It represents the
interests of German enterprises and associations in 21 countries in Eastern Europe, South Eastern
Europe and Central Asia. One of the key supporting institutions is the Federation of German Industries
(BDI) which represents 100,000 companies in Germany with more than eight million employees.
The Committee on Eastern European Economic Relations is actively involved in more than 100 events
annually. In co-operation with the Federal Government and as a key actor in the field of business
diplomacy, it organizes discussions between Central and Eastern European government members and
German companies, and represents German business interests in bilateral committees. Moreover, the
Committee on Eastern European Economic Relations organizes meetings of experts, delegation visits,
SME conferences, Parliamentary Evenings and receptions and takes part in international trade fairs.
Acknowledgements The author of this publication would like to thank all partners participating in the preparation, interviews and data collection. Without their close cooperation, as researchers and individuals, this publication would not have been possible.

4
Regional Rural Development Standing Working Group in SEE
Greetings
The study on "Agriculture and Food Industry in South Eastern Europe - Chances and Challenges of Investments and Co-operations Along the Value Chain" identifies those agricultural branches in Croatia, Serbia, Macedonia and Albania which are of particular importance in the regional value added chain. By breaking down the strengths and weaknesses of the identified branches, a basis for the systematic and sustainable cross-linking of German and regional economies has been created. The study is fully transparent and provides sound data on the state of the agricultural branches analyzed to the representatives of agriculture and food industry in the relevant countries, as well as German companies. This approach paves the way to long-term commitment in terms of the development of trade and modernization partnerships.
Within the framework of the Committee on Eastern European Economic Relations’ Regional Network Project, launched in November 2011 under the aegis of the Open Regional Fund on Foreign Trade for South-Eastern Europe (ORF) of the Deutsche Gesellschaft für Internationale Zusammenarbeit (GIZ), not only South-Eastern European chambers and associations but also domestic member companies have been linked to German companies, chambers and associations, thus enhancing foreign trade competence on both sides. Via various measures and event formats the aim was to promote the partner’s foreign trade activities within the framework of the project in order to better integrate them into the international value added chain, particularly in view of the rapprochement to the European Union. The issue of enhancing the investment climate and promoting bilateral and intra-regional economic ties in the key areas of agriculture and food industry as well as tourism is still being addressed.
This is how the present study came about and it is to be understood as an aid for companies and institutions that want trade and exchange in the fields of agriculture and food industry. Under the umbrella of the ORF Foreign Trade and on behalf of the Committee on Eastern European Economic Relations it was developed by the experts of the Regional Rural Development Standing Working Group in South Eastern Europe (SWG) in Skopje.
I wish all readers an interesting and informative read and hope very much that the results will further encourage mutual economic exchange.
Prof. Dr. Rainer Lindner
Executive Director
Ost-Ausschuss der Deutschen Wirtschaft
5
Regional Rural Development Standing Working Group in SEE
Greetings
The Committee on Eastern European Economic Relations in Berlin looks back on 60 years of active involvement in relations with Eastern Europe. Since 1952, we have been supporting the transformation process in the region and building strategic partnerships, thus developing new business opportunities for German companies.
As a direct neighbor of the European Union, South Eastern Europe enjoys a special position within the regions we are active in. It follows a clear path towards European integration: Croatia will become a full EU member in July 2013, both Macedonia and Serbia are candidate countries and Albania has been granted the official status of a potential candidate. This is the best demonstration of the progress these countries have made in modernizing their economies and political systems. The wish to establish closer ties to the EU has proved to be a decisive driver for the reforms. We are very happy to be part of this process.
In this context, I am very pleased to present you our newest study “Chances and Challenges of Investments and Co-operations Along the Value Chain” of the Agriculture and Food Industries in South Eastern Europe. It was developed by the Regional Rural Development Standing Working Group (SWG) – an inter-governmental platform in the field of rural development - based in Macedonia and supported by the Deutsche Gesellschaft für Internationale Zusammenarbeit (GIZ) within the framework of its Open Regional Fund. The established cooperation with SWG and GIZ allowed for efficient pooling of resources and expertise and we sincerely appreciate our partners’ work and commitment.
The agriculture and food sector plays a key role in the economy of South Eastern Europe, both as a share of the GDP and as an important source of employment. Certainly, its biggest challenge is to enhance competitiveness and thus to be better integrated into international value chains. German agribusiness is ready to make major contributions to this process, providing innovations, investments, technology, know-how as well as training, strengthening its position as an important modernization and cooperation partner in the region. The potential for investment and other forms of cooperation in agriculture and food production is large, but has not yet been fully realized.
In view of the above, the study identifies and describes in detail the most promising branches of south-eastern European agriculture in terms of competitive production, export orientation and market potential. Its aim is to enhance the information services and transparency in the sector, and it should serve as a basis for further possible activities in the region. In this way, we hope to facilitate further networking and cooperation between the relevant players from both the German side and the side of the partner country.
I am deeply convinced that this study will help to close the existing gap in terms of up-to-date information on South Eastern European agriculture and food markets.
I wish you all an inspiring read and business success in the region!
Dr. Thomas Kirchberg
Chairman of the Agribusiness Working Group
Ost-Ausschuss der Deutschen Wirtschaft

6
Regional Rural Development Standing Working Group in SEE
CONTENTS
ACRONYMS AND ABBREVIATIONS 10 EXECUTIVE SUMMARY 12 METHODOLOGY 18
I COUNTRY PROFILE MACEDONIA 19
1. GENERAL DATA ON THE COUNTRY 20
MACEDONIAN AGRICULTURE AND FOOD SECTOR 21
FOREIGN TRADE OF AGRO-FOOD PRODUCTS 27
GOVERNMENT PROVIDED FOREIGN INVESTMENT SUPPORT AND SUPPORT TO THE AGRO AND FOOD SECTOR
29
OVERVIEW OF THE TAXATION IN THE COUNTRY 36
2. WINE GRAPES AND WINE SUB-SECTOR 38
DETAILED ASSESSMENT OF THE SUB-SECTOR 38
SUPPLY CHAIN DESCRIPTION 44
SWOT ANALYSIS 48
COMPARATIVE ADVANTAGES 50
INVESTMENT POTENTIALS 50
MARKET OPPORTUNITIES 51
SUB-SECTOR GROWTH POTENTIAL 54
PRODUCTION AND PROCESSING RELATED INPUTS 56
ESTIMATED INVESTMENT COSTS PER SIZE OR OUTPUT UNIT AND ESTIMATED RETURN ON INVESTMENT FOR EXISTING OPERATIONS
56
3. PROCESSED VEGETABLES SUB-SECTOR 57
DETAILED ASSESSMENT OF THE SUB-SECTOR 57
SUPPLY CHAIN DESCRIPTION 61
SWOT ANALYSIS 66
COMPARATIVE ADVANTAGES 67
INVESTMENT POTENTIALS 68
MARKET OPPORTUNITIES 68
SUB-SECTOR GROWTH POTENTIAL 72
PRODUCTION AND PROCESSING RELATED INPUTS 73
ESTIMATED INVESTMENT COSTS PER SIZE OR OUTPUT UNIT AND ESTIMATED RETURN ON INVESTMENT FOR EXISTING OPERATIONS
74
II COUNTRY PROFILE SERBIA
1. GENERAL DATA ON THE COUNTRY 82
SERBIAN AGRICULTURE AND FOOD SECTOR 82
FOREIGN TRADE OF AGRO-FOOD PRODUCTS 88
GOVERNMENT PROVIDED FOREIGN INVESTMENT SUPPORT AND SUPPORT TO THE AGRO AND FOOD SECTOR
94
OVERVIEW OF THE TAXATION IN THE COUNTRY 99
2. BERRY SUB-SECTOR 102
DETAILED ASSESSMENT OF THE SUB-SECTOR 102
SUPPLY CHAIN DESCRIPTION 106
SWOT ANALYSIS 113
COMPARATIVE ADVANTAGES 115
INVESTMENT POTENTIALS 116
MARKET OPPORTUNITIES 117
SUB-SECTOR GROWTH POTENTIAL 120
PRODUCTION AND PROCESSING RELATED INPUTS 121
ESTIMATED INVESTMENT COSTS PER SIZE OR OUTPUT UNIT AND ESTIMATED RETURN ON INVESTMENT FOR EXISTING OPERATIONS
122
3. PLUMS AND PRUNES SUB-SECTOR 123
DETAILED ASSESSMENT OF THE SUB-SECTOR 123
SUPPLY CHAIN DESCRIPTION 126
SWOT ANALYSIS 132
COMPARATIVE ADVANTAGES 134

7
Regional Rural Development Standing Working Group in SEE
INVESTMENT POTENTIALS 134
MARKET OPPORTUNITIES 136
SUB-SECTOR GROWTH POTENTIAL 139
PRODUCTION AND PROCESSING RELATED INPUTS 141
ESTIMATED INVESTMENT COSTS PER SIZE OR OUTPUT UNIT AND ESTIMATED RETURN ON INVESTMENT FOR EXISTING OPERATIONS
141
III COUNTRY PROFILE CROATIA
1. GENERAL DATA ON THE COUNTRY 148
CROATIAN AGRICULTURE AND FOOD SECTOR 149
FOREIGN TRADE OF AGRO-FOOD PRODUCTS 156
GOVERNMENT PROVIDED FOREIGN INVESTMENT SUPPORT AND SUPPORT TO THE AGRO AND FOOD SECTOR
160
OVERVIEW OF THE TAXATION IN THE COUNTRY 169
2. MANDARINS SUB-SECTOR 171
DETAILED ASSESSMENT OF THE SUB-SECTOR 171
SUPPLY CHAIN DESCRIPTION 176
SWOT ANALYSIS 181
COMPARATIVE ADVANTAGES 182
INVESTMENT POTENTIALS 182
MARKET OPPORTUNITIES 183
SUB-SECTOR GROWTH POTENTIAL 185
PRODUCTION AND PROCESSING RELATED INPUTS 186
ESTIMATED INVESTMENT COSTS PER SIZE OR OUTPUT UNIT AND ESTIMATED RETURN ON INVESTMENT FOR EXISTING OPERATIONS
186
3. OLIVE OIL SUB-SECTOR 187
DETAILED ASSESSMENT OF THE SUB-SECTOR: 187
SUPPLY CHAIN DESCRIPTION 192
SWOT ANALYSIS 197
COMPARATIVE ADVANTAGES 199
INVESTMENT POTENTIALS 200
MARKET OPPORTUNITIES 200
SUB-SECTOR GROWTH POTENTIAL 203
PRODUCTION AND PROCESSING RELATED INPUTS 204
ESTIMATED INVESTMENT COSTS PER SIZE OR OUTPUT UNIT AND ESTIMATED RETURN ON INVESTMENT FOR EXISTING OPERATIONS
205
IV COUNTRY PROFILE ALBANIA
1. GENERAL DATA ON THE COUNTRY 211
ALBANIAN AGRICULTURE AND FOOD SECTOR 212
FOREIGN TRADE OF AGRO-FOOD PRODUCTS 215
GOVERNMENT PROVIDED FOREIGN INVESTMENT SUPPORT AND SUPPORT TO THE AGRO AND FOOD SECTOR
216
OVERVIEW OF THE TAXATION IN THE COUNTRY 219
2. MEDICINAL HERBS SUB-SECTOR 222
DETAILED ASSESSMENT OF THE SUB-SECTOR 222
SUPPLY CHAIN DESCRIPTION 224
SWOT ANALYSIS 228
COMPARATIVE ADVANTAGES 229
INVESTMENT POTENTIALS 229
MARKET OPPORTUNITIES 229
SUBSECTOR GROWTH POTENTIAL 231
PRODUCTION AND PROCESSING RELATED INPUTS 231

8
Regional Rural Development Standing Working Group in SEE
LIST OF TABLES Macedonia Table 1.1: Macroeconomic indicators for Macedonia 20 Table 1.2: FDI/year 21 Table 1.3: Structure of agricultural land 21 Table 1.4: Water resources 22 Table 1.5: Production of horticultural field crops 23 Table 1.6: Production of fruits (tons) 24 Table 1.7: Number of livestock 25 Table 1.8: Export – import values (in € million) 27 Table 1.9: Trade of agro and food products with the EU 28 Table 1.10: Overview of the participation of subsidies in the production price in % 30 Table 1.11: Payments for premiums for selected agriculture products 30 Table 1.12: Participation of subsidies in the production price 31 Table 1.13: Overview of the IPARD measures available 33 Table 1.14: Availability of export support services in Macedonia 34 Table 1.15: Organic production development 35 Table 2.1: Structure of the wine exports (hl) 41 Table 2.2: List of importing markets for a wine exported by Macedonia 41 Table 2.3: List of importing markets for grapes exported by Macedonia 43 Table 3.1: Vegetable production in Macedonia 57 Table 3.2: List of countries with exports of pepper from Macedonia 60 Table 3.3: Volume of production and export of processed vegetables 60 Table 3.4: List of countries with exports of processed vegetables from Macedonia 61 Table 3.5: Output of the processing industry 64 Annex 1: Exports of wine from Macedonia 76 Annex 2: Trade indicators for wine exported by Macedonia 76 Annex 3: Trade indicators for processed vegetables exported by Macedonia 77 Annex 4: Trade indicators for pepper exported by Macedonia 77 Annex 5: Details on vegetable processing in Macedonia 77 Annex 6: International statistics on Macedonia and its agriculture 78 Annex 7: Information providers 79 Serbia Table 1.1: Agricultural areas under organic production 93 Table 1.2: Financial incentives for investors 94 Table 1.3: Financial incentives for employment 95 Table 1.4: Availability of export support services in Serbia 98 Table 2.1: Berry production, exports and value (2009) 104 Table 2.2: List of importing markets for frozen berries exported by Serbia 104 Table 3.1: List of importing markets for fresh plums exported by Serbia 125 Table 3.2: List of importing markets for prunes exported by Serbia 125 Annex 1.1: Trade indicators for frozen berries in Serbia 143 Annex 1.2: Trade indicators for plums in Serbia 143 Annex 1.3: Trade indicators for prunes in Serbia 143 Annex 2: Information providers 144 Annex 3: International statistics on Serbia and its agriculture 145 Croatia Table 1.1: Macroeconomic indicators 148 Table 1.2: Structure of agricultural holdings and land 149 Table 1.3: Sea fish catch 154 Table 1.4: Quantities and values of most important agricultural exports (2006-2008) 160 Table 1.5: Availability of export support services in Croatia 167 Table 1.6: Area under organic production in Croatia 168 Table 1.7: Areas under integrated production in Croatia 168

9
Regional Rural Development Standing Working Group in SEE
Table 2.1: Area harvested under fruits 172 Table 2.2: Mandarin production in Croatia (in tons) 172 Table 2.3: Mandarin Yields/ha 172 Table 2.4: Production by commercial farmers in intensive grown orchards 173 Table 2.5: Production in extensive orchards by subsistence farmers 173 Table 2.6: Age structure of mandarin orchards 174 Table 2.7: Net area by planting density (2009) 174 Table 2.8: List of importing markets for fresh mandarins exported by Croatia 175 Table 2.9: Production sizes of mandarin production plots in 2009 178 Table 3.1: Area planted with olive groves in Croatia (ha) 187 Table 3.2: Total olive production in Croatia (t) 187 Table 3.3: Average yields in Croatia (t/ha) 188 Table 3.4: Olive production in Croatia (in hl) 189 Table 3.5: Distribution of olive oil processors in Croatia 189 Table 3.6: Olive oil production and yields in Croatia 190 Table 3.7: List of importing markets for olive oil exported by Croatia 191 Table 3.8: Size of legal entities involved in olive production 194 Table 3.9: Trade of olive oil 201 Table 3.10: Prices of olives and olive oil 201 Table 3.11: List of importers of olive oil in 2011 202 Table 3.12: List of exporters of olive oil in 2011 203 Annex 1: Trade indicators on olive oil 206 Annex 2: Information providers 207 Annex 3: International statistics on Croatia and its agriculture 208 Albania Table 1.1: Macroeconomic indicators 211 Table 1.2: Family farms and area cultivated 212 Table 1.3: Number of main livestock categories (thousands) 214 Table 1.4: Agriculture and food industry trade (€ thousands) 215 Table 2.1: Harvested/Exported herbs in Albania 222 Table 2.2: List of importing markets for MAPs exported by Albania 223 Table 2.3: List of importers for medicinal plants (€ thousands) 230 Table 2.4: List of exporters of MAPs in 2011 231 Annex 1: International statistics on Albania and its agriculture 232

10
Regional Rural Development Standing Working Group in SEE
ACRONYMS AND ABBREVIATIONS
AFSARD Agency for Financial Support of the Agriculture and the Rural Development
AGRIMIS Agriculture Market Information
BAS Business Advisory Services
BRC British Retail Consortium
CA Controlled-atmosphere
CAP Common Agriculture Policy
CEFTA Central European Free Trade Association
CFP Common Fishery Policy
CIS Commonwealth of Independent States
CIT Court of International Trade
DAI Development Alternatives International
EAR European Agency for Reconstruction
EBRD European Bank for Reconstruction and Development
EC European Community
EFTA European Free Trade Association
ESU European Size Unit
EU European Union
EU 15 European Union of 15 Member States
EU 25 European Union of 25 Member States (without Bulgaria and Romania)
EU 27 European Union of 27 Member States
EUR European Union Currency
F&V Fruits and Vegetables
FAO Food and Agriculture Organization (of the UN)
FDI Foreign Direct Investments
FIFO First In - First Out
FTA Free Trade Agreement
F&V Fruits and Vegetables
FOB Free on Boat
GAP Good Agricultural Practice
GDP Gross Domestic Product
GG Global Gap
GHP Good Hygiene Practices
GMO Genetically Modified Organisms
GMP Good Manufacturing Practices
GIZ German Technical Co-operation
GOST State Standards (Russian Государственный стандарт)
HACCP Hazard Analysis and Critical Control Points (standard)
HAMAG Croatian Agency for SME
HBOR Croatian Bank for Reconstruction and Development
HRK Croatian Kuna (currency)
IBRD International Bank for Reconstruction and Development
IFAD International Fund for Agricultural Development
IMF International Monetary Fund
IPA Instrument for Pre-accession Assistance
IPARD Instrument for Pre-accession Assistance for Rural Development
ISO International Organization of Standardization
IQF Individually Quick Frozen
MAFWE Ministry of Agriculture, Forestry and Water Economy

11
Regional Rural Development Standing Working Group in SEE
MAP Macedonian Association of Processors
MAPs Medicinal and Aromatic Plants
MAFRD Ministry of Agriculture, Fisheries and Rural Development (Croatia)
MBRD Macedonian Bank for Reconstruction and Development
MELE Ministry of Economy (Croatia)
MFN Most Favoured Nation
MIS Market Information System
MKD Macedonian Denar (currency)
MRFP Macedonian Enterprise Development Foundation
MRL Minimum Residue Level
NATO North Atlantic Treaty Organization
NGO Non-Governmental Organization
OECD Organization for Economic Cooperation and Development
OA Committee on Eastern European Economic Relations
ORF Open Regional Funds
PDO Protected Designations of Origin
PGI Protected Geographical Indication
PO Producer Organization
RSD Serbian Dinar (currency)
QA Quality Assurance
QAS Quality Assurance Standards
SAA Stabilization and Association Agreement
SAPARD Special Accession Programme for Agriculture and Rural Development
SIEPA Serbia Investment and Export Promotion Agency
SEE South Eastern Europe
SME Small and Medium Enterprises
STIPS Agricultural Market Information System of Serbia
SWG RRD Standing Working Group for Regional Rural Development
SWOT Strengths, Weaknesses, Opportunities and Threats
TIDZ Technological- Industrial Development Zones
TIPA Trade and Investment Promotion Agency
TIR Transports Internationaux Routiers
TISUP Market Information System in Agriculture (Croatia)
ULO Ultra Low Oxygen
UN United Nations
USAID United States Agency for International Development
USD United States Dollar (currency)
VAT Value Added Tax
WB World Bank WCO World Customs Organization
WTO World Trade Organization

12
Regional Rural Development Standing Working Group in SEE
EXECUTIVE SUMMARY Background The Regional Rural Development Standing Working Group (SWG RRD) in South Eastern Europe (SEE) established a cooperation with the Committee on Eastern European Economic Relations (OA) through the Business Network Project SEE in the Framework of the Open Regional Fund of German Technical Co-operation (GIZ) for performance of a survey on competiveness and investment possibilities in the agriculture branches (sub-sectors) of SEE countries. The result from the survey/profiling of the identified agricultural branches in at least four countries should be presented /used at fairs, delegation trips and other events to present detailed facts and figures. The OA aims to use the results to set up follow-up activities and measures commonly developed and implemented by SWG RRD and OA. Based on this, both institutions aim at intensifying the modernization partnership, as well as co-operation between Germany and the countries of SEE, and their relevant agricultural stakeholders such as companies, associations and ministries. The results of the survey/profiling conducted present the most productive and competitive sectors in the field of agriculture and describe in respect of it:
Produced and/or manufactured products
Quantity and quality of those products
Quantity and quality of cooling chain, proceeding chain
Quantity and quality of logistics for exports and other transport capabilities
Data The data used in the country reports are derived from various sources such as national statistics, state administration bodies, official publications, and websites of the relevant institutions as well as interviews with various stakeholders in each sub-sector. The aim was to obtain information that was as coherent as possible. The information available in official publications was cross-referenced through interviews in order to obtain firsthand feedback on recent trends and developments, the sustainability, the expected future dynamics as well as the effects of the support policies and the provided state aid (where applicable). Reasons for selecting the sub-sectors Upon the finalization of a general assessment of the agriculture sectors in the targeted countries (agricultural exports, GDP, employment etc.), a shortlist of potential sub-sectors for profiling was generated. Each shortlisted sector was graded on the basis of several indicators
1 and a final score was prepared.
In some countries up to half a dozen sub-sectors were meeting the target criteria, while in others very few sub-sectors qualified. On few occasions the expected short to medium term trends indicated sectors other than those leading in exports quantities and values. Additional criteria were also introduced in order to narrow down the selection. On the basis of the final scores and in consultation with the SWG RRD the specific sub-sectors in each country were selected. Given the various stages of EU approximation, and often different priorities of the governments, the selection of the same sub-sectors in more countries was avoided in order not to engage in comparative evaluation of very dynamic agricultural sectors
2. In cases where the selected sub-sector
(processed products) was based on supply of raw materials (primary production), both aspects of the sub-sector were surveyed. The main arguments for the selection of the sub-sectors in each country are listed below:
1 Export orientation (quantity and value), number of people employed, contribution to the GDP, market and market
potentials, development prospects at present and prospect in line with the EU approximation/joining, value adding possibilities, environmental and health impacts, global, EU and regional competition, number of stakeholders, priority given by governments, State support provided, investment possibilities and incentives. 2 The sugar and cereal sub-sectors of Serbia and Croatia, olives and mandarins sub-sectors of Albania and
Croatia.

13
Regional Rural Development Standing Working Group in SEE
Macedonia
Wine grapes constitute the basis upon which the Macedonian wine industry is built and serves as a source for raw materials for the wine industries in the neighboring countries. Wine is one of Macedonia’s largest exports both in terms of value and quantities exported both to the EU and the region. The sub-sector is an important source of income for a large population and is one of the priorities for government support. The sub-sector has mainly served as a source for bulk produce, however, efforts/investments in the last decade have resulted in added value, improved quality, increased quantity and more significant exports.
The processed vegetable sub-sector is home-grown, utilizing local investments which added significant value to the Macedonian vegetable production over the last decade. The processed vegetables sector is export-oriented and a source of income for a large population. The continuous growth of the sector has also triggered the growth of the primary production and constitutes one of the bright moments of the Macedonian agriculture and food industry. In turn the ample supply of the raw materials has enabled rapid growth and diversification of the processing industry.
Serbia
Berries have been one of Serbia’s main and most valuable export products for generations. By being ranked among the largest global producers the sub-sector is significant for both national and rural income. The largest export until recently was bulk raspberries, however changes are quickly adding value and opening new opportunities for the sub-sector. There is a large raw materials production with obstacles for shifting to retail packed processed and fresh berries. The sector provides income for a large number of people in the primary production and processing industry. The primary production is massive in regards of the size of the country and although outdated, it provides very fertile grounds for investments.
Plums and prunes are another sub-sector which gives Serbia global relevance. Recent trends have contributed to exponential growth of the fresh and processed (plums and prunes) sub-sectors, boosting value adding and exports. Plums have the largest share of all fruits in Serbia (50%) and account for an enormous quantity of raw materials. The workforce engaged in primary fruit production in Serbia is very significant for the country.
Croatia
The mandarins in Croatia are one of few export-oriented sub-sectors. The sub-sector is thriving in the last decade, which in conjugation with the comparative advantages makes it a very competitive export product. The massive investments in the sub-sector both through incentives from the government and investments by the local population, account for annals leaps in export quantities. The product also provides ground for an increase of the regional co-operation as it provides employment opportunities for a large seasonal workforce.
The olive oil produced in Croatia is currently available in limited quantities, although it has been one of the pillars of the coastal population for thousands of years. Incentives from the government and investments ensure a significant increase in the near future both in terms of raw material and olive oil. Croatia will unlikely compete with other Mediterranean countries in terms of quantities, however the achieved quality has already been awarded with numerous recognitions on a global level. Both of the selected sectors are further complementing the tourist industry in Croatia, allowing significant value adding to the agricultural sector in terms of rural tourism. This is a vital prospect for the costal and island population, which is well recognized by the government.
Albania
The Medicinal and Aromatic Plants (MAP) are among the highest ranking export products of Albania. Although as a product it is mostly gathered and collected rather than cultivated, recent developments provide prospects for further sustainable increase in the value and quantity of exports. Albania is a traditional exporter, well recognized on the global markets. The increasing demand offers development possibilities, while the little value added provides investment opportunities. The fact that most of the produce is exported to the EU and USA opens the door for joint ventures and co-operation. The sector is crucial for the livelihoods of a large rural population in some of the most remote parts of the country.

14
Regional Rural Development Standing Working Group in SEE
Findings General economic situation Positive performances of most economic indicators in all of the targeted countries are signaling economic progress. In the last decade all surveyed countries experienced faster economic growth than the EU, averaging an annual GDP growth of between 2.7 and 6.1% (compared to 2% in the EU 27). Croatia has a GDP per capita even higher than, or close to, the level of some of the new EU Member States. Agriculture’s share in the economy is decreasing both due to the increase in other industry sectors and globalization trends
3. However, it still has major implications for the profiled countries’ exports, value
added, rural development and employment. The share of agriculture in gross value added (GVA) and employment is high in Albania, Serbia and Macedonia. Agriculture All profiled countries have high natural potential for agriculture, with shares of agricultural area at levels close or higher than in the EU. However, in many instances the potential is underused both in terms of technology applied and value added. A significant portion of the territory of all profiled countries qualifies as less favorite areas, which are mitigated with the production of high value crops and labor intensive agriculture. Although aging and depopulation processes may impact future production, the large share of rural population and the rural development measures and investments in infrastructure will limit the negative effects. In addition, the relatively small size of all the surveyed countries favors the inclusion of the urban population in agriculture for additional income. The small-scale and fragmented nature of farming remains a general characteristic in all of the countries and a structural handicap, however, in conjugation with controlled depopulation it can account for satisfactory levels of productivity. The increase in agricultural production is mainly due to a rise in yields over the last decade. However, the emerging more professionalized farmers with increased access to resources, investment capital and support for modernization, will account for development in the agricultural sector. The population of the profiled countries tends to share traditionally deeper connections with the rural environment and agricultural production. It is the author’s firm belief that the increasing availability of funds for agricultural investments will be followed by a development and increase in output. Comparisons of the sub-sectors with those of the EU Member States have been limited in the profiling, as they should be observed through the prism of state supports provided both in terms of duration and value. Therefore, with the introduction of the new Common Agricultural Policy (CAP), the author believes that the opportunities for progress will emerge. With the abandonment of centralized planning, all of the countries are moving away from raw material production and exports, and towards value adding and niche markets. Government policies in most of the profiled countries support such developments. Compared to the EU, budget support for agriculture is still low, with the exception of Croatia. Border protection is applied, with limited effectiveness due to free trade agreements (CEFTA, EU). Export subsidies are used in Serbia only. Croatia and Macedonia use direct payment schemes according to the EU rules. Rural development support is mainly intended for restructuring and modernizing agriculture through investment support. The limited progress of the adjustment of the state support towards the EU norms is often cited as responsible for the slow development of agriculture. However, experience shows that agricultural development is not proportional to the level of EU approximation in the new Member States. In contrast, agricultural production continues to decline after joining.
3 rural migration, rural aging, increased job opportunities in cities and abroad, climate change, travel liberalization
etc.

15
Regional Rural Development Standing Working Group in SEE
Sub-sectors The fragmentation of the primary production in all profiled countries provides limited possibilities for investments, apart from investments on government-owned land or through joint ventures with local producers. All countries share the global rural depopulation and rural aging trends, leading to a reduction of the workforce in the rural communities in the long run. However, given the high percentage of the population living in rural areas these trends are likely to somewhat increase the labor cost without seriously affecting the agricultural output in the next decade. The possibilities for the modernization of the primary production will account for increased yields and will mitigate the negative trends (depopulation, rural aging, lack of value added etc.), while the reduction in the number of farmers will likely provide growth opportunities for farmers that further professionalize.
Macedonia Both sectors showed a below share lack of turnover capital, mainly due to inappropriate financial management. The crediting of the end buyers (up to one year) by the processing industry is translated into long delays of payments to primary producers, further eroding the trust and vertical integration. Appropriate financial planning can significantly improve the output of both sub-sectors and reduce costs by reducing the dependence on credits.
Wine grapes and wine The Macedonian wine sector is based on the ample supply of raw materials produced by thousands of small farmers. Among the producers, several large companies dominate (up to 1,000 ha); this might be of interest to investors. The support of the government towards the sub-sector has influenced some growth of the planted area, ensuring sufficient supply for the processing industry. A significant part of the raw material consists of regionally indigenous varieties and provides a well known and recognized authenticity of the wines produced. Macedonian wines are known on the regional market, although a significant quantity is exported to Germany for blending as bulk. In recent years production of higher quality wines has been of interest to local investors and the government. Support is channeled as market incentives aimed at keeping value added in the country and at easing capital constraints. Lack of qualified oenologists is viewed as a constraint for the industry, preventing penetration on the market at the higher end of the quality spectra. Investment opportunities are available as joint ventures, provided that investors with experience and knowledge of the market (preferences and outlets) are interested. The government is supporting the establishment of new- and the improvement of- the existing wineries. Vegetable processing industry The Macedonian vegetable processing industry has been in continuous growth since its inception, constantly increasing the diversification of products and the available quantity and quality. The industry absorbs a number of primary products, although pepper is the base of the industry. The producers are well experienced and have demonstrated numerous times that they can quickly and significantly increase the output. The government provides direct support and incentives for the modernization of the primary production, further positively affecting the sector. Growing exports in too few continents have positively affected the growth of the processing industry, while government support for modernization and market incentives have kept the value adding within the country and have sparked growth in primary production. The earnings in the industry compared to the low level of investments needed can be attractive for investors.

16
Regional Rural Development Standing Working Group in SEE
Serbia Both of the sectors profiled account for a massive supply of raw materials that literally place Serbia on the global map. This argument is valid after the respective sub-sectors suffered years of neglect and the sales of cheap, raw materials for further value adding. The government has recognized the value of the selected sub-sectors, but Serbia, being a large regional agricultural producer, has tried to evenly distribute the limited support to many sub-sectors. More substantial support is provided for the renewal and modernization of the orchards, mitigating the sub-sector’s decline. Raspberry and blackberry The berry sub-sector in Serbia (raspberry and blackberry) has sustained rural livelihoods in central Serbia through decades of progress and turmoil. It’s based on favorable natural conditions, coupled with labor intensity and limited possibilities for large-scale agricultural activities. The berry sub-sector has been the basis for the development of a respectable processing industry, which is currently in the process of consolidation and modernization. The berry sub-sector is mostly operated on a cash basis, with small delays between sales and payments. No shortages of capital are evident in the processing industry, pointing to the profitability and competition within. On the other hand, the primary production struggles to modernize, more as result of the small size rather than low profitability. In recent years the industry is shifting towards more added value products and retail packs, thus keeping a significant value added in the country. Foreign investors have already invested in the sub-sector, while ample possibilities for investments still exist. The capacity of the processing industry has already significantly outweighed the primary production output, as markets are readily absorbing the available quantities. With the lack of competition in the region, the local processors compete to add more value and ensure a better position in the market. Plums and prunes Serbia’s plum sector accounts for one of the largest quantities and highest concentration of raw materials in Europe. The vast production has suffered from neglect and dwindling markets, resulting in a shift towards home processing into alcoholic beverages. The processing industry for plums is dominated by drying facilities, which in general produce bulk packed prunes. In the last five years the plum and prune sector has leaped forward, supplying the renewed soaring demand in former (Russia) and new markets (Turkey). The time needed for the development of a competitive orchard production and processing industry will likely keep Serbia ahead of competitors for the foreseeable future. The increasing demand and earnings offer the tools necessary for the reversal of the decline and the capacity to meet the challenges ahead. The processing sector is fragmented and struggles to meet the demand, therefore presenting attractive investment possibilities.
Croatia
The Croatian government has approximated its agricultural sector regulations to the EU. Croatia provides the highest subsidy rates compared to the profiled countries, however, it also incurs higher production costs (seasonal wages, tax rates etc.). In contrast to the profiled countries where trade of agricultural produce in the hands of small holders is mostly unregulated, in Croatia the agriculture sector, including the markets, is fully regulated. Mandarin Although Croatia is a large net importer of fruits, the mandarin sub-sector is thriving and exporting more than 90% of the available quantities. Due to the micro location and climatic conditions, the Croatian mandarins are exported earlier than those of most competitors. Coupled with the acceptable varieties and the relatively low prices compared to the competition, the demand is rising both on the regional and the EU markets. Recently the mandarins found their way to the Russian market, fostering even higher interest for investments. The sub-sector is heavily regulated and subsidized regarding both the erection of new orchards and market incentives. This makes the sector very competitive in terms of investments and predictable in terms of costs and expected returns.

17
Regional Rural Development Standing Working Group in SEE
Mandarin is one of the few sectors which will not be influenced by quotas once Croatia joins the EU. In addition, the continuous support for orchard establishment in the last decade is yet to peak in terms of quantities of produce. Olive oil The olive oil sub-sector is very small and Croatia is a net importer of olive oil of lower quality classes. The sector is characterized by traditional production which in the last decade has modernized and grown mainly due to state support for the renewal of old and the establishment of new olive groves. The intensive planting efforts will yield their maximum output in the years to come. The olive oil industry is quickly modernizing and targets the highest quality classes of olive oil. Exports are increasing, however, Croatia is yet to capitalize on the numerous awards for the quality of its olive oil. Government subsidies also target parts of the processing industry which are less developed, but provide significant cost reduction possibilities. The growth of the olive oil sector will be limited once the country joins the EU due to the production quotas. Therefore, Croatia rightly focuses the small production, with numerous natural quality properties aimed to exclusive niche markets.
Albania Albania is just starting to recognize and support the agricultural sector as one of its priorities. Since recently, subsidies are being provided to very few sectors in very modest amounts. Apart from a few exclusions with positive developments, the agricultural sector does not meet local consumption and imports predominate. Medicinal and aromatic plants Medicinal and aromatic plants (MAPs) are one of the largest Albanian agricultural export products. It is a traditional sector which has further developed in the last decade. The sub-sector is very labor intensive and accounts for the income of large numbers of residents (100,000) in the most remote rural areas, thus generating widespread incomes and jobs. Most of the exports are sold to Germany and the USA. Large and medium size operators are getting involved with the different levels of processing of the traditionally exported bulk raw materials, in turn directly competing for international markets. As a result, stronger competition in the market for the raw materials is increasing investments for processing activities. Partial depopulation in some rural areas and concerns of overharvesting are further fueling investments into cultivation rather than harvesting.
* This designation is without prejudice to positions on status, and is in line with UNSCR 1244 and the ICJ Opinion
on the Kosovo Declaration of Independence

18
Regional Rural Development Standing Working Group in SEE
METHODOLOGY This study is based on data and information collected in 2012, within the framework of the SWG RRD and the initiative of the Committee on Eastern European Economic Relations. This text briefly summarizes the study’s methodology, including information on the data collection and the sample of interviewed stakeholders. The work approach was based on three pillars:
Quantitative analysis of statistical data at national levels from a minimum of the past five years
Review of official programming and strategic documents, studies, project reports and other literature
Stakeholder consultations based on the interviewed experts. Stakeholder and expert knowledge was an essential part of the methodology
In the inception of the study, the general agriculture of each of the targeted countries was thoroughly evaluated, in order to identify the most promising and export-oriented sub-sectors. The main criteria for the selection of the sub-sectors were: the estimated appeal to investors and the possibility to allocate increased quantities and improved qualities of products to the EU market. The study of each selected sub-sector is based on primary data, collected through interviews with supply chain operators and supporting organizations, and on secondary data from national and international statistics. Annual and monthly data were used when available and appropriate. References to literature and publications on the targeted sub-sectors in the targeted countries and broader region are included. Data have been analyzed to assess market size, price, production and international trade
developments. During the course of this study, research generated information meeting the following three criteria:
Credibility of the source — all information should be obtained from a respected and reliable international or national source and cross-checked against other sources
Comparability of the data-point across locations
Updateability—researchers should be able to return to the source after six months or a year to obtain more information
The approach seeks primarily to provide indicative raw data to investors on the country’s business climate and government policies, specific industry factors, investment promotion services, infrastructure and labor. The author anticipates that investors would then feed such data into their own decision-making processes. It is expected that this process will constitute merely a starting point for the assessment of any contemplated investment project. By no means does it obviate the need for a full-scale financial analysis, which would clearly require customization according to the details of each specific investment project. The results of this study are unique to the sample of interviewed counterparts, whose perspectives reflect their individual strategies and preferences. Given the subjective nature of the information collected during the interviews, the findings may not always reflect the subtleties inherent in any complex competitive situation. In a few cases, individual data may also seem to reflect inconsistencies. On the whole, however, the results are representative of the overall operating environment in the sub-sectors at the time of the study.

19
Regional Rural Development Standing Working Group in SEE
COUNTRY PROFILE - MACEDONIA
- Wine grapes and wine
- Processed vegetables

20
Regional Rural Development Standing Working Group in SEE
I. COUNTRY SPECIFICS - MACEDONIA
1. GENERAL DATA ON THE COUNTRY
1.1 General Data Macedonia is located in the central Balkans. The country covers an area of 25,713 km
2. Its
terrain is mostly mountainous, traversed by the Vardar river. In accordance with the constitution, Macedonia is established as a sovereign republic. The head of state is the president and the legislative body is the parliament with a single chamber national assembly of 120 deputies. Executive authority rests with the government, headed by a prime minister. The legal system is based on a civil law system. The judiciary is consists of the Supreme Court, the Constitutional Court and the Judicial Council. In December 2005, the European Council awarded Macedonia its official recognition as an EU candidate state
4.
1.2 Economy After gaining independence, the Macedonian economy lost a large and protected market resulting in a decline in the GDP. In 1994, the government initiated and implemented a stabilization program, achieving macroeconomic stability at the end of 2000 with a surplus fiscal balance and modest inflation. Growth levels of over 3% and an average annual inflation rate below 3% were achieved in the last five years. The €/ MKD exchange rate
5 has remained almost unchanged over the last 10 years.
The growth has so far not benefited the official unemployment rate that remains above 30% (although actual unemployment is lower due to the informal economy). The exchange rate of the national currency, the Denar (MKD), is freely determined by the market. There are no restrictions on the purchase of foreign currency. Over the years the National Bank maintained a stable Denar exchange rate and low interest rates by pegging the Denar to the Euro. Table 1.1: Macroeconomic indicators for Macedonia
Indicator Unit 2006 2007 2008 2009 2010 2011
GDP (million €) € 5,231 5,965 6,720 6,703 7,057 7,504
GDP per capita (€) € 2,564 2,919 3,283 3,269 3,434 3,645
Participation of agriculture in GDP % 10.5 9.1 10.0 9.7 10.1 11.126
Economic development (changes in GDP) % 4.0 6.1 5.0 -0.9 2.9 2.8
Inflation % 2.9 6.1 4.1 -1.6 1.6 2.8
Participation (food, beverages and tobacco) in households consumption
% 43.4 42.5 43.3 40.7 39.0
Source: MAFWE, State Statistical Office
4 See chapter 2.7 on use to IPARD funds and
http://eeas.europa.eu/delegations/the_former_yugoslav_republic_of_macedonia/documents/more_info/ipard_fact_sheet_final_en.pdf 5 National Bank of Macedonia, exchange rates: 1 € = 61,5 MKD, 1 USD = 5 year average of 45,3 MKD, Exchange
rate used for conversion: 1 € = USD 1,3 from October 2012. 6
Source http://www.theglobaleconomy.com/Macedonia/indicator-NV.AGR.TOTL.ZS/

21
Regional Rural Development Standing Working Group in SEE
1.1 Foreign Investment Table 1.2: FDI/year
Foreign Direct Investments (FDI) has been steadily growing in the last decade. The years 2006, 2007 and 2008 saw significant investments from privatizations in the energy sector, and green-field investments in the free economic zones. In 2010 the FDI increased to 2.27% of the GDP and to 4.03% in 2011. FDIs in the agro and food sector were realized in a number of sub-sectors. Almost all investments are made by companies from the region, working with the same sub-sector
7. Other investors are
seizing opportunities for the diversification of their commercial activities. Investments are usually smaller than € 1 million. Source: National Bank of Macedonia
2. MACEDONIAN AGRICULTURE AND FOOD SECTOR Agriculture is an important economic sector. It is the third largest sector after services and industry. The share of the agricultural sector in the overall GDP has remained relatively stable at around 9.7%. If agro-processing is included, the percentage increases to 16% (35). The sector of agriculture and food in Macedonia is one of the fastest growing industries with an increase of over 10% in the last three years. The sector provides income and employment to approximately 435,500 residents (24). The agriculture sector has always regionally and locally been viewed as a supplier of raw materials.
2.1 Land Out of the total area in the country, approximately 43.6% (in 2010) is agricultural land. Out of the total agricultural land, 45.4% is arable land as illustrated below (7).
Table 1.3: Structure of agricultural land
Around 80% of total cultivated land is owned by 192,378 (2010) farms with an average size of 1.47 ha, further fragmented into 0.3- 0.5 ha parcels (24). The size structure of the farms is as follows: o 50% Very small farms (> 4 ESU) o 37% Small farms, (4-8 ESU) o 14% Medium-low farms (8-16 ESU) o 4% Medium-high farms (> 16 ESU)
Source: MAFWE About 20% of the land is owned by the state which was leased to 297 legal entities in 2010 (7). Agricultural land under state ownership cannot be sold. However, it may be leased or exchanged with private agricultural land for consolidation. The lease of agricultural land is made through public tenders. The duration of the lease is up to 30 years. Domestic physical or legal entities and foreign legal entities have an equal right to participate in public tenders for lease of state owned land. Foreign or domestic investors interested in leasing land plots can propose business plans including information on investment intentions, the size of the land required, the number of employees and the development and marketing concepts. A foreign physical entity is not entitled to own agricultural land.
7 The Sugar Factory “4th November” J.S.C. Bitola was bought by a Bulgarian sugar processing company, the
largest dairy processor IMB Mlekara Bitola was bought by a Serbian dairy industry (Danube Foods Group – Saford investment fund), one of the largest wine producers Vizba Valandovo is owned by Croatian investors
Year FDI (US$ million)
2002 105.6
2003 117.8
2004 323.0
2005 97.0
2006 424.2
2007 699.1
2008 598.5
2009 247.9
Type Ha Share (%)
Fields and gardens 415,000 37.0
Orchards 14,000 1.2
Vineyards 21,000 1.8
Meadows 59,000 5.2
Arable land total 509,000 45.4
Pastures 611,000 54.5
Ponds 1,000 0.1
Agricultural land total 1,121,000

22
Regional Rural Development Standing Working Group in SEE
Graph 1.1: Agricultural area as share of total land area
Source: FAOSTAT
2.2 Irrigation
Table 1.4: Water resources
Average annual precipitation is 730 mm and is unevenly distributed in space and time. Rainfall varies from 400 mm in the center and east to 1,400 mm in the west of the country (9). The total water resources are estimated to be 6.37 billion m
3
in normal years and 4.8 billion m3
during times of drought, of which 80% are in the basin of the river Vardar. The annual potential of the water sources per citizen is approximately 3,000 m
3 (7).
Source: MAFWE
Approximately 85% of the surface water originates from the country, whereas only 15% of the water flows in from the neighboring countries. There are approximately 110 large and small artificial lakes used for irrigation, water supply and the production of electricity. The greatest use of the water is for irrigation systems. Out of the total arable agricultural area, 123,864 ha (7) are irrigable through 144 irrigation systems (9). The systems are partly operated by 12 regional public water economy enterprises and 137 water communities (7). Cultivated land in the country with irrigation potential is around 400,000 ha or approximately 69% of the total arable land (9). Graph 1.2: Share of irrigated area in total arable area
Source: FAOSTAT
2.3 Plant Production
2.3.1 Cereals Cereals are strategically important, however, the country does not produce enough to meet the domestic needs. 151,528 ha (38%) of the total arable agricultural area is planted with cereals: Most common is wheat, with a share of 49% (95,406 ha in 2010), followed by barley and maize (7). The average yield of all cereals is generally low. Macedonia is a net importer of wheat.
Water surfaces Ha
Fish ponds 700
Rivers 2.200
Natural lakes 46.700
Artificial lakes 6.400
Total water surfaces 56.000

23
Regional Rural Development Standing Working Group in SEE
2.3.2 Industrial crops Out of the total areas used for industrial crops, 78% are planted with tobacco; sunflower is grown on approximately 19.5% of the areas and poppy on 2.5% (7). The production of small leaf oriental aromatic tobacco is one of the main agriculture sub-sectors. The raw manufactured tobacco is exported at a value of about € 72 million (in 2010). Tobacco in 2010 was grown on some 18,846 ha by 42,620 households. The total production has been increasing (by 44% in 2009 and by 11% in 2010). (7) 2.3.3 Fodder The production of feeding stuff and fodder crops on a total area of 28,534 ha (9% of the total agricultural arable area) meets only 30-35% of the total national needs. The production of fodder crops in 2010 was approximately 213,700 tons. The insufficient fodder production is a limiting factor for the livestock sector (7). 2.3.4 Vegetables The production of vegetables, particularly early vegetables, is one of the significant characteristics of the country’s agricultural sector and is one of the most significant sub-sectors. Vegetable production is widespread throughout the country and includes open field and protected production on some 46,414 ha (2010), including 216 ha of glass greenhouses and about 3,832 ha of plastic tunnels. The production is mainly concentrated in the south-eastern and north-eastern parts with a Mediterranean and moderate continental climate. The early vegetable production in 2010 shows a significant increase in the volume, with 80% of the crops exported on regional markets (7). The planting and production of melon and watermelon takes place on an area of 5,732 ha with a total production of 134,885 tons in 2010 (24). Table 1.5: Production of horticultural field crops
Crop Area in ha Production In tons Yield ton/ha
2006 2007 2008 2006 2007 2008 2006 2007 2008
Tomato 4.940 5.284 4.613 122.795 107,053 113,944 24.8 20.3 24.7
Paprika 6.914 6.567 5,980 108.922 99.934 114.040 15.8 15.2 19.0
Industrial Paprika
2.236 2.035 2.438 39.600 32.401 46.808 17.7 15.9 19.2
Melon 6.053 5.891 5.751 150.069 140,046 132.310 24.8 23.8 23.0
Potatoes 11.611 11.060 11.144 227.868 193,393 206.592 19.6 17.5 18.5
Bean 10.250 11,224 9,647 11,020 9.050 10,226 1.07 0.8 1.06 Source: MAFE (2)
2.3.5 Fruit Fruit production covers approximately 2.75% of the arable agricultural land or approximately 14,000 ha with approximately 9,000,000 stems which are concentrated in the regions with an elevation of 300-800 m (7). The average orchard farm size in the country is approximately 3 ha. Out of the total number of orchards, 84% are in the private sector (9). According to the fruit production areas, the most represented varieties are apples (approximately 62%), plums (13%), sour cherries (7%), peaches (7%), table grapes (7%) and other fruit varieties (pears, apricots, almonds, walnuts, etc. with approximately 4%). The volume of the total fruit production is approximately 155,000 tons per year (7). The most significant regions for apple production are the lake regions of Resen and Ohrid which generate 90% of the total quantity of apples in the country (2).

24
Regional Rural Development Standing Working Group in SEE
Table 1.6: Production of fruits (tons)
Year 2006 2007 2008 2009 2010
Apples 88 93 124 92 90
Pears 9 9 8 2 3
Plums 26 19 33 12 28
Sour cherries 7 10 9 12 11
Peaches 12 10 11 8 9,5
Source: MAFWE
2.4 Livestock production The current structure of animal production consists of a large number of individual farm producers operating mainly for their own consumption, a smaller number of commercially-oriented family farms that are on the rise and big specialized animal production enterprises.
2.4.1 Cattle production Cattle production is the main branch of the livestock sector, concentrated mainly in hills and mountainous regions. The structure of the animals involved is mainly dairy breeds of cattle; 41.8% Holstein-Frisian breed, Busha 12%, Simmental 5% etc. (2). Domestic milk production meets the domestic needs. Dairy cattle accounts for approximately 35% of the cattle herd or 93,500 heads. A total of 136,472 tons of cow milk was purchased by the processors in 2010. The production of 948 tons of beef is not enough to meet the consumer demands and they therefore need to be met through an import. In 2010 approximately 10,144 tons were imported (7). 2.4.2 Sheep production High-mountain pastures occupy more than half of the total agricultural land and represent an excellent base for extensive sheep production. The number of sheep has increased to about 755,053 heads (2010), although this is still far from the 2,000,000 heads in the 1990s (7). About 96% of milking sheep are bred on individual farm holdings with an average herd size of 20 to 300 sheep, whereas a smaller number of large companies have several thousand sheep (2). The breed structure of the sheep population consists mainly of the breed Pramenka, and a number of half-breeds of Württemberg (for meat) and Awassi (for milk). During 2010, a total of 2,920 tons of lamb and mutton were exported, mainly to Italy and Greece in the periods around the Christmas and Easter holidays, with smaller quantities going to Croatia, Serbia and Bosnia and Herzegovina. The sheep milk is used for the production of traditional types of cheese. In 2010, 8,640 tons of sheep milk was produced (7). The purchase price of sheep milk is approximately twice the price of cow's milk. An average yield of 68 liters of milk per sheep is obtained (2). 2.4.3 Poultry production Egg production is a primary activity. About 37% of the total number of laying hens is attributed to the larger farms, and 63% to the medium farms, with an average capacity of 2-5 thousand per farm. The total number of poultry in 2010 amounts to approximately 2 million; 75% are laying hens, which lay about 336 million eggs a year. The production of eggs meets the domestic demands, and eggs are also being exported to the regional markets. The production of poultry meat is based on the slaughter of laying hens and broilers, producing 1,094 tons of meat (7). Domestic production of chicken meat covers 20% of the domestic demand (2). The import of chicken meat is on average about 26,840 tons.

25
Regional Rural Development Standing Working Group in SEE
Table 1.7: Number of livestock
Source:
Source: MAFWE
2.5 Regulation and trade of agricultural products
2.5.1 Regulations governing the trade of agriculture and food products The Law on Trade and the Law on Agricultural and Rural Development govern the trade of agricultural products. The purchase of agricultural products can be made only by companies listed in the register of buyers who meet the requirements in terms of size, available facilities, liquidity and solvency(2). The Law on Quality of Agricultural Products includes the most important agricultural products and regulates their markets, quality standards, classification and labeling, and protection of agricultural and food products with PDO/PGI (2). Food and raw materials that are imported for domestic production and trade as well as those raw materials and products intended for export or re-export must comply with the regulations for food safety and for products that come in contact with food. The Agency on Food and Veterinary issues safety certificates for food, products and materials coming into contact with the food intended for export, ensuring it is manufactured according to the law. The procedure for import and export of seed and seedlings of agricultural plants is regulated by the Law on Seed and Seedlings for Agricultural Plants (2). Seed or seedlings may be imported: if the variety is entered in the national list of varieties; if the importer is registered in the register of importers; and if the additional conditions set forth in the Law on Plant Health are fulfilled. Production, preparation for marketing, import - export, wholesale and retail trade of seed and seedlings can be performed by domestic and foreign legal or natural entities listed in the register of suppliers of seed material and in the register of suppliers of seedlings. A foreign legal entity can carry out these activities through subsidiaries according to the law. The recent amendments to the law on seed and seedlings will ensure that seeds listed on the European Catalogue are listed in the national list of varieties (2). 2.5.2 Trade of agricultural and food products The agricultural products are marketed at wholesale or retail markets (supermarkets, shops and green markets). Generally, post-harvesting and value adding activities (number and quality of the infrastructure) is deemed unsatisfactory for all market outlets (wholesale, retail, export). As a result, most products are sold as raw materials, rather than as end products. The recent advances in food safety policy have resulted in the limited development of the post-harvest and storage infrastructure from investments by producers and traders. The wholesale of agricultural products is carried out at wholesale markets, on a daily basis at two formal markets in Skopje and Strumica) and a few seasonal markets found in the rest of the country. Both farmers and resellers have access to the markets, although ultimately the markets are controlled by traders.
Category 2006 2007 2008 2009 2010
Cattle 255,430 253,766 243,667 257,900 267,086
Sheep 1,248,801 817,536 688,278 713,465 755,053
Goats 63,579 126,452 81,421 80,837 73,888
Pigs 167,116 255,146 260,000 277,110 260,000
Poultry 2,585,327 2,263,894 2,343,300 2,543,146 1,994,852
Bees 67,804 58,307 47,352 53,439* 76,052

26
Regional Rural Development Standing Working Group in SEE
A large portion of agricultural fresh produce is retailed to green markets located in multiple locations in the settlements. In larger cities traders usually resale agricultural produce, while in smaller cities it is mostly farmers/traders that handle operations. There is a strong expansion trend of supermarkets and further expansion is expected in the trade of agricultural produce, however the dominance of the green markets will likely remain. During the last few years larger retailers have grown constantly (through investments and acquisitions), influencing the retail market. As food sales are increasingly through large supermarkets and hypermarkets, these large retailers are gaining increasing power over manufacturers and are able to increase shelf prices. Saturation of the retail market with the usual categories of wine and vegetable processing has almost been reached (except niche markets). This is mainly due to the heavy presence in the retail markets of numerous processors (vegetables and wine) and due to the tradition for home-made vegetable preserves and wine. 2.5.3 Market information systems The Ministry of Agriculture operates an agricultural market information system (MIS) to support the preparation of analysis for setting, implementing, controlling and monitoring the effects of agricultural policy and rural development policy. The establishment of an agricultural information system is one of the short-term priorities for sustainable agriculture and rural development and a condition for EU integration. Since the beginning of 2007 The Ministry is implementing activities related to the establishment of the databases (15). The MIS is not fully operational and provides partial and outdated information and therefore the interviewed parties are using its services. Recently a second market information system was established on a regional level in the most productive Strumica region (Agroinfo) and it is the first internet-based system that follows prices and retail markets trends on a daily, weekly and monthly basis. It also provides retail prices on the markets in neighboring centers of Serbia, Albania and Croatia (38). The system’s efficiency and usefulness is yet to be proven.
2.6 Employment and labor in agriculture At present, the official national unemployment rate is 294,963 (2011) or 31% of the employable population (29). The unemployment rate has shown a decreasing trend since 2005. Unemployment remains one of the most important problems mainly due to limited investments. The level of agriculture employment in the total employment after 2001 seems to show that the labor force in the sector of agriculture is decreasing. The agriculture labor force is significant, accounting for about some 17% of the total labor force (without post-harvesting agribusiness). Additionally MAFWE estimates that 20,000 part-time farmers and significant seasonal employment workers (particularly in the fruit and vegetable sector) work in the sector, for which accurate data is very limited (9). Calculation and payment of all the employees’ social contributions is regulated by one law, the law on contributions from mandatory social insurance, effective since January 2009. This law introduced the unified system of gross salaries. Employers are obliged to calculate, withhold from employees’ gross salary and pay into the accounts of respective funds the compulsory social contributions. The current level of the compulsory social contributions is as follows:
17.5 % pension and disability insurance
7.3% - health insurance
1.2% - unemployment insurance
0.5% - additional health insurance (39) 2.7 Credits and loans availability The financial industry in Macedonia is relatively well developed and offers specialized products for different agricultural activities, including primary production and processing. The funds for

27
Regional Rural Development Standing Working Group in SEE
the credits originate from various support lines such as IPARD, EBRD, MBRD, MRFP, EFSE etc. The financial system consists of commercial banks, micro-credit banks, savings houses and informal financial channels
8.
Bank loans are offered at rates of 5-12%, averaging at 8.5%. Credits originating from the funds of the commercial banks are usually 3-5% higher compared to the credits provided through specialized crediting lines.
2.7.1. Primary production Small farmers usually lack collateral, and so apply for credits. Agricultural land is generally not accepted as collateral (unless situated on an attractive location), and farmers acquire credits through guarantors (friends and relatives). A small guarantee fund for small farmers exists in the country, though with limited overall effect. The interest rates for primary producers are on average slightly higher than those of the processing industry. Approximately half of the interviewed farmers are indebted with loans (banks, informal sector, input suppliers) related to their agricultural production. 2.7.2. Processing industry The processing industry is using credit lines by providing the facilities and equipment as collateral. Few large companies (wineries) manage to access capital abroad, while smaller companies depend on the local banking system. All interviewed processors are indebted to banks, mainly for investments related to the modernization and enlargement of their production and turnover capital. Leasing-based investments in equipment for processing are common.
3. FOREIGN TRADE OF AGRO-FOOD PRODUCTS
3.1 Foreign trade statistics Agriculture is an important contributor to foreign trade. The relative share of agro-food and fishery exports in total trade averages 16.9%, whereas the relative share of imports was 12.9%. The country is a net importer of agricultural and food products and deals mostly in meats, as well as processed products and other food preparation as well as cereals (7). The annual shares of agro-food products exports and imports in the total exports and imports of agro-food products are shown in the table below. The trade deficit in the last three years is in decline, falling to € 108.6 million Euros in 2010 (7).
Table 1.8: Export – Import Values (in € million)
Export Import Trade balance
Country 2009 2010 2009 2010
€ % € % € % € % 2009 2010
Albania 12.4 3.5 15.2 3.6 1.0 0.2 0.9 0.2 11.4 14.3
BiH 30.0 8.4 30.0 7.1 12.0 2.4 10.8 2.0 18.0 19.3
Croatia 29.3 8.2 31.5 7.4 28.9 5.8 32.4 6.1 0.4 -0.9
Serbia 78.9 22.1 85.0 20.1 105.9 21.2 125.6 23.6 -27.0 -40.6
Kosovo*i 35.5 9.9 48.2 11.4 2.44 0.5 4.4 0.8 33.1 43.8
Montenegro
9.0 2.5 9.1 2.1 0.3 0.1 0.6 0.1 8.7 8.5
Moldova 0.05 0.0 0.3 0.1 0.23 0.0 0.04 0.01 -0.2 0.2
8 Borrowing from friends and relatives with low or no interests, borrowing from private borrowers at high rates but
without any collateral arrangements etc.

28
Regional Rural Development Standing Working Group in SEE
CEFTA - Total
195.1 54.5 219.1 51.7 150.9 30.2 174.6 32.8 44.3 44.5
EU-27- Total
145.7 40.7 173.7 41.0 197.7 39.6 216.4 40.7 -52.0 -42.7
Turkey 2.7 0.7 5.2 1.2 18.0 3.6 19.0 3.6 -15.4 -13.8
Brazil 0.0 0.0 0.7 0.2 42.2 8.4 42.0 7.9 -42.2 -41.3
Other countries
14.3 4.0 24.9 5.9 90.9 18.2 80.3 15.1 -76.7 -55.4
Total 357.8 100 423.7 100 499.8 100 532.2 100 -142.0 -108.6
Source: State Statistical Office of Macedonia
The division of the participation of the trade partners in the trade of agricultural food and fish products is shown in the table below. The most important non-European partner is Brazil due to the large quantities of sugar, poultry meat, beef and coffee that were imported from Brazil in 2010. The most important agricultural food products traded with the EU-27 in 2010 are shown in the table below, including exports (unmanufactured tobacco (35.9%), wine (7%), lamb (7.4%), various types of fresh or cool vegetables (5.5%), tomatoes (4.3%), biscuits and waffles (4%) and preserved snails (3.7%)) and imports (food products not elsewhere specified or included (10.1%), oil derived from sunflower (9%), fresh or cooled beef (7.6%), fresh/cool or frozen pork (5.7%), poultry meat (4.6%), chocolates and other food products containing cocoa (3.2%), biscuits and waffles (3.1%), feeding stuff (4.5%) etc (7)). Table 1.9: Trade of agro and food products with the EU27
Name
Export Import 2010
2010 2010
€’ 000 Share. €’ 000 Share Balance
Meat and other edible meat offal 16,980 3.8% 80,086 13.1% -63,106
Milk and dairy products, bird’s eggs, honey 4,487 1.1% 29,039 4.5% -24,191
Edible vegetables, roots and tubers 66,204 12.8% 6,341 1% 59,862
Edible fruits and nuts, peel of citrus fruits or melons and watermelons 39,618 7.1% 24,361 3.5% 15,256
Cereals 2,986 0.5% 18,713 2.6% -15,726
Animal or vegetable fats and oil and their cleavage products 8,545.5 1.5% 43,873 5.5% -35,327
Processed products of meat, fish, crustaceans or mollusks 17,303 2.9% 23.301 2.8% -5.998
Sugar and sugar confectionery 7,589 1.3% 44,721 5.2% -37,131
Cocoa and cocoa preparations 8,358 1.4% 30,569 3.4% -22,211
Preparations of cereals, flour, starch or milk, pastry cooks’ products 33,554 5.2% 32,530 3.5% 1,023
Products of vegetables, fruits, nuts 31,651 4.7% 19,704.8
2.1% 11,946
Miscellaneous edible preparations 13,494 2% 46,405 4.7 % -32,911
Beverages, spirits and vinegar 60,552 8.1% 25,517 2.5% 35,035
Tobacco and tobacco substitutes 93,483 11% 18,597 1.8% 74,886
Source: State Statistical Office of Macedonia
3.2 Memberships and agreements fostering foreign trade
Membership of the World Trade Organization since 2003. As a result, the average duty on agriculture products has dropped from 24.87 to 13.75%(7)
Member of CEFTA – Free Trade Agreements with Albania, Bosnia and Herzegovina, Serbia, Montenegro, Croatia

29
Regional Rural Development Standing Working Group in SEE
Free Trade Agreement with Turkey. Lists of agro-food products that have agreed duty-free quotas and quotas with reduced duty have been determined. Turkey's total export of agro-food products contributes with 0.7%, while the imports contribute with 3.6% (7)
Free Trade Agreement with Ukraine. Lists of agro-food products with duty-free quotas are agreed. For agro-food products not on these lists, regular MFN duty rates apply
Free Trade Agreement with the European Free Trade Association countries
Stabilization and Association Agreement with the EU, giving duty-free access to EU markets for the majority of the goods, except for wine, baby beef, sugar and fish and fishery products, of which tariff quotas or gradual liberalization have been agreed. Macedonia, for the import of the agro-food products originating from the EU, has cancelled the customs rates for products which are defined as insensitive
Bilateral Investment Protection Agreements have been signed with Austria, Albania, Belgium, Belarus, Bosnia and Herzegovina, Bulgaria, China, Croatia, the Czech Republic, Egypt, Finland, France, Germany, Hungary, Iran, Italy, South Korea, Malaysia, the Netherlands, Poland, Romania, The Russian Federation, Serbia, Montenegro, Sweden, Switzerland, Taiwan, Slovakia, Slovenia, Turkey, Ukraine (13)
3.3 Customs The Customs Act brought Macedonia’s customs regulations further in line with EU standards. The law includes provisions for the governance and operation of free zones and simplified procedures for inward processing. Customs duties generally apply to most products imported into Macedonia. In 2012 the unweighted average customs rate under the most favored nation treatment for agricultural products is 16.61%, whereas the unweighted average customs rate for industrial products is 6.2%. As per the products with preferential origin, the import of industrial products in 2012 is custom duty exempt. A number of products are subject to quality control by market inspection officials at customs offices to ensure that imported goods are in compliance with domestic standards. The products subject to quality control include most agricultural products and appliances or products in which failure to meet set standards may pose a health risk to consumers. Where applicable, products must also pass sanitary, phyto-pathologic or veterinary control (39).
4. GOVERNMENT PROVIDED FOREIGN INVESTMENT SUPPORT AND SUPPORT TO THE AGRO AND FOOD SECTOR
4.1 Technological- Industrial Development Zones There are currently four Technological- Industrial Development Zones (TIDZs) in Macedonia; two in Skopje and one in Tetovo and Stip, respectively. Investors in the TIDZs can benefit from the following incentives:
Subsidy of up to € 500,000 on building costs
Land lease for up to 99 years at attractive concessionary rates
Free connection to utilities
Green Customs Channel expediting exports to the EU
Advantageous location with access to pan-European corridors 8 and 10, railroad, and international airport
Under the law on Technological Industrial Development Zones, the zones aim to facilitate economic activities to be performed under special conditions for the zone users (31). The government has issued a list of industries which have priority for investments in the free economic zones. The food sector is not on the list, although applications are revived individually upon submission. 4.2 Government Support for the Agro and Food Processing Sector An increase in the ability of domestic producers to compete on domestic and foreign markets is the main goal of the government. The main areas of support for raising competitiveness are the improvement and modernization of the technological and market infrastructure, strengthening horizontal and vertical integration, and providing access to land and capital.

30
Regional Rural Development Standing Working Group in SEE
For the realization of the goals, the government provides support from the national budget (100 million € in 2010). 90% is spent on direct payments policies and 10% on co-financing the investments, accounting for some 3% of the national budget. In addition, producers can apply for the pre-accession EU support for rural development (IPARD). The support is available to agricultural holdings listed in the farm register, co-operatives, the food industry, rural economic operators, rural entrepreneurs and the rural population as a whole. The Agency for Financial Support of the Agriculture and the Rural Development handles all of the support measures (37).
4.2.1 Direct payments The payments are based on planted area or livestock head. The measure stimulates the development towards market oriented-production. Table 1.10: Overview of the participation of subsidies in the production price in%
Source: Epicenter
The payments per area are related to the planted crops but are not conditional to yields achieved per ha. The payments are divided into 1) perennial crops - vineyards and orchards, 2) vegetables, and 3) annual agricultural crops (except tobacco). Additional payments support the sales of agricultural products to the processing industry (vegetables, wine and tobacco). These subsidies are paid per kg and litter. In the livestock sector, the payments are per animal (cattle, sheep, goats, sows and beehives), as well as per quantity of the produce sold to the processing industry. The main aim is to motivate farmers to channel their products through registered processing capacities. The table below illustrates the amounts paid for different crops (37).
The participation of the subsidies from direct payments in the total production costs can be considered high. The table below provides for its participation in the main commodities for which farmers apply (1).
Table 1.11: Payments for premiums for selected agricultural products
Source: EPI Centar
Direct production support for the wine grapes sub-sector Most of the interviewed producers and processors agree that the measure has improved the relations between the wineries and the farmers, and has increased the quantities sold as raw material to the wineries. At the same time the quantities of wine grapes exported as raw material has significantly decreased. This demonstrates that the farmers
Product Participation Product Participation
Grapes 54 Cabbage 20
Lamb 45 Peaches 19
Melons 38 Milk 14
Tobacco 37 Greenhouse tomato 13
Sour cherries 36 Greenhouse pepper 12
Apples 35 Greenhouse cucumber 9
Poultry 21 Open field pepper 4
Open field cucumber 3 Open field tomato 3
Product Unit MKD €
Vegetables Kg 1,5 0,02
Tobacco Kg 60 0,98
Cow’s milk Liter 2,5 0,04
Beef (fattening) Head 1,500 24,4
Pigs Head 1,000 16,2
Broilers Head 25 0,4
Chickens Head 22 0,35

31
Regional Rural Development Standing Working Group in SEE
are willing to engage in arrangements with local vineries for higher prices and long payment deadlines, rather than with exporters for lower prices and immediate payments. Most of the direct support measures tend to change annually, depending on the seasonal development. Usually, problematic production and buyout is assisted with higher subsidy rates established during the negotiations led by the MAFWE. Direct support for the viticulture is provided under the Annual Agricultural Development Programme, with funding from the MAFWE budget. Beneficiaries of this assistance include legal entities and physical persons that meet the general conditions and have reported their vineyard in the regional units of MAFWE. The direct payments at present account for support both per hectare as well as per kilogram of grapes sold to the local processing facilities. Farmers selling to foreign buyers are not eligible for the support on sold wine grapes. Only producers with a farm size of at least of 0.3 ha can apply for support. The support provided is 40,000 MKD /ha (€ 650 /ha). In order to support the domestic wine industry (which has increased its capacities by an additional 40% since a decade ago) with quality domestic production, the state provides stimulation on the quantities sold to domestic wineries. For wine grapes sold in the wineries, farmers are supported with an additional 2.5 MKD/kg (€ 0.04 /kg). The establishment of new vineyards for a minimum of 0.2 ha is supported with 140,000 MKD/ha (€ 2,400 /ha). The direct support for the domestic production of certified seedling material is awarded-for a minimum of 0.3 ha- the amount of 15 MKD/seedling (€ 0. 24 /seedling). The table below illustrates the participation of the direct payment subsidy in the production price of grapes, which is 54% (37).
Direct production support for the vegetables sub-sector The direct payments for the vegetable production at present account for support both per hectare as well as per kilogram of produce sold to the local processing facilities. Farmers selling raw materials for export are not eligible for the support per kilogram of produce sold. Producers with a farm size of at least of 0.2 ha of protected production and 0.3 of open field production can apply for support. The support provided per hectare for protected production is 80,000 MKD/ha (€ 1,300/ha). This support is only available for the production of tomatoes, pepper and cucumbers/gherkins. The support for open field production is 20,000 MKD/ha (€ 325/ha) and is available for most vegetables. Additional support for the processing industry and the farmers includes stimulation on the quantities sold to domestic processors of 1.5 MKD/kg (€ 0.02 /kg) (37).
Table 1.12: Participation of subsidies in the production price
Source: EPI Centar
4.2.2 Rural development support The national programme for rural development aims at improving the quality of life in rural areas and diversifying the economic activities of the rural population, as a means for improving the competitiveness and the sustainability of rural communities. The national rural development support provides co-financing of at least 50% for investments in agriculture machinery and equipment, irrigation, greenhouses and equipment, livestock- and animal feed-related equipment, post-harvest- and processing-related equipment and investments for meeting food safety requirements.
Production price in MKD and € 13,3 0,21
Subsidy per kilogram 7.09 0.11
Participation of all subsidies in the price 54%

32
Regional Rural Development Standing Working Group in SEE
Support is available for the development of rural tourism and improvement of the human potential of the producers, as well as consultancy services and the strengthening of FO’s (37).
Rural development support for the wine grapes sub-sector Measure XV from the national programme for rural development, which aims to support the marketing and export of agricultural processing, stipulates that applicants who have applied for support and have exported wine in 2012 will be awarded with 20% of the costs of packing (bottle, cork, and label) or a maximum of up to 6 MKD (€ 0.10) per unit. Measure V provides for the participation in mechanization and equipment for the modernization of the primary agricultural producers. Measure XII provides assistance to microenterprises venturing in the production of wine (37).
Additional support mechanisms for the wine sub-sector The government has been implementing the project “New 100 Vineries in Macedonia" since 2010. The project includes the identification of appropriate construction sites for the building of new vineries which will be available for sale or long-term leasing on a competitive basis (37). The locations were announced in 2011.
Rural development support for the processed vegetables sub-sector Measure XV from the national programme for rural development stipulates that applicants who have applied for support and have exported vegetables in 2012 will be awarded with 20% of the costs of packing (label, jar, and lid) or a maximum of up to 2 MKD/ unit (€ 0.03). For the quantities of increased export compared to 2011, they will be awarded with up to 4 MKD (€ 0.06). Measure V provides for the participation in mechanization and equipment for the modernization of the primary agricultural producers (37).
4.2.3 IPARD support Macedonia, as a candidate for membership in the European Union, has the opportunity to use IPARD which provides financial aid for investments. This programme provides measures for investments in the processing industry, primary production and for the diversification and development of rural areas. The objective of IPARD is to improve the competitiveness of the agro—food sector and help the sector to comply with the community standards while ensuring sustainable environmental and socio-economic development of the rural areas. In compliance with the objectives of IPARD, the priorities for financial assistance are:
1) Investments in agricultural holdings to restructure and upgrade to EU standards 2) Investments in the upgrading of processing and the marketing of agricultural products 3) Diversification and development of rural economic activities
The available value of support in the IPARD program is € 31.5 million with an EU contribution of about € 24 million. The support provides for co—financing of at least 50% for investments up to € 200,000. Most of the IPARD support is aimed at the improvement of existing facilities and very few measures support the establishment of new production or processing facilities (mushrooms, buyout and packing centers, traditional crafts etc.)(2).

33
Regional Rural Development Standing Working Group in SEE
Table 1.13: Overview of IPARD measures available
Measure Minimum
investment
in €
Maximum Investment
in €
Maximum available support per user
(2007-2013) in €
101 Investments in agricultural holdings to restructure and to upgrade to community standards
5 000 200 000 / 400 000
530 000
103 Investments in the upgrading of the processing and marketing of agricultural products
15 000 400 000/ 3 000 000
1 100 000
302 Diversification and development of rural economic activities
5 000 200 000 250 000
Source: AFSARD The specifics of each of the measures for the selected sub-sectors are provided in the chapters below.
IPARD measures for the wine grapes sub-sector The IPARD measures include support for primary agricultural production under measure 101: Support for renewal of vineyards (excluding expansion) including various infrastructure, drip irrigation and mechanization (excluding tractors). The IPARD measures include support for wineries under measure 103: Support for investments for improvement of the quality of wine, monitoring of quality, packing and labeling etc. (excluding investments for wine making).
IPARD measures for the processed vegetables sub-sector The IPARD measures include for primary agricultural production under measure 101: Support for the renewal and of the modernization of existing plastic houses and greenhouses, as well as the replacement of plastic tunnels with plastic houses. The modernization support includes various infrastructure, equipment drip irrigation and mechanization. Further support is provided for investments in post-harvest facilities for the handling of the produce from glasshouses and plastic houses. Support for open field production includes co-financing of irrigation infrastructure and investments and selected agricultural machines. IPARD includes vegetable processors and buyout centers under measure 103: Support for the establishment of investments and the modernization of buyout centers including post-harvest handling and storing of produce; the modernization and procurement of equipment for vegetable processors. The IPARD measures include for vegetable processors under measure 302: Support for the establishment and modernization of on-farm processing facilities by farmers. The financial support to the agricultural programme at the moment is positively influencing the rise of competitiveness in agriculture. (1) The agriculture sector, for the first time in decades, has been firmly placed on the government’s agenda for support and has become vibrant and is developing.
4.2.4 Insurance of agricultural production The government, through the Ministry of Agriculture (MAFWE), is subsidizing the insurance of crops for primary agricultural producers. This measure is aimed to partly mitigate any damages occurring from the proposed ineffectiveness/halt of the activities of the hail prevention system. Agricultural producers can apply to commercial insurance providers for standard packages for insurance (hail, fire etc.), at an average commission rate of 8% from the insured premium amount. Agricultural producers can claim 60% of the insurance cost from the MAFWE (14).

34
Regional Rural Development Standing Working Group in SEE
4.2.5 Export promotion and investments support
As a small, open economy, Macedonia takes steps to attract foreign direct investment. The country has legislations that ensure an equal footing for foreign investors and also provides incentives to attract investments. Foreign persons may acquire property rights under conditions set by law and investors have the right to a free transfer of invested capital and profits. A foreign investor may establish the same types of companies as a national investor. There are no restrictions governing the participation of foreign capital in the banking sector (13).
The agency for foreign investments and export promotion is trying to attract foreign investors, and is constantly improving the package of incentives. It provides assistance to investors in the form of technical assistance and advice services (13).
The Macedonian bank for development promotion (MBDP/MBPR) has a main objective of promoting export through investment credits supporting the development of small and medium enterprises, as well as providing insurance for claims based on performed export against short-term commercial risk. Other activities of the bank include the redemption, sale and collection of receivables, domestic and international payment operations (on its own behalf and for its own account), the factoring and forfeiting for clients’ accounts, collecting, processing and analyzing information on legal entities’ credit-worthiness and their sales, economic and financial consulting and credit insurance against commercial and political risks. The MBDP was founded with a specific role in the banking industry and the economy. The bank is a joint stock company and the Republic is the sole founder and owner of the bank. The bank operates under the supervision of the Ministry of Finance and the National Bank of Macedonia. The MBDP is responsible for its liabilities with all its assets, and the Republic guarantees for the liabilities of the bank (32).
The Macedonian Economic Development Foundation (MEDF/MRFP) focusses on the development of small enterprises. The goal of the programme is the development of affordable financial services. The foundation provides credit access through several commercial lending institutions. Through the financial intermediaries, credits for 900 clients are disbursed, on average, annually (33)
There are four economic chambers in Macedonia which function on business association structures. The activities of the chamber are mainly focused on the support of the business sector in terms of promotion, information sharing (laws, regulations, standards, new technologies and so on), consulting services, training, fostering business relations and other services (34)
Several export promotion agencies, organizations and projects provide support for SMEs to invest and support SMEs to participate in international fairs. These role-players provide support in order to mitigate the weak public and private sector management and support structures and services.
Table 1.14: Availability of export support services in Macedonia Export support services
Status
Market intelligence Available
Export promotion and fair participation Available
Export documentation support Not Available
Export coaching for SME’s Not Available
National accreditation agency Available
National accredited certifying bodies for GG, HACCP, BRC, ISO Not Available
International accredited certifying bodies GG, HACCP, BRC, ISO Available
ISO certified laboratories Available Source: CBI/SWG RRD
At a regional level, since 1998, a co-operative structure for trade promotion is functioning in the Balkans, named Balkan Regional Centre for Trade Promotion (www.balkantrade.org). Turkey, Greece, Serbia, Romania, Montenegro, Macedonia, Bulgaria and Albania are members. It appears that this organization functions merely on

35
Regional Rural Development Standing Working Group in SEE
paper and that the reason of its existence is of political nature and it does not currently provide any services to exporters (19)
4.3 Quality assurance, food safety and organic production The government has a strategic commitment to support the policy of maintaining the quality of agricultural products and improving food safety. Based on the new law on organic agricultural production, which was harmonized with the European Regulations in 2010, several rulebooks were adopted which regulate the field of production, control, certification bodies and their authorization, packaging, transport and storage of organic products, as well as the contents and layout of the national label for organic products (7). Good agricultural practices are not defined as a separate legislation but exist as requirements in various segments of the primary and secondary legislations, such as law and rulebooks on fertilizers, law and rulebooks on plant protection etc. To encourage the implementation of safety and quality assurance standards in agricultural production and processing, the government is subsidizing the costs for the certification and implementation of standards and quality control for farmers and processors.
4.3.1 Primary production Service providers (implementers and certifiers) for quality assurance standards in the primary production are readily available and engaged in the vegetable processing and wine grape sector on demand. The organic production of wine grapes and vegetables exists in limited quantity due to low demand. Table 1.15: Organic production development
2009 2010
Type/crop In conversion Organic Total/ ha In conversion Organic
Total/ ha
Organic crop production Cereals 501,52 166,35 667,87 2.723,7 276,1 2.999,8
Fodder crops 101,04 82,05 183,09 848,9 145,7 994,6
Industrial crops 12,31 31,32 43,63 32,1 / 32,1
Oil plants 63,78 / 63,78 40,7 6,7 47,5
Fruits 137,48 73,55 211,03 165,9 168,3 334,2
Vine grapes 46,25 13,92 60,17 223,6 20,7 244,3
Vegetable plants
84,22 58,64 142,86 164,2 35,7 199,9
Fallow land 7,99 56,81 64,8 306,4 66,3 372,7
Organic livestock production Cattle 180 197 377 2,522 37 2,559
Sheep 21.844 208 22.052 92.523 6.275 98.798
Goats 791 248 1.039 2.470 578 3.048
Source: MAFWE
The government provides subsidies in the form of premiums on top of direct subsidies for the implementation of quality assurance standards (+ 20%) and for organic production (+ 30%). The government also participates with the recovery of 50% of the costs for the implementation and certification of organic production (37).
4.3.2 Processing industry Food safety and food quality issues are a prerequisite for the industry. Hazard Analysis and Critical Control Points (HACCP) is a mandatory requirement for all food operators. Food safety in the processing industry is controlled by the agency on food safety. Various processors are implementing additional quality assurance standards such as the ISO family, BRC, IFS etc. Service providers supporting the implementation and certification of these quality assurance standards are readily available in the country. The government participates with the recovery of 50% of the costs for the implementation and certification of quality assurance standards

36
Regional Rural Development Standing Working Group in SEE
through the IPARD programme, in addition to EBRD funds (BAS programme), as well as with 50% of the investment costs for the introduction of quality assurance standards (37). At least one winery and vegetable processor is dedicated to the production of organic processed products, produced from mainly private primary production, and aimed at niche markets.
5 OVERVIEW OF THE TAXATION IN THE COUNTRY
5.1 Brief overview Sour
Source: Investinmacedonia.com
5.2 Profit tax Profit tax is paid by resident legal entities both on the profit arising from the activities performed on the territory of Macedonia and from incomes generated abroad. A legal entity is considered resident if registered in accordance with the company law, or if it has a head office on the territory of Macedonia. Residents are taxed on the profit they generate both in the country and abroad, while non-residents are taxed only on the profit they generate from business activity in Macedonia. Any income realized by a corporate tax payer is exempt from profit tax on the condition that such income is not distributed (i.e. kept as retained earnings). The tax exemption is applicable on the profit distribution to resident legal persons as well. The profit tax rate is 10%. The law provides a list of taxable expenses which are subject to annual profit tax whether the profits are distributed or not. Companies can apply depreciation methods and rates, as well as generally perform impairment of their fixed assets and inventories under the applicable accounting standards, without any consequences for tax purposes. The difference between the market price and the transfer price applied on transactions between related entities is subject to profit tax. Dividends received from Macedonian and foreign companies are included in the taxable base of the recipient subject to profit tax. Capital gains are treated as ordinary taxable income. Loss carry forward is not possible in Macedonia. Companies that perform economic activities except banking, finance, insurance, games of chance and entertainment games, and their overall revenues earned in the last year from any source does not exceed MKD 3,000,000 on an annual basis, are exempt from the payment of profit tax. Companies whose overall revenue is between MKD 3,000,001 and MKD 6,000,000 shall pay annual tax on total revenues in the amount of 1%. The withholding tax rate is 10% and is levied on the gross income. A corporate taxpayer and resident of Macedonia who has paid tax in a foreign country on the profit earned through work abroad, is entitled to a tax credit for the profit tax paid abroad, but only up to the amount that would have been incurred under the provisions of the Macedonian
9 This includes computer software and hardware.
10 2-3% for the taxpayer in the 2
nd order of succession and 4-5% for the taxpayer in the 3
rd order of succession or
not related to the testator.
Tax Tax Rate
Corporate Income Tax Corporate tax on retained earnings
10% 0%
Personal Income Tax 10%
Value Added Tax 18% general tax rate 5% preferential tax rate
9
Property Taxes
Property Tax 0.1% - 0.2%
Inheritance and Gift Tax 2 - 3% or 4 - 5%10
Sales Tax on Real Estate and Rights 2 - 4%

37
Regional Rural Development Standing Working Group in SEE
profit tax law. Macedonia has signed the Double Taxation Avoidance Agreements with 39 countries (39). 5.3 Property tax Property tax shall be paid on the ownership of real estate. The property taxpayer is the owner of the property. If the property is owned by several persons, each of them is a property taxpayer in proportion to the part owned. The property taxpayer is also the user of the real estate owned by the state and the municipality. The property tax base is the market value of the real estate. The market value is determined according to the methodology for determining the market value of real estate, as prescribed by the government. Property tax rates are proportional and range from 0.1 to 0.2%. Tax rates for property tax on agricultural land not used for agricultural production can be increased from three to five times in relation to the basic rates. A taxpayer paying property tax for a residential building or a flat, in which he/ she lives with family members, is entitled to a reduction of the calculated tax by 50% (39). 5.4 Personal income tax Personal income tax is a tax paid by individuals on the overall net income they earn from various sources in the country and abroad during a calendar year, excluding the tax exempt income. Tax exempt income, such as certain employment-related expenses, awards, scholarships, damages, alimony, certain types of interest and so on, is exhaustively listed in the Personal Income Tax Law. Taxable income comprises of personal earnings, income from self-employed activity, income from property and property rights, income from copyrights and industrial property rights and capital revenues including dividends and interest. Dividends are subject to 10% advance tax on the gross income amount, while the interest is subject to 10% tax on the amount of the calculated interest. Tax base is the positive difference from the gross taxable income obtained throughout the taxable year. The personal income tax rate is 10% (39). 5.5 Value added tax (VAT) The sale of goods and services for compensation in the country and the import of goods are subject to VAT. A VAT taxpayer is a legal entity or an individual conducting business activities on the territory of Macedonia. Taxpayers are obliged to register for VAT in cases when the total taxable sales during a calendar year, or when the projected taxable sales at the beginning of activities, exceed MKD 2,000,0000 (€ 350,000). Small businesses can register as VAT taxpayers at the beginning of each calendar year. If they decide to stay out of the VAT system, they are taxed as final consumers and do not have the right for a VAT refund. VAT base is the total amount of the compensation (money, goods, services and other benefits) received or to be received for the sales. VAT base for the import of goods is the value of the imported goods as determined under the customs regulations, increased by the amount of custom duties, taxes (except VAT), excise duties, fees and other import duties and related expenses, including commissions, packaging expenses, transport and insurance expenses up to the first delivery destination of the goods in the country. The general VAT rate of 18% is applied to all taxable supplies and imports, except to supplies and imports subject to preferential 5% (food, water from public systems, publications, seeds, fertilizers, materials for plant protection, plastic foil for agricultural use, agricultural machines, thermal solar systems and components, transportation of persons and their accompanying luggage and public cleaning services and waste management services). Certain sales are exempt from VAT with a right for a VAT refund for the VAT paid by the supplier, such as the export of goods, supply of goods to be transported or dispatched from the country to free zones, customs zones or warehouses, services related to import, export and transit etc. VAT exemption is also applied in the import of goods under the transit customs procedure, in the goods free economic zone or in free economic warehouse etc.

38
Regional Rural Development Standing Working Group in SEE
VAT credit is the amount to be reduced from the VAT that should be paid on the supplies made in a certain VAT period. The VAT credit refers to the VAT on supplies made by other taxpayers to the taxpayer and to VAT paid upon the import of goods (39).
Sub-sector taxation details - primary production All sales of agricultural products are taxed with 5% VAT, provided that the seller is not registered (most of the individual producers) as a VAT subscriber. In the case when the seller is not registered as a VAT subscriber, the VAT is not calculated. In cases when the producers sell the produce to a legal entity (consolidator trader) before the resale, the trader has to add 5% VAT if they are a registered VAT subscriber. If the trader is not a VAT subscriber, no VAT is calculated. In the case of direct export, VAT is not calculated. Unregistered VAT suppliers have no right to claim paid VAT on production inputs, including diesel. The vast majority of individual producers do not find it feasible to be VAT subscribers. When a producer or a trader is a VAT subscriber and is selling the produce with VAT included, the VAT shown in the invoices has to be paid to the state budget within a time limit, depending on the type of VAT registration. The VAT is paid without the possibility for postponement, regardless of late payments by the buyers. This is an important problem for farmer organizations and companies trading with agricultural products, as in this case, besides crediting the industry for the inputs, they are also crediting the VAT. Individual farmers pay approximately 2%
11 of personal income tax on registered income up to
the limit of € 5,000 for annual turnover and 10% on higher income. This provision is somewhat restricting for the growth of the individual producers who often try to sell through unregistered payments or on names of other family members.
Processing industry A VAT of 5% is paid to raw materials procured in the country. The processor can claim the paid VAT once the produce is exported or sold further down the domestic supply chain. The frequency of VAT claims depends on the VAT registration. In certain cases the VAT on procured raw materials is claimed back by the processor, prior to it actually being paid to the producer. The VAT paid on imported production inputs (bottles, corks, glass jars, cans, carton and plastic packaging and acetic acid) is 18%. When final processed products are exported, the VAT is fully reimbursed to the domestic processing companies. The personal income tax paid for permanent employees and seasonal workers is 10%.
II. SUB-SECTOR – WINE GRAPES AND WINE
1. DETAILED ASSESSMENT THE SUB-SECTOR: Macedonia has a rich wine tradition and accounted for two thirds of the total wine production in the former Yugoslavia. Most of the wine was exported within Europe and to the former Soviet Union and particular EU countries. With the emergence of independent Macedonia, wine production became slightly more nationally-oriented but the export-orientation on the traditional markets predominates. The combined grape and wine production contributes around 17-20% to the agricultural gross domestic product. Wine is the second most important product in terms of participation in the total value of exported agricultural products (2).
11
Although personal income tax of 10% is applicable, farmers are allowed a reduction of the tax base by 80% on
account of production costs, totaling to some 2% personal income tax on gross earnings.

39
Regional Rural Development Standing Working Group in SEE
1.1 Primary production Macedonia has a rich wine grape growing tradition which is a key agricultural activity in many regions in the country. The total area of Macedonian vineyards in production in 2010 was 20,700 ha with an average annual production of about 265,500 tons of grapes (24). Table grapes account for 3,100 ha of land (17). Some 75,000 tons or 28% of the total production are grapes sold fresh; including exports of table grapes (17,148,882 kg in 2010), wine grapes (14,518,814 kg in 2010) and dried grapes (1,444 kg in 2010) (24). The vineyards area has fluctuated over the last ten years between 30,000 and 20,000 ha, with an increasing trend in the last few years of about 1,000-2,000 ha per year. This development has to be mainly seen as a result of support measures provided by the government. These developments account for an increase of grape production by 7-11% per year (10). Vineyards contribute with about 5% of the total arable agricultural land, including about 30 ha of nurseries for the production of vine cuttings (2). The planting/grafting needs of the country are not met through domestic production (50,000 vine cuttings), leading to the import of some 1,000,000 vine cuttings/year from Serbia and Italy (10). Wine grape varieties account for some 70% of the total area under vineyards (white varieties with 40%, and colored with 60%), while the remaining 30% are table grape varieties (7). There are three vine-growing regions. The main one (accounting for 83% of production) is the Vardar (Povardarie) region, followed by the Pelagonija-Polog region (accounting for 13%) and the Pcinja-Osogovo region (accounting for 4%). The three regions are in turn divided into 16 sub-regions or the so called “vinogorja"
12. Productivity and quality vary according to local
conditions. Average yields are 9.7 t/ha (10), reaching up to 20 t/ha (12). The climatic conditions are more suitable for red grape varieties, although white varieties are cultivated on more than 50% of the total area (10). Wine grapes are grown on diverse soil throughout the country, with different cultivation conditions that result in some variations in the quality of the same sort of grapes. Macedonia possesses excellent terroir; a combination of soil, climate, sunlight, water and topography optimal for grape growing. The country enjoys 220 days of sunshine a year. The summers allow a lengthy ripening period. The temperatures contribute to a characteristic richness of color, flavor and alcohol. The cold winters offer a good recovery time for the vines. Graph 2.1: Grape production
Source: FAOSTAT
The soil composition-rich in minerals-is also very conducive for grape growing. The wine makers also benefit from the presence of different winds that protect the vines from diseases. There are almost 20 different wine varieties grown. The most common colored wine varieties with a long tradition of growing are Vranec (50% of red grapes) and Kratosija, and the most common white varieties are Smederevka (60% of white grapes) and Zilavka. There are also increasing trends for planting Cabernet Sauvignon, Merlot and Black Burgundy for red wines, and Rizling, Chardonnay and Sauvignon for white wines (10). The favorite grape (Vranec) is an ancient variety indigenous to Macedonia, Serbia and Montenegro. Vranec grapes are large and deeply colored and they produce a dry red wine. Most of the vineyards have suffered from longstanding under-investment. In the last decade,
12
http://balkanwineroute.com/en/WINE_REGIONS/index.php

40
Regional Rural Development Standing Working Group in SEE
private entrepreneurs started investing in vineyard renewal and wine production. Nationwide, most of the vineyards (about 60%) are more than 15 years old (10). The government started encouraging vineyard expansion and renewal by promoting the substitution of traditional vines, through the supply of quality and virus-free rootstock. Quality varies according to local conditions as the territory corresponds to a C III b vine-growing zone (according to annex III of EC Reg. 1493/99) characterized by a medium/low level of rainfall (400-600 mm/ year) (2). Grape harvesting is done exclusively by hand in all vineyards. On average, pickers are paid €10 to €15 per day. The wineries purchased the red wine grapes at an average price of €140-200 per ton whilst the white wine grapes cost an average price of €100-120 per ton. 1.2 Processing industry The total production of wine is some 900,000 hl. The production of red wine accounts for around 60% and the balance is made up by white wine (10). There are currently 86 registered wineries. The installed capacity of the wine cellars is 2.16 million hl or more than twice the annual wine production. The installed bottling capacity of 650,000 hl is insufficient to cover the whole domestic production but, since most of the wine is sold in bulk, a large part of the bottling capacity remains unused. 77 wineries have a capacity of 50 to 50,000 hI, five wineries have a capacity of 50,000 to 150,000 hI and four wineries have a capacity of 150,000 and 500,000hI (10). Small wineries tend to be started and managed by investors originating from outside the wine sector. These wineries tend to focus on the production of higher quality wines and compete on both the domestic and international markets of bottled wines. In recent years about 10% of these new small wineries have filed for bankruptcy protection. Graph 2.2: Wine production
Source: FAOSTAT
White wines generally have low acidity, liveliness and have no "terroir" characteristics. Red wines are generally a light to deep red color, nose dominated with red fruits, soft tannins, medium structure and short to medium finish.
Most of the wines have no defects. However, occasionally, low acidity, and oxidized wines are
notable, especially if they are older than 2- 3 years as corks are not adapted to long aging.
1.3 Trade
1.3.1 Wine Wine export contributes to about 13% of the total export value of agro-food products - mainly to EU markets (2). Exports of wine are generally increasing, apart from some fluctuations on account of impacted demand by the global economic crisis. A total volume of wine exports and the participation of bottled and bulk wine are presented in

41
Regional Rural Development Standing Working Group in SEE
the table below. Table 2.1: Structure of the wine exports (hl)
Source: State Statistical Office of Macedonia
The total wine export value ranges from €38.3 to 43.5 million, the average value of bottled wine exports (2007-2009) is €12.6 million, while the value of bulk wine in the same period was € 27.6 million. The value share of bottled wine ranges from 28% to 36%. The destinations for the wine exports per country are provided in the table below. Table 2.2: List of importing markets for a wine exported by Macedonia
Exports of wine 2007 2008 2009
Country Tariff number
Type Quantity (hl)
Value 1,000€
Quantity (hl)
Value 1,000€
Quantity (hl)
Value 1,000€
EU 27 2204 21 Bottled 8,904 1,072 9 1,205 5,991 941
2204 29 Bulk 484,547 15,947 390,648 13,711 409,125 15,316
Total 493,451 17,019 399,648 14,916 415,116 16,257
Serbia 2204 21 Bottled 54,668 6,519 69,776 8,427 54,7 7 5 7,192
2204 29 Bulk 195,58 7,919 121,708 5,608 105,207 4,736
Total 250,248 14,439 191,484 14,035 159,982 11,928
Croatia 2204 21 Bottled 15,692 2,579 14,674 2,669 11,061 2,135
2204 29 Bulk 83,663 5,295 74,06 7 5,273 71,331 5,309
Total 99,355 7,873 88,742 7,942 82,392 7,444
Russia 2204 21 Bottled 6,181 464 3,095 243 2,232 215
2204 29 Bulk 42,386 931 245 11 0 0
Total 48,567 1,395 3,341 254 2,232 215
Bosnia and Herzegovina
2204 21 Bottled 4,514 714 3,433 595 2,677 531
2204 29 Bulk 1,293 93 435 50 1,961 130
Total 5,808 806 3,868 645 4,638 661
Total wine exports
2204 21 Bottled 95,41 12,24 105,378 13,992 80,94 11,803
2204 29 Bulk 831,424 31,328 597,995 25,179 606,747 26,551
TOTAL 826,818 43,568 703,373 39,171 687,686 38,354
Source: State Statistical Office of Macedonia
For more details on wine exports please see Annex 1 and 2. The average price per litre of bottled wine exported is between € 1.35 and 1.56. Over the last five years there was an average annual increase of 2.2% in the price per litre of bottled wine, while the price per litre average increase for bulk wine was 2.6% per year. These
2006 2007 2008 2009 2010
Total export (hl) 826,818 926,834 703,373 687,685 700,167
In bulk (hl) 746,62 831,423 597,995 606,746 599,24
Share (%) 90,3 89,7 85,0 88,2 85,6
In bottles (hl) 80,197 95,41 105,378 80,939 100,927
Share (%) 9,7 10,3 15,0 11,8 14,4

42
Regional Rural Development Standing Working Group in SEE
increases are probably less than inflation, so the real value per litre of both bottled and bulk wine exports did not increase, or maybe even decreased, over the last five years. The export to the EU Member States for 2010 was 323,737 hl, representing 46.24% of the quantity of wine export amount and 32.7% of the total export value. The export to the EU (2010) covered 51.3% of the total export in bulk and 14.8% of the total export of the wine in bottles, or 7% of agricultural food products exports to the EU (7). Graph 2.3: Wine exports
Source: FAOSTAT
With the signature of the Stabilization and Association Agreement (SAA), a duty-free quota of wine export to EU was granted, consisting of 300,000 hl, out of which 285,000 hl refer to bulk wine, and 15,000 hl to quality (bottled) wine. An annual transfer of 6,000 hl from the bulk wine to the quality wine quota was also agreed upon. The last EU enlargement with the inclusion of two new Member States (2007) led to an increase of the duty free quota for the export of Macedonian wine to the EU to 399,000 hl (of which 332,000 hl was wine in bulk and 67,000 hl was wine in bottles in 2010). The duty free quota for the export of Macedonian wine to the EU peaked at 81% of its potential total, whereupon the wine in bulk quota reached 93%, and the quota for export of wine in bottles reached 22% (7). The main export destination within the EU is Germany (90%) while other destinations, for example, include Slovenia, the Czech Republic, Bulgaria and Poland (10). Exports to Germany are exclusively bulk red wine sold for an average net price ranging between 0.3 and 0.35 per liter. The white wine which Macedonia produces is too sweet for EU consumer tastes and is only sold in the neighboring region. Few companies manage to export to Germany. Seven German firms (from Munich, Augsburg, Cochem, Nuremberg and Hamburg) import the bulk wine. In Germany, the wine goes through a process of blending, filtering and filling in tetra packs. The wines are then distributed through the distribution channels and sold at prices ranging from €0.84 to 1.15 per litre.
The second most important destination for the export of Macedonian wine is the CEFTA countries, out of which Serbia participates with 27% of the total export and Croatia with some 13% of the wine exports (10) The export to Serbia and Croatia comprises of red and white wine, both in bulk and bottled, at an average price of €0.75 per litre. Serbia imports 30% of its quantity as bottled wines, and continues to be the top importer of bottled wine purchases, representing some 60% of the total quantity and value of bottled wine exports (10). Croatia is the second largest destination for bottled wine, importing 15% of the total quantity of bottled wine exports. 15% of Croatia’s total imports of wine from Macedonia are bottled wines, representing some

43
Regional Rural Development Standing Working Group in SEE
16% of the total exported bottled quantity from Macedonia and 19% of the total value of bottled wine exports (10) The upcoming EU accession of Croatia in 2013 is expected to have a definite impact on the export of bulk wine to Croatia. Other countries participating in the export quantity are Russia, with 2,232 hl of bottled wine (10) as well as exports of small quantities of premium wines with protected designations of origin/protected geographical indication (PDO/PGI) in Norway and Japan and the UK. The Macedonian wine market, though formally open to the EU after signing the SAA, is still not attractive for European exporters. Imports of wine inside Macedonia remain small (2,400 hI) with 1,002 hI originating from EU countries. The domestic market represents around 85,500 hI or around 9% of the total production. The annual consumption of wine is estimated to be 15 litres of wine per citizen per year (10). 1.3.2 Grapes The purchase of grapes is carried out by the wineries at some 160,600 tons of grapes, annually. The production and export price increased slightly over the last decade. Approximately 31,682 tons (2010) of grapes are exported from Macedonia, valued at €9,428,433. 14,518 tons (2010) of wine grapes as raw material for vineries in the region (Montenegro, Serbia, Bosnia and Herzegovina and Croatia) are exported, in addition to 17,148 tons of table export grapes for the fresh markets. Graph 2.4: Grape exports
Source: FAOSTAT
The export of wine grapes is carried out through a network of buyout traders operating as service providers (measuring, distributing packing materials etc.). The prices are set mainly based on sugar contents. Table 2.3: List of importing markets for grapes exported by Macedonia
Importers Exported value in USD Thousands
2007 2009 2011
World 15,370 9,908 16,555
Serbia 10,516 5,886 9,210
Albania 1,018 835 1,269
Montenegro 836 1,039 1,184
Bosnia and Herzegovina 560 830 1,139
Croatia 602 693 1,041
Czech Republic 0 17 695
Romania 493 299 542
Russian Federation 31 165 273
Lithuania 0 0 266
Latvia 0 0 143 Sources: ITC calculations based on UN COMTRADE statistics

44
Regional Rural Development Standing Working Group in SEE
2. SUPPLY CHAIN DESCRIPTION
A schematic of the supply chain for wine, including stakeholders and parties who directly support or have an effect on the performance of the chains, is depicted below. The interdependency in the supply chain is significant due to a lack of capital from the processors and the long delivery and payment arrangements between the processors and the importers/buyers of the products. Most of the actors in the supply chain (from right to left) depend on credit from each other, making the interdependency even more significant.
Source: SWG
The wine sector is diverse, and the schematic above is a simplified version. The development is in both the horizontal and vertical axis of businesses’ activities, with many of the larger processors venturing in vertical development towards the bottom of the supply chain. The graph shows the formal and informal linkages along the supply chain.
Source: SWG
Supply chain role-players
Banks and lenders
Ministries and payment agencies
Retail input shops
Horizontal associations and organizations
Insurance agents
Certification bodies
Government inspections
Export and business promoters

45
Regional Rural Development Standing Working Group in SEE
2.1 Supply chain actors
2.1.1 Regulators of the supply chain Wine in Macedonia is produced according to the Wine Law and some wines are registered with PDO/PGI, complying with the relevant regulations of the EU. According to the law, MAFWE is the governmental body responsible for the wine sector. Its responsibility ends when the wine is marketed/exported. The Food Agency and State Market Inspectorate control the local markets. A strategy for the sub-sector has been developed by the MAFWE. Besides MAFWE, there are other role-players with competence in the wine sector: 1) The Vine and Wine Department of the Agriculture Institute, is a public scientific institution
under the Ministry of Education and Science. It carries out varietal research and the registration of specific wines. The department includes an oenological laboratory where the chemical analysis of wines is carried out. The oenological laboratory is the only institution currently authorized by the MAFWE to conduct wine analysis and to issue certificates for wine exports. The laboratory is also recognized by the EU as the official laboratory for issuing wine export documentation (art 29 of EC R883/2001 - list 2003/C 93/02). The oenological laboratory is not internationally accredited and recognized as a reference body for controlling wine.
2) The Department of Viticulture and Oenology at the Faculty of Agricultural Sciences and Food at Skopje University consists of four tenured professors but there is still no specific curriculum devoted solely to the wine industry.
3) The National Wine Tasting Commission is responsible for the organoleptic assessment of the quality of wine, which is necessary for the MAFWE to issue certificates for the placing of the wine on the market.
2.1.2 Agriculture input suppliers Wholesale input suppliers are producers/packers/importers of different agricultural inputs. They rely on a network of agricultural pharmacies for the distribution of the inputs to the agricultural producers. Some wholesalers are involved in retail operations, while some retailers are involved in import operations. Most of the wholesalers are heavily crediting the retailers, while they are credited by banks. On the other hand the retailers are heavily crediting the farmers involved in grape production. The payment for inputs after the receipt of funds from the wineries (20-30% higher cost) is a common and acceptable practice for the farmers, further increasing the overall production price. 2.1.3 Producers The producers are largely individual, small-scale, farmers (70%) and some 30 legal entities (30%) producing on estimated 61,000 cadastral plots. The estimated number of farming households owning vineyards is some 25,000. Typically, small farms own 1.2 ha split into one and five vineyard plots having an average size of 0.36 ha with one to three grape varieties (10). Some 90% of the individual producers share the specifics of a uniform socio-economic group. The remaining 10% show different operational patterns usually associated with small and medium companies. In the Tikvesh region about 90% of the producers are professional grape producers, operating within a supply chain adapted to the late payments. The remaining 10% have diversified production, usually combined with fruits and vegetables. In other regions, such as Valandovo/Gevgeija and Pelagonija/Polog, the wine grape is often dominant but one of a few high value crops beside early and open field vegetables and fruits. Farmers in general have reduced living expenses and depend on funds from the cash crops for covering basic needs.

46
Regional Rural Development Standing Working Group in SEE
Reinvestments in the modernization or enlargement of the grape production is limited, investment in development and, at times, in the upcoming season’s production are often credited. The legal entities producing wine grapes are usually on leased state-owned land. Their productions plots average 2.1 ha in size and have varietal homogeneity. Some companies are involved in very sophisticated production through heavy investments, taking agriculture to a new level. Others are using outdated mechanization, production practices and habits. In recent years the government has leased agricultural land to individual farmers in lots of up to 10 ha/household. The majority of the recipients in the wine growing regions are planting vineyards on 30-50% of the land (on average), and establishing orchards or farming other crops on the remaining area. In addition to the household labor of the small individual producers of grapes, an estimated 15,000 seasonal workers attend to the annual harvesting of the grapes. Larger individual producers, and especially the legal entities, are heavily dependent on the seasonal workforce for the harvesting of the grapes. All interviewed producers are generally unsatisfied with the prolonged waiting periods (between 6 to 36 months) for payments on delivered grapes and on low farm gate prices. The "Makedonska Loza National Alliance of Vine-Growers and Wineries", an Association of Vine and Wine producers, is attempting to organize a large number of vine-growers associations and wineries with the aim of protecting their interests and developing the revenues of the sector. In recent years the Farmer Organizations are more actively engaged in the negotiations for the grape buyout prices. 2.1.4 Buyout traders Buyout traders are legal entities often operating as family businesses. Most of them spawned during the country’s transition and supplied the services that were lacking. Buyout traders are assisting the buyout for foreign vineries. Buyout traders are permanently located at logistically relevant locations and operate weighing and packing equipment. Buyout traders provide services for the end buyers and pay immediately in cash, influencing the increase of the buyout prices. Farmers who sell to traders for export waiver the entitlement to subsidies on the quantity of grapes delivered to local vineries. Since the introduction of subsidies for wine grapes, buyouts have increased the prices, leveling them with payments by the wineries. 2.1.5 Processing industry The wineries can be divided into large vertically integrated processors, exporting both bulk and bottled wine (priced less than €2-3 per bottle), and recent startups aiming at premium bottled wines (priced at € 2- 4). A smaller number of wineries focus on the super-premium segment of bottled wines (€ 5.4 to 9.8). Close to 1,200 people are employed by the wineries annually. In the last decade the wine industry has witnessed the appearance of a variety of large and small wineries producing wines of different quality, flavor and consistency. Wineries in the last decade have introduced stricter quality control, have limited the types of grape varieties accepted, mainly aiming for the best indigenous and international varieties, and have invested in the modernization of their operation. As a result the quality of wines has improved in the last decade. The bulk wine production is generally aged in stainless steel tanks. Some of the wineries have also invested in oak barrels (imported from Serbia, Bulgaria or France), for the production of premium bottled wines. The largest winery in the country is Tikves AD, which in addition to Povardarie – Negotino and Vinojug – Gevgelija, dominates in terms of capacity. The annual processing capacity of the largest winery is about 50,000 tons of grapes or 35 million liters of wine, although the capacity is currently underused. In 2005, an association named "MakVino" was created with the aim to organize the wine processing industry, promote Macedonian wines and assist in defining a wine strategy.

47
Regional Rural Development Standing Working Group in SEE
2.2 Current constraints and limitations The major constraints of the key actors in the sector are explained below.
2.2.1 Producers Although generally considered to be small, the production of the farmers is adapted to their home labor and land availability. Farmers have been affected with interchanging demand for the local and imported varieties, making them reluctant to invest in the renewal/expansion of their vineyards. In recent years the subsidies have shown to be improving the situation, assisting farmers to professionalize and increase their production. However, after the introduction of the subsidies, the buyout prices for wine grapes have generally decreased. The grape growing sector has no strong representative bodies capable of defending the interests of the grape growers, establishing grape production criteria suitable for quality production or defining a marketing strategy for increasing grape growers’ revenues. The organization of farmers, although a declarative priority, is in practice not high on the agenda of the government, the processors or the input suppliers.
2.2.2 Processors Most of the interviewed parties agree that the Macedonian wine cluster is significantly below its full potential due to the following main constraints on the processing industry:
Lack of capital and dependence of the whole industry on payments from the end buyers, seriously affecting the whole supply chain
Lack of promotion on international level. Most of the wineries are too small to be visible or to develop a brand image. There are also no generic export marketing and promotion plans on a national level The export support organization helping companies to present themselves professionally at international fairs produces limited results. Marketing of Macedonian wines has no public support or market analysis identifying the international positioning in the world arena (where to sell, in which price segment, for which consumer category etc.)
Low prices on wines, as “value for money” at EU markets is actually lower than at the domestic and regional markets. This results in small export quantities of bottled wines
Fluctuations in consistency of the quality due to the need for further modernization and lack of experienced and good oenologists. Comprehensive advice about all aspects of wine technology to be used for consistent wine quality is still scarce

48
Regional Rural Development Standing Working Group in SEE
2.4 Solutions for the identified constraints and limitations The table below lists the compounded constraints and limitations and ways to address them, as identified through the interviews. No long-term or non-solvable issues were identified.
3. SWOT ANALYSIS
The following sub-chapters illustrate a SWOT analysis based on the above factual assessment of
the sector, taking into account
EU accession and the ultimate goal of preparing the sector for participation in the EU market and
building up the capacity to resist the resulting pressure of competition.
3.1 Primary production
3.1.1 Strengths
Old vine growing tradition in addition to good climatic conditions
20,900 ha currently planted
Cost of seasonal labor is low
80% of the vineyards are owned by individual agricultural holdings
Grape production has been stable for the last decade at around 265 000 tons
The government is financially supporting the plantation of new vineyards and the
maintenance and renewal of the existing vineyards
A cadastre system dedicated to vineyards has been established
Grapes are demanded locally and regionally and the existing varieties are adapted to the
demand 3.1.2 Weaknesses
More than 60% of the vineyards are older than 15 years
No long-term agreement with wineries for grape purchases
Fragmented growers' industry is (on average, 80%) concentrated in the Tikves region
Farming practices not up to international standards
Grape varieties are not internationally prominent 3.1.3 Opportunities
Total potential for new vineyards is around 40,000 ha
Constraints Why does this prohibit exports How can this problem be solved
No long-term export marketing plans for wine
Incidental support for SMEs, in-sufficient for positioning at the market
Develop a strategic export marketing program for wine at national level
Value of quality wine is underestimated in the market
Good wine has low price in the EU; no incentive for export when compared with domestic prices; the government stimulates small producers growing grapes for cheap wine production
Marketing and promotion and venturing into niche markets for high quality wine in EU; participation in wine contests for positioning of Macedonian wines; consistent promotion and building of brand image Study tours / exposure to markets; support with promotion materials and good information for customers
No coordinated promotional activities, low visibility and brand image
Most SMEs are too small for effective promotion and individual marketing
Lack of contacts with wine distributers and importers/wine houses for high quality wine
No distributors and contacts results in no business
Participation at international fairs; matchmaking meetings with EU and regional partners; Support in trial shipment/follow-ups
Lack of improved wine technology
Local experienced oenologists in order to create good wine of consistent quality are scarce; no turn-key / comprehensive technology packages
Training by oenologists and consultancy services available; Study tours to well organized EU wine institutes and wineries

49
Regional Rural Development Standing Working Group in SEE
Further introduction of drip systems, anti-hail nets and modern cultivation practices are resulting in improved quality and yields
3.1.4 Threats
To expend existing vineyards without developing the wine sales
3.2 Processing industry
3.2.1 Strengths
Macedonia has a long tradition for winemaking
New modem equipment is becoming more widely available in the vineries
Existence of a Wine Producer Association
Excess supply on the market keeps grape prices low
Both "autochthonous" varieties (smederevka, zilavka, vranec, etc.) as well as internationally
renowned grape varieties (Cabernet Chardonnay, etc.) are available
Large share of the total production is exported
Macedonian wine is well-known and accepted in the region
The sub-sector is well regulated
Low overall labor costs
Agricultural sector is a priority for the government
3.2.2 Weaknesses
Insufficient organization of the industry, leading to lack of co-operation for export and
increased costs for production sales and logistics
Few companies control a major part of the wine production
Need to further modernize the equipment for filtration, stabilization, bottling and labeling
Price differentiation between grape qualities (only based on sugar level)
Packing is imported
Import of corks needs to be diversified and improved
Wine export is predominantly (85%) in bulk
Confusion between collective brands and private brands (e.g., Tikvesh)
Labeling is based on confusing "quality categorization" legislation
Some companies lack the human resources and technical preconditions to meet legal
requirements
Wine Tasting Commission works without clear rules and standards
Many wineries are still too small in size for significant impact
Domestic market is limited as traditional household wine production is
embedded in the culture
Chronic lack of capital in the industry and limited availability of capital for financing of startups
High transportation costs for imported inputs (packing)
Poor handling of the grape during delivery process in some wineries 3.2.3 Opportunities
Domestic market is undeveloped and could absorb a larger quantity of quality wines
Good investment incentives for foreign investors and favorable taxation policy
Retail structures expand rapidly, demanding development and diversification of the wine
industry
Relatively high consumption per capita
A free trade agreement with EU and other non-EU countries
3.2.4 Threats
To push the wine sector into selling in bottles with too small a market to absorb the
production

50
Regional Rural Development Standing Working Group in SEE
The wine industry is strongly protected via high import duties amounting to 45-50%
Cheap imports may flood domestic and regional markets once import tariffs decrease
Domestic retail structures might be saturated soon
Natural calamities impacting the production 4. COMPARATIVE ADVANTAGES
4.1 Primary production
The cost of land in Macedonia is around € 3,450 /ha, while the cost of vineyards in prime condition is up to € 8,000 , the low prices are comparative compared to the neighboring countries
The quality of the produce is high and is demanded on the local and regional markets
Regional competitors sourcing raw materials from Macedonia have significantly higher costs of raw materials because of transport costs
The average farmer is experienced and willing to invest in agriculture, provided that he/she is treated fairly
Both the official and crediting system are available and are supporting the wine sector
The low average wages on national level contribute to the low cost of produce from a very labor intensive crop
The policies of the government are providing significant support for the primary producers
Complementary support policies such as favorable rural loans for producers are provided, special welfare schemes for farmers and benefits for farmers in the tax policy are available
Investments in grape production on government-owned land offer very cheap lease rates for land on long rental periods with accompanying infrastructure, such as irrigation
Large areas under industrial or cereal crops with irrigation facilities are a potential for further development of the grape production
4.2 Processing facilities
The raw materials base remains the predominant advantage for the sector, it consists mainly of autochthonous varieties which provide a basis for an original product
Macedonia is a traditional producer of wine with decades of experience
Most of the processing facilities in the country are underused and their capacity by far outweighs their production output
The development of the quality offers access to the vast markets of the EU27, Russia and so on, countries that appreciate the produce as long as the quality keeps on improving
The government policies are providing support to the sub-sector by subsidizing raw materials channeled through the processors rather than towards export.
5. INVESTMENT POTENTIALS
5.1 Primary production The investment potential in new vineyards/primary agricultural production is limited due to the fragmentation and private ownership of land. Although possible, such investments are feasible mainly on government-owned land. Foreign investors interested in primary production, can apply through locally registered subsidiaries on public tenders for the concession (leasing) of agricultural land. Foreign investors can also submit specific proposals for investments. Continuing technical and logistical support in the administrative procedures for foreign investments is provided by the agency for foreign investments. There are a number of large grape producers (with up to 1,000 ha) supplying the wineries, which could be of interest to investors. This may involve the purchasing of these companies, as well as partnerships connected to investments in the modernization of the production (drip irrigation, mechanization, hail protection etc.) or adding value to the raw material (processing/winery). Most interviewed primary producers are willing to consider any investment proposals that may support their competitiveness.

51
Regional Rural Development Standing Working Group in SEE
Investing in the trade of the primary supply of wine grapes is feasible through the organization of small producers, mostly when grapes from indigenous varieties are targeted. If specific (other than the indigenous) varieties are sought, investments in private vineyards are more feasible. This investment model has been followed by most of the successful wineries, ensuring the supply of premium grapes for special wines. 5.2 Processing facilities The investment potential in the wine industry is significant; however, it is feasible only for investors able to dedicate efforts and funds to improving the quality of wines. Appropriate linkages and experience with market outlets are recommended prerequisites for investments in the wine sub-sector. Most of the local companies have a chronic lack of turnover capital and weak market outlets with little value added. Most interviewed processors are willing to consider investment proposals by foreign investors. Investing in new processing facilities is also possible. Establishing appropriate relationships with primary producers or investments in private vineyards can guarantee an ample supply of raw materials at competitive prices. The government provides support for the establishment of new wineries (see chapter 4.2.2.). The financial support of the government is also inclined towards the refurbishment and modernization of the existing facilities. Buying or investing in the existing vineries may be considered. The capacity of the wineries ranges significantly, making the sector open to a variety of investments. The equipment in the large facilities tends to be of old design adapted for the production of large bulk quantities of wine. Smaller vineries are equipped with new/modern equipment.
6 MARKET OPPORTUNITIES
There is a slow but continuous increase in the demand for Macedonian wine by foreign buyers, evident from the growing capacity of the wineries, the consistent output of production and the stable exports. There are two distinct market segments: bulk and bottled wine. The bulk wine is well known and sold at low prices. As such it faces little market constraints in the traditional and new markets in the region and further afield. The major strategic challenge for the wine cluster is the substitute of exports in bulk with exports of bottled wines. There has been a slight development in this direction in the last decade. The large bulk wine competitors have left plenty of room for bottled wine to obtain market share on foreign and domestic markets. Selling wine in bottles, even in smaller quantities, is a prospect for the industry. The difference in price between bulk and bottled is more than three times, suggesting that there is an opportunity for significant improvement in income generation if significant quantities of bulk are shifted to bottled wine. This implies improvements in the quality of wine and substantial marketing efforts for exporting branded bottled wine. Regional exports are almost as high as EU export, however, it is higher in value per unit sold.
Exports to non-EU countries such as the US, Russia and Ukraine are also increasing. Serbia continues to be the largest importer of wine, followed by Croatia, Bosnia and Herzegovina and Montenegro.

52
Regional Rural Development Standing Working Group in SEE
Graph 2.5: List of importers of wine in 2011
Source: ITC calculations based on UN COMTRADE statistics
Macedonia’s immediate region provides an actual and potential consumer market of around 30 million people. As a whole, South Eastern Europe is a market of over 80 million people. On EU export markets, the developments will be based on increasing information about the quality wine, and facilitated due to the preferential trade agreements. The quotas imposed by the EU at present are somewhat restrictive (bulk wine exports), however once the country joins the EU, significant new markets (Eastern and Central Europe) will be more easily accessible. Graph 2.6: Prospects for market diversification for wine exported by Macedonia
Source: ITC calculations based on UN COMTRADE statistics

53
Regional Rural Development Standing Working Group in SEE
6.1 Competitors in the market
6.1.1 National market On the domestic market the consumption is expected to increase due to disposable income, sale through supermarkets i.e. wine of high brand recognition and medium to low prices. Macedonia’s per capita annual wine consumption decreased from 23 to 15 l/inhabitant in the last decade. This consumption is still higher than that of some major wine producing countries, such as USA (8 l) and Bulgaria (11 l). At the same time, Macedonian consumption trails behind that of Chile (16 l), Australia (19 l) and some neighboring countries, such as Serbia (18.94 l), Croatia (47.21 l) and Slovenia (39 l). The local demand is unsophisticated as the customers focus on price rather than quality. 6.1.2 Regional market The Macedonian wine is well established in the region, well known and appreciated, and market opportunities, especially for bottled wine of high brand recognition and medium to low prices, exist. Prices of good quality wine are relatively high in the region, due to a lack of foreign competitors as a result of high tariffs for wine imports. On the regional export market, some countries, such as Croatia, have a strict import quota for wine (bulk as well as bottled). With the accession of Croatia the quota will merge with the EU quota. Albania and Kosovo* import large volumes of wine, especially from Italy, as Albanian wineries struggle with their poor image. Countries within the region compete with each other (e.g. Vranec wine from Macedonia and Montenegro, although Montenegro is buying raw materials from Macedonia). To date, this has not been a problem and the reputation of Vranec wine in Russia has benefited with the export from both countries. Inconsistent quality and the copying of brand names and bottles can occasionally harm the reputation of wines of indigenous varieties. Graph 2.7: List of exporters of wine in 2011
Sources: ITC calculations based on UN COMTRADE statistics

54
Regional Rural Development Standing Working Group in SEE
6.1.3 EU, CIS and other markets The largest export of wine is in bulk from Macedonia to Austria and Germany (i.e. at Aldi and Lidl), where it is bottled and sold as their house brand. The export of wine from smaller wineries is still relatively low. Currently, extra costs and efforts to export to the EU do not outweigh the benefits in comparison with the margins and prices on the domestic and regional markets. Yet most of the private and relatively smaller wineries are interested in export and expanding their markets towards the EU. The EU produces more than half of the world’s wine (55%) and exports a substantial percentage of that. The Eastern European countries (including Russia) account for 11%. Yet the EU consumes about 65% of the global wine production, providing ample potential for the export of wine to Europe. The EU consumes much more wine than it could possibly supply through its own production. The UK and the Netherlands, for example, import practically all the wine they consume. Also, wine producing countries, such as Germany, import much of what they consume. Wine consumption in the Netherlands has grown considerably during the past 10 years, due to the increasing perception of its health benefits. The Polish wine scene is still relatively young but wine sales are rising rapidly. South America (i.e. Chile, Argentina), USA, India, South Africa and Australia are important non-EU competitors. 6.1.4 Competitors in primary production Macedonia doesn’t have significant competitors for the production of raw materials in the closer neighborhood. Although both Serbia and Croatia are large producers of raw materials, they depend on imports.
7. SUB-SECTOR GROWTH POTENTIAL
7.1 Size and productivity Despite some negative trends in recent years, mostly due to the global economic crisis, the sector has significant growth potential. The tradition and experience of the farmers and processors, as well as the climatic conditions, offer significant potential for development where additional value can be added. The price of agricultural land and the continuous increase of the share of irrigated land allow for a significant increase of the area planted with grapes. The experience in grafting new varieties demanded on the market, rather than establishments of new plantations, offers further growth potential with reduced investments. Local investors are utilizing all chances to acquire government-owned land and invest in vineyards. The interest is very high at the government-organized auctions of land. The processing sector has double capacity compared to the available raw materials, however, it lacks the approach, funds and dedication to utilize the market opportunities. Recent advances have shown that there is more room for growth in added value processing, including bottling, rather than in bulk wine. Investors from within the wine sector with expertise in quality control and marketing, who can optimize the significant quantities of raw materials, cheap labor and favorable investor climate, are more likely to prosper. Reasonable improvements in the way the producers of raw materials are treated by the buyers can easily account for the growth of the local industry by some 15,000 tons of raw materials which are currently being exported in the region. 7.2 Labor and skill available locally, and improvement possibilities Macedonia presently offers an ample supply of relatively cheap labor for both grape and wine production. However, the wineries have problems finding adequate numbers of skilled

55
Regional Rural Development Standing Working Group in SEE
managers, oenologists, marketing personnel and people with international commercial expertise. The average monthly gross wage in the wineries is approximately € 346. Seasonal wages are between € 6 and 15/day, depending on the region, the producer, and the type of operation involved (pruning, harvest, loading etc.) It seems that despite the ongoing rural aging and migration, labor shortages might in the next decade impact the raw material production more than the wine industry. In terms of primary production most farmers seem to be more interested outside of the agricultural sector. However, a significant characteristic of the Macedonian farmer, which was inherited from the former system, is his/her involvement in agriculture in addition to employment. Although this means production of smaller sizes, it is unlikely that all members of the households will have jobs and will fully abandon the agricultural production of cash crops. A significant characteristic of the sector is the dependency on seasonal labor for the harvest. Prices of seasonal laborers have been on the increase in the last few years, however, no notable lack of workers is evident. In the case of large, non-agriculture industrialization in the regions where grapes are produced, the labor flows may somewhat be negatively impacted. Very few mitigation measures in the form of the use of improved and specialized mechanization aimed at reducing labor have been noted. 7.3 Storage and transport capacity Macedonia's transport infrastructure consists of two major corridors, running from south to north and east to west, and crossing at Skopje, the capital. Although a landlocked country, Macedonia benefits from a strategic geographical position at the crossroads of two major pan-European transportation corridors (corridors VIII and X) linking Central Europe to the Adriatic, Aegean and Black Sea. Macedonia has an extensive network of paved highways and secondary roads. The road network is generally of better quality than in most Eastern European countries. The railway network extends over 900 km. The principal north-south rail connection from Belgrade to the port of Thessalonica (Aegean Sea) passes through Skopje. Macedonia has two international airports (in Skopje and Ohrid). In March 2010, the Turkish airport operator TAV took both airports under concession for a 20-year period with objectives to upgrade the existing facilities already in process. The transport of wine to the region, Western Europe or CIS countries in general is not a constraint, both for bottled wines as well as bulk quantities wines. The trade routes and the logistics are well known and established both in terms of roads or rail. The storing capacity of the wineries in Macedonia, as already mentioned, is twice larger than the annual production. Wine is stored mainly in stainless steel tanks providing for appropriate storing conditions, however a part of the tanks are outside facilities which might diminish the quality during long periods of storing. Some hindrance is experienced in the transport of wine grapes for regional processors, due to administrative formalities and the high volume of cargo exported at the peak of the season.
Most of the participants in the study underline that the current primary sector was designed for a much larger market and therefore the production, however it is plagued by problems and lack of capital, is able to meet the increased demand by the processors. Provided that planting of new varieties are not a precondition, growth possibilities in the primary sector are evaluated at up to 10% in midterm. The processing sector has sufficient capacity to grow, as its capacity is double that of the production. However, provided that funding problems for the sector/branch are resolved and that more value is added, it can also contribute to the growth of the primary sector.

56
Regional Rural Development Standing Working Group in SEE
8. PRODUCTION AND PROCESSING RELATED INPUTS
8.1 Primary production Most of the inputs used by the primary producers (seedlings, fertilizer, fuel, plant protection, drip systems etc.) are imported, including most of the agricultural machinery. Few inputs, including planting material and simple agricultural implements (plows, planting machines, disc furrows etc.) are produced by local commercial suppliers. The producers do not face any problems in accessing any production inputs. 8.2 Processing industry The wineries import the bulk of their required bottles from manufacturers in Croatia and Bulgaria. The average price for a 750 ml bottle ranges from € 0.2 to 0.3. Corks are purchased from Portugal, Italy and Greece and the price varies between €0.05 and 0.3 per piece, depending on the quality. For the most part, wine production equipment is supplied by Italian manufacturers (Gimar, Enoventa, Cavalzani, Siprem, and Spadoni). The overall prices that Macedonian wineries pay for importing technology and equipment are slightly above the global industry average.
9. ESTIMATED INVESTMENT COSTS PER SIZE OR OUTPUT UNIT AND ESTIMATED
CURRENT RETURN ON INVESTMENT FOR EXISTING OPERATIONS
The estimated profitability and investment costs for primary production are based on data from average small agricultural producers, which represent the majority of the raw material suppliers. The estimated profitability and investment costs for the processing industry is based on data from small startup processors which have gradually increased their capacity.
9.1 Profitability
9.1.1 Raw material production The profitability of the primary production is highly dependent on the investment costs and the yields. The average markup for wine grapes based on the data from the interviews is some 30% (4 -5 MKD/kg € 0.08-0.09), while the subsidies from the government account for an additional 40% (5-6 MKD/kg € 0.9-0.1) on the average farm gate price (12 MKD/kg, € 0.2 in 2010). The provided costs do not take into account the estimated wages of the individual producers and their household residents. On average, for planting a new vineyard on 1 ha, an evaluation of the total investment is 7,000- € 7,500. 9.1.2 Processing industry Profitability varies across the cluster, depending on company structure, management, production and operations. However, in general, the markup margin is as low as 5% for bulk wines, to as high as 40% for high quality bottled wines. The investment costs for small size wineries (400,000 l on 300 m
2), based on the feedback
from the interviewed processors, is estimated at € 0.6-0.7 /l of installed capacity, whereas € 400/m
2 (€ 0.3/l) for the facilities and € 0.37/l for equipment (Italian make).

57
Regional Rural Development Standing Working Group in SEE
III. SUB-SECTOR – INDUSTRIAL AND PROCESSED VEGETABLES
1. DETAILED ASSESSMENT OF THE VEGETABLE AND PROCESSING SUB-SECTOR
1.1 Primary production Macedonia is renowned for its vegetable production and processing which is one of the main generators of employment and revenue in rural areas. Vegetable production, as an agricultural branch oriented towards export, participates in the export of agricultural products in two significant segments: Export of fresh vegetable and export of vegetable products (preserved or processed). The production of vegetable crops is divided into early vegetable production in protected areas and open field production mostly intended for the processing industry. Table 3.1: Vegetable production in Macedonia
Type Areas in ha Share in % Production in tons Share in %
Glasshouse production 216 0.50% 26 334 2.7%
Plastic tunnels production 3 832 8.25% 196 406 20.2%
Open field production 42 366 91.25% 751 615 77.1%
Total 46414 100% 974355 100%
Source: MAFWE
The open field production of vegetables is traditionally dispensed over the entire territory of the Republic of Macedonia, with an emphasis on certain products in some regions. The open field production is mainly sold for the local market, out of which a large part is destined for the processing industry. In 2010 the processing industry purchased approximately 10% of the total production of 751,615 tons of vegetables (7). The individual sector (individual farming households) cultivates 97% of the vegetable producing area. Vegetables are produced on 9% of the total agricultural land on plots with an average size of 0, 21 ha. Approximately 28,000 agricultural holdings are involved in the vegetables sub-sector, with around 109,000 in full-time employment. The most important crop for the processing industry is the pepper crops. Due to this fact this survey focuses only on the primary production on this crop.
1.1.1 Pepper Several types of peppers are produced in the country. Most are destined for processing (home processing and factory processing), while a smaller number is sold for fresh consumption. By far the most important variety is the red industrial pepper. Pepper on open field is produced on some 8,474 ha or on 20% of the open field production. The yield was 168,150 tons in 2010 and the average yield per hectare on a national level is 19,843 kg/ha (24). Graph 3.1: Pepper production

58
Regional Rural Development Standing Working Group in SEE
Source: FAOSTAT
The total production area has increased over the last ten years. Pepper is considered a very
competitive crop, and one of the top five export vegetables in the EU. Graph 3.2: Pepper production and export price
Approximately 13% of the pepper production is exported as fresh. The export of pepper reached its peak in 2008 both in kg and value. The slower growth of pepper exports in the last decade is a result of the growing processing industry and subsidies stimulating sales to local processors.
Source: FAOSTAT
Graph 3.3: Pepper production (ha) Both the production and export price have increased in the last ten years. The production price has increased by around 70% and the export price almost ten times (not taking into account the inflation) (3). The direct subsidies participation in the production price of peppers is 12% (1).
Red peppers are the most important raw material for the further processing industry, representing nearly 50% of total raw material purchases (>34,500 tons). Source: State Statistical Office
1.2 Processing industry
1.2.1. Number, type and capacity of the processing industry The processing industry has a total of around 58 companies. The processing industry is export-oriented with 73% of the total product quantity (47,600 tons) being exported (7). The industry has continuously improved its performance in terms of quantity and value of exports over the last decade.

59
Regional Rural Development Standing Working Group in SEE
The industry consists of processors mostly packing in glass jars, tins or plastic which provide for most value added to the produced vegetables. The increasing share of the freezing facilities is notable in the last few years and individually quick frozen products (IQF) are exported thus, adding some value to the raw materials. Graph 3.4: Structure of the processing industry The processing industry (in
number) largely consists of developed start-up businesses and (in volume) of former processing companies. The vast majority (90%) of the processing companies are classified as micro or small sized companies with up to 50 employees
(11). Source: Agbiz/MAP
Most of the processing companies process both fruits and vegetables, where around 91% (69,400 tons in 2010) of the overall production is vegetable processing, while 9% is fruit processing. The industry has an overall installed capacity of around 120,000 tons of final output with low utilization of up to 45% (7).
1.3 Trade 1.3.1 Pepper (fresh) A significant amount of pepper is sold on the local market mostly for home processing into traditional products. The remaining quantity in the local market is absorbed by the processing industry. The ex-Yugoslavian markets predominate in the exports of peppers, since the products are well known and appreciated. The peppers are destined both for home processing, fresh consumption and for the processing industry. The EU market (excluding the neighboring countries) is more interested in pepper for fresh consumption rather than pepper for processing and therefore it is considered as more “demanding”. It has a year-round demand for specific quality which is a difficulty for the Macedonian seasonal production. The maximum quantity exported is in peak harvest when the prices are at their lowest. As the production is not organized there is often periodic over and under supply. The most used industrial pepper (kapija) is generally divided into three categories regarding quality (size, wholeness, shape) and three categories regarding color. Sorting is done by the producers and occasionally by the buyout traders. Peppers are usually packed in 10-15 kg plastic bags, or 7–15 kg cardboard boxes. The produce is usually sold within 1-2 days since the harvesting for industrial or home processing. The low value of the peppers does not usually justify investments in post-harvest activities for extending the shelf life. The average farm gate price of “kapija” type peppers is € 0.3/kg for premium quality
13, while
the average farm gate price for all categories is € 0.2/kg. The table below shows the exports of peppers and destination countries, although the statistics do not differentiate between the types of peppers and intended use.
13
Minimum 15 cm long, straight, uniform red color, without any defects, weighing between 150-200 gr.

60
Regional Rural Development Standing Working Group in SEE
Table 3.2: List of countries with exports of pepper from Macedonia
Importers 2007 2009 2011
Exported quantity, Tons
World 17970 20889 34502
Bulgaria 8694 6768 14376
Serbia 4306 5206 8331
Greece 577 198 2183
Slovenia 1158 2346 1859
BiH 1366 2896 1625
Croatia 429 1983 1180
Romania 343 172 816
Poland 136 12 694
Czech Republic 95 114 536 Source: ITC calculations based on UN COMTRADE statistics
For more details see Annex 4 – Trade indicators for peppers exported by Macedonia 1.3.2 Processed vegetables The EU and neighboring markets are the main export destinations for the export of vegetable processing. Exports to the EU contributed with 48% in volume and 52% in value of the overall export of processed products, while the Serbian market was the second biggest with 27% in volume and 23% in value (2010) (11). The products are exported under few tariff numbers including pepper-based products, in particular ajvar and lutenica (2005), roasted red peppers, frozen peppers (0710), gherkins, chili and semi-sweet pepperoni, beetroot (2001), dried products (0712), sour cherries frozen (0811) and preserved in alcohol (2008), and so on.
14
Due to large communities of people originating from the Balkans, oversea markets (particularly Australia and the USA) are also important export destinations.
Table 3.3: Volume of production and export of processed vegetables
2006 2007 2008 2009 2010
Total production 43,6 45,1 54,2 45,9 47,6
Export 25,6 30,3 33 33,5 39
Value (in mil. €) 23,5 28,1 36,9 39,8 39
Source Agbiz/MAP
Processors seem to be dependent on intermediate dealers when exporting abroad. The processed products have relatively low export value (around 1kg/ € 1, 1). The production and selling of own brands are lower than the production under private labels. For more details, see Annex 3 – Trade indicators for processed vegetables and Annex 5 - Details on vegetable processing.
14 0710 vegetables, uncooked or cooked by steaming or boiling in water, frozen
0712 dried vegetables, whole, cut, sliced, broken or in powder, but not further prepared 0811 fruit and nuts, uncooked or cooked by steaming or boiling in water, frozen, 2001 vegetables, fruit, nuts and other edible parts of plants, prepared or preserved by vinegar or acetic acid 2005 other vegetables prepared or preserved otherwise than by vinegar or acetic acid 2007 jams, fruit jellies, marmalades, fruit or nut puree and fruit or nut pastes, being cooked in preparation 2008 fruits, nuts and other edible parts of plants, prepared or preserved, containing or not with added sugar or sweetening n.e.s. 200950 tomato juice, whether or not containing added sugar or other sweetening matter

61
Regional Rural Development Standing Working Group in SEE
Table 3.4: List of countries with exports of processed vegetables from Macedonia
Importers tariff No
0710
2007 2009 2011
Exported quantity, tons
World 8760 6178 8743
Germany 2451 863 2802
Belgium 2392 379 2259
Poland 1032 1084 867
Greece 1453 1407 770
France 25 89 585
Austria 279 413 449
Serbia 12 130 325
Italy 465 455 282
Hungary 20 20 100
Bulgaria 378 4 96 Source: ITC calculations based on UN COMTRADE statistics
2. SUPPLY CHAIN DESCRIPTION
A schematic of the supply chain for processed vegetables, including stakeholders and parties who directly support or have an effect on the performance of the chains, is depicted below. The interdependency in the chain is significant due to a lack of capital (crediting of processors) and the long delivery and payment arrangements (importers/buyers) of the products.
Source: SWG
The vegetable sector is very diverse. Entities involved are active in a number of activities as they try to diversify activities and capitalize on emerging opportunities. The development is usually along the horizontal axis, however, consequently, more role players start to engage in vertical development along the chain.
Importers tariff No
2005
Exported quantity, tons
2007 2009 2011
World 5925 8287 10679
Germany 1121 1272 2234
Serbia 775 2231 1833
Croatia 1021 1496 1734
BiH 690 812 1033
Slovenia 428 520 902
Montenegro 433 422 500
Italy 201 295 430
Australia 248 253 341
USA 272 174 265
Austria 226 125 239
Supply Chain influencers
Banks and lenders
Ministries and Payment Agency
Retail input shops
Horizontal associations and organizations
Insurance agents
Certification bodies
Government inspections
Export and business promoters

62
Regional Rural Development Standing Working Group in SEE
Traders and processors tend to get involved in production, while producers try to establish direct trade routes and venture into the processing of its products. The trade routes of the raw material as various actors engaged during buyout season are shown in the graph below.
Source: SWG
2.1 Supply chain
2.1.1 Agriculture input suppliers Wholesale input suppliers are producers/packers/importers of different agricultural inputs. They rely on a network of agricultural pharmacies for the distribution of the inputs to the agricultural producers. Some wholesalers are involved in retail operations, while some retailers are involved in import operations. Most of the wholesalers are heavily crediting the retailers, while they are credited by banks. On the other hand, the retailers are in vegetable production, somewhat crediting the farmers involved in pepper production. At times the buyout traders are also acting as input suppliers and, by themselves or through arrangements with retailers, they are crediting the vegetable production (mostly protected production). Payments for inputs are delayed, usually until the end of the year, before the start of the next production cycle at marginally increased input cost.
2.1.2 Producers The producers of vegetables are largely individual, small-scale farmers (90%) and legal entities (10%). Some 75% of the producers share specifics of a uniform socio-economic group. The remaining 25% show different operational patterns usually associated with small companies. Very few large or medium size legal entities sporadically engage in open field pepper production.

63
Regional Rural Development Standing Working Group in SEE
The typical pepper farmer produces few labor intensive crops on small parcels in addition to cereals mostly used as crop rotation. Farmers in general depend on cash crops for their livelihoods. Reinvestments in the enlargement of the production are mostly dependent on the results of the production season, while investments in modernization (drip irrigation, tractor appliances and protected production) are slow and often credited. All producers are generally unsatisfied with the prolonged waiting periods for payments on delivered products. Depending on the season and demand, satisfaction with the buyout prices varies. The producers are often starting the harvest season indebted to input suppliers (including buyout traders) and banks. They are delivering to consolidators, buyout traders and at times to the processors directly. The participation in the markup price is as follows, farmers 70%, traders 7% and handling costs (sorting, calibration, packaging and transportation) 23% (1). The producers and the consolidators buyout trades or directly credits the processing industry, interest-free, from anywhere between 3 to 18 months. 2.1.3 Buyout consolidators The buyout consolidators are part legal entity, part physical person operating on behalf of other legal entities (buyout traders, traders and processors). Larger buyout traders and processors work with up to 20 consolidators in a few regions. Consolidators are located in villages where a feasible quantity of products is available. The quality criteria are usually provided by the end buyer. Consolidators have limited capital available, used usually for the stating of the buyout season. They depend on funds provided by the end buyer or buyout traders. Consolidators have basic facilities for storage and measuring equipment. Successful consolidators eventually venture into trading and export. 2.1.4 Buyout traders Buyout traders are legal entities operated often as family businesses. Most of them spawned during the country’s transition and supplied the services that were lacking. Buyout traders are supplying local and foreign wholesalers, processing companies and large retailers. Their usual volume of export ranges from 1,000 and 3,000 tons annually, and they operate with a turnover budget of € 0.2 to 1 million. Buyout traders are permanently located in the most productive villages and have storing facilities and large weighing and packing equipment. They work both with products for fresh consumption and for the processing industry, enabling them to absorb most of the quantities produced by the farmers (including the low quality classes). Buyout traders are an important building block in the current setup as they provide crediting for their end buyers (including the processing industry) and at times the primary producers (in inputs). 2.1.5 Spot traders Spot traders are ad-hoc buyers that visit the country during the harvest and depend on buyout traders for services. They are usually connected to retail and processing outlets abroad and buy whatever is in demand at the given moment in time. The interventions of the spot traders usually increase the commodity prices. In certain instances the prices increase for a short period and at times until the next harvest. Spot trading is generally a negative occurrence, although at times it contributes to the sustainability of the producers. 2.1.6 Processing industry The industry is increasing the quantities of raw materials procured by 15-30%/annum and its production by 20%/annum. There is a steady growth in demand for processed products on both the foreign and domestic markets. The main products of the processing industry are:
Frozen: pepper and sour cherries
Dried: pepper, onions, leeks, carrots, tomatoes

64
Regional Rural Development Standing Working Group in SEE
Canned: ajvar (of pepper), roasted pepper, lutenica (of pepper), djuvec (of mixed vegetables), pickled vegetables (gherkins, chiles, cabbage, beetroot), pasteurized sour cherries, sour cherries in alcohol, fruits (compotes, marmalades)
Concentrates and pastes: tomatoes, apples
Pepper-based products are dominant in the overall production (11), participating with 50% in the total raw material purchases. The total output of the processing industry is provided in the table below (7).
Table 3.5: Output of the processing industry
Production in 2010
Products In 000 tons In %
Industrial ajvar 10.3 22
Homemade ajvar 2.1 4.5
Lutenica 0.9 1.9
Roasted peppers 3.1 6.5
Boiled peppers 1.2 2.5
Hot peppers 2.4 5.1
Gherkins 4.8 10 Beetroot 2.0 4.2
Ketchup 2.1 4.5
Mixed salads 1.1 2.3
Frozen sour cherries 1.4 2.9
Frozen peppers 5.3 11
Other 10.9 23
Total 47.6 100
Source: MAFWE Processors rely on credits from the producers, traders, banks and suppliers of inputs. Payments to producers are often linked with the sales of the processed products, which ultimately influences the size of their production. The processing industry is dependent on domestic raw materials and imports of packing materials. Contract farming is not a common practice of the processors/traders, although the farmers gained solid experience from the previous system. On average, 20-30% of the raw materials are contracted and delivered by the producers/traders (21). The bulk of the raw materials are obtained on an ad hoc basis during the harvest/processing season. The prices of raw materials vary heavily, depending on the demand in the region and the yields in the country. Both the industry and the farmers aim to capitalize on opportunities during an oversupply or undersupply of raw materials. Imports of vegetables for processing are very small, which is partly due to high import duties on fruits and vegetables. The processing industry is labor intensive. Some 500 people are permanently employed and another 1,000 seasonal workers are engaged over a period of four months. Most workers are recruited from the local villages/towns. Women are engaged on the production lines, while men are involved in more physically demanding activities (11). Seasonal labor is particularly important and it does not require a high level of skill or education. Seasonal labor is paid per working hour. The hourly fees vary from 37.5 to 70 MKD/hour (€ 0.6 – 1.2), with an average of 49.5 MKD/hour (€ 0.80).

65
Regional Rural Development Standing Working Group in SEE
Complex tasks are handled by full-time employees. There is a positive growth trend in the employment in this sector (11). The average net monthly salary is around 10,000-11,000 MKD (€ 160 – 190). Most of the processors are organized in the Macedonian Association of Processors (MAP), a trade association with the overall objectives of developing the fruit and vegetable processing industry. MAP is a self-sustaining, private association with 28 members.
2.2 Constraints and limitations
2.2.1 Primary producers Although the vegetable production per farmer can be considered as small, it is adapted to their home labor availability, subsistence needs for other crops and arable land sizes. Farmers can easily increase the planted surface with vegetables, however, the uncertainties in terms of prices, late payments and the high investment costs limit the overall production. The Organization of farmers, although a declarative priority, is in practice not high on the agenda of the government institutions and the processors.
2.2.2 Processors The availability of large and regular volumes of raw materials on demand for processing is a difficulty faced by the processors. Limited contract farming arrangements are compounded with a lack of turnover capital and poor management. Shortages of raw materials can be also attributed to increased demand from abroad, while farmers sell to the highest bidder through buyout traders.
Processors depend on importers/wholesalers to distribute their products abroad. The lack of contacts with reliable distributors/wholesalers/importers at export markets is a major constraint. Most companies on the other hand are too small to organize their own distribution networks. The image of Macedonian products is acceptable but not recognized or preferred by Western European consumers, as most exports are under a private label of a distributor/retailer. The status and recognition are proportional to the limited investments in the promotion and labeling of the products insufficiently. However, most interviewed companies still agree that private label export is a good starting point for export markets. The product appearance and specifics do not often commensurate with consumers’ expectations and demands. Products are often sold in larger jars (over 700 grams) than those used in the EU market. The internal sweet/sour ration of processed vegetables does not match the preference of consumers in all EU countries. A lack of promotional creativity is obvious. External product and packaging specifications should be unique and difficult to imitate. Most of the constraints stem from the lack of or poor standard of top and middle management, including financial management. Horizontal (processor level) sector organizations have failed to achieve standardization of the products, improvement of quality and united label approach, in order to link with larger and more lucrative markets.
2.3 Solutions for the identified constraints and limitations The table below lists the compounded constraints and limitations and ways to address them as identified by the interviewed role-players.

66
Regional Rural Development Standing Working Group in SEE
3. SWOT ANALYSIS
3.1 Primary production
3.1.1 Strengths
Favorable climatic and soil conditions
Tradition in growing vegetables
Ability to significantly increase the production on market demand
Highly competitive prices compared to regional production
Subsidized primary production of vegetables
Low costs of seasonal labor
3.1.2 Weaknesses
Use of many different varieties of peppers with somewhat variable characteristics
Limited use of modern technology and specialized mechanization
Many small unorganized producers are difficult to deal with
Significant increase of the production may require crediting (cash or inputs)
Absence of planning or contract farming
No added value to the primary production (sorting, packing) and mostly sales in bulk 3.1.3 Opportunities
The subsidies allow farmers to professionalize and increase their production
Investments in drip irrigation system, mechanization, varieties and extension can significantly increase the production quantity and quality
Investments in packages, storages etc. can significantly increase quality and export
Organization of primary producers in functional organization can significantly improve the supply of raw materials for processors
3.1.4 Threats
Further land fragmentation
Rural aging and migration leading to reduced workforce and production
Natural calamities (droughts, diseases affecting the production)
3.2 Processing industry
3.2.1 Strengths
Constraints Why are exports affected How can this problem be solved
Lack of contacts with reliable distributers /wholesalers/ importers
No business contacts / network for SMEs
Participation at international fairs Database with reliable distributors Matchmaking and study tours
Poor production planning and no continuous feedstock for factories
High production costs, and intermittent supply, poor competitive position
Training on chain organization Educating producers and processors Contract farming Adoption of code of conduct
Inconsistent and insufficient quality products
Consumers appreciation and non-compliance
Quality and assurance management training and training of middle and production managers
Non-compliance with (export) markets’ demands
No compliance with consumers’ expectations Poor consumer awareness
Market intelligence and information on market access criteria Market visits and study tours
Poor product image, unknown origin
Products not attractive and do not match consumers’ expectations

67
Regional Rural Development Standing Working Group in SEE
Ample supply of raw materials at relatively stable prices
Subsidized investments in improvements of the production
Steady export demand, increasing number of buyers, increasing competition and prices
Accepted products on local, regional and more distant markets
Limited development needed for improved access to international markets
Cheap and skilled seasonal workers readily available
Strong processing tradition and experience
Unhindered access to consumers in the region, EU markets and CIS countries
Number of large processors with modern quality management systems is increasing
EU candidate status fostering compliance with EU regulations and increasing competiveness
3.2.2 Weaknesses
Lack of operating capital for most of the local producers
Dependency on foreign agents and limited trust and partnerships
Fragmented and poorly organized processing industry
No agreed quality standards for products
Marketing is underdeveloped, professionalism is limited and does not fit EU trading needs
Products are not customized to more sophisticated markets
Some processors have poor a reputation regarding quality and delivery times 3.2.3 Opportunities
Contract farming can allow for appropriate planning of the production (cost and quantity) and marketing
Access to finance can significantly improve the performance of the sector
Appropriate middle management can improve the output of the processors
Marketing-related support can allow access to more lucrative markets
The underutilization of the capacity provides room for further growth of the output
Reduction of energy costs through gasification can reduce costs of the branch/sector
Changes in lifestyle and food habits increase consumers’ demand 3.2.4 Threats
Domestic banks increase interest rates negatively impacting the processors
Prolongation of the global economic crisis resulting in delays in delivery dynamics and extended payment periods impacting the processing industry
Political situation may change, introducing less investor and export support
Oligopoly structures in the modern retail sector impact the domestic and regional sales
Weak cash flow management and finance problems further prevent development and supply of the demand
Middle management not available and not skilled to operate modern processing plants leading to a stall in the development
Insufficient quality control of inputs when factories will be up scaled and enlarged, impacting the quality of products
4. COMPARATIVE ADVANTAGES
4.1 Primary production
Quality and demand on the local and regional markets
Regional competitors sourcing raw materials from Macedonia have significantly higher costs due to transport
Farmer is highly adaptive and experienced in several crops, allowing easy and quick accommodation of the supply for the demand
Low average wages contribute to the low cost in a labor demanding branch/sector
The government is providing significant support for the primary producers
Complementary support policies such as favorable rural loans for producers are provided, special welfare schemes for farmers and benefits for farmers in the tax policy are available

68
Regional Rural Development Standing Working Group in SEE
The regional time differences of the harvest offer an extended production season
Large areas under industrial or cereal crops with irrigation facilities are a potential for the further
development of open field, early vegetable production 4.2 Processing facilities
The raw materials base remains the predominant advantage for the sector
Traditional producers of processed vegetables with decades of experience
Processing facilities are underused in terms of providing the capacity for increased output
Access to the vast markets of the EU 27, Russia, USA and Canada
The markets like the taste of the products as long as the quality keeps improving
The government is supporting the branch/sector by subsidizing products channeled through the processors
The production process of most of the products allows limited automation, which prevents rapid developments of competitors and dumping prices marketing strategies The large number of small processors allows for the outsourcing of different products from
more suppliers, improving the quality and the diversity of the supply
5. INVESTMENT POTENTIALS
5.1 Primary production The investment potential in primary agricultural production is limited due to the fragmentation and private ownership of land. It is feasible mainly on government-owned land which offers larger parcels for lease. Investing in the organization of the primary supply of agricultural products is more feasible, taking into consideration the profit margins of the traders, as well as the vast number of small farmers attracted to planned and structured production. Investments in buyout/collection centers with appropriate post-harvest and storing facilities are subsidized by the government. Investments are feasible in facilities aimed at the export of the best produce, and supply of the processors with the remaining quantities. The government provides attractive locations to interested foreign investors for purchase and distribution centers. 5.2 Processing facilities The investment potential in processing is huge, with vast markets and competition in a chronic lack of turnover capital. Most interviewed processors are interested in joint ventures with foreign investors as a way of addressing their constraints (need to modernize and expand capacity, lack of turnover capital, direct access to markets and so on). The establishment of new processing units is a definite prospect, coupled with appropriate relationships with farmers which guarantee an ample supply of raw materials at competitive prices. The policies of the government are inclined towards the refurbishment and modernization of the existing facilities, rather than towards the establishment of new ones.
6. MARKET OPPORTUNITIES The processed products enjoy a good reputation among the food importers from the region and the EU. As a result, there is a positive trend for the increase of exported quantities. A very favorable trading regime with the EU, further liberalization with the CEFTA agreement and increasing domestic sales are also contributing to the overall performance of the branch/sector. There is a continuous increase in the demand for processed vegetable products by foreign buyers which is evident also from the growing capacity of the processors and the output of the production.

69
Regional Rural Development Standing Working Group in SEE
There is also increased domestic market growth resulting from a strong penetration of the retail chains and from changes in the lifestyle of the local population, i.e., people are buying more pepper-based products as opposed to home processing. According to the MAP, the largest portion of total exports is sold on the ex-Yugoslav markets and somewhat less to countries such as Australia, USA, Switzerland, Canada, Norway, Russia and Ukraine. Serbia continues to be the largest importer of Macedonian processed vegetables and fruits, followed by Croatia, Bosnia and Herzegovina, Montenegro and Kosovo*. 3.5: List of importers of prepared and preserved vegetables in 2011
Source: ITC calculations based on UN COMTRADE statistics
The top five EU importers of processed products are Italy, Germany France, Slovenia and Greece. Market opportunities for processed vegetables have been identified, in particular for specialized products such as Ajvar and Lutenica, and the added value pickled programme (red peppers, specialized salads and stuffed peppers and vegetable-based finished meals). New regional markets such as Kosovo* and Albania are also attractive. While growing markets such as Russia, Ukraine and the Baltic states, almost go as far as to question the capacity of the branch/sector to meet the demand. Organic processed products for export are also a developing niche market, however, it will likely take some time to build up the organic raw materials base as well as an exportable quantity.
3.6: Prospects form market diversification for prepared and preserved vegetables

70
Regional Rural Development Standing Working Group in SEE
Source: ITC calculations based on UN COMTRADE statistics
The lessons learned from the sector show that access to markets can be significantly facilitated by: o Presence at international fairs and building up of networks with distributors o Inception with distributors and retailers specializing in ex-Yugoslavian food and with customers
from the diaspora
o Export under a private label of importer/distributors
o Focus on premium processed products for niche markets
o Competing with EU products is difficult; more unique products more likely to fare better on the
market
Exports of vegetables including fresh peppers on the regional and EU markets are a potential both
for fresh consumption and processing, coupled with sorting, grading and packing operations.
3.7: Prospects for market diversification for peppers
Source: ITC calculations based on UN COMTRADE statistics
6.1 Competitors in the market
Approximately 20 of the 55 companies active in the processing of vegetables in Macedonia are present in the local retail market.

71
Regional Rural Development Standing Working Group in SEE
Research of retail sales indicates that most of the companies are selling similar quantities of identical products. No significant predominance of certain companies is noted, as the products provided by the processors vary significantly both in terms of quality and prices. Regional competitors include few of the countries in the region, despite the production process being fairly simple. Competitors for specialized processing such as Ajvar, Lutenica and similar pepper-based products include mainly Bulgaria and Turkey as well as Serbia and Greece to a limited extent. A key feature of these specialized products is the variation in the taste and recipes (peeled peppers, unpeeled peppers, baked or not baked, level of impurities, size of particles and texture and additional seasoning). The appeal to the end customer and the approximation of the product to their expectations is crucial in increasing the competitiveness. In this sense, Macedonian products which are well known and a tradition in the former Yugoslavian republics will have more appeal with the diaspora from the region in terms of taste, compared to the competitors. The competition on the EU markets is stronger for non-traditional products which come from
modern processing facilities and efficient logistic systems.
France is by far the largest producer of preserved vegetables in Europe. The Netherlands ranks second. Italy is accountable for one third of the total canned vegetable exports in the EU followed by Spain, France, the Netherlands and Greece.
3.8: List of exporters of prepared and preserved vegetables in 2011
Source: ITC calculations based on UN COMTRADE statistics
Belgium is the leading frozen food producer with 900 million kilos. Spain, France and the Netherlands are second, third and fourth place, respectively. Germany is by far the largest importer of preserved vegetables. France and the UK are number two and three. France is the largest importer of frozen vegetables with € 465 million, followed by Germany, Belgium and the UK. The new EU countries (12 countries after 1.1.2003), show a steady growth of vegetable imports, but the size is limited. Macedonia does not have significant competitors for the production of raw materials in the immediate region. Although both Serbia and Bulgaria are larger producers of raw materials for processing, they are not exporters. Traditionally, Turkey is a strong supplier of cheap vegetables due to the huge investments in horticultural development. The export of raw materials from Turkey is more expensive due to the distance. Turkey seems to focus on the export of fruits and vegetables for fresh

72
Regional Rural Development Standing Working Group in SEE
consumption in the EU and the neighboring countries rather than on sales of raw materials for processing industries.
3.9: List of exporters of peppers in 2011
Source: ITC calculations based on UN COMTRADE statistics
7. SUB-SECTOR GROWTH POTENTIAL
7.1 Size and productivity The experienced vegetable producers have the potential to easily increase the production of vegetables. This has been evident throughout the years when small improvements in the buyout prices have resulted in significant peaks in the planted area and harvested yields (up to 70%). However, there is a limit to the size of the production to which farmers are willing to dedicate crops paid with months of delay. Farmers also show a preference to sell a part of their produce for lower prices and immediate payments and another part for higher prices with reasonable delay. The growth of the primary sector is subject to demand and estimated to be up to 50% in medium term. Some processor companies seem to find it acceptable to pay premium prices for premium delays, however most processors prefer to pay for the raw materials as soon as income starts arriving from their distributors. Processors with a good reputation rarely experience shortages of raw materials. Buyers that pay cash (or with short delays) never experience shortages and they essentially set the buyout prices. The availability of the raw materials is not likely to decrease soon; however, the prices of raw materials are likely to increase due to rising competition. Any organizing of farmers would offer a potential for an improvement of the production technology as well as for a more stable input supply. The size and productivity of the processing industry will also continue to grow, both in terms of new processors and in terms of capacity. Investments in processing are relatively low in terms of cost and standard of the equipment. The introduction of mandatory food safety standards stimulated growth as most processors invested in new and enlarged facilities.
73
Regional Rural Development Standing Working Group in SEE
The only limit to the growth is the availability of turnover capital and its use for raw material supply. 7.2 Labor and skill available locally, and improvement possibilities Due to the ongoing rural aging and migration, labor shortages may somewhat impact the raw material production rather than the processing industry. Farmers seem to be more interested in working for a lower income in factories rather than for a higher return in agriculture. However, this trend is counterbalanced by the fact that Macedonian farmers often produce vegetables as a source of additional income to their main job. Although this results in the production of smaller sized units, it is unlikely that all members of the households will abandon the agricultural production of cash crops. The introduction of improved equipment and specialized mechanization in vegetable production can significantly reduce the work load, suppressing any labor shortages. However, such modernization might be challenging for farmers without support from other actors and supporters of the supply chain. In the context of the processing facilities and the available labor, negative trends might be expected in the case of industrialization in the regions where vegetable production is dominant. A mitigating measure for the processing industry is the diversification of the production or investments, enabling off season processing as well as an increase in the average wages. 7.3 Storage and transport capacity The processors in general are more interested in supply arriving right on time, rather than in the establishment or use of the existing storing and cooling facilities. Investments at processor level are largely in facilities enabling the stocking up of raw materials for one or two days of operations. Storing and especially cooling the agricultural produce adds significantly to its costs. More processors are storing raw material in brine for off season processing rather than using cooling facilities. This type of storing is not applicable for the most pepper-based preserves. Even without their own facilities, the processors, if needed, can easily access large industrial cooling facilities existing in most of the cities. However, this would add transport and storing costs, impacting the low cost production target. The introduction of harvest on demand by the farmers could improve the supply of materials and therefore the wastage and need for storing. Such practice would allow appropriate planning for the processing facilities, however, an improvement in the organization of the producers would be a prerequisite. There is a sufficient number of transporters that serve the local domestic and regional markets (Bulgaria, Greece and Serbia), with vehicles that satisfy the strict requirements of the EU. These transporters regularly transport goods to the EU (Hungary, Austria, Czech Republic, Germany and so on) and the East European markets (Ukraine, Belarus, and Russia). The usual rate of transport costs is around € 1 /km and the most preferable destinations are the EU countries. The main problem the transporters face is the small number of TIR licenses.
15
The transportation of vegetable processing is cheaper and easier to organize compared to fresh vegetables as it does not require cooling during transport.
8. PRODUCTION- AND PROCESSING-RELATED INPUTS
8.1 Primary production Most of the inputs used by the primary producers (seeds, fertilizer, fuel, plastic sheets, plant protection, drip systems etc.) are imported, including most of the used agricultural machinery.
15
TIR - Transports Internationaux Routiers

74
Regional Rural Development Standing Working Group in SEE
Few inputs are also produced by local suppliers (seeds, plastic foil, some plant protection, metal construction for plastic tunnels, some seeds, plows, planting machines, disc furrows etc.). The producers face little problems in accessing any production inputs. 8.2 Processing industry The packing materials used for the canning of the products (jars, lids and cans) are imported from the region (Croatia, Bulgaria, Serbia and so on), although a small production of cans exists in the country. The suppliers of the packing materials are usually crediting the processing industry. Additional packing material, such as boxes, cardboard, pallets and plastic sheets, is produced both locally and imported (Turkey, Greece, and Serbia). The equipment for the processing industry is produced locally as well as imported. Simpler processing equipment is produced locally on order by few suppliers, while imported equipment is usually off the shelf from regional/EU suppliers. In only a few instances is large and complex equipment imported from further afield than the immediate region. The import and use of used equipment is common.
9. ESTIMATED INVESTMENT COSTS PER SIZE OR OUTPUT UNIT AND ESTIMATED CURRENT RETURN ON INVESTMENT FOR EXISTING OPERATIONS
The estimated profitability and investment costs for primary production are based on data from average small agricultural producers. This type of producer represents the vast majority of the raw material suppliers. The estimated profitability and investment costs for the processing industry is based on data from small startup processors that have gradually increased their capacity.
9.1 Primary production The investment costs (excluding investments in drip irrigation and anti-hail nets) of the primary production of most open field vegetables is estimated at some € 2,000/ha, including harvests on the basis of average pepper yields. The provided costs also take into account the estimated wages of the individual producers and their household residents, which are often not calculated in the costs of the production. These costs account for some 50% of the farm gate price (€ 0.2/kg) of peppers on the basis of an average yield (approximately 20 t/ha). 9.2 Processing industry The investment costs of the processing industry in regards to the facilities for production is estimated at € 0.5 / standard production unit (can or jar of 500-700 gram) installed capacity. The investment costs in the processing equipment although highly dependent on the make and quality is estimated at € 0.15 / standard production unit (can or jar of 500-700 gram) installed capacity. The total investment cost for installed capacity of a single production unit is estimated € 0.65 /installed capacity of standard production unit. The average markups of the processing industry are above 30% of invested turnover capital/production price of per standard output unit (can or jar of 500-700 gram). Lower level margins are associated with sales on the domestic market, while higher level margins are associated with exports. The markup per unit of product also varies on account of the type of product, with paper-based processing being at the top and the pickled programme being at the bottom. Production costs in the canning industry show a percentage of input costs in the total price:

75
Regional Rural Development Standing Working Group in SEE
Raw materials-30%, labor-20%, packaging-20%, energy-10%, administration-5%, and markup-15%. Raw materials, labor and packaging are the main costs, accounting for up to 60% of the total costs. Marketing budgets are very low.

76
Regional Rural Development Standing Working Group in SEE
Annex 1: Exports of wine from Macedonia
Exports of wine from Macedonia 2007 2008 2009
Country Tariff number
Type Quantity (hl) Value 1,000€
Quantity (hl)
Value 1,000€
Quantity (hl) Value 1,000€
EU 27 2204 21 Bottled 8.904 1.072 9.000 1.205 5.991 941
2204 29 Bulk 484.547 15.947 390.648 13.711 409.125 15.316
TOTAL 493.451 17.019 399.648 14.916 415.116 16.257
Serbia 2204 21 Bottled 54.668
6.519 69.776 8.427 54.7 7 5 7.192
2204 29 Bulk 195.580
7.919 121.708 5.608 105.207 4.736
TOTAL 250.248 14.439 191.484 14.035 159.982 11.928
Croatia 2204 21 Bottled 15.692 2.579 14.674 2.669 11.061 2.135
2204 29 Bulk 83.663 5.295 74.06 7 5.273 71.331 5.309
TOTAL 99.355 7.873 88.742 7.942 82.392 7.444
Russia 2204 21 Bottled 6.181 464 3.095 243 2.232 215
2204 29 Bulk 42.386 931 245 11 0,00 0
TOTAL 48.567 1.395 3.341 254 2.232 215
BiH 2204 21 Bottled 4.514 714 3.433 595 2.677 531
2204 29 Bulk 1.293 93 435 50 1.961 130
TOTAL 5.808 806 3.868 645 4.638 661
Total exports
2204 21 Bottled 95.410 12.240 105.378 13.992 80.940 11.803
2204 29 Bulk 831.424 31.328 597.995 25.179 606.747 26.551
TOTAL 926.8 34 43.568 703.373 39.171 687.686 38.354
Source: State statistical office
Annex 2 - Trade indicators for wine exported by Macedonia
Importers Trade Indicators
Exported value 2011 (USD
thousand)
Trade balance
2011 (USD
thousand)
Share in Macedonia’s exports (%)
Exported quantity
2011
Quantity unit
Unit value (USD)
Exported growth in
value, from 2007-2011 (%,
p.a.)
Exported growth in quantity
from 2007-2011 (%, p.a.)
Share of partner
countries in world imports
(%)
Total import growth in
value from 2007-2011 (%, p.a.)
World 62105 61671 100 100209 Tons 620 1 2 100 3
Serbia 22639 22628 36,5 32701 Tons 692 3 7 0,1 -4
Germany 15614 15583 25,1 36378 Tons 429 -2 -1 9,8 1
Croatia 8436 8365 13,6 7587 Tons 1112 -6 -7 0,1 -9
Czech Rep. 4999 4984 8 9033 Tons 553 57 48 0,7 7
Ukraine 1815 1815 2,9 4174 Tons 435 66 104 0,3 13
Slovakia 1551 1551 2,5 3235 Tons 479 230 237 0,3 17
BiH 1264 1264 2 518 Tons 2440 3 -3 0,1 -7
China 952 952 1,5 1162 Tons 819 91 183 4,3 52
Slovenia 646 639 1 646 Tons 1000 -8 -11 0 1
Montenegro 561 561 0,9 371 Tons 1512 5 -4 0 3
Source: ITC calculations based on UN COMTRADE statistics

77
Regional Rural Development Standing Working Group in SEE
Annex 3 - Trade indicators for processed vegetables exported by Macedonia
Importers Trade Indicators
Exported value 2011 (USD
thousand)
Trade balance
2011 (USD
thousand)
Share in Macedonia’s exports (%)
Exported quantity
2011
Quantity unit
Unit value (USD)
Exported growth in value
from 2007-
2011 (%)
Exported growth in quantity
from 2007-2011 (%, p.a.)
Share of partner
countries in world imports
(%)
Total import growth in
value from 2007-2011 (%, p.a.)
World 21371 7220 100 10679 Tons 2001 19 16 100 4
Serbia 3580 -811 16,8 1833 Tons 1953 29 24 0,1 0
Germany 3359 3226 15,7 2234 Tons 1504 21 19 9,3 -1
Croatia 2799 2176 13,1 1734 Tons 1614 18 14 0,2 -4
BiH 2074 1991 9,7 1033 Tons 2008 16 11 0,1 4
Slovenia 1824 1816 8,5 902 Tons 2022 15 20 0,3 3
Italy 1523 1389 7,1 430 Tons 3542 9 21 3,2 0
Montenegro 1196 1195 5,6 500 Tons 2392 13 4 0,1 3
Australia 1101 1101 5,2 341 Tons 3229 15 8 1,9 11
USA 619 619 2,9 265 Tons 2336 4 -1 12,2 4
Source: ITC calculations based on UN COMTRADE statistics
Annex 4 - Trade indicators for pepper exported by Macedonia
Importers Trade Indicators
Exported value 2011 (USD
thousand)
Trade balance
2011 (USD
thousand)
Share in Macedonia's exports (%)
Exported quantity
2011
Quantity unit
Unit value (USD)
Exported growth in
value from 2007-2011 (%, p.a.)
Exported growth in quantity
from 2007-2011 (%, p.a.)
Share of partner
countries in world imports
(%)
Total import growth in
value from 2007-2011 (%,
p.a.)
World 14220 13937 100 34502 Tons 412 22 18 100 2
Bulgaria 4921 4921 34,6 14376 Tons 342 25 13 0,2 8
Serbia 3515 3494 24,7 8331 Tons 422 20 18 0,1 15
Greece 903 694 6,4 2183 Tons 414 36 39 0,2 -6
Slovenia 863 863 6,1 1859 Tons 464 8 13 0,3 3
BiH 692 692 4,9 1625 Tons 426 2 4 0,1 2
Croatia 685 685 4,8 1180 Tons 581 21 29 0,1 9
Czech Rep.
362 362 2,5 536 Tons 675 63 54 1,8 4
Poland 330 317 2,3 694 Tons 476 52 50 1,9 9
Germany 313 313 2,2 292 Tons 1072 71 31 18,5 1
Russia 302 302 2,1 289 Tons 1045 4,2 15
Source: ITC calculations based on UN COMTRADE statistics
Annex 5 - Details on vegetable processing in Macedonia
Type Item 2002 2003 2004 2005 2006 2007 2008 2009
Vegetable frozen
Import Quantity (tons) 388 401 422 399 693 2082 922 976
Import Value (1000 USD ) 268 379 469 415 616 2589 1307 1194
Export Quantity (tons) 1367 1344 3715 3916 5803 8863 6215 6177
Export Value (1000 USD ) 1092 1212 3517 3622 5451 9401 7200 7771
Type Item 2002 2003 2004 2005 2006 2007 2008 2009
Vegetables in vinegar
Import Quantity (tons) 594 329 372 665 869 1576 816 706
Import Value (1000 USD ) 305 224 296 508 676 1910 982 888
Export Quantity (tons) 3925 3804 3578 4371 5469 5236 8875 9570
Export Value (1000 USD ) 3040 3509 3372 4560 5949 6400 11291 12809
Source: MAP

78
Regional Rural Development Standing Working Group in SEE
Annex 6 – International statistics on Macedonia and its agriculture Macedonia and Macedonian Agriculture in Brief
Population 2,082,370 The World FactBook, 2011
Population (Urban) 59% The World FactBook, 2010
Population (Rural) 41% The World FactBook, 2010
Currency Macedonian denar (MKD) The World FactBook, 2011
Languages Macedonian 66.5%, Albanian 25.1%, Turks 3.5%, Roma 1.9%, Serbs 1.2%
The World FactBook, 2011
Total GDP (US$ bn) 9.8 The World FactBook, 2011
GDP per Capita (US$) 10,400.0 The World FactBook, 2011
Real GDP Growth Rate 3.3% The World FactBook, 2011
Consumer Price Inflation (%; av) 3.9% The World FactBook, 2011
Agriculture GDP % of Total 10% The World FactBook, 2011
Total Labour Force 942,400 The World FactBook, 2011
Agricultural % of Labour Force 20% The World FactBook, 2010
Unemployed % of Labour Force 31.0% The World FactBook, 2011
Total Area 2,571,000 Ha FAOSTAT, 2007
Total Agricultural Land 1,076,000 Ha FAOSTAT, 2007
Agricultural Land % of Total Land 41.8% FAOSTAT, 2007
Arable Land + Permanent Crops 467,000 Ha FAOSTAT, 2007
Arable Land + Permanent Crops % of Total Area
18.2% FAOSTAT, 2007
Arable Land 431,000 Ha FAOSTAT, 2007
Arable Land % of Total Area 16.8% FAOSTAT, 2007
Irrigated Land 55,000 Ha FAOSTAT, 2007
Irrigated Land % of Agricultural Land 2.1% FAOSTAT, 2007
Cow milk, whole, fresh 385,290 Metric tonnes
Wheat 218,100 Metric tonnes
Grapes 209,701 Metric tonnes
Potatoes 180,887 Metric tonnes
Apples 152,089 Metric tonnes
Chilies and peppers, green 140,558 Metric tonnes
Watermelons 123,840 Metric tonnes
Maize 118,378 Metric tonnes
Total Export of Goods FOB 3.4 billion US$ Economist Intelligence Unit, 2007
Agricultural Exports 458 million US$ Economist Intelligence Unit, 2007
Agricultural Exports % of Total Exports 13.6% Economist Intelligence Unit, 2007
Major Exports (tonnes) FAOSTAT, 2007
Tobacco Leaves 21.5
Wine 17.4
Tomatoes 4.6
Pastry 4.2
Apples 3.7
Beverage Non-alc. 3.7
Total Import of Goods FOB 5.2 billion US$ Economist Intelligence Unit, 2007
Agricultural Imports 599 million US$ Economist Intelligence Unit, 2007
Agricultural Imports % of Total Imports 11.4% Economist Intelligence Unit, 2007
Major Imports (tonnes) FAOSTAT, 2007
Food Prep Nes 10.8
Beverage Non-alc. 7.9
Pastry 7.9
Chicken meat 7.7
Chocolate Prsnes 6.9
Flour of Wheat 6.6
Source: www.eastagri.org

79
Regional Rural Development Standing Working Group in SEE
Annex 7 - Information providers
No. Name and Surname Entity Business activity
1. Delco Baltovski Dalvina / Skopje Vinery
2. Nikola Maksimov Agro Lozar AD/Strumica Vineyards
3. Slavica Angelkova Dusan Ciric/Rosoman Vineyards
4. Atanas Pilev Popov/Kavadarci Vinery/Vineyards
5. Vladimir Kokarev Independent consultant Consultancy
6. Jovanka Cvetkova Vizba Valandovo AD/Valandovo Vinery/Vineyards
7. Krum Boskov Faculty of Agriculture Expert
8. Marija Nickova Grkov/Kavadarci Vinery/Vineyards
9. Kosta Tasev M6/Veles Vineyards
10. Maja Bosevska GD Tikves Lozarstvo/ Kavadarci Vineyards
11. Sonja Bendolieva Nimex SA/Skopje F&V Processing
12. Ilco Velkov Agros 2004/Kocani Farmer Organization/Primary production
13. Krte Delev Badzo/Gevgelija Greenhouses
14. Zlatko Edelinski Independent consultant Consultancy
15. Anica Andreevska Eko Grup/Kavadarci F&V Processing / Primary production
16. Viktor Petkov Vipro/Gevgelija F&V Processing
17. Todor Cerepnalkovski EKO Oaza AD/Stip, Dojran, Greenhouses/ Primary production
18. Zivko Ognjanovski Farmer/Jurumleri Primary production
19. Goran Stanojkovic Farmer/Recica Primary production
20. Kolev Goran Procert Certification QAS
21. Goran Angelovski Federation of organic producers Farmer Organization
22. Stojanov Tasko Farmer/Mokrievo Primary production
23. Dimitar Saltirov Dobra /Kocani Greenhouses/Primary production
24. Taso Boskov Farmer/Sopot Vineyards
25. Pasko Paskov Farmer/Kavadarci Vineyards
26. Aleksandar Ginev Farmer/Manastirec Vineyards
27. Dragan Ristov Farmer/Kavadarci Vineyards
28. Mile Stojanov Barovo/Kavadarci Vineyards
29. Suzana Mitrova Peca komerc/Kavadarci Buyout trader/Exporter
30. Pavle Kolovski Koro/Skopje Input supplier/Additives
31. Angelo Filipov Vino raj/Kavadarci Buyout trader/Exporter
32. Toma Davitkovski Mantaniko/Skopje Input supplier/Glass packing
33. Violeta Mladenovska Giannviki/Skopje F&V Processing
34. Jure Georgiev Fungi flora F&V Processing
35. Branko Baltovski Agrohemija Agriculture input supplier
36. Georgi Vasilev Associacia Bolgarski piper Importer/Trader

80
Regional Rural Development Standing Working Group in SEE
Annex 8 - References:
(1) Macedonian agriculture subsidies programme impacts and effects – EPI Centar– 2010
(2) Guide for foreign direct investments in the Macedonian agro-food sector – MAFWE – 2010
(3) Fresh Vegetables Market Information – AgBiz – 2009
(4) Wine Market Information – Agbiz – 2009
(5) Trends in the foreign trade of Macedonia in 2009 – University American College - 2010
(6) Role of producer organizations assessment – Agbiz – 2009
(7) Facts and Figures 2010 – MAFWE- 2011
(8) Profile of the Macedonian Vegetable Value Chain – EPI Centar International – 2008
(9) EU Instrument for Pre-Accession for Rural Development (IPARD) National Programme for
Agriculture and Rural Development - 2007-2013 – MAFWE – 2011
(10) Strategy for Vineyards and Wine 2010-2015 – MAFWE – 2010
(11) Survey on the Performance of the Fruit and Vegetable Processing Industry– MAP -2009
(12) Sectors analysis on key agricultural products: Grape and wine – Italtrend SPA – 2007
(13) http://investinmacedonia.com
(14) www.mzsv.gov.mk
(15) www.zpis.gov.mk
(16) CBI Market Survey - The EU market for wine – 2009
(17) Profile of the Macedonian Table Grapes Value Chain – Agbiz – 2008
(18) Croatian Table Grape Market Report – Agbiz – 2009
(19) Export Development of High Value Agricultural Products of SEE - CBI/SWG - 2011
(20) Food Industry Study in Southeast Europe – GFA- 2011
(21) Assessment of Agbiz value chain participants’ usage of backward linkages and the lessons
learned, best practices and recommended activities – FAGRICOM - 2010
(22) Analysis of future trends of migration of rural labor, effects on agriculture and rural
development and provision of policy recommendations in the Balkans – GTZ – 2010
(23) Business climate and investment opportunities in Macedonia – Agency for Foreign
Investments and Export Promotion of the Republic of Macedonia- 2012
(24) Agriculture and Agriprocessing Industry in the Republic of Macedonia - Agency for Foreign
Investments and Export Promotion of the Republic of Macedonia- 2011
(25) www.stat.gov.mk
(26) www.fao.org
(27) www.trademap.org
(28) www.ceftatradeportal.com
(29) Statistical Yearbook - State Statistical Office of the Republic of Macedonia – 2012
(30) Census of Agriculture - State Statistical Office of the Republic of Macedonia – 2007
(31) http://www.fez.gov.mk/
(32) http://www.mbdp.com.mk
(33) www.mrfp.org.mk
(34) http://www.mchamber.org.mk
(35) Macedonia in Figures - State Statistical Office of the Republic of Macedonia – 2010
(36) Sustainable development, State Statistical Office of the Republic of Macedonia – 2011
(37) www.ipardpa.gov.mk
(38) http://agroinfo.com.mk
(39) Guide to Doing Business and Investing in Macedonia – PWC- 2012 (40) http://www.theglobaleconomy.com/Macedonia/indicator-NV.AGR.TOTL.ZS/
(41) www.eastagri.org

81
Regional Rural Development Standing Working Group in SEE
COUNTRY PROFILE - SERBIA
- Fresh and processed raspberries and blackberries
- Fresh and processed plums and prunes

82
Regional Rural Development Standing Working Group in SEE
I. COUNTRY SPECIFICS - SERBIA
1. GENERAL DATA ON THE COUNTRY
1.1 General data Serbia has approximately 7.5 million inhabitants with a territory of 88,361 km
2. The population
density runs to 111 inhabitants per km2. It is landlocked, with the Danube river providing
shipping access to inland Europe and the Black Sea. Serbia is a Parliamentary Republic. The national legislature is a unicameral assembly of 250 members chosen in general elections for a period of four years. The members of the National Assembly elect the government, which, together with the President of the Republic, represent the country’s executive authority. The judiciary system is independent. The climate is mild continental, with a gradual transition between the four seasons of the year, with warm summers and snowy winters. 1.2 Economy
Graph 1.1: Serbia FDI totals
Serbia is one of Europe's fastest growing economies, with GDP gaining nearly 7% on average. GDP per capita is about € 3,230. The inflation target is set in the range between 4-8%. The official currency is the Serbian Dinar (RSD).
16
1.3 Foreign investment Foreign Direct Investment was negligible pre-1998. The FDI has been steadily growing, reaching a peak of about € 400 million in 2001. The years 2006, 2007 and 2008 saw significant investments from privatizations in the energy sector, and green-field investments in the free economic zones. Since 2001, Serbia has attracted over € 19.2 billion of inward FDI. The total amount of foreign investment in the agricultural and food sector, in the period after the political changes in 2000, exceeded € 0.77 billion. The highest amount (€ 271.5 million) was recorded in 2009. FDIs in agriculture accounted for 19% of total foreign investments in 2009, and 8% of total foreign investment in 2010.
2. SERBIAN AGRICULTURE AND FOOD SECTOR
Agriculture is one of the most important economic activities in Serbia. Primary agricultural production, hunting, forestry and fisheries account for over 10% of the GDP. Agricultural exports continue to expand and contributed about 24% of the total exports. Approximately 55% of the population lives in rural areas with around one third of the active population relying to some extent on agriculture for their livelihoods. Agriculture is the basis for the economy and the engine for the development of rural areas and the only sector with a positive foreign trade balance.
16
Exchange rates: 1 € = 112 RSD is the multiannual average used for the purposes of the study, while the official
exchange rate was 1 € = 117,4 RSD during the making of the study (October 2012). Exchange rates: 1 USD = 86,1 RSD is the multiannual average used for the purposes of the study, while the official exchange rate was 1 USD = 94,8 RSD during the making of the study (National Bank of Serbia) Exchange rate used: 1 € = USD 1,3 (October 2012).
Source: National Bank
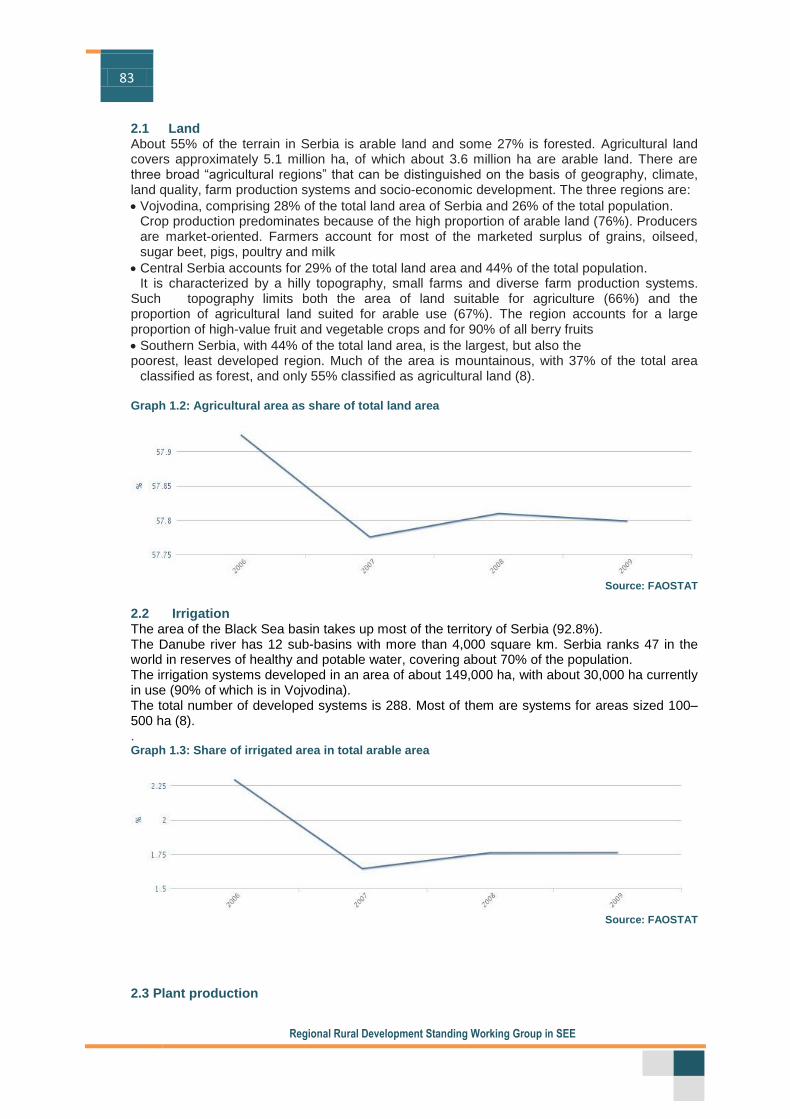
83
Regional Rural Development Standing Working Group in SEE
2.1 Land About 55% of the terrain in Serbia is arable land and some 27% is forested. Agricultural land covers approximately 5.1 million ha, of which about 3.6 million ha are arable land. There are three broad “agricultural regions” that can be distinguished on the basis of geography, climate, land quality, farm production systems and socio-economic development. The three regions are:
Vojvodina, comprising 28% of the total land area of Serbia and 26% of the total population. Crop production predominates because of the high proportion of arable land (76%). Producers are market-oriented. Farmers account for most of the marketed surplus of grains, oilseed, sugar beet, pigs, poultry and milk
Central Serbia accounts for 29% of the total land area and 44% of the total population. It is characterized by a hilly topography, small farms and diverse farm production systems. Such topography limits both the area of land suitable for agriculture (66%) and the proportion of agricultural land suited for arable use (67%). The region accounts for a large proportion of high-value fruit and vegetable crops and for 90% of all berry fruits
Southern Serbia, with 44% of the total land area, is the largest, but also the poorest, least developed region. Much of the area is mountainous, with 37% of the total area classified as forest, and only 55% classified as agricultural land (8). Graph 1.2: Agricultural area as share of total land area
Source: FAOSTAT
2.2 Irrigation The area of the Black Sea basin takes up most of the territory of Serbia (92.8%). The Danube river has 12 sub-basins with more than 4,000 square km. Serbia ranks 47 in the world in reserves of healthy and potable water, covering about 70% of the population. The irrigation systems developed in an area of about 149,000 ha, with about 30,000 ha currently in use (90% of which is in Vojvodina). The total number of developed systems is 288. Most of them are systems for areas sized 100–500 ha (8). . Graph 1.3: Share of irrigated area in total arable area
Source: FAOSTAT
2.3 Plant production

84
Regional Rural Development Standing Working Group in SEE
2.3.1 Cereals Most of the agricultural land is used for cereal crop production. This production takes up about 60% of the total seeded areas. Maize is predominantly present on more than 1.2 million ha. When it comes to maize production, Serbia ranks fifth in Europe after France, Ukraine, Romania and Italy.
Graph 1.4: Wheat and maize exports
Field crops are mostly grown in Vojvodina, which is predominantly lowland, accounting for about 84% of cultivable land areas of Serbia. Soil fertility has been improved by building irrigation canals. Field crop production meets the needs of the national processing industry and the available surplus is exported (8).
Source: Customs administration
2.3.2 Industrial crops Serbia is among the leading countries in Europe in oilseed production. The largest oilseed areas are in Vojvodina, where six out of seven processing plants are located
17. Out of the
total number of oil producing plants, two are exclusively soybean processing plants. Graph: 1.5: Sugar beet production and yields
Oilseed production meets national needs and its most important export products are sunflower and soybean oil, ranking among the top ten products in 2010 by value. Vojvodina has good soil and climate conditions for sugar beet growing. This attracted foreign companies to invest in the advancement of the production and processing capacities.
Source: Statistical Office of Serbia
While areas under sugar beet differ annually, average sugar beet yields per hectare are on the rise. Sugar beet is processed by three companies in six processing plants in Vojvodina
18.
Sugar is an important export commodity, and by the value of exports it ranks among the top ten products, mostly owing to the preferential regime for exports to the EU for annual quantities of 180,000 tons (8). 2.3.3 Medicinal, aromatic herbs Medicinal, aromatic and culinary herbs in Serbia are part of the country’s tradition and culture. The total harvested quantities of uncultivated medicinal herbs
19in 2010 were 16,000
t. At the same time, areas under cultivated or plantation-grown medicinal herbs are 1,419 ha yielding 4,500 tons (8).
Graph 1.6: Area under herbs
17 http://www.portal-srbija.com/uljare 18 http://www.portal-srbija.com/secerane 19 ttp://www.agrobiznis.net/documents/Herbs_Mushrooms_and_Forest_Fruits_Value_Chain_Assessment.pdf.

85
Regional Rural Development Standing Working Group in SEE
Source: Statistical Office of Serbia
2.3.4 Horticultural crops Vegetable production is one of the most intensive branches of plant production with five to eight times higher value of production compared to field crops, or even 200-250 times higher value in protected vegetable growing. Vegetables are grown on about 281,000 ha, or 9% of the total cropped area. In 2010 vegetable production was 2.18 million tons. The production of vegetables equals roughly the combined total production of vegetables in all CEFTA countries. The vegetable production structure is dominated by potatoes with a share of about 41%. The potato industry has a wide range of products: crisps or chips, mashed potatoes and frozen French fries, the exports of which have had a rising trend over the recent years. After potatoes, the most produced vegetables are cabbages (15%), followed by melons and watermelons (9%), tomatoes (9%), peppers (7%) and onions (7%). Rising trends in the production of most vegetables indicate rising profitability (8). Graph 1.7: Area under vegetable production
Source: Statistical Office of Serbia
Serbia has a positive balance in foreign trade in vegetables. The share of vegetables exports in the total agricultural exports is about 9%. The value of exports of fresh, frozen and dried vegetables in 2010 was around € 57.6 million. In terms of value, fresh vegetables exports are dominated by mushrooms, tomatoes and

86
Regional Rural Development Standing Working Group in SEE
sweet peppers. In terms of quantity, potatoes are in the lead with 12%, followed by peppers (5.08%), carrots (3.93%), tomatoes (3.09%) and onions (3.04%). The EU is the largest buyer of fresh, frozen and processed vegetables (42%). The neighboring countries consume 35% of the vegetable exports. Processed vegetable exports are dominated mostly by preserved vegetables to the amount of about € 23.8 million. Dried peppers have the highest share in dried vegetables, and are exported mostly to Hungary, Austria and Germany. Peppers are one of the most important vegetables by export value (8). 2.3.5 Fruit Favorable climate and soil conditions result in successful and diverse fruit production. Areas under orchards in 2010 were 239,846 ha, which is 4.7% of the total agricultural areas, or 5.7% of cultivable land areas. Traditionally, plum orchards take up the most part of the areas under fruit plantations 51%, followed by apple (20%) and sour cherry orchards (10%). Over the last five years, yields per tree for most fruits have slightly increased, due to applying appropriate varieties and new growing technologies. Graph 1.8: Foreign trade in fruit
The total production of fruits in 2010 was 1,043,504 tons. The production structure is dominated by stone fruits with a 56% share, followed by pomes (28%), berries (14%) and nuts (2%). The most widely grown are plums, with 51% of the total area under orchards. The share of fruit production in the total value of plant production is 12%. The largest fruit growing areas are in Central Serbia (8).
Source: Statistical Office of Serbia Graph 1.9: Production by fruit species
The share of exports of fruit and processed fruit products in the total value of exported agricultural and food products are significant, usually averaging 27%. In terms of value of exports, raspberries top the list. The share of raspberries in the total value of fruit exports in 2010 was 47%. Fruit production in Serbia is moderately efficient, utilizing a broad network of small-scale producers. The level of automation and technology is limited, resulting in lower yields compared to Western standards. Source: Statistical Office of Serbia Efforts to introduce new varieties are ongoing, but at present the availability of new varieties for retail sales and exports is a constraint on the market (8).
2.4 Livestock production The share of livestock husbandry in the total value of agricultural production was 32% in 2010.

87
Regional Rural Development Standing Working Group in SEE
2.4.1 Cattle Graph 1.10: Shares of sectors in total livestock production Cattle are the most important production sector in the livestock production. The most important products of cattle rising are staple foods (meat and milk). The share of cow’s milk in the total value of livestock rising is 25%, while beef production share is 17.6%. Cow’s milk is the most important, with a share between 98 and 99% (8).
Source: Statistical Office of Serbia
2.4.2 Pigs Pork production is the most important sector in livestock husbandry when it comes to meat production, but it is considerable also in terms of overall livestock production. In 2010, pork production was 57% of the total production of meat (8). 2.4.3 Poultry The growing trend in poultry meat production continues, and in 2010 it had a share of 18% in the total production of meat. For more details on agricultural indicators on Serbia, see Annex II-1.
2.5 Marketing of agriculture products and market infrastructure The wholesale of agricultural products is carried out on a daily basis in five formal and many seasonal wholesale markets in the country
20. Both farmers and traders alike have access to the
markets. The retail of agriculture produce is generally carried out on green markets present in the towns and cities. In larger cities, traders usually resale agricultural produce, while in smaller cities it is mostly farmers/traders that handle operations. Serbia has a total of 408 green markets with more than 52,000 stalls. In Belgrade alone there are 33 green markets with over 11,000 stalls, mainly supplied by the Kvantas wholesale market. The largest of these green markets have some 100–150 stalls. Supermarket chains are now taking a larger portion of the market, offering better prices due to stronger purchasing/selling power and lower distribution costs. Retail chains are increasing their sales of foodstuffs by 30% annually, partly because of increased purchasing power. Although overall green market sales are growing by 12% annually on average, their share of the total food retail market is declining. The green markets’ share of food retail income is 5.5% (€ 56.9 million). Bigger retailers require from the producers continuity and quality supplies of fresh fruits. Payment terms are most often 30 to 50 days but sometimes even up to 90 to 120 days. Supermarkets are also increasingly assuming the functions of specialized wholesale traders in fruit. They have founded their own distribution centers to collect the products and supply their own stores. Generally, post-harvesting and value adding activities (number and quality of the infrastructure) is unsatisfactory for all market outlets (wholesale, retail, export). As a result, most products are sold as raw materials, rather than as end products. The recent advances in food safety policy have resulted in the development of the infrastructure from investments by producers and traders.
20
Kvantas, Zeleni Venac – Beograd, Nis, Kraljevo, Novi Sad

88
Regional Rural Development Standing Working Group in SEE
Since 2004 the Ministry of Agriculture has had the Agricultural Market Information System - STIPS in place. This system collects weekly data on prices of fruits, vegetables, live animals and cereals from 18 green markets and livestock markets, and five wholesale outlets. For agricultural inputs, STIPS reports on the prices semi-annually, prior to the spring and fall planting (September/October). The STIPS also provides an overview of price changes in the previous years. STIPS is part of the AGRIMIS system, through which one can access data from the countries of Central and Southeastern Europe (3). According to the interviewed farmers, data are often outdated and are feeling the need for a market information system (MIS) that will report weekly or even daily the prices in the major wholesale markets in Europe and Russia. 2.6 Employment and labor in agriculture The combined number of people employed in agriculture (7%) and in the food processing industry (4.5%) represents approximately 11.5% of the total labor force of 2.1 million people. Around 150,000 people are employed in the agro-processing and agricultural service industries. Food-processing enterprises are the largest employer in this specific sector, with more than 90,000 employees. The agricultural population has a higher percentage of people older than 45 compared to the total population. The proportion of young farmers (up to an age of 19), as well as those in the most productive age (20 to 49) is decreasing. The educational structure of the active agricultural population of Serbia is unfavorable, while the proportion of illiterate people exceeds that of people with secondary and higher education. The mandatory social insurance contributions for all employees in Serbia are:
11% for pension and disability insurance
6.15% for health insurance
0.75% for unemployment insurance Social insurance charges and Salary Tax amount to roughly 65% of the net salary but the tax burden for employers can be reduced through a variety of available financial and tax incentives.
3 FOREIGN TRADE OF AGRO-FOOD PRODUCTS
3.1 Foreign trade statistics Foreign trade in agricultural and fishery products is on a continuous rise. The highest value of trade, to the amount of around € 2.5 billion, was reached in 2010 with a surplus of about € 0.92 billion. The greatest export share from agricultural products is noted in cereals and cereal products (6.2% of total export) and fruits and vegetables (€ 471.9 million, 5.6% of total export). Agriculture plays a significant part in the overall foreign trade, with a 21% share in total exports and 6 to 8% share in imports. The key and most important trade partner for Serbia is the EU. Since 2001, Serbia has enjoyed a preferential status for exporting agricultural products into the EU, based on unilateral Autonomous Trade Measures. Imported agricultural products from Serbia are not subject to any customs duties imposed by the EU except for sugar, baby beef and wines, where preferential tariff quotas are applied.

89
Regional Rural Development Standing Working Group in SEE
Graph 1.11: Foreign trade in agriculture
Source: Statistical Office of Serbia
Signing the Stabilization and Association Agreement with the EU (2008) and application of the Interim Agreement on Trade and Trade-related Matters (2009) led to a gradual liberalization of trade in agricultural products to a very high degree. The average import protection in agriculture for imports will be reduced from the original 23.2% to 3.2%. Graph 1.12: Structure of agricultural exports Graph 1.13: Regional structure of exports (mill. €)
Source: Statistical Office of Serbia
In terms of average annual volume of imports, 75% of trade will be fully liberalized. In about 15% of trade, the tariff rates will be reduced to 10 - 20% of applicable most favored nation (MFN) rates, and 12% will continue to be subject to MFN rates after the end of the transitional period. The CEFTA signatories absorb about 43% of the agricultural exports of Serbia, and only 7- 9% of exports were placed on the markets of other countries. At the same time, the largest volumes of imports originate from the EU. Serbia exports agricultural and food products to 125 countries, and imports from 130 countries. By value of exports, the most important partners are Bosnia and Herzegovina, Montenegro, Macedonia, Germany, Austria, Italy, Hungary, Russia, France and Greece.
Cereals
Fruits and veg.
Sugar
Beverages
Meat
Oil seeds
Other
Meat
Fruits and veg.
Coffee, tea spices
Fish
Animal feed
Drinks
Tobbaco
Cereals
Oil seeds
Other

90
Regional Rural Development Standing Working Group in SEE
Graph 1.14: Structure of agricultural imports
Source: Statistical Office of Serbia
Graph 1.15: Regional structure of import (mill. €)
Source: Statistical Office of Serbia
By value of imports, the most important partners of Serbia are Germany, Macedonia, Brazil, Croatia, Italy, the Netherlands, Bosnia and Herzegovina, Ecuador, Hungary and Poland. 3.2 Memberships and agreements fostering foreign trade
In 2006, Serbia signed the CEFTA Agreement, which substituted the bilateral agreements with Albania, Bosnia and Herzegovina, Bulgaria, Croatia, Macedonia, Moldova, Montenegro, and Romania. CEFTA envisages the abolishment of customs restrictions for industrial and agricultural products in the CEE countries
A free trade agreement with Russia makes Serbia particularly attractive to foreign investors. Goods produced in Serbia with prevailing value added in Serbia and of Serbian origin, are free of customs when entering the Russian market. The list of products not covered by the duty free agreement is updated annually, and it currently includes poultry, sugar, confectionary products, alcoholic beverages, soap, cotton, carpets, wooden furniture, household appliances and motor vehicles
Exports to the EU market are free-of-customs according to the Stabilization and Association Agreement. The Agreement provides for the progressive abolishment of import customs duties in Serbia to EU products by 2014
Trade with the United States is pursued under the Generalized System of Preferences. U. trade benefits provide for a preferential duty-free entry for approximately 4,650 products, including selected agricultural products. The list of eligible goods is reviewed twice per year
Trade between Serbia and Turkey is regulated upon the model implemented in trade with the EU. Products can be exported to Turkey without customs duties. Imports of products into Serbia are generally customs-free, but for a number of goods customs duties will be progressively abolished over a six year period, ending in 2015. For trade in agricultural products, customs duties remain in effect, with certain MFN reductions for some products

91
Regional Rural Development Standing Working Group in SEE
Products exported from Serbia to EFTA member states (Switzerland, Norway, Iceland, and Liechtenstein) are exempt from paying customs duties, except for limited goods, including fish and marine products. Trade in agricultural products is regulated by separate agreements with each of the EFTA members
The Free Trade Agreement with Belarus envisages the mutual abolishment of customs and non-customs duties between the two countries. There are only a few exceptions to the agreement, including sugar, alcohol, cigarettes, used cars, buses, and tires
3.3 Customs Goods exported to the EU are subject to preferential customs regimes. The EU agreement abolished customs duties and quantitative restrictions for the import of Serbian products. The latest amendment to the Customs Tariff in 2005 made this law compatible with the laws of the WTO members and the EU. This directly affects the equalization of tariffs and the Harmonized System nomenclature. Customs rates range from 0 to 30%. I Live animals, animal products 17.30% II Plants, products 12.88% III Vegetable oil, animal fat, wax 6.74% IV Food industry products, beverages, alcohol and vinegar, tobacco 21.18% IX Wood, wooden products, cox, cork, hay 3.30% (33) 3.5 Cool chain in Serbia
3.5.1 Post-harvest practices Farmers are applying limited post-harvest handling practices, resulting in some product loss due to damage, decay and destruction. Farmers focus on the production and harvest with little thought given to harvest maturity, the type of harvest equipment and harvest practices to enhance the handling of products. Fruits to be stored for extended periods are often harvested too late (mature). Simple devices for defining the optimal harvesting time/maturity level are not used, including guides for the harvesters (6). Proper harvest density is often not maintained, resulting in the over supplying of facilities with ripe fruit. Products are harvested without forethought in an “all or nothing” approach. The field level pre-cooling of harvested products is non-existent and should be introduced. Fruits are transported from the field using ambient transport vehicles without the removal of field heat prior to processing, storage or sale. Equipment for product washing and the removal of field heat is not common. Many facilities do not have adequate receiving and shipping areas (enclosed, refrigerated and raised docks) and operate at ground level. In addition, many facilities have a single area for both functions, with a counter flow of products (6). 5.3.2 Cool stores and cool processing Facilities are either large, state built (Ammonia type), generally in a usable condition, or smaller, private (Freon type) and in good technical condition. Other facilities are Ultra Low Oxigen (ULO) cold stores for fresh products. All cold stores of this type are new, with very sophisticated technology. The facilities are classified into three categories: 1) Processing with cold storage capacity 2) Processing with cold storage capacity and refrigerated transportation 3) Cold storage without processing or transportation capabilities Facilities are located close to where the production takes place. Most facilities are of small or medium size, capable of storing between 150 and 2,500 tons of products, although some very large facilities have 11,000 ton capacities. Most systems utilize glycol (anti-freeze) in the piping to deliver the refrigerant to the rooms, rather than potentially exposing the products to Freon or Ammonia. Preventative maintenance is minimal, with efforts focused on addressing maintenance problems as well as equipment failures. The utilization of cooler storage space and First In - First Out (FIFO) practices for chilled and frozen products is not always effective and training is needed. Most freezers are overstocked

92
Regional Rural Development Standing Working Group in SEE
or overloaded for their maximum air flow and functional use and do not utilize racking systems for palletized products, thereby reducing cooler space utilization by 50%. For the most part, the simple processing equipment is adequate for the level of processing being performed at the present time. The packaging technology utilized for commodity shipping and storage does not properly support the products being shipped or stored. Consumer packaging is adequate for the existing market (18). 5.3.3 Storage and transport capacity Serbia has a strategic geographic position and it offers a good transport potential via Pan European Corridors VII and X. The road network is 40,845 km long. Serious efforts have been made for the restructuring of the railway network aimed to use its cost effectiveness and good communication with all major destinations throughout the Pan European Corridor X. The total length of railway tracks is 3,808 km. There are two commercial airports located in the cities of Belgrade and Nis. Belgrade airport has daily connections with all major airports in Europe. All the major airline companies have scheduled flights to and from Belgrade. It is estimated that over 95% of fruit products are transported by road, with a very small percent utilizing air freight or river transport. Refrigerated transportation is offered by privately held companies, although some companies have refrigerated trucks to complement processing and storage operations. The transport of pre-cooled and frozen produce is well developed and not a constraint for the producers. The quantities are delivered gradually throughout the year providing sufficient time to organize logistics of the deliveries. Trucks used for local distribution come with a three to five ton capacity, whereas long haul exports utilize large 20 ton trucks. The trade routes and the logistics are well known and established. The storing capacity for chilled and frozen products is much larger than the annual production. During peak seasons all cold storage space is being utilized, however, this includes storage of fruit of inferior quality which could add up to 30% more if eliminated with sorting and grading. The cold storage capacity is not a limiting factor to the growth of the cold chain at present, and private investment and interest is adequate to meet the needs for growth in the future (18). The packing and distribution network for fresh berries and the packing operations are limited, and require investments in order to accommodate larger quantities for international markets. 5.3.4 Management The management of the cold stores has different levels of awareness, mostly according to the owner’s background. There is a general lack of awareness of the benefits of an integrated cold chain, and the impact “downstream” associated with breaches in the cold chain. Companies tend to suffer some losses associated with poor cold chain management (6). All sectors experience constraints in their ability to purchase and install modern technology for farming, harvesting, packaging, processing, storage and distribution. There is a limited scope of reference for making key decisions for the selection of the proper refrigeration equipment. Due to the small number of sales representatives, there is limited exposure to new technologies other than what is currently being offered. As a result, the equipment being used appears to be of the lowest quality and durability, which will lead to costly upgrades or repairs in the future. Interviews indicate that the process for obtaining construction permits, both actual and temporary, for facility upgrades or construction can take between six months to a year. There is little awareness for more energy efficiency in the production procedures and the acquisition of new equipment. The biggest problem regarding infrastructure seems to be electrical power supply. It is a common practice that investors are required to build a section of infrastructure to be owned by the infrastructure company (18).

93
Regional Rural Development Standing Working Group in SEE
3.6 Food safety and quality assurance Table 1.1 Agricultural areas under organic production
Good agricultural practice exists as requirements from various segments in different parts of the primary and secondary legislation which are below the EU requirements. Service providers (implementers and certifiers) for Quality Assurance (QA) standards in the primary Source: GIZ production are readily available and increasingly engaged in the sector on demand.
The Quality Assurance Standards (QAS) are mostly implemented by large producers as part of quality arrangements with buyers. Organic production exists in a limited but increasing quantity due to demand. Most producers lack the necessary information about markets due to their fragmented nature. The number of organic farms was estimated to be 3,000 in 2010. More than 60% of them operate on less than 6 ha and 25% on 10-20 ha. Control and certification in organic production are carried out by national and international control organizations, authorized by the Ministry of Agriculture. Most of the organic products are exported to foreign markets. The highest value of organic products exports was in berries, sour cherries, apples and other fruits. Certified organic products are labeled by the national mark “ORGANIC PRODUCT”. Processed organic products may bear the national label if they contain at least 95% of organic production ingredients. About 30 companies manufacture organic products, virtually all of them processing conventional produce while additionally operating an organic line. A national vertical association on organic agriculture was founded, uniting the participants under a joint objective and mandate. Made up of 60 members, 50% of them are traders/processors, 30% are from academia and official institutions, and the balance from farming (11). Over the last ten years the market has shown a growing demand for food products characterized by authenticity and tradition. So far, 29 agricultural and food products have been registered for protected geographical indication/ protected designations of origin (PDO/PGI), and nine are in the registration process. Government support for the introduction of quality assurance standards, organic production and PDO/PGI in both the primary agricultural sector and processing is available. Incentives provide for the recovery of 50% of the certification costs, or up to 300,000 RSD (€ 2,678) (12). Some donor support projects are also assisting the sector. Food safety and food quality issues are becoming essential prerequisites for the sector. Apart from the requirements of foreign buyers and markets, HACCP is now a mandatory requirement for all food operators. Food safety in the processing industry is controlled by the inspection services in the ministries. Modern cold stores with QAS in place have a positive impact on the rest of the market. HACCP procedures and general sanitation programmes need further improvement (6).
3.7 Credits and loans availability The financial industry is relatively well developed, and offers specialized products for different agricultural activities including primary production and processing. The funds for the credits originate from various support credit lines.
3.7.1. Primary production Primary producers usually lack means for collateral (assets), otherwise they would also apply for credits. Agricultural land is usually not acceptable as collateral, unless it is located
Category Crop Area converted
(ha)
Area in conversion
(ha)
Total (ha)
Perennials Apples 650 550 1,200 Raspberries 360 20 380
Strawberries 80 10 90 Plums 420 170 590
Cherries 100 50 150
Other 0 0 2,560

94
Regional Rural Development Standing Working Group in SEE
on an attractive location. Producers mainly acquire credits by using friends and relatives as guarantors. The interest rates for primary producers are on average slightly higher than those of the processors and range between 8 and 12%. Credits originating from the funds of the banks are usually 3-5% higher compared to the credits provided through specialized crediting lines. Micro-crediting institutions and banks in the commercial banks exist, mainly supporting small producers without collateral -however, they come with higher interest rates. 3.7.2. Processing industry Bank loans are offered only at rates from 5-12%. Many of the processors are using different credit lines, using the facilities and the equipment as collateral. The government is supporting agricultural crediting by subsidizing part of the interest of credits under the condition that the repayment period is longer than three years and that the borrower pays a fixed effective interest rate of 6% per annum during the loan repayment. The support is available for the development of horticulture, for investment in agricultural machinery and equipment, as well as investments in agricultural buildings (26). The incentives are applicable if the borrower is an individual or an entrepreneur and the total approved loan amount is up to 5 million RSD (€ 44,643). For co-operatives, the total approved loan amount must be up to 15 million RSD (€ 133,928). The support is provided through a range of commercial banks across the country.
4 GOVERNMENT FOREIGN INVESTMENT SUPPORT AND SUPPORT TO THE AGRO AND FOOD SECTOR
4.1 State grants
Table 1.2: Financial incentives for investors Eligible projects Investments of
special importance
Large investment projects Mid-sized investment
projects
Amount of funding (€) Up to 17% of the total investment
amount
Up to 17% of the total
investment amount
Up to 20% of the total investment
amount
Up to 10% of the total investment
amount
Minimum investment amount
€200 million €100 million or greater
between €50 and €100 million
€50 million
Minimum number of new full-time jobs
created
1,000 300 150
Financial incentives
Eligible investment
projects
Direct investments
Manufacturing sector Internationally- marketable
services
Strategic projects in the field of
tourism
Investments in Underdeveloped
regions
Investments in Standard regions
The entire territory of
Serbia
The entire territory of Serbia
Amount of funding (€) 4,000-10,000 for each new job
created
4,000-10,000 for each new job created
4,000-10,000 for each new job created
4,000-10,000 for each new job created
Minimum investment amount
€500,000 €1,000,000 €500,000 €5 million
Minimum number of new jobs created
50 50 10 50
Source: SIEPA

95
Regional Rural Development Standing Working Group in SEE
A new investment package has been prepared for those investing into Serbia. State grants are offered for Greenfield and Brownfield projects in all industries, except for primary agriculture, the hospitality industry, retail and the production of synthetic fibers and coal. For Greenfield and Brownfield projects in manufacturing, the export-related services sector and tourism, non-refundable state funds are offered in the range of sums between €4,000 and €10,000 per new job created within three years.
Companies under the following circumstances are excluded from applying: Those which in the past 12 months have reduced their registered equity by more than 50%
but not below the legally-mandated minimum
Companies against which bankruptcy proceedings are underway or those who fulfill legally-defined conditions for initiating bankruptcy proceedings
Those with outstanding obligations towards the Republic of Serbia
Those who have already received funding for the same purpose
Those whose founder or majority owner is the state (34) Funds are awarded in accordance with the location of the investment and the degree to which the project fulfills the terms and conditions put forth in the decree. Awarded funds are disbursed depending on the type of investment:
Greenfield investments - four equal installments of 25% throughout the project
Brownfield investments which do not include reconstruction - two installments of 30% upon concluding a purchase contract for the building or upon submitting a property deed, and 70% after achieving the envisaged level of employment
The National Employment Service grants provided to investors are depicted in table 1.3. Table 1.3: Financial incentives for employment
The National Employment Service Grants
Program The Employment Subsidies Programme
The Apprentice Programme
The Re-training Programme
Grant amount per employee € 850-1,700 €170-210 € 850 Source: SIEPA
4.2 Other incentives
4.2.1 Incentives for employing new workers A taxpayer employing new workers is entitled to a tax reduction for the amount equal to 100% of the gross salaries increased by the contributions paid by the employer. This tax credit is recognized for a period of two years, provided that the number of employees is not reduced during that period (34). 4.2.2 Incentives for investments in undeveloped regions The taxpayer generating profit in a newly established operating unit- in an underdeveloped region- will receive a tax credit for up to two years in an amount proportionate to the profit of that unit against the overall profit of the company (34). 4.2.3 Local incentives A wide array of incentives is also available at local level, varying in scope and size from one city to another. The major incentives comprise of the following:
City construction land lease fee exemptions or deductions, including the option of paying in installments with the prior consent of the Serbian government
City construction land development fee relief such as fee exemptions or discounts for one-off payments
Other local fees exemptions or deductions (34)

96
Regional Rural Development Standing Working Group in SEE
4.2.4 Accelerated depreciation Taxpayers have the right to apply accelerated depreciation at rates up to 25% above the prescribed ones. This relief is provided for fixed assets used for environmental purposes, research, education, training of employees and computer hardware (34). 4.2.5 Customs-free imports of machinery and equipment Foreign investors are exempt from customs duty on imported equipment and machinery which represents the share of a foreign investor in a capital of a company in Serbia.
4.3 Technological- Industrial Development Zones There are several free zones which are currently operating in Serbia: Pirot, Subotica, Zrenjanin, Kragujevac, Sabac, Novi Sad, Uzice, Jug and Smederevo. When doing business in free zones, investors are provided with special benefits and a favorable tax regime that includes exclusion from VAT and custom duties for raw material import for export goods production, machinery, equipment, and building materials. Imports and exports within free zones are unlimited. Goods that are imported from free zones into the domestic market are subject to the foreign trade regime. Free one business makers are supplied with office space, workshops or warehouses on a rental basis and superior terms. Earnings and revenues created within a zone can be transferred to any country, including Serbia, freely, without any prior approval, and are not subject to any kind of taxes, duties or fees (34).
4.3 Government support for the agro and food processing sector The national programme for agriculture is designed to provide support to the areas in agriculture which are in need of development. Its main goals include:
Increasing the competitiveness
Food quality and safety assurance
Support to the living standard of the agricultural producers
Rural development, environmental protection
Aligning to the EU
Joining of the WTO The Directorate for Agrarian Payments, as a part of the Ministry of Agriculture, Forestry and Water Management, has several roles: it performs activities related to the implementation of the subsidies programme in agriculture;, makes calls for applications; decides upon the right to assistance; makes payments to the final beneficiary; performs administrative and on-the-spot checks; establishes and keeps accounting records of contractual obligations and payments; implements international assistance to agricultural policy; manages the Farm Register. The national programme for agriculture comprises of a number of measures divided into three categories, however, it lacks annual consistency in the selection of the measures (29).
4.3.1 Direct incentives
The premiums are cash amounts paid to farmers for the agricultural products supplied
Incentives for the production of the cash benefits that are paid per unit of planted crops and livestocks of suitable species
Refunding of a certain percentage of the amount paid for purchased inputs for agricultural production (fuel, fertilizer, crop insurance, fruits and animals, storage costs and so on)
Support for farmers only having income from agricultural production and entered in the register of agricultural holdings as non-commercial farms (29)
Direct production support for berries and plums
Reimbursement of diesel fuel for spring works per hectare of arable land is provided for the production of fruit and grapes of up to 100 liters per hectare
Incentives for introduction of international standards for farms and co-operatives, small and medium enterprises and entrepreneurs. The grants are approved for implementation and certification of Global GAP, ISO 22000, ISO 14001, Organic, BRC, HACCP, and so on. Funds are allocated to a minimum of € 500 and up to a

97
Regional Rural Development Standing Working Group in SEE
maximum of € 5,000. Refunds amount to 70% of the total project amount, with a maximum amount of € 5,000 (29).
4.3.2 Structural incentives
Rural development measures are the types of incentives that encourage the improvement of competitiveness, the improvement of environmental protection, biodiversity conservation, the diversification of the rural economy and the improvement of the quality of life in rural areas
Measures to improve care and quality of agricultural land are types of incentives used for improving the physical, chemical and biological soil properties. Incentives for land protection are anti-erosion measures, control measures, soil surveys, land consolidation, land reclamation and other measures to protect the land
Measures of support that encourage programmes of agricultural research, extension service programmes, agriculture promotion, agricultural market information systems, as well as other programmes (29)
Structural support for berries and plums
Incentives to raise production in orchards of fruit trees, vines, hops and gentian, usedfor the reimbursement of costs of seedlings. The applicant has the right to stimulation funds raised for a minimum area of 0.1 hectare for yellow gentian, 0.3 hectare for each type of small fruits, vines and hops and 0.5 hectare for each type of pome or stone fruit. The maximum supported area is 10 ha. Incentive funds for productive plantations are established on the basis of the number and categories of seedlings planted per hectare. The applicant will be supported if at least 90% of the planted seedlings are certified
Incentives for investment in production and marketing are used for the purchase of new equipment and machinery. Incentives can be obtained if the minimum value of investments is 30,000 RSD (€ 267.2 ) without VAT, with a maximum of 2 – 4 million RSD (€ 17,857 – 35,714 ) for individual entrepreneurs or co-operatives/associations (29)
The structural support is also apart from an ongoing bilateral Danish development programme for fruit growing in Southern Serbia, provided through the Fruits & Berries Programme which aims to improve the production, processing, marketing and sale of cherries, plums, sour cherries, raspberries, blueberries, strawberries, blackberries and wild berries. The programme is realized on the territory of the Nis, Toplica, Jablanica, Pcinja and Pirot districts for four years (30). The competition is open for individuals, entrepreneurs, SMEs and co-operatives.
Incentives to support investments in primary production increasing production of cherries, plums, strawberries, raspberries and blueberries. Compensation of costs for the planting of 0.15 -2 ha of berry plantations or 0.5 ha – 10 ha for fruit trees. For raspberry plantations with different varieties and a planting rate between 6,500 and 8,000 roots/ha, the subsidy provided is 250.000 RSD/ha (€ 2,232). For single variety plantations with 10,000 to 18,000 roots/ha, 240,000 RSD/ha (€ 2.142) are awarded. An additional 50,000 RSD/ha (€ 446.4 ) are awarded for planting in less favored areas. Relevant for plum plantations with different varieties and a planting rate, between the subsidies provided, between 210 and 240 RSD/root (€ 1.87-2.14). An additional 50,000 RSD/ha (€ 446) are awarded for planting in less favored areas. Business plans must be evaluated with more than 10 points by the Fruit and Berry Project (30)
Incentives for investments in mechanization in connection to the production/processing of cherries, plums, strawberries, raspberries and blueberries. Incentives are used for the purchase of new machinery for the planting and removal of pruning waste, for the protection from diseases, pests, weeds and the cold, for irrigation, harvesting, greenhouses, washing, calibration, grading, storing, packing, sorting, drying, polishing

98
Regional Rural Development Standing Working Group in SEE
and packing, box pallets and pallet frames for storage, refrigeration equipment and equipment for cold storages. Incentives of up to 50% of paid costs for investments to a maximum amount of 20,000,000 RSD (€ 178,571) (30)
4.3.3 Market incentives include
Export incentives are realized as a return on the percentage of the value of exported goods
Storage costs are cash amounts paid to farmers for the storage of agricultural products in order to prevent market distortions
Credits support the types of incentives that are used for the enhancement of agricultural and food production (29)
Market incentives for berries Marketing incentives subsidizing the costs of storage for frozen raspberries in a public warehouse are available for producers for the yield of a maximum area up to 20 acres or 20 tons /hectare.
4.3.4 Export promotion and investments support
The Serbia Investment and Export Promotion Agency (SIEPA) helps both foreign investors set up their businesses in Serbia and local producers boost their export volume. Created as a one–stop information shop, SIEPA acts as a partner for international companies in investment projects to ensure the best results. As a central institution in the field of foreign direct investments, the agency is tasked with promoting Serbia’s rapidly improving business climate and enhancing FDI inflow. SIEPA also supports the promotion of exports and helps local businesses utilize Serbian comparative advantages. This task is carried out through:
Identifying local partners and suppliers, including meeting facilitation
Maintaining investment and exporters’ databases
Delivering sector analysis and studies
Helping Serbian exporters service international markets
Assisting in the promotion of domestic products at international fairs
Managing a cost-sharing development grant programme, enhancing the competitiveness of Serbian companies (33)
Table 1.4 Availability of export support services in Serbia Export support services Status
Market intelligence Available
Export promotion and fair participation Available
Export documentation support Available
Export coaching for SMEs Available
National Accreditation Agency Available
National accredited certifying Bodies for GG, HACCP, BRC, ISO Available
International accredited certifying bodies GG, HACCP, BRC, ISO Available
ISO certified laboratories Not Available Source: SWG RRD
At a regional level, from 1998, a co-operative structure for trade promotion has been working in the region as the Balkan Regional Centre for Trade Promotion (www.balkantrade.org). Turkey, Greece, Serbia, Romania, Montenegro, Macedonia, Bulgaria and Albania are members of this Regional Centre for Trade Promotion. It appears that this organization functions merely on paper and that the reason for its existence is of a political nature and does not provide any services to exporters (26). 4.3.5 Insurance of agricultural production

99
Regional Rural Development Standing Working Group in SEE
The government is subsidizing the insurance of animals, crops and fruits (this was available in 2011), for the reimbursement of insurance of animals and the area under vegetable crops. Farmers are entitled to use the funds for the reimbursement of insurance in the amount of 40% of the premium net of tax on non-life insurance premiums (29).
5 OVERVIEW OF THE TAXATION IN THE COUNTRY
5.1 Brief overview
21
Tax rates
Value added tax (VAT) Standard rate -18% Reduced rate -8%
Social security contributions Pension and disability insurance - 11% Health insurance -6.15% Unemployment insurance -0.75%
For Legal Entities Corporate profit tax 10%
Taxes on dividends, shares in profits, royalties, interest and capital gains
20%
Personal income taxes
Capital gains, income from agriculture and forestry, self-employment, capital and personal insurance
10%
Salary Tax 12%
Copyright, property, profits from gambling and other income 20%
Annual income tax 10/15%
5.2 Profit tax
Non-residents are taxed with respect to income generated on Serbian territory
The taxable base is the gross salary, including salary tax and social contributions
The taxpayer is entitled to a tax credit in the amount of tax already paid on the income earned abroad
In the case of salary tax, the person taxed is the employee but the employer is responsible for calculating and paying personal income tax on behalf of his/her employees. The taxable base is the gross salary which is comprised of the net salary and social contributions. Non-residents are only charged based on income generated from their activities in Serbia. The tax base is the profit before tax shown in the company’s income statement and is further adjusted to tax return for tax purposes Capital gains are recognized for the purpose of a corporate tax assessment, and they are generated by the sale or transfer of:
Real estate
Rights related to industrial property
Shares, stocks, securities and certain bonds The sale of equipment and other fixed assets will not be considered as a capital gain for corporate tax purposes. Serbia has signed Double Taxation Prevention Treaties with 31 countries. The amount of tax due can be reduced by 20% of the amount invested in fixed assets for the respective tax period. Agriculture is entitled to receive a tax credit in the amount of 80% of investment in fixed assets. If the company is registered as a small enterprise, a tax credit is granted for fixed assets to the amount of 40% of the investment but it may not exceed 70% of tax due. This reduction cannot exceed 50% of the total tax liability for a single year. If not used entirely in one year, this tax credit can be carried forward for a maximum of 10 years (35). A five-year tax holiday is granted for concession-related investments from the day the concession investment has been completed. No tax is due if income is derived before the completion of the concession investment.
21 During September 2012 increasing of the VAT and income/profit tax were widely discussed across Serbia, however no such decisions were made.

100
Regional Rural Development Standing Working Group in SEE
The tax loss stated in the tax return can be carried forward and offset against future profits over a period up to five years. If a taxpayer already paid tax on the profit generated abroad, he/she is entitled to a corporate income tax credit in Serbia to the sum of the amount already paid. The same right is enjoyed by a taxpayer who earns revenue and pays personal income tax in another country, provided there is a Double Taxation Treaty with that country (35). 5.3 Property tax For taxpayers who maintain business accounts, the rate of property tax is set at the rate of 0.40%, and for others the tax rate varies and depends on the tax base. Individuals or legal entities that hold any of the aforementioned rights on immovable property in Serbia are subject to the property tax (35). 5.4 Tax on sales of real estate The tax rate on the transfer of ownership rights is as follows:
A 5% tax rate is applied to the transfer of ownership of real estate and taxable property
In instances concerning the transfer of rights over agricultural land, forest land and used motor vehicles, the rate is set at 2.5%
The tax rates on the transfer of absolute rights are proportional and are as follows:
For the transfer of shares in legal entities, stocks and bonds: 0.3%
For the transfer of other absolute rights: 5%
The provisions of applicable double tax treaties regarding withholding tax will apply (35) 5.5 Personal income tax For Serbian citizens, the annual income is taxed if it exceeds the amount of five times the average annual salary. The tax rate is 10% for the annual income below the amount of eight times the average annual salary, and 15% for the annual income above that amount. The taxable income is reduced by the amount of 40% of an average annual salary for the taxpayer and by the amount of 15% of an average annual salary for each dependent in the family. The total amount of deductions cannot exceed 50% of the taxable income. Deductions also apply to foreign citizens. For non-Serbian citizens the annual income is taxed if it exceeds the amount of three average annual salaries in Serbia. The tax rate is 10% for the annual income below the amount of six time’s average annual salary in Serbia, and 15% for the annual income above that amount. The employer who hires certain categories of workers on a permanent basis is exempt from paying salary tax over a period of two or three years as well as social insurance contributions over a period of two or three years, depending on the category of workers hired (35), as shown in the table below. Withholding tax is not applied to dividend payments between Serbian entities. For non-residents of Serbia, a 20% withholding tax is calculated and paid on certain payments, such as dividends, shares in profit, royalties, interest, capital gains, lease payments for real estate and other assets. The personal income tax rate is 12% for salaries. Withholding tax is calculated and paid on certain payments at a rate of 20%. The provisions of applicable double tax treaties regarding withholding tax will apply. 5.6 Value added tax (VAT)
3 years For apprentices aged under 30 and unemployed with the National Employment Service
For disabled persons
2 years For persons aged under 30 who have been registered as unemployed with the National Employment Service for more than three months
For persons aged 50 or older who have been registered as unemployed with the National Employment Service for more than six months and receive salary compensations
For persons aged between 45 and 50 (an 80% exemption)

101
Regional Rural Development Standing Working Group in SEE
The taxable base is the fee for products and services sold, including customs duties, excise taxes paid, transportation and insurance costs or any other cost relating to the sale of goods and services. Tax liability arises on the first day of the following events:
The sale of goods and services
The collection of a fee, if the fee or a part of the fee has been collected prior to the sale of goods and services
On the date of the origin of customs duties (in the case of imported goods) The VAT is payable at each stage of the turnover of goods and services as well as on the import of goods. The taxable base is the price of the products and services sold A 0% tax rate is applicable in two cases:
With the right for the deduction of input VAT – export of goods, international air transport
Without the right of deduction of input VAT – trading with shares and securities, insurance and reinsurance, the lease of apartments and business premises and others (35) 5.7 Subsector taxation details
Primary production The personal income tax on agricultural production is paid on cadastral property or realized income. The taxpayer has to decide through which model he/she will apply at the beginning of the year. Taxing on realized income is charged on the gross income realized, reduced by the estimated costs of 20%. Income tax for seasonal workers is 20% (25).
Processing industry Personal income tax for employees is charged on the basis of the salary level paid. It
ranges from 10-15%. VAT of 18% is paid on production inputs and 8% on sales of products. VAT is not charged
for the export of commodities. The processing industry advocates the reduction of VAT for locally produced and imported
plastic boxes used in the harvest, sorting and grading of the produce.

102
Regional Rural Development Standing Working Group in SEE
II. SUB-SECTOR – BERRIES AND PROCESSED BERRIES
1. DETAILED ASSESSMENT OF THE SUB-SECTOR
1.1 Primary production The Serbian cultivated berry sector, especially raspberries and blackberries, has been a source of steady income for growers and for the processing industry, and thus a driving force in agricultural economic growth for decades. More than 80,000 farms, 250 cold stores, and 100 processing factories are involved in the sector (6). Raspberries and blackberries are one of the top export commodities (ranked third, right after grains and sugar). The majority of the berries grown in Serbia are varieties for processing, grown in open fields using outdated technologies and with relatively low yields.
1.1.1 Raspberries Serbia is one of the biggest producers of raspberries in the world, with a production of 65,000- 100,000 tons reaching an average of 80,000 tons. Raspberries are the most commonly grown berries, occupying 65% of all planted berries in the country. The main varieties are Willamette (95% of all raspberries) and Meeker (1). These varieties are rich in flavor and color and highly appreciated for processing but less for fresh consumption. Larger farmers have started to diversify their cultivars with some varieties (Polka and Polana) that are more suitable for fresh markets, and with other varieties (Heritage, Glen Ample, and Autumn Bliss) that extend the harvest by up to four months. The area under raspberry production in Serbia is some 15,200 ha(2010), with an annual growth of 2.8%. The average age in years of the plantations is around 15 (1). The main raspberry producers are in Central Serbia, in the Zlatibor region, and in the town of Arilje at 330-1,382 m above sea level. Harvesting lasts for six weeks in June and July, overlapping with other competing countries. Raspberries are almost exclusively handpicked. During the harvest season the berry producers are assisted by an estimated seasonal workforce of 200,000 people, with a part coming from not only the Republic of Srpska but also neighboring countries. Graph 2.1 Raspberry production in Serbia (tons)
Source: Statistical Office of Serbia
Raspberry yields are between 5.7 and 5.4 tons/ha as shown in graph 2.1. The yields are below those achieved in the United States, the Netherlands, and Hungary, but above those in Poland (4 tons/ha) and Bulgaria (5.3 tons/ha) (6). 1.1.2 Blackberries Serbia is one of the biggest producers of blackberries in the world with a production fluctuating around 30,000 tons. The main varieties are Cacak Thornfree (75% of all production), Thornfree, and Black Satin, which fruits in August (6).

103
Regional Rural Development Standing Working Group in SEE
The production is fragmented, with an average size of only few acres. The 70,000 raspberry farmers also produce blackberries. Average yields are about 8 tons/hectare. Blackberries are seldom used fresh. Nevertheless, new varieties like Loch Ness, Chester and Darrow, with higher quality and a longer harvesting season, are increasing sales. Blackberries are produced in small plots with traditional methods and are harvested only by hand. The planting material is procured on the local market from local producers (85%), out of which about half is certified. Few farmers are producing their own planting material. Graph 2.1: Yields per hectare in raspberry production in Serbia
Source: Statistical Office of Serbia
1.2 Processing industry
There are approximately 250 chilling plants in Serbia, with storage capacities ranging from 100 tons to 10,000 tons. The largest concentration (87 chilling plants) is found within the municipality of Arilje. The current capacities for fruit freezing in Serbia exceed the fruit production (6). Serbia is a traditional exporter of fruit for processing, leaving it to other countries to add value. The types of products produced by the raspberry processing industry include:
Roland – frozen, even berries with adequate and uniform color and pure. Initially in four packs of 2.5kg each or packed into 300g, 450g or 1kg bags as a final product in EU shops (comprising 10% of total raspberry exports) (6)
Bruh - raspberries made from whole fruits, broken fruits and fruit pieces
Griz - frozen grinded raspberries packed in 10kg and 15kg containers for the food sector
Block – the last class of raspberries frozen into solid blocks for processing The types of products produced by the blackberry processing industry include:
Roland - whole frozen fruits, pure, black color and up to 5% of fruits with a ruby color
Konfitura - whole fruits without foreign bodies, pure with ruby color fruits up to 20-30% Less than 10% of Serbia’s total raspberry production stays in the country. Local processors use some 4,000 tons of raspberries processed into juices, concentrates, and preserves. Almost 40% of the blackberry production is not exported. A large portion of local sales (90%) goes to juice and concentrate processing. The local processing industry absorbs some 11,000 tons. Serbia produces small amounts of juice from cultivated berries. The production of conventional dried berry products is still limited. The production is about 12 tons/year and the whole quantity is exported. There is only one freeze-drying operation in Serbia. It delivers an annual production of 130 tons. All production is exported.

104
Regional Rural Development Standing Working Group in SEE
1.3 Trade About 97% of Serbia’s exports of berries are sold to the EU, accounting for 65% of total EU imports. The price-based competitiveness is a result of the proximity (low transportation costs) as well as low labor costs compared with Serbia’s main competitors in Europe (Poland and Hungary). Serbia’s share of the total world raspberry exports is about 45%, making it the largest of any country. However, in terms of value, Serbia is third, with a share of 13%. This is mainly due to the low competitiveness and profitability in the production and sales and could possibly be increased by further investment and marketing. Table 2.1: Berries production, exports and value
Item Quantity in tons
% of total production
Exports in tons
% share in quantity of
total exports
Export, millions in
$
Average export
price, $/kg
Raspberries 79,700 100% 102 1.44
I Processing 1) Pre-cooled 9,600 12% 5,332 9 5.3 1.00 2) Bulk 61,000 74% 50,800 78 7.3 1.50 3) Retail pack 9,000 11% 8,550 13 18.3 2.20 II Fresh 2,370 3%
Blackberries 32,000 100% 30.1 1.57
I Processing 1) Pre-cooled 14,000 43% 2,700 14 3.8 1.43 2) Bulk 13,000 50% 13,000 81 24 1.50
3) Retail pack 1,000 3.5% 1,000 5 2.3 2.30 II Fresh 1,000 3.5%
Source: USAID/DAI
The share of export in the total blackberry production is 60%. The export price ranges from € 0.97/kg to 1.2/kg, following a steady growth trend since 2001 (6). The main foreign markets are shown in the table below. Exports of berry preserves are increasing but are modest. Local consumption of blackberries is increasing significantly (up to 2,300 tons/year) as a result of the fluctuating exports and prices, while imports are negligible. The largest portion of exports is from processed frozen raspberries, followed by processed frozen blackberries. In addition, the local market absorbs approximately € 16.1 million worth of berry products, broken down into € 7.7 million in fresh berries, € 7.7 million in juices, and € 0.77 million in frozen retail berries (1). Table 2.2: List of importing markets for frozen raspberries and blackberries exported by Serbia
Importers Exported value in USD thousands
2007 2008 2009 2010 2011
World 170,481 204,230 206,831 187,834 209,995
Germany 46,776 59,424 72,412 61,480 75,003
France 37,227 49,916 43,071 40,611 40,874
Belgium 14,644 19,930 22,000 19,692 23,782
Austria 23,118 20,979 14,650 14,126 12,704
United Kingdom 11,398 8,052 7,798 7,534 10,302
Netherlands 10,297 7,558 7,702 6,672 8,197
Sweden 4,912 8,693 10,359 7,146 5,994
Poland 2,045 2,685 4,898 4,692 5,193
Italy 2,568 4,451 5,171 5,711 5,189
Switzerland 4,075 5,232 4,214 4,014 4,419
Denmark 2,258 3,560 4,266 3,997 3,927
Russia 207 305 416 570 1,765 Source: ITC calculations based on UN COMTRADE statistics

105
Regional Rural Development Standing Working Group in SEE
The raspberry export price is heavily affected by global supply and demand, as well as by the dollar-euro exchange rates. In 2001, the average export price was € 0.77/kg; it reached a high of € 1.27/kg in 2004 before dropping to € 1.1/kg in 2006, while average prices by its main competitors ranged from € 1.1/kg (Hungary), and € 1.24/kg (Bulgaria) to € 1.33/kg (the Netherlands). The average price of Poland’s raspberry exports is quite a bit lower (€ 0.71/kg), due to high share of pre-cooled raspberries in total exports (6). Organic frozen berries are primarily exported to the same buyers as conventional berries. Total exports of frozen organic berries amount to 2,000 tons of raspberries and 500 tons of blackberries. Pre-cooled raspberry exports (raspberries shipped in tanks for processing) have a 7-12% share of total raspberry exports. Berries are bought from farmers at € 0.53/kg and sold at an average price of € 0.77/kg. Pre-cooled blackberries are now in high demand by processors due to the widespread promotion of their health benefits. 35 - 43% of all blackberries produced are absorbed in this channel, a share which is much higher than in the raspberry supply chain. Depending on the season, farmers usually get from € 0.61 to 1.22 for these lowest-quality blackberries (6). This blackberry production is sold to local processors which use it to produce concentrates, purees, and preserves. When comparing average export prices of raspberries and blackberries, it is evident that blackberries have a much higher and more constant rate of growth. Export prices of blackberries even occasionally surpass the export price for raspberries. This trend may be partially attributed to an increase in the world raspberry production and lower demand, but is also a result of improved marketing for blackberries (promotion of the health benefits of darker fruits and high prices for raspberries which drove processors to less expensive fruits). Exports of individually quick frozen (IQF) berry products (“rolend”) make up some 34% of total raspberry exports, with an average export price of € 1.44/kg. The share of rolend raspberries has risen steeply in recent years. Roland blackberries reached a 70% share in total blackberry exports, with an average export price of € 1.30/kg.
Graph 2.2 Volumes of raspberries used locally (6,800 tons)
Serbia’s frozen retail pack supply chain is small but growing. It is a business direction for Serbian companies which did not exist a few years ago. Companies are exporting frozen retail packs through foreign traders (importers) and directly to foreign supermarkets, while local supermarkets absorb on average 5% of the retail pack output. Source: EPICenter Frozen retail packs in other countries are, most commonly, mixes of blackberries and other berries, though in Serbia blackberries are sold in single packs. Fresh berries are sold only in the local “green markets” (farmers’ markets for fresh produce) or supermarkets. The total quantity of fresh berries sold is still insignificant in volume, but that is changing. Quantities are increasing annually by 30% on average, providing Serbian farmers from € 1 to 2.3/kg, or a 50 to 300% price increase over conventional bulk frozen products (6). Serbia is still not exporting fresh raspberries, although the prices for fresh raspberries are several times higher. Fresh raspberries from Spain fetch an average of € 5.3/kg, while fresh

106
Regional Rural Development Standing Working Group in SEE
raspberries from France averaged € 6.9/kg. Fresh varieties are usually not good for processing, but there are some varieties, such as heritage, which can be used both ways. There is limited interest for fresh blackberries and therefore there are no fresh blackberry exports. Serbia exports 17,700 tons of berry juices with an export value of € 16 million. The primary importing countries are Montenegro, (7,238 tons), Bosnia and Herzegovina, (4,474 tons) and Macedonia, (2,564 tons). The combined retail juice exports to CEFTA members accounted for € 6.6 million, or 41% of Serbia’s berry juice exports (1).
Graph 2.3: Blackberries used locally (12,300 t)
Berry juice concentrates are primarily exported to Germany (1,087 tons) and Austria (1,434 tons), accounting to € 7.5 million, or 47% of berry juice exports. Since 2002, Serbia has enjoyed a compound annual growth rate of 17% for berry juice exports to all importing countries. Organic juices, concentrates, and purees, certified by international bodies, are exported. Prices for organic products average 30% higher than conventional ones (11). Source: EPICenter
2. SUPPLY CHAIN DESCRIPTION
A schematic of the supply chain and the parties who directly support or have an effect on the performance of the chains is depicted below. The interdependency in the supply chain is significant due to a lack of market alternatives and perishability of the produce.
Source: SWG The processing berry supply chain is complex, involves many participants and is evolving. A few years ago, the frozen retail channel did not exist, as cold stores were selling all berries as pre-cooled or frozen bulk.
Supply chain role players
Banks and lenders
Ministries and Payment Agency
Retail input shops
Horizontal associations and organizations
Insurance agents
Certification bodies
Government inspections
Export and business promoters

107
Regional Rural Development Standing Working Group in SEE
2.1 Supply chain actors
2.1.1 Regulators of the supply chain Until a few years ago, the state was involved in price regulation. The democratic changes ensured a liberalized market and prices now depend on local and world supply and demand. However, this is not accepted so easily by the farmers. The new Law on Registration of Crop Varieties regulates the registration of newly created varieties and shortens the registration time for varieties of crops from 15 to 10 years. This law also defines conditions for the registration of crop varieties, procedure of crop registration and conditions for maintaining crop varieties. The Law on Organic Production defines all aspects of organic products. The law regulates the production, systems and methods of organic farming, as well as systems of controlling and certifying the whole supply chain. The Law on Food Safety ensures a high level of protection of the life, health and interests of consumers, while ensuring efficient food trade. The main concepts encompass traceability, the registration of businesses dealing with food, national reference laboratories and internal controls on GMP, GHP, or HACCP depending on the type of food businesses. The main difficulties in the implementation of the Law is the capacity of the inspection services to conduct food safety controls of non-animal food products in production, processing, wholesale and exports, and introduction of internal controls in businesses. The Law on Public Warehouses for Agricultural Products enables the implementation of the warehouse receipts system which is an alternative solution for commodity producers, processors and traders to access short-term financing for operations, take advantage of price fluctuations and secure the storage of their produce. The law has also enabled the creation of a uniform and well regulated system for the storing of commodities, protection of depositors and the ensuring of quality and quantity of deposited commodities. It also afforded the opportunity to agricultural producers to take advantage of higher prices during the off-season periods.

108
Regional Rural Development Standing Working Group in SEE
Source: SWG
2.1.2 Agriculture input suppliers The input suppliers can be generally divided into wholesalers and retailers. Wholesalers are often producers/packers/importers of different agricultural inputs. They rely on a network of agricultural pharmacies for the distribution of the inputs to the agricultural producers. Most of the wholesalers are crediting retailers to a limited extent, while they are credited by banks. On the other hand, the retailers are generally not crediting farmers. Serbia has no major producer of fertilizers or pesticides, and plants of new varieties usually have to be imported since there are no modern nurseries. 2.1.3 Producers In Serbia the size of an average farm is 2.5 ha, divided on average into four plots per farm. Fewer than 6% of farms operate on more than 10 ha. Raspberries are grown on 70,000 small farms (roughly 0.5 ha), which is the easiest way for farmers to manage from a labor point of view. On plots of 0.5 to 1 hectare, raspberries are picked by household family members while bigger plantings require labor to be hired (6). There have been two trends in the last decade, namely: 1) A decrease in the total number of farms and the increased share of non-agricultural farms
22
22
Whose members perform non-agricultural professions or agricultural profession but outside their own family
holding, or their income derives from a pension, other property, social welfare or other sources

109
Regional Rural Development Standing Working Group in SEE
2) Non-agricultural farms have become a dominant economic category, with a share of 62% in the total number of farms, whilst the number of agricultural
23 (17.8%) and mixed farms
(16.4%) is almost the same On average there are 4.6 members per household. 85% own land and 15% do not own land. Only 2% of those who rent land acquire it from the state (23). Raspberry growing on average makes more than 50% of most farmers’ income. But in some
households raspberry growing makes up 100% of the income. Producers depending
exclusively on raspberry get their income reduced if the prices are low.
Reinvestment in the modernization or enlargement of the production is limited. Investments
in development, and occasionally in the next season’s production, are at times credited. The
employment level in berry producers is below 30%, with young people leaving the farms.
There are a number of larger producers/companies that operate on much bigger plots. In most cases they are operating as concessioners of state-owned land. Some companies are involved in a very sophisticated production with heavy investments, taking agriculture to a new level. The large individual producers and especially the legal entities are heavily dependent on the seasonal workforce for the harvest. The number of processors involved in primary production is increasing and most processors are trying to integrate with the farmers through the provision of planting materials and technical support. Farmers lack knowledge about inputs and how to use them, with state-owned extension services functions having limited impact. Irrigation and anti-hail nets are not used in 99% of berry production and farmers rely on traditional ways of production (1). The largest costs for the producers are fuel/energy, transport and pesticides which account for over 52% of the cost. 4% of the farmers are insuring their production, as most see it as economically unfeasible. 77% of farmers own a tractor aged 26 years-old on average, while 23% have access to irrigation. 45% have additional mechanization (1). Most farmers consider themselves as viable for credit for the modernization and improvement of their production. However, few farmers are obtaining credits and are indebted mainly for the increase of their plantations. More farmers are indebted for credits that are not related to their production. Small-scale farmers can jointly access credits through their co-operatives
24.
The harvest sometimes begins without declared prices and farmers deliver raspberries to the
cold store plants with indications of proposed prices which can vary significantly.
Under the current system producers are paid in cash but in certain instances the producers are crediting the berry industry interest free for up to four months. Farmers are generally unsatisfied with the buyout prices that are fluctuating. However, a deeper problem for the low prices is the lack of organization and coordination of the farmers allowing at times a monopolist approach from the processors. The various farmer organizations do not have a united voice, although at times they are managing to influence prices by organizing protests and maintaining communication with the processors and the government. Many processors fail to develop long-term relationships with suppliers. Efforts by processors to reach out to farmers and provide additional assistance with regard to improving quality and consistency seem to be having only limited success. 2.1.4 Buyout traders Following the collapse of communism, production properties and assets were split into smaller units. Marketing organizations and infrastructures, (cold storage and processing facilities), were no longer accessible to producers, and alternatives in the form of sales through intermediaries emerged. Most of the buyout traders/consolidators are legal entities spawned during the country’s transition, and supplied the services that were lacking. They are usually placed in the most
23
Agricultural holdings are those holdings whose entire income derives from individual farmers on the farm who are involved in marketable production. 24
A couple of hundred co-operatives exist and operate in Serbia

110
Regional Rural Development Standing Working Group in SEE
logistically beneficial locations and have weighing and cooling equipment. Buyout traders are classifying the raspberries into three classes, determined by the color and size of the fruits. Farmers sell 42% of the raspberries to the local buyout traders while 51% goes directly to processors. Farmers decide to whom to sell, mainly on trust and reputation since prices are relatively similar in the area (1). Another important factor is the advanced financing of inputs and contractual arrangements. Buyout traders and processors on the other hand provide advanced payments and contractual arrangements to reliable farmers/farmer groups. Weekly wholesale prices are officially noted in few wholesale markets throughout Serbia. The prices fluctuate on based on the period, the quantity to be offered and the demand. However, the harvest at times begins with indications of proposed prices, frustrating for the farmers. There are two ways that are mostly used to define the product prices. One price is based on single day pricing, with payment by the end of the day. The other is based on the “end price” policy, which is paid at the end of the harvest period. Some producers choose the single day price, while others wait for the usually higher end price to be defined. A sub-category of buyout traders are the traders that buy frozen products from the buyout traders/consolidators with small cold stores, or subcontract cold stores as service providers and sell the produce further along the chain. Traders are slowly leaving the frozen berry business. However, in the fresh berry business they are still dominant. They usually pack raspberries in smaller packs and sell them at green markets or supermarkets. 2.1.5 Processing industry In the 1990s, the sector was run by state-owned cold stores which sold their products to traders instead of exporting directly. They mainly exported lower-quality berries in bulk at low prices. By contrast, modern operators with professional management have direct contact with foreign buyers and export high quality berries to processors, importers and retail chains. There is a need to modernize the facilities to add more value and there are efforts for more investment in facilities for late-stage processing within cold storage facilities. Many small cold stores have developed business relationships with the larger, modern cold stores, for which they now serve as collection points. Since they are, in many cases, based in remote rural areas, it is easier for farmers to sell to them instead of going to the main collection points. In the past few years, a dozen more modern cold stores have appeared. With capacities exceeding 2,000 tons, these have the standards required to be a driving force for the sector. Few modern plants are producing concentrates and juices, conventional dried products, freeze-dried products and preserves. Small cold stores cool berries to 0
oC, then freeze them in freezing chambers or “tunnels”
and sell them to larger cold stores or traders. Larger cold stores sort, pack, and export the berries. Small cold stores sell 35% of their raspberries to local traders, though this share is decreasing as traders are being eliminated from the supply chain (1). Half of small cold stores’ production goes to foreign importers. The processing may be further split among pre-cooled, frozen bulk. The frozen retail channel is individually addressed below. The pre-cooled raspberries and blackberries have the lowest, and still in decline, value as more berries are being processed and sold as frozen bulk and retail packs. The majority of pre-cooled berry exports are raspberries, with pre-cooled blackberries primarily sold to local processors. The pre-cooled channel could gradually disappear, as quantities will be processed into frozen berries as more profitable exports. Small cold stores (up to 2,000 ton capacity) export 75% of total pre-cooled exports, while 25% goes through large cold stores (6).

111
Regional Rural Development Standing Working Group in SEE
Large cold stores, in the majority of cases, buy berries directly from farmers in their surroundings or through agents. They cool, sort, pre-pack and freeze in larger packaging, and also pack in retail packs if needed. Berries are exported in 20-ton refrigerated trucks to foreign buyers. The frozen channel absorbs 61,000 tons, or 74%, of all raspberries sold to foreign processors, retail packers and supermarkets (6). Large cold stores command higher prices, as they sell higher-quality berries and have long-term relationships with their buyers. Frozen blackberries in bulk absorb 50% of total blackberry production. The blackberry bulk channel is organized in the same way as the corresponding raspberry channel, only the prices and quantities are different. Large cold stores sell much higher volumes to packers than in the case of raspberries, since there is a trend for supermarkets not to sell blackberries in single packs but rather for packers to consolidate different berries into a mixed pack. Only one cold storage firm is vertically integrated
25 all the way to the field and is a role model
for all other berry farmers and cold stores, with 100 ha of land planted with different berries, mechanical harvesters and quality assurance certifications. Almost all of the processors are able to obtain credits from the commercial banks. Most of the processors are indebted for investment and turnover credits with mortgages to their processing facilities or other assets. Some of the processors are also indebted to their input and service providers. 2.1.6 Retail market Local retail markets have still not developed for berry products. Major retailers are significant driving forces in the retail market; their role should increase in coming years. Only the highest quality raspberries, for which farmers are paid € 0.69/kg, are sold in retail packs. Approximately a third of the raspberries sold in this channel are frozen, sorted, packed and sold to local retail outlets (5%), foreign distributors (90%), or directly to foreign retail chains (5%). 11% of Serbia’s total raspberry production is now absorbed by this, the highest value-added channel. The highest prices are achieved in sales to local supermarkets; quantities are growing but still insignificant (6). 1,000 tons of blackberries were sold through this channel. Large cold stores are the driving force as they do the sorting, packing and selling of retail blackberry products. Farmers are paid € 0.92/kg and small cold stores around € 1.07/kg. Most retail packs (90%) are sold to foreign distributors, while 3% are sold to local supermarkets and 7% to foreign supermarkets (6). Green markets still play a major role in the fresh berry business as the majority of fresh fruits are sold there. Fresh raspberries are only sold only, and their share in total raspberry production is 3%. Most fresh raspberries (1,700 tons) are used by farmers’ households, while 560 tons are sold in green markets and 120 tons are sold in supermarkets. Small farmers sell raspberries directly at green markets, while traders supply the supermarkets. Fresh sold blackberries participate with 3.5% of all blackberries produced. 200 tons are sold commercially on green markets. Farmers sell 150 tons directly at green markets, earning € 1.53/kg, while traders sell about 50 tons at the same price (6). 2.1.7 Importers Foreign importers and distributors play a significant part in the berry supply chain. The majority of trade goes through them, though local producers are gradually starting to export directly to the final buyers. The final buyers are supermarkets, hotels, restaurants, catering services and processors. Cold stores increasingly sell directly to them instead of going through wholesalers. All cold stores originally used to sell their products to packers. When their relationships grew stronger, they started to pack raspberries and sell retail packs used for home baking.
25
Libertas

112
Regional Rural Development Standing Working Group in SEE
There is considerable potential for taking the 30% of raspberries now sold to foreign packers in bulk, packing them in retail packs in Serbia, and selling them for a 20% higher price. Foreign importers buy different categories of products, sort, and sell them to supermarkets/processors according to quality. The lowest quality of bulk raspberries is sold to foreign processors. Importers usually sign contracts with local processors some six months in advance and they pay for the raspberry and blackberry within two months at the latest (average 15-30 days). All importers provide advances to the processors prior the start of the buyout. Serbian exporters underline that they do not have good contacts with retail buyers, and that they lack options for selling beyond traditional “low cost” buyers. Serbian exporters lack representation and have no means to promote products internationally other than independent company efforts.
2.2 Current constraints and limitations The major constraints of the key actors in the sector are explained below. A schematic overview of the supply chain, including stakeholders, and parties who directly support or have an effect on the performance of the supply chains is depicted below.
2.2.1 Producers Although in general considered as small, the production of the farmers is adapted to their home labor and land availability. Larger producers are dependent on cheap labor for harvesting. Most of the farmers are professional berry producers and are severely exposed to the low prices and delayed payments. They are somewhat indebted to the banks and the inputs suppliers. Credits from inputs suppliers and processors are more used for the expansion and renewal of plantations rather than for upkeep. It is currently difficult for farmers to invest in the renewal of berry plantations and there is little activity in any renewal by individual producers. Development is preconditioned with modernization rather than with an increase in size. Old bushes have to be renewed and the varieties have to be diversified in order to extend the harvest season and move towards fresh and frozen retail packing. A lack of appropriate nurseries for the sourcing of planting material is a significant constraint on development. The lack of an introduction of modern technologies of production and quality assurance standards at farmer level can influence yields as well as the compliance to the market demand. The berry sector has no strong representative bodies capable of defending the growers’ interests, establishing production criteria suitable for quality production and defining a marketing strategy for the increasing growers’ revenues. Logistics for distribution and sales of fresh berries are not adequately developed and influence the total local consumption and fresh export. 2.2.3 Processors Much of the sector works with outdated equipment and faces hard times in moving to value added production and quality assurance standards. Diversification of the production is also limited with the vast majority of produce being sold in bulk. One of the main constraints on increasing exports is the lack of market knowledge and promotion activities. Most of the processors are too small to become visible in the market and to develop a brand image. The limited exposure for the Serbian berry sector is a major concern, although this is slowly changing. Improvement of the packing designs of the products is also needed for stronger penetration on import markets. The limited co-operation of the processing industry also prohibits improved performance and market penetration. To satisfy the demands of the American and Japanese markets, Serbian raspberries are imported through the EU as a means of guaranteeing health and quality standards.

113
Regional Rural Development Standing Working Group in SEE
2.3 Solutions for the identified constraints and limitations A mix of interventions at company and sector level are feasible and are presented in the table below which lists the compounded constraints and limitations and ways to address them, as identified by the supporters of the supply chain.
3. SWOT ANALYSIS
The following sub-chapters illustrate a SWOT analysis based on the above factual assessment of
the sector, taking into account
EU accession and the ultimate goal of preparing the sector for participation in the EU market,
building up capacity to resist the resulting pressure of competition.
Constraints Why does this prohibit development
How can this problem be solved
Lack of new varieties for extended season/ fresh consumption
Short harvest season and marketing season Limited export as fresh produce
Information on benefits of moving into fresh production Develop growing new berry varieties Develop nurseries to deal with new varieties Educate berry producers
Lack of modern technology
Limited yields Reduced seasons
Study tours to berry producers Develop greenhouse projects
Lack of modern production knowledge
Limited productivity Limited diversification of products
Extension with experts on berry varieties, modern technologies, dried products, freeze-drying, concentrates, and new value-added products Organize study tours to foreign value-added producers
Logistical hurdles Lack of access Identify and assist in development of logistical companies to deliver fresh produce to market
Inadequate packaging
Unattractive products Unable to pack in accordance to demand
Educate packers on market requirements, labeling innovations, and design approaches Education and training for design community and companies
Lack of standards, including organic products
Limited access to markets Reduced prices
Support producers/processors on getting certified in GlobalGAP , HACCP, BRC, AIB, Halal, Kosher , organic and Schutzgemeinschaft der Fruchtsaft-Industrie Work with organic associations on educating local producers on organic markets
Lack of marketing knowledge and activities
Lack of access to retail markets Sales through wholesalers Low awareness about Serbian products
Distribute marketing information on markets Organize visit to fairs and expos Organize sales training for producers and associations Get producers in touch with foreign buyers Get producers in touch with local supermarkets Organize sales mission to Serbia for buyers Marketing campaign to increase local and regional consumption of raspberries and blackberries. Provide financial opportunity guidelines Provide marketing information on new, innovative and organic products that companies can produce
Lack of management / negotiation skills
Organize management training for companies and associations
Lack of associations and integrated approach
Development of export associations and integrated producer organizations Work with association on revising statute, and services to be provided to members;

114
Regional Rural Development Standing Working Group in SEE
3.1 Primary production
3.1.1 Strengths
Largest size of arable land (5.1 million ha) in the region
Fertile agricultural soil, favorable climatic condition, and strong agricultural sector
Long tradition
15,000 ha are currently planted
Cost of seasonal labor is low
The government is financially supporting maintenance of new plantations and renewal of
the existing berry productions
Berries are in high demand globally
Availability of production inputs and crediting
Large areas of agricultural land are not polluted and not intensively cultivated, making conversion to organic production faster and easier
3.1.2 Weaknesses
Fragmented primary production, leading to higher production costs and low technology improvement including mechanization of harvest
Most plantations are old with medium productivity and need renewal
New area planted is low
Old mechanization preventing improvement in management
Annual disagreements with buyers due to price fluctuations
Farming practices not up to international standards
Use of mainly industrial varieties
Many small unorganized producers are difficult to deal with
International (EU) markets insufficiently exploited for fresh and organic
Education in both general and organic agriculture insufficient
Attention/interest at institutional level limited for improvement 3.1.3 Opportunities
Possibility to lease state-owned agricultural land
The demand is stable and adapted to the climatic conditions and existing varieties
New plantations using modern practices resulting in improved quality and yields
Investments in mechanization, varieties and appropriate extension can increase the production quantity and quality
Organization of the primary producers can improve the supply of raw materials
Increasing demand for fresh produce, increasing competition and prices
A reliable nursery sector will impact planting of new plantations 3.1.4 Threats
The anticipated growth of wages will put pressure on growers to improve yields and productivity and decrease production costs
Depopulation and aging in rural areas (leading to regional labor shortages)
Farms cannot develop to the level of international competiveness
Further land fragmentation
Natural calamities (droughts, diseases affecting the production)
3.2 Processing industry
3.2.1 Strengths
Labor costs are relatively low
Well-known large processing industry
Vast majority of the production is exported
Continuous supply of quality raw materials

115
Regional Rural Development Standing Working Group in SEE
Subsidized investments in improvements of the production
Limited development needed for improved access to international markets
Access to CEFTA and EU markets as well as CIS countries
EU candidacy fostering compliance with EU regulations and increasing competiveness
3.2.2 Weaknesses
The current fragmentation of the branch of fruit limits economies of scale and profitability with regard to transportation and infrastructure
Insufficient organization of the branch leading to lack of co-operation for export
Several companies control more than 70% of the raspberry processing26
Export is predominantly in bulk
Dependency on foreign agents for marketing of local products
Small number of large processors and many small processing companies
Quality management in the production is weak and to be improved
Marketing is under developed 3.2.3 Opportunities
Large domestic market could absorb a larger quantity of fresh and retail packed berries
Good investment incentives for foreign investors and favorable taxation policy
Co-operation between all marketing participants in a unified system could greatly increase the profitability of fruit production
Training in sales management can improve the output of the companies
Marketing related support can allow access to more lucrative markets
The capacity of the branch provides capacity for further growth
Co-operation with primary producers can improve the raw material supply 3.2.4 Threats
To push the sector into selling retail packs without arrangements to absorb it
Dominance of larger players in trade leading to lack of competition
Import tariffs reduced, which may lead to increased imports
Political situation may change introducing less investor and export support
Oligopoly structures in the retail sector impact the domestic and regional sales Middle management not available and not skilled to operate modern processing plants
leading to a stall in the development
Insufficient quality control of inputs when factories will be up scaled and enlarged
impacting the quality of products
Sector cannot build up international relations and penetrate suitable markets
4. COMPARATIVE ADVANTAGES
4.1 Primary production
The cost of prime land for raspberry production in Serbia is around € 5,000/ha, and much cheaper compared to Croatia, Bulgaria and Greece
Limited or no competitors in the region
The average farmer is experienced and willing to invest
Both the government and the crediting system are available and are supporting the sector
The low average wages on national level contribute to the low cost of the produce from a very labor intensive crop
Although labor prices are increasing there is still no sign of a lack of laborers for harvest
Large local and regional market with potential for absorbing fresh produce as local consumers do not differentiate between different varieties
26
Agrinela, Agroekonomik, Atle, Donimpex, Hibrid, Libertas, ML, Malina Produkt, Sirogojno, Mondi Serbia, Vulic &
Vulic, Yucom, Van Drunen.

116
Regional Rural Development Standing Working Group in SEE
4.2 Processing facilities
The raw materials base remains the predominant advantage for the sector
Processing facilities are underused and their capacity outweighs their production output
Increased access to the vast markets of EU, CEFTA, CIS and so on
The large number of processors allows outsourcing of different products from more suppliers
Market share and strong position in both domestic and regional markets, accompanied by high potential for exporting to other foreign markets
Good geographical positioning and access to European Corridors 10 and 7
5. INVESTMENT POTENTIALS
In 2010, the Serbian parliament passed a set of new laws and amendments related to agriculture. The main objective was to amend the overall environment for investments into the sector. These laws responded to various studies revealing that investments in the sector of food and agriculture have one of the highest multiplication effects. Potential domestic investors from the sector comprise of farmers, farming co-operatives, operators of refrigeration facilities, processing companies and traders.
5.1 Primary production Direct investment potential in primary agricultural production is limited due to the fragmentation and private ownership of land. Although possible it is feasible mainly on plots of Government owned land. Procuring land from individual farmers might be a difficulty, especially from multiple owners. In addition, none of the respondents were aware of any raspberry plantations to be up for sale. Farming co-operatives of small farmers with large-scale primary operations can be considered as potential joint-venture partners for foreign investments into modernization and processing. Small farmers need investments required for the modernization of the production, including mechanized harvest (where applicable), anti-hail nets, irrigation, as well as changes in the variety composition. It is the primary sector that is more often in need of resources and any investments would have to be channeled in the form of credited inputs or services. In Serbia there are no large producers of berries that have not invested in a freezing facility. Potentials for investors in the organic agricultural sector are mostly in sourcing products, raw materials, and processed goods. 5.2 Processing facilities The investment potential in processing is huge, with vast potential markets and little regional competition. There are currently 180 major registered refrigeration companies in the business of preserving fruits. Their total installed capacity is in the range of 600,000 tons. Additionally, there are up to 30 smaller such firms with an aggregate capacity of 200 tons. The investment power of the branch is limited and in need of investments and know-how. Appropriate relationships with farmers can easily guarantee an ample supply of raw materials at competitive prices. Investment opportunities for foreign companies exist and are increasingly being taken advantage of. Most interviewed processors recognize the effects of foreign investments in modern processing units, such as the Van Duren freeze-drying facility which has contributed to diversification and exports. However, most are connecting foreign investments with buyer diversification or improved access to markets. Facilities that lack turnover capital for autonomous operation are often rented out to traders, and following the short season are often out of use. Such facilities show interest for joint ventures with foreign partners aimed towards the modernization of the facility and increase of the capacity and quality of the production. Costs of production in Serbia will presumably quickly align with those in neighboring countries but no major problems are expected for the fruit branch. The policies of the government are inclined towards both the refurbishment and modernization of the existing facilities, and the establishment of new ones.

117
Regional Rural Development Standing Working Group in SEE
6. MARKET OPPORTUNITIES
There is an increasing world supply of frozen raspberries and blackberries, for which the market is stabile but the price appears stagnant. Such producers need to diversify their huge raw material outlets and add value in order to sell with more profits. Market opportunities exist in selling diversified berry products abroad in retail packs to an unsaturated market.
6.1 Frozen retail Concentrating on the local, regional and EU markets seems to be a good market orientation along with diversification, rather than competing on the global frozen markets. Although the EU is the largest producer of berries in the world (87% of the total production), at the same time it is the largest consumer (Germany and France with 10kg raspberry/inhabitant). Serbia’s move away from the exporting of pre-cooled products and bulk products to the packing of raspberries in retail packs sold for 30% more on average is in full speed. Graph 2.4: Prospects for market diversification for processed raspberries and blackberries
Source: ITC calculations based on UN COMTRADE statistics
Given that the average costs of production for raspberries, including harvesting, range from € 0.57/kg to 0.69/kg, and assuming that packaging, transportation and marketing costs would not exceed € 1.15/kg, there is still room for achieving quite high margins and profitability. Producing retail packs for supermarkets directly is a system that requires large quantities but not in uniform packing as most traders would rather want different designs for their private labels. Other large global producers cannot adapt to shipping small quantities in containers. CIS countries may also prove good destinations for retail packed produce in a mid- to long-term view. However, Serbia needs to first increase the quantities and quality of retail packed products in order to establish a presence on these markets in parallel to the EU market. Graph 2.5: List of importers for processed raspberries and blackberries in 2011
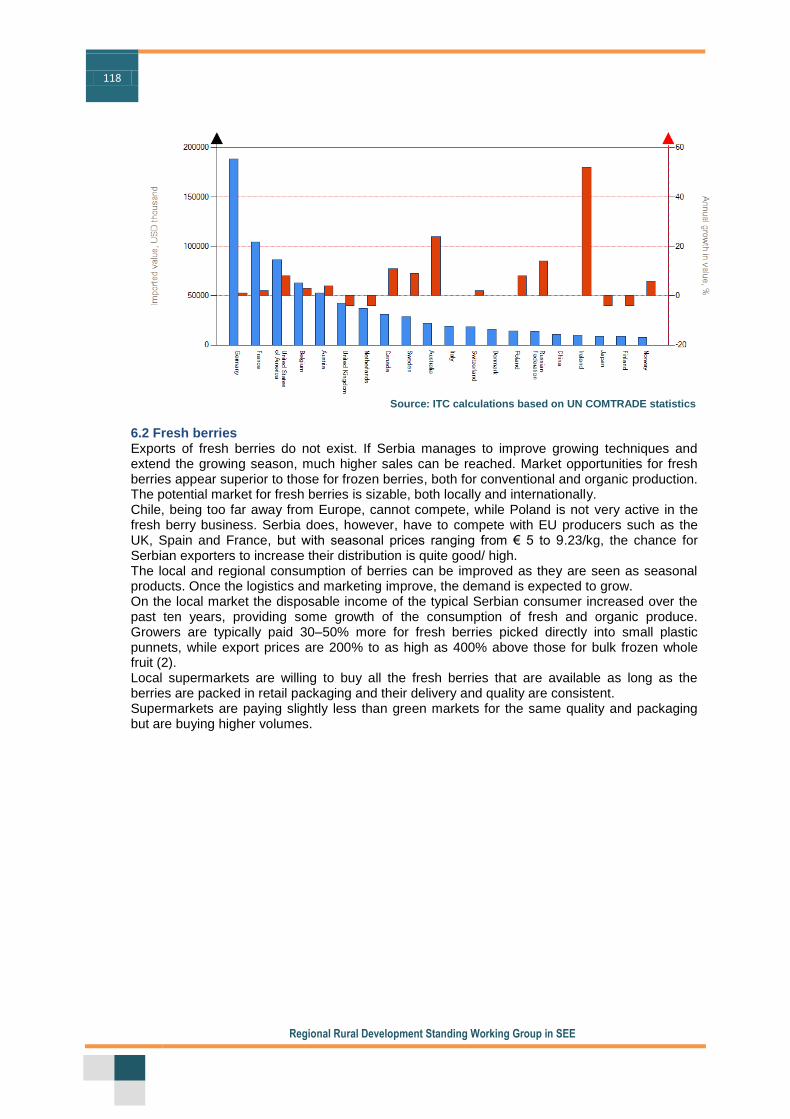
118
Regional Rural Development Standing Working Group in SEE
Source: ITC calculations based on UN COMTRADE statistics
6.2 Fresh berries Exports of fresh berries do not exist. If Serbia manages to improve growing techniques and extend the growing season, much higher sales can be reached. Market opportunities for fresh berries appear superior to those for frozen berries, both for conventional and organic production. The potential market for fresh berries is sizable, both locally and internationally. Chile, being too far away from Europe, cannot compete, while Poland is not very active in the fresh berry business. Serbia does, however, have to compete with EU producers such as the UK, Spain and France, but with seasonal prices ranging from € 5 to 9.23/kg, the chance for Serbian exporters to increase their distribution is quite good/ high. The local and regional consumption of berries can be improved as they are seen as seasonal products. Once the logistics and marketing improve, the demand is expected to grow. On the local market the disposable income of the typical Serbian consumer increased over the past ten years, providing some growth of the consumption of fresh and organic produce. Growers are typically paid 30–50% more for fresh berries picked directly into small plastic punnets, while export prices are 200% to as high as 400% above those for bulk frozen whole fruit (2). Local supermarkets are willing to buy all the fresh berries that are available as long as the berries are packed in retail packaging and their delivery and quality are consistent. Supermarkets are paying slightly less than green markets for the same quality and packaging but are buying higher volumes.

119
Regional Rural Development Standing Working Group in SEE
Graph 2.6: List of importers for fresh raspberries and blackberries in 2011
Source: ITC calculations based on UN COMTRADE statistics
6.3 Organic markets Organic markets, with a margin of 20–40% higher than that of conventional products, are growing rapidly. Serbian producers shift part of their production into organic production as it opens additional opportunities for organic berries to be sold as fresh, as frozen retail market and as value-added products (juices, purees, extracts). Fruit, vegetables and cereals are the only organic products not imported, giving room for growth. However, there are only a few outlets in Belgrade and Novi Sad. Because of all this, and the moderate prospects for domestic growth in the future, their placement on the international market assumes an even higher priority (22). Graph 2.7: Prospects for market diversification for fresh raspberries and blackberries
Source: ITC calculations based on UN COMTRADE statistics
6.4 Value-added products Dried berries, freeze-dried berries, smoothies, purees, concentrates, juices, preserves and culinary ingredients (seed extracts, powders, etc.) offered in European supermarkets, are also a good potential due to the ample supply of cheap raw material available. Companies are not producing value-added products, as technical knowledge is missing even in forward-looking companies. Organic value-added products such as concentrates and purees, for example, are also a good prospect and already produced by a few local companies.

120
Regional Rural Development Standing Working Group in SEE
6.5 Main competitors
Graph 2.8: List of exporters for fresh raspberries and blackberries in 2011
Source: ITC calculations based on UN COMTRADE statistics
Chile, China and the United States are big competitors for raspberry production on the global market. Poland, and to some extent Bulgaria, are competitors in the region. The main producers of blackberries on the international markets are Poland, China, Bulgaria and Italy. Graph 2.9: List of exporters for processed raspberries and blackberries in 2011
Source: ITC calculations based on UN COMTRADE statistics
7. SUB-SECTOR GROWTH POTENTIAL
7.1 Size and productivity Since Serbia already has a leading share of the world market in frozen bulk and pre-cooled berry products, the branch offers modest growth opportunities. However, despite the huge raw materials base the demand and processing capacity outweighs the stagnant primary production. Reasonable improvements in technology, in conjunction with the ongoing government support for primary agricultural production, could account for some growth in the primary production. Actually it is more likely that the raw material supply will increase only if the value added products increase in the total share of exports, generating added value for reinvestments thus pulling the sector forward.

121
Regional Rural Development Standing Working Group in SEE
Farmers are also need to react to emerging difficulties such as climate change and high temperatures, as they are starting to affect the production in terms of quality and quantity. Farmers will primarily need to invest in irrigation, and secondly in hail protection, harvesting and the improved technology of production if they are to maintain their existing production in the long run. Such investments are likely to be credited by the branch, especially by those unable/willing to invest in their own primary production. Growth opportunities exist only in the high value-added segments which have high potential and yield attractive profits. There is mainly room for the growth of fresh berries, value-added goods such as juices, concentrates and dried products, frozen retail products and organic berry products. Most processors evaluate that their production growth potential is limited only by the markets, and deem that total sectorial growth can increase in the short-term by some 10%. Established importers are viewed as monopolies somewhat restrictive for the growth of the branch. 7.2 Labor and skill available locally, and improvement possibilities Serbia presently offers a sufficient supply of relatively cheap labor. Seasonal wages are between € 12 and 17, depending on the region and type of operation involved for processors. Field seasonal workers are paid some € 10-12 per day (for harvest, loading etc.), excluding lodging and food costs. The seasonal fees are somewhat higher compared to other crops as the season is very short. The processing sector does not experience shortages of labor and does not foresee any difficulties in the long run. They are also generally satisfied with the quality of the workforce. An average seasonal worker harvests 30 kg of raspberry/blackberry per day, at € 0.3/kg. It seems that due to the ongoing rural aging and migration, labor shortages may have an impact on the raw material production and limit its growth in the next decade, but it is unlikely to cause any reduction in production. Many farmers and almost all legal entities are highly dependent on seasonal labor for the harvest. The prices of seasonal laborers have been increasing in the last few years, however, no notable lack of workers is evident. Larger producers can compensate by introducing mechanical harvesting, while smaller producers benefit from the workforce migrating from Republic of Srpska (Bosnia and Herzegovina) which provides a sizable supply of seasonal workers for the time being. The current sector has grown to fit the demand and the production. Growth possibilities in the entire sector are evaluated at up to 20% in midterm. Most of the participants in the study underline that the fastest growth can be expected in newly established and vertically integrated operations, utilizing all the benefits of modernizations and technical knowledge.
8. PRODUCTION AND PROCESSING RELATED INPUTS
8.1 Primary production Most of the inputs used by the primary producers (seedlings, fertilizer, fuel, plant protection, drip systems etc.) are imported, including part of the used agricultural machinery. A few inputs and some mechanization and agricultural implements are also produced by local commercial suppliers
27.
The producers face little problems in accessing any production inputs. The customs duty on the import of most of the agricultural inputs is low (11% or 5%). VAT on basic agricultural inputs (seeds, chemical agents, forage mixtures) is 8%. Farmers use the VAT compensation scheme very little, primarily because they are not sufficiently informed and few generate more income on accounts above the prescribed threshold in order to be registered. 8.2 Processing industry
27
http://www.portal-srbija.com/hemijska-industrija/vestacka-djubriva-proizvodnja http://www.portal-srbija.com/pesticidi-proizvodnja

122
Regional Rural Development Standing Working Group in SEE
All materials for the packing of frozen/bulk products are produced locally. All materials used for the packing of retail packs supplied to the fresh and frozen retail markets are produced locally
28.
Plastic crates used for the harvest of berries are both available locally and in the region. For the most part, processing equipment and chilling/refrigerating equipment is supplied by European manufacturers.
9. ESTIMATED INVESTMENT COSTS PER SIZE OR OUTPUT UNIT AND ESTIMATED CURRENT RETURN ON INVESTMENT FOR EXISTING OPERATIONS
The estimated profitability and investment costs for primary production are based on data from average small agricultural producers which represent the majority of the raw material suppliers. The estimated profitability and investment costs for the processing industry is based on data from small startup processors which have gradually increased their capacity.
9.1 Profitability and investment costs per output unit
9.1.1 Raw material production The procurement of land suitable for raspberry production is estimated to be up to € 5,000/ha. On average, planting 1 ha costs between € 5,000- 15,000, depending on the location, variety of raspberries planted, service roads, irrigation possibilities and investments in drip irrigation and anti-hail nets. The main operational cost of upkeep is the harvest which participates with up to 30% in the farm gate price. In addition, the upkeep costs account for 20-25%. On average, the farmers profit with some 50% of the farm gate price. If the average price of some € 1.1 (in 2012) is taken as a start and in conjunction with the average yields of some 5.5 tons/ha, the break even return on the investment (land and plantation) is estimated at four to five years from the investment. 9.1.2 Processing industry Serbian raspberries are more competitive than those of their competitors. Current Free on Boat (FOB) export market prices (65° brix raspberry concentrate
29) are some 16% cheaper
compared to Chile and Poland. This is a substantial profit opportunity if Serbian processors bring the raspberry concentrate processing business home. These observations also apply to blackberry processing. While their market prices are different, the margins that Serbian processors could enjoy are substantial. The equipment used locally is mostly of EU origin (Frigo Scandia). The investment in the most common capacity IQF tunnels (2,800 kg/hour) are varying from € 150,000 for used equipment to € 300,000 for new equipment. The investment into cooling/freezing facilities able to maintain a high temperature radius (+4 to -20 C
o) as well as for the rapid cooling of produce, is evaluated at € 350-550/m2,
depending on the make and type of the panels and the cooling equipment. Most processors have experienced a break even return on their investments in medium-term since the start of the operations.
28
http://www.portal-srbija.com/ambalaza-i-pakovanje/papirna-i-kartonska-ambalaza http://www.portal-srbija.com/ambalaza-za-hranu http://www.portal-srbija.com/euro-palete-drvene-palete http://www.portal-srbija.com/plastika-i-guma/ambalaza-od-plastike 29
Degrees Brix (symbol °Bx) is the sugar content of an aqueous solution. One degree Brix is 1 gram of sucrose in 100 grams of solution and represents the strength of the solution as percentage by weight (% w/w) (strictly speaking, by mass).

123
Regional Rural Development Standing Working Group in SEE
II. SUB-SECTOR: PLUMS, PROCESSED PLUMS AND PRUNES 1 DETAILED ASSESSMENT OF THE SUB-SECTOR
1.1 Primary production Fruit growing has always been an important part of Serbian agriculture and economy, providing jobs in rural areas, supplying high-quality and locally grown produce to consumers, and contributing significantly to rural economies and local communities. The total surface area of arable agricultural land in Serbia exceeds 4.2 million ha, of which 210,000 ha (5%) are covered with fruit trees. Fruit trees are predominantly (95%) cultivated by private smallholders and traditional family-owned small farms. More than 75% of farmer households have fewer than five ha and less than 5% have more than 10 ha. Some 15% of the total value of the primary agricultural production is from the tree fruit sub-sector. Apples are ranked fifth and plums tenth in terms of output value. In terms of land surface, plums dominate, accounting for 52% of the area of all orchards in Serbia. Apples cover 17.6%, and sour cherries 10.6%(22) . Due to the impact of climate change on the weather, in turn affecting agricultural production quantities produced vary from year to year, affecting the bulk purchase price of the products. Graph 3.1: Plum production in Serbia (in tons)
Source: Statistical Office of Serbia
Plums are considered one of the most important traditional fruits in Serbia. The chief areas of production are the Kolubara, Macvan, and Sumadija regions. The harvest begins in July and continues through to September, overlapping with the production with major competitors in Europe. Serbia grows 0.4-0.6 million tons of plums, making it the world’s third largest producer with 5.9% of the global production. With a total of 45 million trees (3 million are low/no yielding) on some 100,000 ha, Serbia is ranked fourth in the world. Over the last five years, the growing area for plums in Serbia has been decreasing by 1.1-4% per year. Output has fluctuated, and the average yield is approximately four tons per ha (10–13 kg per tree), which is much lower than the world average of 14 tons per ha (50 kg per tree) and ranks Serbia as 63rd in the world. The highest yields for plums are recorded in Vojvodina (13.6 kg/tree) (22). Plums are grown extensively with increased production costs and lower yields. The biggest problems in raising the competitiveness are the individual, fragmented small-scale farmers who cannot deliver large quantities with consistent quality. The plum varieties grown in Serbia are to some extent demanded for fresh exports and are suitable for low to medium-quality dried products. There are nine basic varieties: Pozegaca, the leading variety; Stenley; several varieties developed by the Chachak Fruit Institute, including Chachak Rich, Chachak Beauty, Chachak Best, and Early Chachak; and heirloom plums, including Madzarka, Dzenerika, Ringlov, and Trnovaca. Chachak Beauty and Early Chachak are early varieties, fruiting in July when the price

124
Regional Rural Development Standing Working Group in SEE
of fresh fruits is the highest. The harvest lasts from the beginning of July to the end of September. Serbia’s main plum variety, Pozegaca, is not resistant to the plum pox virus (sarka), a destructive virus disease of fruit trees that is spreading throughout Serbia and cannot be treated (22). Graph 3.2: Average yields per plum tree in Serbia (kg)
Source: Statistical Office of Serbia
1.3 Processing industry With the country’s strong tradition of fruit growing, Serbia’s fruit processing industry is well developed with huge potential for the export market. The principal processed export products, by quantity, are juices, concentrates, purees, jams, and frozen/dried fruits. Out of the total production, 65% of plums are used for the production of brandy, 30% in local preserves (jams) and juice concentrates. 6% is dried. Due to varieties, production technologies and finances, over 80% of the plums are made into šljivovica (slivovitz), a traditional Serbian plum brandy, mostly home-made in some 250,000 small distilleries. Šljivovica production exceeds 400,000 liters (22). Prunes are another important processing fruit. There are some 5,000
30 mini-drying facilities and
a few modern industrial facilities. Drying facilities are mostly outdated, locally made, working on coal, oil or wood and few use electricity or natural gas. Drying facilities use a mixture of air and combustion gases, rendering the quality of the product less acceptable in a sense of food safety and present an ecological problem. Most drying facilitates are in need of modernization to improve food safety, quality and reduce the negative impact on the environment. Most drying facilities usually sell unpitted prunes, since they do not have plum pitters, and thus their products have difficulties entering demanding markets. Pitting is slowly becoming a condition for both local and export markets. Plum varieties with big fruits, which are easy to pit, are suitable for drying. The varieties most dried are Pozegaca (90% of total volume), Stanley and Chachak Rich (22). Frozen plums have a significant share in the (further) plum (processing) production. However, they offer low incomes and little profit, given the high costs of freezing, storing, and transporting, compared to the low prices they receive on the international markets. 1.3 Trade When considering fresh fruits, the current Serbian foreign trade regime focuses on protecting the domestic market from import competition during the harvest season and marketing products so as to obtain higher sale prices. Such measures favor local producers. The domestic market is still the major consumer, consuming from 60 to 80% of the production. Although fresh imports and exports are rising, the sector is dominated by domestic consumption and processing. Estimated per capita consumption of plums is approximately 5 kg in rural residents and 2
30
http://www.portal-srbija.com/suseno-voce-proizvodnja-prodaja

125
Regional Rural Development Standing Working Group in SEE
kg/year in urban residents, far below citrus and tropical fruit intake, but above all other fruits. In 2004, Serbia began exporting its first quantities of fresh market plums to Russia. It became the main export destination for fresh plums with significant growth in the last few years (from 105 tons in 2005 to 1,919 tons in 2010). Other countries, such as Bosnia and Herzegovina, the Czech Republic, Germany and Switzerland, have lost their top status in terms of imported quantity of plums but are still considered as important and stable markets. Table 3.1: List of importing markets for fresh plums exported by Serbia
Importers Exported value in USD thousand
2007 2008 2009 2010 2011
World 11588 9653 10476 14629 18663
Russian Federation 7813 5944 7693 12803 17078
Bosnia and Herzegovina 916 649 785 542 411
Czech Republic 515 481 249 299 314
Ukraine 0 1 3 0 103
Switzerland 33 152 362 212 97
Hungary 364 231 0 0 91
Slovenia 126 185 129 46 56
Italy 252 169 65 34 51
Belarus 9 106 7 11 43
Austria 0 0 11 209 40
Germany 92 721 25 149 26 Source: ITC calculations based on UN COMTRADE statistics
The exports of Serbian plums show seasonality in markets, while export prices indicate that Serbian plums are sold more to the industrial market (apart from Russia) rather than the fresh market. For more details, see Annex 1.2 - Export trade indicators for plums. Fresh plums are available in retail shops throughout the year, including both locally produced and imported. Local production is sold on gross markets and retail markets between the 25
th
and the 40th week in the year. In the country they are available at some € 0.2-0.4, while in the
capital they are about € 1/kg on average (1). Prunes are the leading dried fruit exported from Serbia, constituting 99% of dried-fruit exports. Prunes are the most competitive plum product which has gained significant relevance in recent years, reaching up to 4,100 tons. The largest buyer of prunes is Russia, reaching some 1,686 tons which has been contested in recent years by Turkey, followed by Bulgaria, Romania, Italy, Croatia, the Netherlands and Slovenia. The export prices range from € 495 (Romania) to € 3,051 per ton (Turkey), while the average highest price is paid by Russian importers at some € 1,332 /ton. For more details, see Annex 1.3 - Export trade indicators for prunes. Table 3.2: List of importing markets for prunes exported by Serbia
Importers Exported value in USD thousand
2007 2008 2009 2010 2011
World 5781 8568 8901 8772 7657
Turkey 0 0 29 285 1190
Russian Federation 939 3554 4175 4284 1156
Croatia 652 974 1092 976 967
Bulgaria 191 233 1 261 830
Italy 986 766 570 481 693
Netherlands 156 267 172 266 592
Slovenia 342 627 796 634 471
Romania 32 242 148 137 290
Bosnia and Herzegovina 146 123 143 285 281
Macedonia 121 131 215 187 250
France 148 258 796 371 249
Austria 1042 74 94 272 200 Source: ITC calculations based on UN COMTRADE statistics

126
Regional Rural Development Standing Working Group in SEE
On average, higher prices are being achieved in trade with Austria, Croatia, Slovenia, Germany and France. Serbian statistics do not track exports of value-added plum products, such as purees, preserves, juices and concentrates, as separate categories.
2. SUPPLY CHAIN DESCRIPTION A schematic of the supply chain and parties who directly support or have an effect on the performance of the chains is depicted below.
Source:SWG
Supply chain role players
Banks and lenders
Ministries and Payment Agency
Retail input shops
Horizontal associations and organizations
Insurance agents
Certification bodies
Government inspections
Export and business promoters

127
Regional Rural Development Standing Working Group in SEE
Source: SWG
2.1 Supply chain actors
2.1.1 Regulators of the supply chain The new Law on Registration of Crop Varieties regulates the registration of newly created varieties and shortens the registration time for varieties of crops from 15 to 10 years. This law also defines conditions for the registration of crop varieties, procedure of crop registration and conditions of maintaining crop varieties. The Law on Organic Production defines all aspects on organic products. The law regulates the production, systems and methods of organic farming as well systems of controlling and certifying the whole supply chain. The Law on Food Safety ensures the high level of protection of the lives, health and interests of consumers while ensuring efficient food trade. The main concepts encompass traceability, the registration of businesses dealing with food, the national reference laboratories and internal controls on GMP, GHP or HACCP, depending on the type of food businesses. The main difficulties in the implementation of the law is the capacity of the inspection services to conduct the food safety controls of non-animal food products in production, processing, wholesale and exports, and the introduction of internal controls in businesses. 2.1.2 Agriculture input suppliers The input suppliers can generally be divided into wholesalers and retailers. Wholesalers are often producers/packers/importers of different agricultural inputs. They rely on agricultural
128
Regional Rural Development Standing Working Group in SEE
pharmacies for distribution of the inputs to the agricultural producers. Some wholesalers are involved in retail operations, and some retailers are involved in import operations. Most of the wholesalers are crediting the retailers, while they are credited by banks. On the other hand, the retailers are to a limited extent crediting farmers. Saplings for plums are mainly produced locally (some 75%), while 25% of the farmers produce their own saplings. The procured material is certified in approximately 40% of the cases. The most available variety is Stanley (1). There is almost no import of plum saplings. Nursery plants of new varieties usually have to be imported since there are no modern nurseries in Serbia. Despite significantly improved legal procedures, gray channels of trade with saplings (uncertified) which were developed during the 1990s, still exist (22). 2.1.3 Producers In Serbia, the size of the average farm is 2.5 ha, divided into an average of four plots per farm. Fewer than 6% of farms operate on more than 10 ha. There have been two significant changes in the last decade, namely a decrease in the total number of farms and an increased share of non-agricultural farms
31 in the total number.
Non-agricultural farms have become a dominant economic category with a share of 62% in the total number of farms, while the number of agricultural
32 (17.8%) and mixed farms
(16.4%) is almost the same (23). The rural migration trends are related to the remoteness, infrastructure and possibilities in the area, and range from mild to extreme. The number of farmers with retirement plans and health insurance is low. Reinvestments in the modernization or enlargement of the production are limited.
Investments in the development and next season’s production are at times credited. The
employment level in producers is below 30%, with young people leaving the farms (2).
Large individual producers can be both individual farmers and legal entities that heavily depend on the seasonal workforce for the harvest. Farmers lack knowledge about inputs and how to use them. There are good examples of fruit growers that have recognized a need to integrate. 4 % of the farmers are insuring their production as most see it as economically unfeasible. 77% of farmers own a tractor aged on average 26 years-old while 23% have access to irrigation, 45% have additional mechanization (1). The consistent supply of products from co-operative suppliers or independent farms is an ongoing challenge for processors, who complain that suppliers (farms) are difficult to deal with in purchasing quality products. Farmers consider priorities for investments the improvement of their mechanization (44%), investments in their own processing facilities (34%), production inputs (14%) and marketing (8%). They would like to know more about new production techniques, production organization and management (26% each), post-harvest (18%), financial management (16%) and marketing and export (14%) (1). Farmers on average have 17 years of experience in producing plums and on average sell 67% of their production, while they consume some 33% for making brandy and preserves. The farmers mainly sell their production to processors (42%), some 36% is sold to local traders/consolidators and some 22% is sold directly by the farmers on green and wholesale markets (1). The main criteria for making decisions on where to sell the produce are the security of payments and the agreed quality and price. Following this is the pre-harvest crediting with inputs, variety and so on. An alliance of fruit producers—the eight co-operatives that have integrated in the Fruitland Association--is a role model for the consolidation of farmers.
31
Whose members perform non-agricultural professions or agricultural profession but outside their own or family
holding or their income derives from a pension, other property, social welfare or other sources. 32
Agricultural holdings are those holdings whose entire income derives from individual farmers on the farm, who are involved in marketable production.

129
Regional Rural Development Standing Working Group in SEE
A national association of plum producers, which includes nine large companies, was recently established. The goal is to develop the production of plums and prunes, penetrate larger and more demanding markets and establish the introduction of a quality sign for prunes.
2.1.4 Buyout traders/ agents Most of the buyout traders/consolidators are legal entities spawned during the country’s transition and supplied the services that were lacking. They are usually placed in the most logistically beneficial locations and have weighing equipment. Buyer-traders usually buy fresh fruit from farmers at the assembly points and sell it directly without little or no sorting, and pre-packing to green markets, distributors, exporters or even foreign importers. In the last two years the number of exporters has rapidly increased. However, there are some exceptions as purchasing/distribution centers have opened recently which are equipped for buying, sorting, packing and storing fresh fruits. They are buying from farmers at the doorsteps of the centers and they are supplying local retailers, processors and foreign importers. The intermediary scene is also complimented with agents of Russian importers, some of whom are Russian citizens or from CIS countries (Azerbaijan or Moldova), buying fruit and paying at the farm gate in cash. In many locations these traders permanently reside in the production area where they are able to follow the production quality, quantity and prices and at times handle the buyout. The majority of farmers consider a diversification of the buyers in their area to be beneficial for their production. Many farmers feel that unrealistic conditions are imposed by local buyout agents, such as harvesting with tweezers in order not to leave any finger marks on the plums. Serbia’s fresh plum producers have three sales channels through which they can export to the international market: o Direct exporting - selling to an international importer with or without the assistance of an
agent o Indirect exporting - supplying a fruit consolidator or collection center that exports fruit
products to the international market o Indirect exporting - exporting by means of a private or co-operative export organization Farmers usually transport their products directly to local buyers (collection centers, distribution centers organized by exporters, distributors, and processors). For the exports of fresh tree fruits, land shipping via trucks and refrigerated trucks is the most frequently used mode of transportation. The cost of transportation with regulated temperatures for delivery to St. Petersburg (Russia) vary from € 0.26 to 0.27 per kg; the price for a truck loaded with 18,200 kg of fresh fruit is between € 3,076 and 3,230 (€ 0.16 - 0.17/kg) (22). Firms exporting fresh fruits rarely possess their own transportation. On the other hand, given the emerging demand for fresh tree fruits from the Russian market, a number of transport companies have become fresh fruit exporters buying directly from farmers and selling it for a profit abroad. 2.1.5 Processing industry Very few large scale processors exist that are mainly involved in drying, freezing and the preparation of concentrates. The vast majorities are small SMEs or family-owned drying facilities that process plums into prunes. However, regarding the increased demand for prunes, new drying establishments are appearing using relatively modern technology and even joint ventures (with Russian buyers). The processors spend approximately 50% of their turnover capital on raw materials, followed by labor costs with 17% and energy with 12% and finally packing materials with 8% (1). It is evident that larger wholesale packaging predominates (carton boxes at 10–15 kg). Retail packaged prunes (up to 500 g) gain better prices and could be marketed in larger quantities on international markets. The leading producer of prunes in Serbia (Agranela - Valjevo) exports its almost entire product in retail packaging, showing that there is a market for value-added prunes.

130
Regional Rural Development Standing Working Group in SEE
Some processors have already started to invest in primary production in order to establish a core of their raw materials in terms of quality and quantity. Most processors agree that market diversification would be beneficial to the sector. 2.1.6 Exporters and importers Foreign importers and distributors play a significant part in the supply chain. The majority of trade goes through them, though local producers are gradually starting to export directly to the final buyers. The final buyers are supermarkets, hotels, restaurants, and catering services as well as processors. Most Russian importers also act as a primary wholesaler or distributor. The entry of large foreign supermarket/hypermarket chains had a fundamental impact on food distribution in Russia. Retailers so far have been buying in bulk directly from local importers. Major distribution centers and terminals are in St. Petersburg, Moscow, Yekaterinburg, Krasnodar, Chelyabinsk, Kazan, Novosibirsk, and Nizhniy Novgorod (22). For imports from Serbia, Russian importers very often use specialized agents as intermediaries for establishing contacts between importers and exporters and very often growers as well, buying directly from the orchard. They maintain contact with foreign suppliers and procure produce for their customers who are generally wholesalers. Most agents work on the basis of a commission on the sales price (usually 5%). While most large exporters adopt a vertically integrated model to mitigate supply risks, small exporters often rely on uncertain supply from fragmented farmers.
2.2 Current constraints and limitations The major constraints on the key actors in the sector are explained below. A schematic picture of the supply chain, including stakeholders and parties who directly support or have an effect on the performance of the supply chains, is depicted below.
2.2.1 Producers
The largest constraint on the primary sector is related to a lack of capital for reinvestments into the modernization and commercialization of the production
In general the production of small farmers is adapted to their home labor and land availability. Larger producers are dependent on cheap labor for harvesting
Most plum farmers are not professional producers but tend to diversify their production. They are severely exposed to the variable market demand
Old orchards still dominate the tree fruit production. The yields are modest but can be improved by rejuvenating old orchards
Fragmentation and the small surface area covered by the average orchard is a big obstacle to raising competitiveness in terms of reducing production costs and increasing incomes
New cultivars of fruits that would enhance the product quality, increase the resistance to diseases and parasites and extend the season, are needed. The prevailing varieties are old and not too suitable for fresh consumption in demanding markets
The main plum variety, Pozegaca, is vulnerable to plum pox virus
The lack of appropriate nurseries for sourcing certified virus-free planting material is a significant constraint on development
The lack of an introduction of modern production technologies and quality assurance standards at farmer level influences yields and the compliance to the market demand. Producers need to adopt integrated pest management, return bloom, fruit size management, nutrient management, mulch for tree pruning, rotating tills and so on
Serbian producers using anti-hail nets and drip irrigation are rare
The current situation forces fruit growers to compete on price only and not on product quality
Producers are handicapped by poor farm cost management skills and a limited knowledge of financial sources. The continuing low profitability of fruit production discourages farmers from replanting the old orchards as they need between four and

131
Regional Rural Development Standing Working Group in SEE
five years to reach full maturity before they can start making a full profit and pay back the investment
2.3.2 Processors
Much of the industry for processing and especially drying is very fragmented, with outdated equipment and little quality assurance standards. They are struggling to meet the increasing demand and keep the quality of the production
One of the main constraints on increasing exports is the lack of market knowledge and promotional activities. Most of the processors are too small to become visible and to develop a brand image and therefore supply in bulk through intermediaries
The limited co-operation of the processing industry also prohibits improved performance and market penetration
There is a general failure to diversify into higher value-added final products and only a small percent of produced plums are processed into prunes
The lack of consolidated export promotion and sales are a result of poor co-ordination. Exporters compete with each other rather than addressing threats posed by formidable agricultural export competitors
Little market intelligence is conducted to understand end-customer demands, tastes and regional preferences for fruit products in various target markets
There are also poor vertical linkages among supply chain actors (producers, processors, supermarkets, exporters, providers)
2.4 Solutions for the identified constraints and limitations A mix of interventions at company, branch and sector level are feasible and are presented. The table below lists the compounded constraints and limitations and ways to address them as identified by the supporters of the supply chain.
Constraints Why does this prohibit development
How can this problem be solved

132
Regional Rural Development Standing Working Group in SEE
3. SWOT ANALYSIS
The following sub-chapters illustrate a SWOT analysis based on the above factual assessment of the sector, taking into account EU accession and the ultimate goal of preparing the sector for participation in the EU market, building up capacity to resist the resulting pressure of competition.
3.1 Primary production
3.1.1 Strengths
Largest size of arable land (5.1 million ha) in the region
Fertile soil, favorable climatic condition, strong agriculture and long tradition
Cost of seasonal labor is low
The government is financially supporting new plantations’ maintenance and the renewal
of the existing plum productions
Demand from Russian market is increasing with rapid growth of export value
Lack of varieties for fresh consumption /drying
Short harvest season and marketing season Limited export as fresh produce
Information on benefits of moving into fresh production Develop growing new plum varieties Educate producers
Lack of certified virus free planting material
Spreading of pox virus Reducing production Variable production
Develop nurseries to deal with new varieties and certified planting material Local producers of virus-free certified nursery plants Nursery plant importers
Lack of modern technology
Limited yields
Study tours to producers
Lack of modern production knowledge
Limited productivity Limited diversification of products
Extension with experts on varieties, modern technologies, dried products, concentrates, and value-added products Organize study tours to foreign producers of value-added products Organize soil and water analysis, leaf mass quality, product grading, pesticide residues Assistance with harvesting issues, proper harvesting techniques, correct timing for optimum storability and sustained quality
Lack of standards, including organic products
Limited access to markets Reduced prices
Support producers/processors on getting certified in Global GAP , HACCP, BRC, Halal, Kosher , organic and Schutzgemeinschaft der Fruchtsaft-Industrie Work with organic associations on educating local producers on organic markets
Lack of marketing knowledge and activities
Lack of access to markets Sales through wholesalers Low awareness about Serbian products
Distribute marketing information on local and international markets Organize visits to fairs and expos Organize sales training for producers’ organizations Get producers in touch with foreign buyers Get producers in touch with local supermarkets Organize sales mission to Serbia for buyers Provide financial opportunity guidelines
Lack of management / negotiation skills
Organize management training for companies and associations
Lack of associations and integrated approach
Development of export associations and integrated producer organizations Work with association on revising statute, and services to be provided to members

133
Regional Rural Development Standing Working Group in SEE
Availability of production inputs and crediting
3.1.2 Weaknesses
Fragmented primary production with high costs and low technology improvement
Most plantations are old with medium productivity and need renewal
Area planted is decreasing
Farming practices are traditional and not up to international standards
Use of varieties with limited uses
Many small unorganized producers are difficult to deal with
Education in both general and organic agriculture insufficient
Domestic markets (fresh or processed into brandy) still account for much of the consumption
Commodities are not calibrated, sorted, or stored there -they are only sold directly to local traders
3.1.3 Opportunities
Possibility to lease state-owned agricultural land
The demand is increasing at markets with lower expectations
New plantations using modern practices resulting in improved quality and yields
Investments in mechanization, varieties and appropriate extension can increase the production quantity and quality
Organization of the primary producers in a functional farmers’ organization can improve the supply of raw materials for processors
Increasing demand for fresh produce, increasing competition and prices
A reliable nursery sector will impact the planting of new plantations
Growing methods/irrigation systems, anti-hail nets have increased both the quantity and the quality of fruit produced but their use needs to become more widespread
Vertical and horizontal Integration of producers and incorporation of more supply chain functions like post-harvest handling, storage and packaging
3.1.4 Threats
The anticipated growth of wages will put pressure on growers to improve yields and productivity and decrease production costs
Depopulation and aging in rural areas (leading to regional labor shortages)
Farms cannot develop to the level of international competiveness
Further land fragmentation
Natural calamities (pox virus, climate changes, affecting the production)
3.2 Processing industry
3.2.1 Strengths
Labor costs are relatively low
Vast majority of the production is exported
Ample supply of raw materials but production quantities vary
Subsidized investments in improvements of the production
Limited development needed for improved access to international markets
Access to CEFTA and EU markets as well as CIS countries
EU candidacy fostering compliance with EU regulations and increasing competiveness
Emergence of vertically integrated producer organizations (POs), from growing and storage
to marketing
3.2.2 Weaknesses
The current fragmentation of the branch of fruit limits economies of scale and profitability
Insufficient organization of the sector leading to lack of co-operation for export
Export is predominantly in bulk
Dependency on foreign agents for marketing of products

134
Regional Rural Development Standing Working Group in SEE
Quality management in the production is weak and to be improved
Marketing is under developed 3.2.3 Opportunities
Good investment incentives for foreign investors and favorable taxation policy
Co-operation between all marketing participants in a unified system could greatly increase the profitability of fruit production
Training in sales management can improve the output of the companies
Co-operation with primary producers can improve the raw material supply
The stronger-than-ever demand for fresh tree fruit worldwide
Storage technologies/extending fruit shelf life
3.2.4 Threats
Political situation may change, introducing less investor and export support
Middle management not available and not skilled to operate modern processing plants
leading to a stall in the development
Insufficient quality control of inputs when factories will be up scaled and enlarged,
impacting the quality of products
Actors do not respect accepted EU business systems and are excluded from major international trading
4. COMPARATIVE ADVANTAGES
4.1 Primary production
The cost of land in Serbia ranges between € 2,000 – 5,000/ha, depending on the location, and irrigation possibilities. The cost of plum plantations in full condition is around € 10,000 which is cheaper compared to Croatia, Bulgaria and Greece
Limited or no competitors in the region
The average farmer is experienced and willing to invest in agriculture
Limited investments can significantly boost the yields of the production
Both the government and the crediting system are available and are supporting the sector
The low average wages at national level contribute to the low cost of the produce, while further mechanization can reduce the harvest and maintenance costs
Sufficient laborers for harvest, and the harvest can be mechanized, if needed 4.2 Processing facilities
The raw materials base remains the predominant advantage for the sector
Access to the vast markets of EU, CEFTA, CIS and so on
The production process allows for the automation and increase of capacity at limited costs
The large number of small processors allows for outsourcing from many suppliers, improving the quality of the supply at low cost
Outlet for processing can always substitute eventual low demand for fresh produce
Good geographical positioning and access to European Corridors 10 and 7
5. INVESTMENT POTENTIALS On May 5
th 2010, the Serbian parliament passed a set of new laws and amendments related to
agriculture. The main objective of this move was to amend the overall environment for investments into the sector. These laws actually responded to various studies revealing that investments in the sector of food and agriculture have one of the highest multiplication effects. Potential domestic investors from the sector comprise of farmers, farming co-operatives, operators of refrigeration and drying facilities, traders, including exporters and importers as well as other role players connected with the sector (transporters).
5.1 Primary production

135
Regional Rural Development Standing Working Group in SEE
The investment potential in primary agricultural production is limited due to the fragmentation and private ownership of land. Although possible, it is feasible mainly on plots of government-owned land. The procurement of land from individual producers is possible at competitive prices, however, procuring and consolidating parcels might be a challenge. On the other hand, procuring productive orchards offers limited possibilities for investments as they are sporadically available and often overage. Investments in new varieties suitable for export production and processing could be very effective in the medium term, taking into account the growing market demand. On the other hand, modernizing the production can significantly increase its productivity and profitability. Farmers are interested in mechanization as well as the improved inputs that could increase their yields or reduce their costs (harvesting equipment, drip irrigation, hail protection, plant protection and so on) and they recognize the fact that they should learn from more developed countries. However, all ventures with individual producers will likely have to be in some form of credited input provision or mechanization-related service provision, as they are at the level where funds are least available. Farming co-operatives are large-scale operations with some capital reserves and the possibility for larger investments. Such co-operatives can be considered as joint-venture partners for foreign investments in fruits. Investing in the organizations of primary supply of agricultural produce is more feasible, especially taking into consideration the profit margins of the traders as well as the vast number of small farmers that welcome any initiative for planned and structured production and marketing. 5.2 Processing facilities The policies of the government are inclined towards both the refurbishment and modernization of the existing facilities and the establishment of new ones. Few processors have experienced some difficulties in obtaining the relevant permits and connection to utilities during the inception process, unless such preconditions exist at the location at the moment of construction.
5.2.1 Drying facilities The investment potential in processing at the moment is significant, taking into account the increasing demand and export. Establishing appropriate relationships with farmers and control can easily guarantee an ample supply of raw materials at competitive prices, even by exploiting the current varieties with all of their disadvantages. Plums are only one of several fruits and vegetables which also can be handled in a drying facility. Most of the prune producers are positive towards the establishment of more processing facilities as this would increase the offer of prunes and access to markets. A few of the processors are interested in joint ventures with foreign investors as a way of modernization and increasing the capacity of their operations. 5.2.2 Cooling facilities The investment potential is significant if plums act as a complementary crop to other high value crops which can be handled. The storing of fresh produce beyond the season is an underused potential of the sector. Prolonging the selling season for local production and exports is primarily constrained by the shortage of proper storage for fresh fruits (particularly ULO/CA). The freezing facilities procure and process relatively small quantities of plums which mostly complements the raspberry and blackberry assortments. 5.2.3 Other value-added activities There are some opportunities to produce and export various new value-added products (fruit preps, niche products, traditional fruit preserves, and organic processed products).

136
Regional Rural Development Standing Working Group in SEE
6. MARKET OPPORTUNITIES There are promising prospects for the Serbian plum and prune sub-sectors. Besides keeping the EU markets at a standstill in the last few years, new emerging markets have made quite an impact on both the export of fresh plums and prunes. Such producers will need to invest in order to cope with the increasing demand, and at the same time preserve the quality of the production. The market opportunities, especially in the Russian markets, are promising. However, due to the unorganized approach of Serbian companies, only small quantities reach the market, while Chile and Argentina sell 48% and 52% respectively of their total production to the Russian market at significantly higher prices. Russian importers are inclined to invest in stable relationships with local companies, and preferably with a lesser number of them. However, this does not mean that producers can sell any quality to the Russian market, which is becoming in certain areas (MRLs) even more demanding than the EU market. An increased export of plums to the EU market is a strategic direction for market diversification for Serbia. However, improvement of the quality (varieties for plums and food safety for prunes) are preconditions to any significant increase of the exports. The current positive trend is expected to improve the cash flow in the sector enabling the much needed modernization in the sector and access to the EU markets.
6.1 Plums Increased dependence on one export market is especially evident in the case of plums and the Russian Federation (91%). However, this market imports some 10% of the world supply of plums. Many companies in Russia are not aware of the availability of plums and the quality and prices as Serbia invested little in promotional activities. As a supplier, Serbia is much closer in comparison to the main suppliers of the Russian market (Chile and Argentina). The entrance into the Russian market also affords a free pass to the Belarusian and Kazakhstan markets at even more enhanced trade conditions. Graph 3.3: List of importers for fresh plums in 2011
Source: ITC calculations based on UN COMTRADE statistics
The major world importers are the United Kingdom (€ 80 million), Germany (€ 46.3 million), the Netherlands (€ 41.6 million) and the United States (€ 41.3 million). The global trade in fresh plums is somewhat concentrated on a large proportion of EU countries (22). Serbia’s market diversification is possible through continuous investments and improvements which would result in stronger future penetration in some of the sizable importers, such as the EU (UK, the Netherlands, and Germany) regarding the fresh plums consumed.

137
Regional Rural Development Standing Working Group in SEE
Serbia is already present in these markets; however, Serbia is there with limited quantities and is mainly exporting for processing. Selling of the best production (most varieties with extended season through storing) to the EU at increased prices and keeping the Russian market for the current production is estimated as a good marketing opportunity. Exporting raw material to the EU for processing and then later competing with them in the markets for prunes should not be a direction to follow. Graph 3.4: Prospects for market diversification for fresh plums exported by Serbia
Source: ITC calculations based on UN COMTRADE statistics
6.2 Prunes The demand for Serbian prunes has soared, with Russia in recent years taking the lead since 2002. Turkey has gained significant importance too. However, Russia is the leading importer in the world and likely to be the most stable importer. The demand for quality on the Russian and EU markets is constantly rising while the demand for low cost persists. As a result of the ongoing crisis, the markets are adapting, and specifically in the Russian markets the most expensive brands are less competitive. This means that retail packed and bulk packed prunes are sold in equal quantities. Graph 3.6: List of importers of prunes in 2011
Source: ITC calculations based on UN COMTRADE statistics
The Russian army is a significant buyer of prunes and all kinds of dried fruits (plum, apple, pears, grapes etc.) It is supplied through public competitive tenders for products which fit the state prescribed standards (GOST). The contracts are awarded on based on price, delivery possibilities, quantities offered and reliability. The most common packing required is 30 to 50 kg. Payments are made every three months.

138
Regional Rural Development Standing Working Group in SEE
Hotels, restaurants and the retailers are the largest markets. However, they are mainly supplied by importers/wholesalers either with existing branding or under private labels. They require retail and bulk packing of 5 to 10 kg. The packing is in cardboard boxes with a plastic lining. The supply contracts are from a few months up to a year, starting from September with monthly deliveries. Companies are paying upfront to trusted suppliers, however, the most common method is split payments, consisting of 10% after the signing of the contract, 50% after loading and 40% after delivery. The prices have been fluctuating from 20 to 30% during the season, peaking at the beginning of the harvest season. Disagreements occur most often on account of the agreed and delivered quality and inability to provide the agreed amounts. Graph 3.7: Prospects for market diversification for prunes exported by Serbia
Source: ITC calculations based on UN COMTRADE statistics
The demand is expected to be stable on the Russian market and increase will be preconditioned with improved quality rather than quantity. Regional markets such as Croatia, Bulgaria, Italy, Slovenia and the Netherlands are competitive and stable markets that could absorb a larger quantity, however, this is likely to happen at the cost of improved quality. 6.3 Value-added products Frozen plums, purees, concentrates, juices, preserves and culinary ingredients have good potential and competitiveness due to the ample supply of cheap raw material available for the local processors, including conventional products as well as organic. Few value-added products are produced, as technical training is missing even in forward-looking companies. Organic value-added products such as concentrates and purees, for example, have a good potential and are already produced by some local companies. 6.4 Main competitors There are more than 2,000,000 ha of plums in the world with an average annual increase in production of 4%. China accounts for 54% of the total planted area with expedient growth in the last 15 years. The total production is estimated at some eight million tons, with an average yield of 14 t/ha. The best yields are obtained by Slovakia, with an average of 25 t/ha. The most important competitors, in order of their percentage of supply to the world markets, are Argentina (43%), Chile (17%), Tajikistan (12%), Ukraine (8%), Moldova (7%) and Uzbekistan 4% (22). In the last few years the fresh plum market has been quite dynamic, with both traditional large exporters keeping the top positions and with new emerging producers competing for the largest markets. Chile, China and South Africa are the main competitors on the global arena. Spain is the largest competitor in the EU along with Italy, France and the Netherlands, while other

139
Regional Rural Development Standing Working Group in SEE
regional players such as Moldova and Hungary also show growth in the sector. Other countries such as Uzbekistan, Tajikistan and Ukraine are also significant competitors for the Russian market. The competitors in the prune market are a reflection of the plum export market with the inclusion of the processing capacity. Apart from China and Argentina, the US and European countries are the largest competitors which, at the same time, are large importers of plums as raw materials for their processing industries. Graph 3.8 List of exporters of plums fresh in 2011
Source: ITC calculations based on UN COMTRADE statistics
Graph 3.9: List of exporters of prunes in 2011
Source: ITC calculations based on UN COMTRADE statistics
7. SUB-SECTOR GROWTH POTENTIAL
7.1 Size and productivity Growth of the sector is not a precondition for increased supply to more and larger markets in terms of quantity. Serbia already has a high stake in the world’s production and much of the production is still consumed at home. The supply outweighs the demand and the sector has only recently started to move forward after years of stagnation. It is estimated that the primary production sector currently has limited growth opportunities in terms of size, and medium growth opportunities in terms of productivity. It will take time to achieve an increase in the quality of agricultural production, especially to improve the variety composition needed for the EU markets.

140
Regional Rural Development Standing Working Group in SEE
Up to that moment, farmers need to invest in equipment, inputs and the rejuvenation of the orchards in order to maintain their place in the global production and the access to the Russian market. This is evident in light of the ongoing rural depopulation and production-related problems. Climate change is pressing the need to introduce irrigation at many locations. Many farmers are finding ways to cope on plot level, however there are areas where larger, regional investments will be needed. In the short-term, the Serbian growers can prevent the decline in the total planted area by utilizing the increasing exports and income in conjunction with the ongoing government support for primary agricultural production. Most processors/traders agree that there is sufficient quantity of raw materials available to meet any increase in demand for both plums and prunes. Growth opportunities in the processing sector are estimated as high. The increasing demand cannot be met by the thousands of small outdated facilities, both in terms of quality and the introduction of quality assurance standards. The drying facilities are reaching their limits and more and more investments are being channeled into this sector. On the other hand, freezing and processing facilities are underused and can easily respond to increased demand. Most processors/traders consider that with the increasing demand and available supply, an inevitable increase in the processing sector will follow. The estimates for growth of the processing sector in the short- to medium-term are between 20-30%. New modern drying facilities working with the best and new varieties are a significant growth opportunity, with high potential to yield attractive profits.
7.2 Labor and skill available locally, and improvement possibilities Serbia presently offers the sufficient supply of relatively cheap labor. Both the processing industry and the primary agricultural production depend on seasonal workers. Seasonal wages are between (€ 6 and 8) depending on the region and type of operation involved for processors. Field seasonal workers are paid some € 9-11 per day (for harvest, loading etc.), excluding lodging and food costs. Most farmers are moderately satisfied with the performance of the seasonal workers. The average harvested quantity per worker is 180 kg (20 crates at 9 kg each), corresponding to a cost of € 0,04/kg. This cost accounts for 10-20% of the farm gate price paid to farmers. It seems that due to the ongoing rural aging and migration, labor shortages may in the next decade impact the raw material production and limit its growth. Yet it is unlikely to cause any reduction in the production. Most farmers seem to be more interested in diversifying their income and securing jobs, while keeping the agricultural production as an additional income source. Although this means production of smaller sizes, it is unlikely that households will fully abandon the agricultural production of cash crops. Most farmers do not also see their children continuing the production in the current circumstances. The main reasons are connected to the low income from the small production, and related uncertainties Many farmers and almost all legal entities are highly dependent on seasonal labor for the harvest. Prices of seasonal laborers have been on the increase in the last few years. However, no notable lack of workers is evident. The introduction of mechanization in prune production (pitting) and in the plum production (harvest) are available at reasonable prices that are affordable for the local companies and enable a significant reduction in the labor needed. The primary sector was designed for a much larger market and therefore the production, however much plagued by inconsistencies, is able to meet the increased demand by the further processing industry and fresh sales. Provided that that planting of new varieties is not a precondition, the growth possibilities in the prune sector are evaluated at 20-50% in midterm, depending on the number/quality of investments addressing the existing and increasing demand for prunes.

141
Regional Rural Development Standing Working Group in SEE
8. PRODUCTION AND PROCESSING RELATED INPUTS
8.1 Primary production Most of the inputs used by the primary producers (fertilizer, fuel, plant protection, drip systems and so on) are imported, including part of the used agricultural machinery. A few inputs and some mechanization and agricultural implements are also produced by local commercial suppliers. The supply network in the country is well developed with both wholesalers and retailers. The producers face little problems in accessing any production inputs. The customs duty on the import of most of the agricultural inputs is low (11% or 5%). VAT on basic agricultural inputs (saplings, chemical agents, forage mixtures) is 8%. Farmers use the VAT compensation scheme very little, primarily because they are not sufficiently informed and few generate more income on accounts above the prescribed threshold in order to be registered. 8.2 Processing industry All materials for the packing of dried and frozen, retail and bulk products are produced locally. Plastic crates used for the harvest of berries are available both locally and in the region. For the most part, processing equipment for drying is produced locally, while more modern facilities are equipped by European manufacturers
33.
Plastic crates used for harvest are available both locally and in the region. For the most part, processing equipment and chilling/refrigerating equipment is supplied by European manufacturers
34.
9. ESTIMATED INVESTMENT COSTS PER SIZE OR OUTPUT UNIT AND ESTIMATED CURRENT RETURN ON INVESTMENT FOR EXISTING OPERATIONS
The estimated profitability and investment costs for primary production are based on data from average small agricultural producers who represent the majority of the raw material suppliers. The estimated profitability and investment costs for the processing industry is based on data from small startup processors which have gradually increased their capacity.
9.1 Profitability and investment cost per unit
9.2.1 Raw material production The production/investment costs of the primary production are estimated at some 50-60% of the value of the farm gate price. The provided costs also take into account the estimated wages of the individual producers and their household residents which are often not calculated in the costs of the production. One hectare is sold, depending on the location, for a price ranging from € 2,000 to 6,000, while saplings cost from less than € 2 (uncertified) to 13,5 (certified imported). The establishment of 1 ha of orchards accounts to an investment of € 12,000/ha
35. Planting
on state-owned land costs some € 8,500/ha. On the basis of average yields sold at average farm gate prices, an investment in 1 ha of plums would have a breakeven point of 5-7.5 years. This calculation does not take into consideration the growth period (3-4 years) prior to the harvest, and government incentives. 9.2.2 Processing industry
33
http://www.portal-srbija.com/oprema-masine-prehrambena-industrija 34
http://www.portal-srbija.com/ambalaza-i-pakovanje/papirna-i-kartonska-ambalaza
http://www.portal-srbija.com/ambalaza-za-hranu http://www.portal-srbija.com/euro-palete-drvene-palete http://www.portal-srbija.com/plastika-i-guma/ambalaza-od-plastike 35
average orchard tree planting density, saplings at average price, land procured at an average price

142
Regional Rural Development Standing Working Group in SEE
The representatives of the processing industry producing prunes are supplied by local producers of driers. Most of them have half of the capacity working on wood, while half is powered by oil. As most of the processors were upgrading their drying facilities gradually, they are not able to provide an accurate cost for investment per unit of capacity.

143
Regional Rural Development Standing Working Group in SEE
Annex 1.1 Trade indicators for frozen berries in Serbia
Importers Trade Indicators
Exported value 2011 (USD
thousand)
Trade balance
2011 (USD
thousand)
Share in
Serbia's exports
(%)
Exported quantity
2011
Quantity unit
Unit value (USD)
Exported growth in
value from 2007-2011 (%, p.a.)
Exported growth in quantity between
2007-2011 (%)
Share of partner
countries in world imports
(%)
Total import growth in
value from 2007-2011 (%, p.a.)
World 209995 205736 100 100331 Tons 2093 3 9 100 4
Germany 75003 74204 35,7 35715 Tons 2100 10 15 22,3 1
France 40874 40610 19,5 18767 Tons 2178 0 4 12,4 2
Belgium 23782 23739 11,3 9642 Tons 2467 10 12 7,5 3
Austria 12704 12411 6 7785 Tons 1632 -15 -4 6,2 4
UK 10302 10302 4,9 4992 Tons 2064 -3 5 5,1 -4
Netherlands 8197 8053 3,9 5074 Tons 1615 -6 8 4,4 -4
Sweden 5994 5972 2,9 1833 Tons 3270 2 -2 3,4 9
Poland 5193 4444 2,5 2775 Tons 1871 27 35 1,7 8
Italy 5189 5131 2,5 2895 Tons 1792 18 28 2,2 0
Switzerland 4419 4356 2,1 2008 Tons 2201 -1 0 2,2 2
Source: ITC calculations based on UN COMTRADE statistics
Annex 1.2: Trade indicators for plums in Serbia
Importers Trade Indicators
Exported value 2011 (USD
thousand)
Trade balance
2011 (USD
thousand)
Share in
Serbia's exports
(%)
Exported quantity
2011
Quantity unit
Unit value (USD)
Exported growth in
value from 2007-
2011 (%.)
Exported growth quantity between
2007-2011 (%)
Share of partner
countries in world imports
(%)
Total import growth in between
2007-2011 (%, p.a.)
World 18663 18322 100 23135 Tons 807 15 -6 100 3
Russia 17078 16928 91,5 17716 Tons 964 26 5 9,7 19
BiH 411 305 2,2 1816 Tons 226 -16 -22 0,1 -16
Czech Rep. 314 314 1,7 902 Tons 348 -14 -19 0,6 0
Montenegro 182 181 1 1294 Tons 141 88 105 0 81
Ukraine 103 103 0,6 121 Tons 851 0,3 1
Switzerland 97 97 0,5 258 Tons 376 28 16 1,3 6
Hungary 91 84 0,5 286 Tons 318 -56 -29 0,1 -27
Slovenia 56 56 0,3 57 Tons 982 -26 -27 0,1 5
Romania 55 55 0,3 141 Tons 390 -20 -35 0,1 -18
France 52 52 0,3 55 Tons 945 50 45 2,1 -13
Germany 26 26 0,1 54 Tons 481 -34 -27 6,8 -3
Source: ITC calculations based on UN COMTRADE statistics
Annex 1.3: Trade indicators for prunes in Serbia
Importers Trade Indicators
Exported value 2011 (USD
thousand)
Trade balance
2011 (USD
thousand)
Share in
Serbia's exports
(%)
Exported quantity
2011
Quantity unit
Unit value (USD)
Exported growth in
value from
2007-2011 (%, p.a.)
Exported growth in quantity
from 2007-2011 (%, p.a.)
Share of partner
countries in world imports
(%)
Total import growth in
value from 2007-2011 (%, p.a.)
World 7657 7481 100 3927 Tons 1950 6 5 100 0
Turkey 1190 1190 15,5 300 Tons 3967 0,5 35
Russia 1156 1156 15,1 585 Tons 1976 6 3 12,4 25
Croatia 967 967 12,6 357 Tons 2709 8 6 0,3 2
Bulgaria 830 830 10,8 512 Tons 1621 36 36 0,2 37
Italy 693 656 9,1 421 Tons 1646 -11 -6 6,5 -1
Netherlands 592 592 7,7 248 Tons 2387 31 28 2,8 -10
Slovenia 471 452 6,2 189 Tons 2492 7 9 0,5 -1
Romania 290 283 3,8 450 Tons 644 47 54 0,3 40
BiH 281 212 3,7 177 Tons 1588 24 -4 0,1 17
Germany 64 54 0,8 25 Tons 2560 110 -22 10,2 -9
Source: ITC calculations based on UN COMTRADE statistics

144
Regional Rural Development Standing Working Group in SEE
Annex 2: Information providers No. Name and Surname Entity Sector
1 Nikolic Miladin Farmer Plums
2 Bazalac Predrag Farmer Plums
3 Benac Mile Farmer Plums
4 Nikolic Milenko Farmer Plums
5 Perisic Predrag Primary production, Cooling facility, buyout Plums
6 Mladenovic Radmila ``Agranela`- Primary production Plums
7 Pajic Momir Farmer Plums
8 Kalicanin Djordje Farmer Plums
9 Zivkovic Ljubomir Farmer Plums
10 Pejovic Perica ``Golden fruit`- Primary production, Cooling, buyout Plums, berries
11 Milivojevic Milovan ``Fruvela`` - Cooling facility, buyout Plums, berries
12 Mladenovic Radmila ``Agranela`` - Drying facility Prunes
13 Mihailovic Goran ``Zavicaj`` - Drying facility Prunes
14 Avramovic Djura ``Poljootkup`` - Drying facility Prunes
15 Stefanovic Dragan Farmer Berries
16 Dimitrijevic Danica ``Frigojunior``- Primary production, Cooling facility, buyout Berries
17 Vukotic Aleksa ``Marinela`` Primary production, Cooling facility, buyout Berries
18 Stojic Milomir Farmer Berries
19 Vucicevic Momo ``MM company`` Primary production, Processor, buyout Berries
20 Cvetic Radoje ``Master frigo`` Primary production, Processor, buyout Berries
21 Stanic Milan ``Stanic d.o.o`` - - Processor Berries
22 Parezanovic Predrag ``Mondi`` - Processor Berries
23 Dmitrovic Bojan ``Healthy fruit`` - Processor Plums, berries
24 Dimitrijevic Danica Coldstores - Buyout Berries
25 Tesevic Biljana ``Nomil promet``- Processor Berries
26 Gulan Branislav Economic chamber of Serbia Consultant
27 Tomasevic Nevena Consultant Consultant
28 Rankovic Goran Consultant ``Fruits&berries`` project Consultant
29 Lekic Vaso ``Foodland`` Processor Plums, berries

145
Regional Rural Development Standing Working Group in SEE
Annex 3 – International statistics on Serbia and its agriculture Serbia and Serbian Agriculture in Brief
Population 7,276,604 The World FactBook, 2011
Population (Urban) 56% The World FactBook, 2010
Population – (Rural) 44% The World FactBook, 2010
Currency Serbian dinar (RSD) The World FactBook, 2011
Languages Serbian 88.3% (official), Hungarian 3.8%, Bosnia and Herzegovina 1.8%, Romany 1.1% (Gypsy) NB: Romanian, Hungarian, Slovak, Ukrainian, and Croatian all official in Vojvodina
The World FactBook, 2011
Total GDP (US$ bn) 46.1 The World FactBook, 2011
GDP per Capita (US$) 10,700.0 The World FactBook, 2011
Real GDP Growth Rate 2.0% The World FactBook, 2011
Consumer Price Inflation (%;av.)
7.0% The World FactBook, 2011
Agriculture GDP % of Total 11% The World FactBook, 2011
Total Labour Force 2,920,000 The World FactBook, 2011
Agricultural % of Labour Force 22% The World FactBook, 2010
Unemployed % of Labour Force 23.4% The World FactBook, 2010
Total Area 8,836,000 Hectare (ha) FAOSTAT, 2009
Total Agricultural Land 5,055,000 Hectare (ha) FAOSTAT, 2009
Agricultural Land % of Total Land
57% FAOSTAT, 2009
Arable Land + Permanent Crops 3,596,000 Hectare (ha) FAOSTAT, 2009
Arable Land + Permanent Crops % of Total Area
41% FAOSTAT, 2009
Arable Land 3,298,000 Hectare (ha) FAOSTAT, 2009
Arable Land % of Total Area 37% FAOSTAT, 2009
Irrigated Land 89,000 Hectare (ha) FAOSTAT, 2009
Irrigated Land % of Agricultural Land
2% FAOSTAT, 2009
Maize 7,207,190 Metric tonnes FAOSTAT, 2010
Sugar beet 3,324,850 Metric tonnes
Wheat 1,630,400 Metric tonnes
Cow milk, whole, fresh 1,506,700 Metric tonnes
Potatoes 887,363 Metric tonnes
Soybeans 540,859 Metric tonnes
Total Export of Goods FOB 8.3 billion US$ FAOSTAT, 2009
Agricultural Exports 1.9 billion US$ FAOSTAT, 2009
Agricultural Exports % of Total Exports
23% FAOSTAT, 2009
Major Exports (tonnes) FAOSTAT, 2009
Maize 1,602,070.0
Sugar (refined) 184,877.0
Beverage Non-alcoholic 142,379.0
Flour of wheat 156,675.0
Sugar beet 95,076.0
Beer of barley 114,504.0
Total Import of Goods FOB 16.1 billion US$ FAOSTAT, 2009
Agricultural Imports 942 million US$ FAOSTAT, 2009
Agricultural Imports % of Total Imports
6% FAOSTAT, 2009
Major Imports (tonnes) FAOSTAT, 2009
Bananas 43,065.0
Cake of soybeans 18,273.0
Coffee, green 32,099.0
Oranges 40,320.0
Food Prep Nes 21,885.0
Sunflower seed 31,386.0

146
Regional Rural Development Standing Working Group in SEE
Annex 4 - References:
(1) Analysis of the value chains in Southern Serbia – EPI Centar Internacional – 2012
(2) The market chain of fruit production in Serbia – A case study of raspberry and sour cherry
cultivation - Katica Radosavljević – 2007
(3) www.stips.minpolj.gov.rs
(4) www.kompenzacionifond.gov.rs
(5) Национални програм руралног развоја од 2011. до 2013 - В Л А Д А - 2011 године
(6) Cultivated Berry Value Chain Assessment - USAID Agribusiness Project Serbia - 2008
(7) Privredna Komora Srbije – Srbija vaš poslovni partner – 2012
(8) Serbia Agriculture Fact Sheet – Ministry of Agriculture, Trade, Forestry and Water
Management – 2012
(9) Serbia - Food and Agricultural Import Regulations and Standards - Narrative - USDA/Foreign
Agricultural Service - 2010
(10) Fruit Industry in Serbia – SIEPA/UNDP – 2006
(11) Organic Agriculture in Serbia - At a Glance – GIZ - 2011
(12) Национални програм за пољопривреду од 2010. до 2013 - - В Л А Д А - 2010 године
(13) Agriculture and Rural development Serbia - Agriculture and Enlargement - European
Commission – 2010
(14) Business Environment and Competitiveness - Serbia in a Regional Perspective (Analytical
Report) – DAI -2008
(15) www.mpt.gov.rs
(16) www.fao.org
(17) www.eastagri.org
(18) Cold chain strategy for Serbia - World Food Logistics Organization - 2009
(19) STUDY on the Effects of the Global Economic Crisis on Agriculture in Serbia – USAID –
2009
(20) Fruit Export Opportunities for Serbia: Middle East and North Africa – DAI – 2011
(21) SERBIA - Country Report - ARCOTRASS- Consortium – 2006
(22) Tree Fruits Value Chain Assessment - USAID Agribusiness Project – 2008
(23) http://www.stat.gov.rs/
(24) Republic of Serbia - Agriculture Sector Review – World Bank – 2003
(25) Zakon o porezu na dohodak građana – VLADA – 2010
(26) Export Development of High Value Agricultural Products of SEE Countries - CBI/SWG -
2011
(27) Food Industry Study in Southeast Europe – GFA- 2011
(28) www.trademap.org
(29) www.uap.gov.rs
(30) www.fb.org.rs
(31) www.ceftatradeportal.com
(32) www.proberza.co.rs
(33) http://www.siepa.gov.rs
(34) Investment Incentives in Serbia – SIEPA – 2011
(35) DOING BUSINESS IN SERBIA – SIEPA – 2012
(36) INVESTMENT GUIDE TO SERBIA – SIEPA – 2011
(37) AGRICULTURE 2009- STATISTICAL OFFICE OF THE REPUBLIC OF SERBIA - 2009

147
Regional Rural Development Standing Working Group in SEE
COUNTRY PROFILE - CROATIA
- Mandarins
- Olive oil

148
Regional Rural Development Standing Working Group in SEE
II. COUNTRY SPECIFICS - CROATIA
1. GENERAL DATA ON THE COUNTRY
1.1 General Data The Republic of Croatia has a surface area of 87,609 km², consisting of 56,542 km² (64.5%) of continental land area and 31,067 km² (35.5%) of territorial sea area. With a total population of 4,437,460 (Census 2001), Croatia has an average population density of 78 inhabitants / km² (3). The country is situated on the crossroad between Central Europe, the Mediterranean and the Western Balkan countries. It has 2,197 km of total land boundaries, shared with Slovenia (670 km) in the north, Hungary (329 km) in the north-east, and Bosnia and Herzegovina (932 km), Serbia (241 km) and Montenegro (25 km) in the south-east. The total Adriatic coastline amounts to 5,835 km (mainland 1,777 km and islands 4,058 km). Croatia is a Republic. The country is divided into 20 regions, with Zagreb as the economic and cultural center. Croatia was awarded candidate country status by the EU in 2004. The Stabilization and Association Agreement concluded by the EU and the protocol on enlargement took effect in 2005. Croatia will join the European Union in 2013 and has been a member of NATO since April 2009 (3).
1.2 Economy Since 2000, the national economy has been characterized by economic growth until 2009, when, as a consequence of the financial crisis, Croatia recorded negative economic growth. The main economic indicators are provided in the table below. The Croatian macroeconomic environment is stable, reflected in the low inflation rate and confirmed by the long-term credit rating. The country’s national debt remains high with the public debt (general government gross debt) in 2011 increasing by 4% to reach 45.6% (37). The overall boosting of the economy contributed to some stabilization on the labor market. During the last six decades the unemployment rate was declining up to the global crisis. In 2012 a total of 333,400 unemployed people were registered in Croatia. Table 1.1: Macroeconomic indicators
Indicator
2005 2006 2007 2008 2009 2010
2011 (37)
GDP (million € , current prices) 36 034 39 745 43 039 47 370 45 379 45 893 47,555
GDP growth rates %(constant prices) 4.3 4.9 5.1 2.2 -6.0 -1.2 0
GDP per capita, current prices (€) 8 112 8 951 9 781 10 777 10 311 10 374
Export of goods (€million) 15 273 16 990 18 307 19 905 16 157 17 596
Import of goods (€ million) 17 473 19 632 21 474 23 741 17 868 17 739
Unemployment rate (ILO) % 12.7 11.8 9.6 8.4 9.1 11.7 13.2
Inflation (year average) % 3.3 3.2 2.9 6.1 2.4 1.1 2.3
Source: Ministry of Finance
Croatian industry is concentrated in the region surrounding Zagreb and Split. The focal points of the key tourism sector are located along the Adriatic Coast. The largest wharves, which are among the global leaders in terms of orders, are situated near Rijeka. The average Croatian HRK/€ exchange rate
36 oscillations have been very low.
36
Exchange rates: 1 € = 7,4 HRK, 1 USD = 5 year average of 5,9 HRK. Croatian National Bank, September 2012
Exchange rate used: 1 € = USD 1,3 October 2012

149
Regional Rural Development Standing Working Group in SEE
1.3 Foreign Investment Graph 1.1: FDI in Croatia by industrial branch
From 1993 to 2010, Croatia received foreign direct investments to the total amount of € 24.5 billion. The investments per sector are shown in the graph. Investments in agriculture and food account for 1.5% of the total investments (10). FDI in Croatia in 2011 totalled to € 1.048 billion.
Source: Croatian National Bank
2. CROATIAN AGRICULTURE AND FOOD SECTOR The economic importance of agriculture is relatively high in Croatia despite a declining trend. The gross value added of agriculture has decreased to less than 7% since 2006. The same trend can be observed for the food processing industry. Both sectors play an important role on the labor market as a significant percentage of the population earn their income from the agriculture and the food sectors. Croatia suffers from a deficit in the agro-food sector and is currently self-sufficient in the production of potatoes, poultry meat, eggs, corn, wine, sugar, mandarins and wheat, and is a net importer of agricultural commodities.
2.1 Land In Croatia two thirds of the land (63%) are classified as agricultural land and forests, and 37% as settlements with forests covering almost half (44%) of the total land. The farming structure consists mainly of small family farms which mostly produce for their own needs. Their share in market production is very low. The importance and number of medium-sized farms has been on the rise for the last ten years. The largest share of market production is focused on large farms which have been growing at a fastest rate in recent years. The structure of the agricultural holding is shown in the table below. Table 1.2: Structure of agricultural holdings and land
<3
Class (ha) >=3 & <20 >=20 & <100
> = 100 All holdings
Number of holdings 120,230 63,707 6,060 675 190,672
Land (ha) 103,680 424,719 238,654 240,906 1,007,959
Size (ha) 0,9 6,7 39,4 356,9 5,3
Holdings (%) 63,1 33,4 3,2 0,4 100,0
Land (%) 10,3 42,1 23,7 23,9 100,0 Source: MAFRD

150
Regional Rural Development Standing Working Group in SEE
Graph 1.2: Agricultural area as share of total land area
Source: FAOSTAT
2.2 Irrigation Croatia, regardless of its potential (soil quality, water resources), is almost ranked bottom for land irrigation in Europe and apart from Albania it ranks far behind the other transitional countries. Only 9,000 ha are irrigated although there is potential for 600,000 ha. With the onset of climate change, Croatian agriculture is now more exposed to droughts as evident in 2000 and 2003, and the lack of irrigation infrastructure is compounding the problem and the negative effects on agriculture. In 2004 the state programme for irrigation, agricultural land and water resources management commenced in Croatia. The main objective is the development and improvement of the irrigation infrastructure system; however, it resulted in limited improvements. The government plans to invest € 3.2 billion in water management and irrigation by 2023.
Graph 1.3: Share of irrigated area in total arable area
Source: FAOSTAT
2.3 Plant production Graph 1.4: Cereals shares
2.3.1 Cereals Cereals dominate crop production in Croatia, accounting for about 65% of total arable land. An average of 559,000 ha is planted with cereals and 3.1 million tons of grains are produced. Corn participates with 62% (2.2 million tons) and wheat with 27% (903,900 tons). For several years now Croatia has been an exporter of cereals (6).
2.3.2 Industrial crops Some 250,000 tons of oil seeds (soy, sunflower, oil rape) are produced on 95,000 ha. Oil plants production covers less than 80% of domestic needs for raw vegetable oil and fats (6).

151
Regional Rural Development Standing Working Group in SEE
Source: MAFRD
The production of sugar beet is undertaken on some 30,000 ha and sugar is produced in three factories, partly from imported raw material (6). Sugar is Croatia's most significant export product of the last decade. Almost the entire export of sugar is realized on EU markets. The progress realized in the last six to seven years account for by more than 2.5 times increase of the yields per hectare and amounting to about 9.5 tons. Graph 1.5: Industrial crops shares Graph 1.6: Sugar beet production
Source: MAFRD
With the EU accession, like the rest of the European sugar industry, the Croatian sector of agriculture and food will be exposed to extremely strong world competition due to the full market liberalization. 2.3.3 Fruits and vegetables Fruits and vegetables (including grapes) production is characterized by small scale farmers, producing primarily for self-consumption and direct marketing. Grapes (table and wine grapes) and potatoes are the most important commodities, followed by apples, plums and tomatoes (6). Table 1.7: Fruit and vegetable shares
Source: MAFRD

152
Regional Rural Development Standing Working Group in SEE
The fruits and vegetables production is extremely diverse and on the rise, however, it still accounts for less than two thirds of the total consumption. Self-sufficiency of the production of fruits is significantly lower than with vegetables. Apples and mandarins are the most produced fruits with an average aggregate production of 103,000 tons. Cabbage and paprika are dominant with an average aggregate production of 70,000 t in the segment of vegetable production, (6).
Wine production in Croatia has a very long tradition. About 150,000 farmers cultivate vineyards. More than 95% of producers have surfaces up to 0.5 ha, showing that many growers are part-time farmers. The most frequent grape varieties cultivated are: Grasevina, Istrian malvasia and Plavac. Their aggregate share accounts for 47% of the total production. The rest pertains to 28 sorts, neither of which alone participates with more than 3%. Regarding natural conditions for growing wine grapes, two regions can be distinguished: the continental and the costal with a total of 13 sub-regions. The wine production reaches some 1.28 million hectoliters. Most of the producers are located in the county of Split-Dalmatia. In the last few years, the share of wine trade in relation to domestic production has significantly increased (the average share increased to 14% in 2010). Nevertheless, the import of wine was several times higher than the export. Average export prices of Croatian wines are approximately three times as high as the prices of imported wines. Consumption of wines by tourists is an important segment of the total consumption (6). 2.3.4 Olive production Around 40,000 farmers are involved in olive growing. Just as in wine growing, there are many semi subsistence farmers. The history of production is over two centuries old and the widely known quality of olive oil dates back to Roman times. Out of the total olive oil production with an average of 60,000 hl, direct consumption and direct on farm sales account for most of the quantity. The positive trend of production increase is influenced by consumer awareness regarding the health and nutritional value of olive oil. Although production volume is modest, the quality of Croatian olive oil is among the best in the world (6).
2.4 .Livestock production In the livestock sector, small production units predominate for cattle, pig, sheep, goat and horse keeping. The largest share of the production structure belongs to small family farms, whereas the importance of large production units (specialized farms) in the market has been rising fast in the last few years. During the war (1991-1995) the number of cows decreased significantly. This reduced the production volume but also slowed the structural adjustment of the sector. Milk production forms the basis of cattle farming. In the last few years, the sub-sector has been restructuring with a significant increase of supplied milk by the largest farms (6). The number of cows remained unchanged, and out of the 52,483 registered dairy farms, almost 92% have up to ten cows, whereas their average size was less than three cows. The remaining 4,411 farms have more than ten cows and their average size was 24.2 cows per farm. The dairy industry is concentrated in a similar manner, and out of 40 dairy producers about two thirds of the supplied and processed milk belong to the biggest producers.
Table 1.8: Milk production Croatia is a net milk importer. The production level seen before the country’s transition has still not been achieved. For that reason, this is one of the segments into which the greatest funds have been invested by the government in recent years (6).The greatest shift is noticeable in the increase of quality of milk which is getting close to the average EU quality.

153
Regional Rural Development Standing Working Group in SEE
Breeding of the Simental breed (about 78% in 2010) which is a double purpose breed (meat/milk), is dominant. Apart from this breed, the dairy breed of Holstein (18%) and the brown cattle breed (3.5%) are used, while the other breeds are neglected in terms of the number of heads (6).
The potential for the development of pig farming production comes out of
Source: MAFRD
the strong domestic production and the tradition, while the main disadvantage is the extensive fragmentation of farms. Production is organized in large production units with the latest technologies and the use of a high-quality genetic basis of current hybrid lines in the production. Most of the sheep and goat production takes place in mountainous areas and on the islands, known and characterized as less favored areas. It is possible to apply for specific funds regarding this matter. As much as 98% of the production is located on relatively small family farms, of which almost 30,000 are in sheep production (6). Poultry production on the other hand is characterized by large-scale production units (meat and eggs). In the meat consumption structure, following the production structure, the largest share pertains to pork, then poultry meat followed by beef, while the consumption of lamb and goat meat is the lowest. For all the above meat categories, Croatia is a net importer but comes close to achieving self-sufficiency in poultry meat (6).
2.4.1 Fishery Fishery, along with tourism and agriculture, represents the main source of income for the coastal and especially island communities. The protection of fish resources is based mostly on the implementation of technical measures which include the minimum allowed catch sizes, fishing instruments features, spatial temporal fishing limitations and so on. Catch quotas are defined only for the northern bluefin tuna. Sea fishing is divided into commercial, small, recreational and sport fishing. In Croatia, there are about 3,500 entities authorized for commercial fishing. 85% of the total catch is small oily fish (6) as shown in the table below. The mariculture includes breeding of white fish, oily fish and shell fish. The total annual production amounts to about 12,000 tons of the total value of around € 120 million. The sea bass and the sea bream are dominant in the breeding of white fish with about 4,000 tons/year (6). At the same time, the Croatian hatcheries produce about 20 million pieces of sea bass and gilthead sea breams per year.

154
Regional Rural Development Standing Working Group in SEE
Table 1.3: Sea fish catch
Year Catch Catch per category (t)
Tons Oily fish White fish Other
2002 21,204 18,733 1,624 847
2003 29,091 24,369 3,556 1,166
2004 31,937 26,381 4,325 1,231
2005 34,661 28,621 4,573 1,467
2006 37,856 31,646 4,857 1,353
2007 40,162 33,041 4,893 2,228
2008 49,006 42,823 4,765 1,418
Source: MAFRD The breeding of oily fish (tuna) is practiced in floating cages on semi-protected and open areas of the Middle Adriatic. The breeding is based on the catch of small-size tuna from the wild (8-10 kg) and further breeding up to the market size (30 kg). Annual production amounts to about 5,000 tons, (value of € 80 million) which mostly is exported to the Japanese market. The breeding of shell fish includes the breeding of mussels and oysters on “pergola” ropes in controlled areas. Annual production amounts to about 3,000 tons of mussels and about 2 million oyster pieces (6).
2.5 Marketing of agriculture products and market infrastructure Croatia has established a network of wholesale markets and established the National Wholesale Market Company as a joint stock company as well as joint stock companies in Zagreb, Osijek, Split, Rijeka-Matulji, Metković and Benkovac. New wholesale markets were constructed in Osijek, Rijeka and Split. The facility in Benkovac was renewed while those in Zagreb and Metkovic operate from the existing locations. There are also unofficial/seasonal wholesale markets in operation. The largest share of retail trade of agricultural produce is through three retail chains. The largest retailer (Conzum within the Agrocor concern) controls some 30% of all food retail in Croatia. Most of the market leaders in Croatia are domestic companies. A significant portion of fresh produce is retailed to the so-called Green Markets present in multiple locations in the towns and cities. During the peak of the touristic season farmers/traders sell agricultural produce directly to commuters/visitors and tourists. The Market Information System in agriculture (TISUP) is a centralized data collection, processing and info distribution system. Emphasis is put on data of prices of agricultural and food products so continuous market analysis would be available. For the time being, TISUP is processing five groups of products: 1) fruit and vegetables prices are collected, weekly, from all larger markets and shops 2) prices of livestock, meat and products are collected from 80% of cattle fairs, in meat industries and butchers’ shops, every two weeks 3) prices of cereal and oilseeds are also collected every two weeks 4) fish and fish products are collected monthly 5) agricultural input costs are processed biannually. All the reports, prices, databases, trends, offers, demands and other data, are provided free of charge on their website (25). Nevertheless, most of the interviewed farmers and buyout traders were not acquainted with the TISUP system and have not used it.

155
Regional Rural Development Standing Working Group in SEE
2.6 Employment and labor in agriculture The registered unemployment rate remains at a moderate level (at 11, 8% official statistics and 17, 4% according to the administrative sources in 2011), with similar rates for women and men. Some 24,500 people are employed in legal entities involved in agriculture, some 8,500 people are self-employed craftsmen related to agriculture and 32,000 people are employed as farmers. The income level of families and households in rural areas is lower in comparison with those in urban areas. The percentage of those using unemployment and social support is between twice and four times higher in rural than in urban areas. Many households rely on subsistence farming as the main source of income in mainly rural areas. Graph 1.9: Population composition in Croatia
Source:FAOSTAT
Social security contributions are high in international comparisons with 20% for employees and 17.2% for employers. Self-employed people are charged a maximum of 35.5% of their income shown as salaries. 2.7 Credits and loans availability The financial industry in Croatia is developed and offers specialized products for different agricultural activities, including primary production and processing. The financial system consists of several commercial banks
37 which have specialized packages
for agriculture, including the buying and building of commercial facilities, the procurement of a basic flock/herd, buying land and the mechanization and equipment, protected production investments as well as the establishment of orchards. Bank loans are offered at rates from 6-7% for physical entities and at some 7% for legal entities. The interest for commercial credits is low as the Croatian bank for reconstruction and development (HBOR) credits are provided with much better interest rates and repayment conditions. The HBOR operates a loan programme out of IBRD Loan Proceeds, enabling farmers and exporters to maintain or increase the existing volume of production and exports which contribute to the improving of the trade balance, employment and liquidity. The loans are used for financing the working capital needs, the purchase of goods (raw and production materials as well as equipment), works and services needed for the carrying out of export transactions. Borrowers are commercial banks that are lending funds to the sub-borrowers which are companies registered and active in Croatia. The minimum criteria to be met by sub-borrowers are as follows:
Private ownership (more than 50%)
Status of an exporter/producer
Maximum debt to equity ratio of 85:15
After receipt of the loan, sub-borrowers should generate enough cash during the pay-back period to maintain a minimum debt service coverage ratio of at least 1.1:1
37
http://banke.com.hr/banke/

156
Regional Rural Development Standing Working Group in SEE
In relation to agriculture the most significant are:
The Loan Programme for the Financing of Agriculture and Small Businesses in Areas of Special State Concern for companies, craftsmen, co-operatives, family farms and fishermen
Financing the preparation of agricultural production, working capital for investments in agricultural production, natural persons and legal entities (family farms within the VAT system, crafts businesses, companies, co-operatives) in the rank of micro, small or medium-sized enterprises (26)
The Croatian Agency for SME (HAMAG) provides supports to the entrepreneurship environment by the provision of guarantees for entrepreneurial credits for existing, as well as newly established, small and medium enterprises – companies, crafts, co-operatives and family agricultural enterprise. The interviewed farmers have stated that qualification criteria exclude the smallest (in terms of land area, number of trees) farmers from preventing their access to affordable credits and limiting their investment opportunities. No crediting limitations were identified regarding processors.
2.8 Storage and transport capacity Three Pan-European corridors pass through the Croatian territory. The total length of the roads is 29,546.9 km in the Republic of Croatia. The total length of Croatian railroads is 2,772 km. The Croatian rail network is a part of the European rail network. Croatian seaports handle naval transport from Central, East and South Asia, Australia and Oceania to Europe, shortening the shipping time of goods by at least five to eight days. The Croatian ports also connect Central and Eastern Europe with North and South America as well as Africa. Croatia has six international seaports in Rijeka, Zadar, Split, Šibenik, Ploče and Dubrovnik. The inland waterways open for international transport are in Sisak, Slavonski Brod, Osijek and Vukovar. Croatia’s inland waterway network equals 804 km, 287 km of which is a part of an international waterway network. There are seven international airports in Croatia, in Zagreb, Split, Dubrovnik, Zadar, Rijeka, Pula and Osijek. Approximately four million passengers per year are transported through the airports. Croatia has ULO cooling houses of some 45,000 tons which are sufficient for the Croatian production. During peak seasons all cold storage space is being utilized. Cold storage capacity is not a limiting factor to the growth of the supply chains at the present time. Private investment and interest are adequate to meet the needs for growth in the future. Post-harvest operations in Croatia are adequate to accommodate the current production.
3 FOREIGN TRADE OF AGRICULTURALFOOD PRODUCTS Since 2000 the country has been experiencing economic revival but the restructuring of the economy remains a challenge. The EU represents the main trading partner: 63% of Croatian total imports came from the EU and 61% of Croatian total exports were sold to the EU in 2010. Under the Stabilization and Association Agreement, the EU granted Croatia unlimited duty-free access to the community market for nearly all agricultural products (exceptions of baby beef, fisheries, wine products and sugar), for which tariff quotas remain. On the Croatian side, tariffs for agricultural products were reduced but remain for a certain number of products. Therefore trade provisions of the SAA are asymmetrical in favor of Croatia. Under the SAA, Croatia's main exports to the EU consist of four products which cover an average of 65% of the exported value: sugar, cereals, preparations of meat and prepared vegetables and fruits. The EU’s main exports to Croatia are meat and edible meat, live animals, dairy products, fruits and nuts. The country remains a net importer of agricultural and food products.
3.1 Foreign trade statistics In the structure of the total agricultural trade, trade with the EU prevails somewhat to the Central European Free Trade Association (CEFTA) member states and other countries as shown in the graphs below.

157
Regional Rural Development Standing Working Group in SEE
In the last three years, the trade with CEFTA partners has grown at an especially quick rate and increased by as much as 67%, while the total trade increased by 30%. Within the CEFTA group, a surplus in the trade amounting to € 332 million is achieved, while at the same time a trade deficit of € 907 million is realized with the EU countries. Croatia exports agricultural products to 114 countries on all continents, whereas more than 90% pertain to the first 15 export destinations. On the other hand, products originating from 178 countries are present on the Croatian market. The first 15 countries make up about 73% of the total import, whereas the aggregate of the import from the EU countries amounts to almost 70%. Taken individually, Croatia realizes the greatest trade surplus with Bosnia and Herzegovina as well as Japan, where the main export product is the northern bluefin tuna. Croatia has been realizing the greatest trade deficit in the last years with Germany, Brazil, Hungary and Italy (6). Table 1.10: Import of agricultural commodities
Source: MAFRD
Table 1.11: Export of agricultural commodities
Source: MAFRD Food industry products are dominant in the structure of agricultural and food export compared to primary products. Among the 15 top export products (see graph 1.13), the only primary agricultural products present are wheat, corn and mandarins. The first two positions have been occupied by sugar and cigarettes for years, whose aggregate share in the total agricultural export exceeded one quarter of the total export. This surpasses the value of the sale on the domestic market and points to a high level of competitiveness.

158
Regional Rural Development Standing Working Group in SEE
Table 1.12: Croatian foreign agricultural trade
Source: MAFRD

159
Regional Rural Development Standing Working Group in SEE
Table 1.13: Trade balance of selected products (Mill USD )
Source: MAFRD Sugar is positioned first in the total Croatian import but with lower value. Products which are not in the group of the 15 most imported products make up more than two thirds of the total value of the import which points to an extremely heterogeneous import structure. At the same time, the most significant export items make up more than 53% of the total export value. The following products are also in the group of significant exports and imports: cocoa products, beer, biscuits and waffles and animal food preparations.
Out of the 22 most important agricultural products, only six groups have recorded a trade surplus including tobacco, sugar and sugar products, tuna and fresh fish and spices such as Vegeta, as shown in the table below.
The greatest average annual deficit in the other 16 groups is recorded in meat (approximately € 123 million), fruit (approximately € 109 million), live animals (€ 100 million), animal feed/food industry waste (€ 0.99 million) and cereals (€ 79 million) (6).
In 2000, Croatia became a member of the World Trade Organization (WTO) which also prompted trade. 90% of the total trade is undertaken with partner countries with which free trade agreements are signed. During the last seven years, import and export grew at the same quick rate, and thus the trade balance tripled. The level of self-sufficiency fluctuates between 51% and 64%, whereas in the last 15 years the coverage of import by export in agriculture was always significantly higher than for non-agricultural products (6).

160
Regional Rural Development Standing Working Group in SEE
Table 1.4: Quantities and values of most important agricultural exports
No. Product Quantities (t) Value (USD) Share (%)
1 Sugar 241,015 186,455,941 14.0
2 Cigarettes 7,223 103,035,346 7.8
3 Tuna 3,661 59,848,191 4.5 4 Wheat 246,394 57,633,248 4.3
5 Spices (Vegeta) 17,376 55,009,554 4.1
6 Other fresh fish 3.661 40,418,304 3.0 7 Beer 53,853 35,889,170 2.7
8 Corn 187,685 29,210,023 2.2
9 Cocoa products 5,908 28,004,136 2.1
10 Soups 5,180 21,580,300 1.6
11 Waffles, wafers and biscuits 7,816 20,351,575 1.5
12 Children food products 4,181 18,801,960 1.4
13 Feed 16,442 17,617,633 1.3
14 Mandarins 26,224 16,951,410 1.3
15 Cowhide 4,566 14,915,553 1.1 Source: MAFRD
3.2 Memberships and agreements fostering foreign trade
Membership of the World Trade Organization
Member of CEFTA – Free Trade Agreements with Albania, Bosnia and Herzegovina, Serbia, Montenegro, Macedonia Moldova, Kosovo*
Free Trade Agreement with Turkey
EU 27
Bilateral Investment Agreements with the following countries: Albania, Argentina, Austria, Belarus, Bosnia and Herzegovina, Bulgaria, Cambodia, Canada, Chile, China, Cuba, Czech Republic, Denmark, Egypt, Finland, France, Germany, Great Britain, Greece, Hungary India, Indonesia, Iran, Israel, Italy, Kuwait, Latvia, Libya, Macedonia, Malaysia, Malta, Moldavia, Montenegro, the Netherlands, Oman, Poland, Portugal, Qatar, Romania, the Russian Federation, Serbia, Slovakia, Slovenia, Spain, Sweden, Switzerland, Thailand, Turkey, Ukraine, USA, Zimbabwe (3)
Further bilateral investment agreements are into existence with the Belgian-Luxembourg Economic Union and Ireland.
3.3 Customs Croatia’s customs regulations are in line with EU standards. The laws include provisions for the governance and operation of free zones. The Law on Customs is fully harmonized with the customs systems of the WCO and the Combined Nomenclature of the EU. Unlike non-agricultural trade, which is completely liberalized, one part of the agricultural trade takes place by virtue of the application of customs protection. An average customs rate of 5.5% is applied, while the maximum customs fees are 20% for selected goods. No customs duty on exports to the EU for most Croatian goods is applied (3).
4 GOVERNMENT PROVIDED FOREIGN INVESTMENT SUPPORT AND SUPPORT TO THE AGRO AND FOOD SECTOR
4.1 Government provided grants Investors can benefit from various incentives as defined by the Investment Promotion Act:
Tax and customs benefits
Support for opening new workplaces
Support for the training and re-training of employees
Support for technology and innovation activities
Support for strategic business support activities
Special incentives for large investment projects

161
Regional Rural Development Standing Working Group in SEE
The above mentioned incentives may be used by foreign and domestic investors investing at least € 300,000. Incentives defined by the new Investment Promotion Act relate to:
Business activities in production and processing
Technology and innovation activities
Strategic business support activities The period in which the investment must be realized and work places created is three years. The minimum period in which the investment and created work places must be maintained is five years but not shorter than the period in which incentives are being used. The recipient of incentive measures is a legal or natural person who takes advantage of incentive measures or to which aids for initial investments are authorized. A legal or natural person who is to benefit from aid for initial investment shall submit an application for aid to the Ministry of the Economy before work on the project is started (10).
4.1.1 Grants Users of the tax free zones, who, prior to the enforcement of the Tax Free Zones Act, invested into construction and who participated in the construction of objects with an investment exceeding HRK 1,000,000 (€ 135,135) and who in the process did not use the upper limit of the approved subsidy, regulated by the regional aid map, shall reserve the right to be exempt from corporate income (profit) tax payment until the year in which the upper limit of the approved subsidy will be used, and not later than December 31, 2016. The amount of exemption from payment of corporate income tax cannot be bigger than the amount determined by the decision on the publication of the rules on aid of small values. Users of the tax free zones, who prior to the enforcement of the Tax Free Zones Act, conducted their business activity in the tax free zone, shall pay corporate income (profit) tax depending on the business unit second level statistics of the Free Zone location, and in compliance with the National Classification of the Statistic Area Units, in the following manner:
Taxpayer Period Rate of corporate income (profit) tax
User of the tax free zones who is in the business unit second level statistics - North-western Croatia (HR 01)
- from 2008 to 2010
- -from 2011 to 2013
- from 2014
- 50% of the prescribed tax rate
- 75% of the prescribed tax rate
- to the amount of the prescribed tax rate
User of the tax free zone who is in the business unit for second level statistics- Central and Eastern (Pannon- ian) Croatia (HR 02) and Adriatic Croatia (HR 03)
- from 2008 to 2013
- from 2014 to 2016
- from 2017
- 50% of the prescribed tax rate
- 75% of the prescribed tax rate
- to the amount of the prescribed tax rate
User of the tax free zone who in the region of the city of Vukovar, conducted business activity in the tax free zone prior to the enforcement of the Tax Free Zones Act
- from 2008 to 2010 -from 2011 to 2013 -from 2014 to 2016 -from 2017
- 0% of the prescribed tax rate
- 25% of the prescribed tax rate
- 75% of the prescribed tax rate
- to the amount of the prescribed tax rate
Source: MELE

162
Regional Rural Development Standing Working Group in SEE
4.1.2 Tax incentives Investment value (million €) Min. new workplaces Max. period
of use Beneficial profit tax A
Production and processing
Technology innovation activities and strategic business support services
Production and processing
Technology innovation activities and strategic business support services
(years) Rate
0.3 - 1.5 0.1-1.5 10 5 10 10%
1.5 - 4 1.5 - 4 30 15 10 7%
4 - 8 4-8 50 25 10 3%
> 8 >8 75 50 10 0%
Source: MELE
4.1.3 Employment incentives
3.1.
Source: MELE
4.1.4 Incentives for eligible training and re-training costs The investor who is opening new workplaces will be approved a non-refundable financial support for eligible costs regarding the training and re-training of employees.
Special training General training
Large entrepreneurs (more than 250 employees)
up to 35% of eligible costs up to 60% of eligible costs
SMEs (up to 250 employees) up to 45% of eligible costs up to 80% of eligible costs
Source: MELE
Eligible costs for training and re-training could be the tutoring costs, travel expenses and write-off costs of equipment and devices according to their use for the purposes of training (10).
4.1.5 Support for the projects on technology innovation and development activities A grant is provided for R&D high technology equipment to be used in the technology and innovation center, to the amount of up to 5% of the justified high-tech equipment costs. The maximum amount of the grant is € 500,000. 4.1.6 Large investment projects Large investment projects are considered to be projects which have a large impact on the domestic economy by way of a total investment of at least € 15 million in long-term assets that create at least 100 new jobs in a three year period (10).
County unemployment
Rate
Non-refundable financial support
Assets (factory, plant or equipment Infrastructure
County unemployment
rate
Max. amount of support regarding eligible costs for opening new workplaces
Increase for technology and
innovation activities
Increase for the strategic business support activities
< 10% 10% 1,500 EUR) + 50% (750 EUR) +25% (375 EUR)
10 - 20% 15% (2,000 EUR) + 50% (1,000 EUR) +25% (500 EUR)
> 20% 20% (3,000 EUR) + 50% (1,500 EUR) +25% (750 EUR)

163
Regional Rural Development Standing Working Group in SEE
20% Up to 5% eligible costs Max. 1 mil. €* Up to 5% eligible costs Up to 0.5 mil. € * Subject to the condition that the part of the investment in machinery or production equipment amounts to at least 40% of the total investment, of which a minimum of 50% must be high-technology.
Source: MELE
4.1.7 Scientific Activities and Higher Education Act The Scientific Activities and Higher Education Act regulates the state subsidies and tax incentives in respect of scientific research, basic research, applied research and development research. According to the act, applicants for scientific project tenders can be scientific organizations, centers of scientific excellence, scientists and groups of scientists.
Source: MELE
4.2 Technological- Industrial Development Zones Croatia has 15 Free Trade Zones and special incentives are offered to users. The Law on Free Trade Zones allows a foreign-owned or domestic company to engage in manufacturing and wholesale but not in retail trade, foreign trade, banking and other financial activities. The Law on Profit Tax also covers business in the zones. Users are eligible for tariff waivers on imported products. The zones are exempted from any emergency measures or other restrictions pertaining to foreign trade or hard currency transactions. Business advantages of the free zones include:
Goods are stored in the zone free-of-charge
For goods stored, used or consumed in the free trade zone, there are no tariffs or VAT nor are any other economic policy measures applied
For goods produced in the free trade zone which are imported to Croatia, tariffs and VAT are paid according to the value and tariff rates for the built-in components of the imported material, and not according to the value and tariff rate for the finished product
The following counties currently have free zones: Buje, Krapina-Zagorje, Osijek, Rijeka, Slavonski Brod, Split, Split County, Obrovac, Ploce, Pula, Kukuljanovo, Varazdin, Zagreb, Vukovar and Ribnik. EU accession will result in changes in the free trade zone system and the incentives system associated with them (10). The exact changes will be determined in the first half of 2013 4.3 Government support for the agro and food processing sector The government provides support through a system approximated to the EU and covers three main areas:
Direct payments
Measures for regulation of the markets
Measures for rural development
Type of research Enterprise % of eligible costs covered by subsidy
Corporate income tax base decrease (based on costs)*
Basic research 100% 150%
Applied research large medium
small
50% 60% 70%
125%
Development research
large medium
small
25% 35% 45%
100%
Technical feasibility of applied research
small / medium large
75% 65%
- -
Technical feasibility of development research
small / medium large
50% 40%
- -
*Corporate income tax decrease is granted up to the amount of percentage of costs covered by state subsidy

164
Regional Rural Development Standing Working Group in SEE
The main goals of the support are to reduce the negative and enhance the positive effects of the integration of Croatia in the EU, and the inclusion into the single market where market-price measures are mandatory. During the pre-accession period, along with the growth of the budget, the share of the measures of rural development in relation to the other measures will continue to increase. By 2012, an average budget share similar to the one in Member States from the last two EU enlargements will be reached. However, a more important goal is the improvement of capacities so as to replace direct payments by the use of EU structural funds (11).
4.3.1 Direct payments Direct payments are paid on the basis of output and per hectare/head. In order for farmers to be eligible for the support they need to be registered in the farm plot registration system (ACORD).
Olives Sub-sector From 2011, the law is harmonized with the EU and introduces significant changes in the way crops are supported, including olives and olive oil. Farmers registered in the ACORD system are awarded with 2,055 HRK/ha (€ 277.70) of direct supports per ha on which some 200 to 250 trees can be planted, or a minimum of 150 trees on a minimum area of 500 m
2.
The minimum number of trees to be supported is 30. Olives in less favorite areas will be supported with 240 HRK/ha (€ 32.4) of additional support. For organic olives, the support per ha is 2,750 HRK (€ 371.60). However, for processed organic olives, farmers will receive 0.63 (€ 0.085) HRK/kg. Payments per liter of extra virgin oil bought through regulated channels are aimed to processors. The support provided is 10 HRK/kg (€ 1.35) for extra virgin oil and six HRK/kg (€ 0.81) for virgin oil. Incentives to raise the production of fruit tree orchards are used for the reimbursement of part of the costs of olive saplings. The government subsidizes the procurement of certified olive saplings material (5 HRK/root, € 0.67). The minimum area on which production can be subsidized is 0.1 ha. In addition, different municipalities are running their own support programmes. Many coastal municipalities are supporting the planting of olives. Local authorities are providing subsidies for the procurement of certified planting material, usually by covering up to two thirds of the price of the planting material. The difference is covered by the farmer (21).
Mandarins Sub-sector The last price for the buyout of mandarins set by the government is fixed at 3 HRK/kg (€ 0.4). The buyers of mandarins are awarded with 0.8 HRK/kg (€ 0.10) bought. The interviewed producers state that the subsidy means that the buyout price is reduced to 1.20 HRK (€ 0.16), if the handling costs for cooling, sorting and calibrating is lower than 0.8 HRK (€ 0.10). Therefore, the buyer can sell at the same price as the farmer and in turn compete with the farmer. The recent revision of the support scheme is likely to include the cancelation of this support measure.
4.3.2 Crop insurance participation Farmers can also benefit from the insurance scheme for the production where the ministry participates in the covering of 25% of the insurance costs. In addition, local authorities also participate with an additional 25% of the insurance costs. The subsidized insurance options are occasionally used by the farmers (21). 4.3.3 Fuel at reduced costs Farmers can use benefits of fuel at reduced prices of 40%. From 2013, the currently used diesel will likely be replaced by Euro diesel, as the current fuel does not meet the environmental requirements as it contains sulfur 5,000 ppm (0,5 % m/m). The Euro diesel

165
Regional Rural Development Standing Working Group in SEE
fuels contain up to 10 ppm (mg/kg). The current rule book that regulates this topic will be outdated in 2013, and the alternative solution will have to be identified (21). 4.3.4 Operational development programmes The operational programs are based on credits provided by the HBOR with interest rates of 2 - 4% and repayment timeframes of up to 12 years. Reduced interests of 2% are available for less favorite areas and successful enterprises. For farmers who are unable to obtain sufficient guarantees, the HAMAG acts as a guarantee for the credit. Credits are distributed through the commercial banks. HBOR is usually calculating a 0.4% processing cost for the bank, which can be increased maximally up to 0.8%. Costs for reservation of the funds of 0.25% per annum on approved and unused funds are also added to the total interest rate of the credit. The commercial banks can add more costs than what was calculated by HBOR. The goal of the programme is to support the increase and development of the vegetable and fruit production to meet the domestic consumption. Further aims are to provide for export and prescribe the support measures for the producers. In addition, the programme aims to define the Croatian producer groups in order to comply with the EU regulations to regulate the market and introduce quality criteria for the agricultural products. The operational programmes are valid until 2012, however, limited changes are expected in the forthcoming two year adaptation period. The minimum amount of the credit is 80,000 HRK (€ 10,810), and the maximum is 3,500,000 HRK (€ 472,972). The credits requests are submitted to the local service in addition to the prescribed documents (12). Incentives are given to raise the production of fruit tree orchards in the form of the provision of credits at very favorable conditions. The support is available for the establishment of new orchards as well as the modernization of orchards. A special part of the programme establishes the support for post-harvest operations, cold storages as well as ULO storages. The operational programme distinguishes between:
Complex investments with two or more joint interventions including: o Establishment of new vineyards, olive plantations and orchards, costs for land
preparation, business plan, fertilizing, work costs up to maximum investment of 750,000 HRK (€ 101,351)
o Establishment of nurseries including costs of planting materials and all other incurred costs
Individual investments o Establishment of new or improvement of existing orchards, mechanization including
harvest and post-harvest activities up to 1,200,000 HRK (€ 162,162) including buying of land mechanization, fertilizers, works, irrigation, frost protection , hail protection
4.3.5 Capital investments Registered producers and VAT subscribers can also benefit from subsidies within the capital investments model. Farmers are awarded funds from the state budget for investments, for which a commercial bank has approved a credit or a loan. The maximum participation of the support is up to 25% of the total value of the credit or 20% of the total value of the investment. Acceptable investments are the procurement of live animals, equipment and machines, establishment and adaptation of facilities, establishment of orchards over 0.5 ha and vineyards over 0.23 ha, and all related costs, protection costs and irrigation. Unacceptable costs are the procurement of real estate, used equipment, transport vehicles and construction machinery, taxes, bank fees, private work costs and communal costs. The minimum investment amount is 150,000 HRK (€ 20,270), and the maximum is 10,000,000 HRK (€ 1,351,351). The support is provided on the basis of public competitions by the Ministry of Agriculture (21).

166
Regional Rural Development Standing Working Group in SEE
4.3.6 IPARD IPARD is a pre-accession programme of the EU for the period of 2007 – 2013. The implementation of seven measures has been foreseen within the IPARD Programme and within three priority axes as follows:
Improving market efficiency and implementation of community standards
Preparatory actions for implementation of the agricultural-environmental measures and local rural development strategies
Development of rural economy The IPARD programme includes support under the following measures:
M101 investments in agricultural holdings to restructure and to upgrade to community standards
38
M 103 investments in the processing and marketing of agriculture and fishery products to restructure those activities and to upgrade them to community standards
39
M 301 improvement and development of rural infrastructure;
M 302 diversification and development of rural economic activities The minimum total value of eligible investment per project is limited to € 33,800. The maximum total value of eligible investments per beneficiary within the timeframe of IPARD is limited to € 3,000,000, out of which total investments in the olive sector cannot exceed € 500,000 € (11). 4.3.7. State support and EU accession In 2011 Croatia signed the accession agreement for the EU and has been acting as an observer in the working groups of the EU. Croatia is currently in a process of adapting its agricultural policies to the Common Agricultural Policy (CAP) and Common Fishery policy (CFP) and its support systems are in a state of flux. Most of the agriculture- and rural development-related programmes end in 2013 and new ones are currently being developed. Since 2010, Croatia has been adjusting the system to the current EU framework, addressing the main differences in the agricultural support policy. The most important differences currently addressed are the composition of support which in Croatia is somewhat different when compared to the EU. The reform of agricultural support is carried out both in terms of legislative and institutional changes. The number of support measures has been reduced and mechanisms allowing appropriate planning and budgeting have been introduced. Payments based on area are being introduced, substituting the existing system of payments. The new support system increases the area payments, on account of the production output payments, from 51% to 86% in 2012. The payment mechanisms related to production have also been reduced from 37% to 8%. The EU accession also incurs the requirement for the rapid introduction of cross-compliance measures Good Agricultural Practices (GAP), environment protection mechanisms as well as food safety and animal welfare provisions. This reform is a prerequisite for the introduction of the Single Payment Scheme which will be effective once the country enters the EU. The only exception will be for cows, feeding calves, sheep and goats. In order to meet the criteria for direct payments, the farmers will have to meet certain requirements. For certain areas postponements of the requirements up to 2018 have already been reached.
38
Equipment for primary production and irrigation including mechanization, drip systems and anti-hail netting. 39 Investments in laboratory equipment for chemical analyses of the quality of olive oil, listed in the Annex 3 of the
IPARD programme. Support for equipment to utilize olive pomace, a by-product of the olive processing listed in the Annex 3 of the IPARD programme.
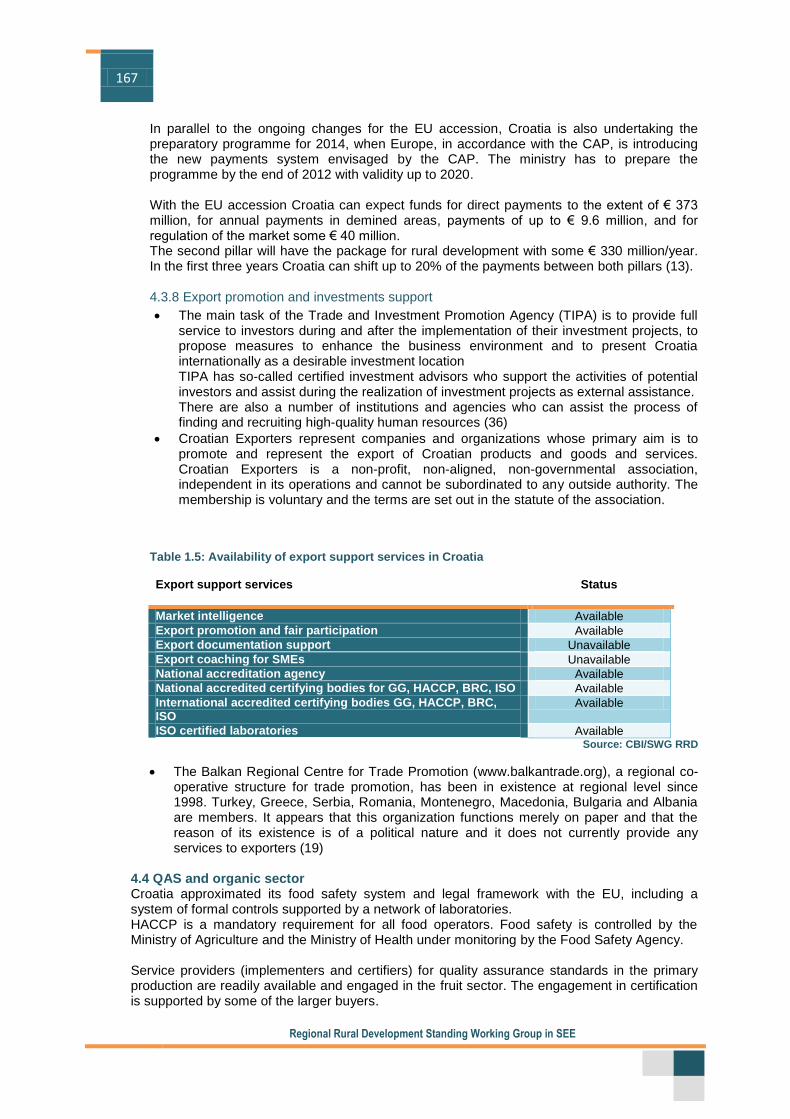
167
Regional Rural Development Standing Working Group in SEE
In parallel to the ongoing changes for the EU accession, Croatia is also undertaking the preparatory programme for 2014, when Europe, in accordance with the CAP, is introducing the new payments system envisaged by the CAP. The ministry has to prepare the programme by the end of 2012 with validity up to 2020. With the EU accession Croatia can expect funds for direct payments to the extent of € 373 million, for annual payments in demined areas, payments of up to € 9.6 million, and for regulation of the market some € 40 million. The second pillar will have the package for rural development with some € 330 million/year. In the first three years Croatia can shift up to 20% of the payments between both pillars (13). 4.3.8 Export promotion and investments support
The main task of the Trade and Investment Promotion Agency (TIPA) is to provide full service to investors during and after the implementation of their investment projects, to propose measures to enhance the business environment and to present Croatia internationally as a desirable investment location TIPA has so-called certified investment advisors who support the activities of potential investors and assist during the realization of investment projects as external assistance. There are also a number of institutions and agencies who can assist the process of finding and recruiting high-quality human resources (36)
Croatian Exporters represent companies and organizations whose primary aim is to promote and represent the export of Croatian products and goods and services. Croatian Exporters is a non-profit, non-aligned, non-governmental association, independent in its operations and cannot be subordinated to any outside authority. The membership is voluntary and the terms are set out in the statute of the association.
Table 1.5: Availability of export support services in Croatia Export support services
Status
Market intelligence Available
Export promotion and fair participation Available
Export documentation support Unavailable
Export coaching for SMEs Unavailable
National accreditation agency Available
National accredited certifying bodies for GG, HACCP, BRC, ISO Available
International accredited certifying bodies GG, HACCP, BRC, ISO
Available
ISO certified laboratories Available Source: CBI/SWG RRD
The Balkan Regional Centre for Trade Promotion (www.balkantrade.org), a regional co-operative structure for trade promotion, has been in existence at regional level since 1998. Turkey, Greece, Serbia, Romania, Montenegro, Macedonia, Bulgaria and Albania are members. It appears that this organization functions merely on paper and that the reason of its existence is of a political nature and it does not currently provide any services to exporters (19)
4.4 QAS and organic sector Croatia approximated its food safety system and legal framework with the EU, including a system of formal controls supported by a network of laboratories. HACCP is a mandatory requirement for all food operators. Food safety is controlled by the Ministry of Agriculture and the Ministry of Health under monitoring by the Food Safety Agency. Service providers (implementers and certifiers) for quality assurance standards in the primary production are readily available and engaged in the fruit sector. The engagement in certification is supported by some of the larger buyers.

168
Regional Rural Development Standing Working Group in SEE
Various producers/processors are implementing additional quality assurance standards, such as the ISO family, BRC and IFS Service providers supporting the implementation and certification of these quality assurance standards are readily available in the country. In this regard, approximately half of the mandarin production is Globalgap certified; however, there are no certificates for the organic production of olives due to limited awareness of the producers and the low demand. The government participates with subsidies on the costs for the implementation and certification of quality assurance, while the local authorities recover up to 50% of the costs for organic standards certification. The institutional and legal framework for the development of an organic production is approximated to that of the EU. The organic label is a guarantee that the product was produced according to the regulations on organic farming. The label is granted for a period of one year or one vegetative cycle and, together with the declaration, it certifies product quality. The label is connected with a system of professional supervision and certification. Table 1.6: Area under organic production in Croatia
Area (ha) 2005 2006 2007 2008 2009 2010 2011
Field crops 2,214 2,957 2,915 2,800 9,766 17,066 22,156
Orchards 84 200.93 574.72 792 1,264 1,770 2,058
Vineyards 30 31.93 74.84 212 191 400 614
Olive groves 26 36.98 82.83 100 228 322 600
Pastures and meadows 740 2,620 3,495 5,603 1,998 2,452 4,943
Fallow land 27 101.80 40.15 100 84 156 452
Forests 60 58 86 82 315 444 352
Vegetables 92 95 68 284 143
Herbs 214 226 279 388 718
Total 3,184 6,008 7,577 10,010 14,193 23,282 32,036
Source: MAFRD
There are 1,670 organic farmers accounting for a total of 2.46% of the arable land or 32,000 ha. Available support for organic farming reaches up to 6,000 HRK/ha (€ 810.80 ) for vegetables and fruits, 4,600 HRK (€ 621.60) for cereals and industrial crops and 1,800 HRK (€ 243.30) for pastures and meadows (4). A significant drawback regarding the market is the fact it is not organized or regulated, largely due to the limited supply and processing opportunities, as well as the lack of information of the consumers. Generally, organic production is sold at 25 - 50% higher costs. With the joining of the EU, Croatia should reach 8% of organic production by 2016. Table 1.7: Areas under integrated production in Croatia
Source: MELE
Under integrated production in Croatia the balanced use of agro-technical measures is defined, aimed at production with a minimum use of pesticides and the protection of the consumers’ interests and the environment. The integrated production is certified by inspection service of the Ministry of Agriculture (10).
Year Area in Ha Number of producers Fruits Vegetables Vineyards Field crops Total
2011. 2,170.47 718.51 2,482.71 66,947.31 72,319.09 547

169
Regional Rural Development Standing Working Group in SEE
5. OVERVIEW OF THE TAXATION IN THE COUNTRY
5.1 Brief overview
Source: MELE
The Croatian tax system was completely revised in 1991 and currently reflects general practice shown in West European countries. The tax system accords equal status to all taxpayers, i.e. domestic and foreign natural persons and legal entities. 5.2 Corporate income tax The following natural persons and legal entities are subject to corporate income tax:
Permanent business establishments of foreign persons, whereby a foreigner is defined as a company or person whose head office or management is not located in Croatia
Commercial entities and legal persons – natural persons who earn profits on commercial activities, professional services, agriculture or other activities that qualify as trade, if they elect to pay corporate income tax instead of personal income tax, and if:
total revenue in the preceding tax period exceeded HRK 2,000,000 (€ 270,270)
total income in the preceding tax period exceeded HRK 400,000 (€ 54,054)
the value of long-term assets exceeds HRK 2.000,000 (€ 270,270)
more than 15 employees on average during the preceding tax period The corporate tax rate is 20%, whereby the taxable base is reduced by dividends and shares in profits that are taxed at 15%. Corporate income tax by withholding is paid by an inland paying agent that pays to foreign entities-recipients; the permanent establishments of a non-resident entrepreneur, when they pay interest to the parent company, as well as royalties and other intellectual property rights. The withholding tax shall be paid for all services paid to persons having their permanent establishment or headquarters in the countries, except for the EU Member States, in which a general or average nominal profit taxation rate is lower than 12.5% and the country is published in the list of countries issued by the finance minister. Tax base is the profit determined pursuant as difference between revenues and expenditures before the profit tax assessment, increased and reduced (9). Corporate income tax by withholding--taxed at 15%--is the gross amount of a consideration paid by a resident payer to a non-resident recipient. Countries with double taxation avoidance agreements: Armenia, Albania, Austria, Belarus, Belgium, Bosnia and Herzegovina, Bulgaria, Canada, Chile, China, Czech Republic, Denmark, Estonia, Finland, France, Germany, Greece, Hungary, Iran, Ireland, Korea, Jordan, Italy, Israel, Kuwait, Latvia, Lithuania, Macedonia, Malaysia, Malta, Mauritius, Moldova, Montenegro, the Netherlands, Norway, Poland, Qatar, Romania, Russia, San Marino, SAR, Serbia, Slovakia, Slovenia, Spain, Sweden, Switzerland, Syria, Turkey, Ukraine and the UK (9). 5.3 Income tax
Tax Tax Rate
Corporate income tax Corporate tax on retained earnings
20% 15%
Personal income tax 12-40%
Value added tax 25% general tax rate 0-10% preferential tax rate
Property taxes
Sales tax on real estate and rights 5%
Inheritance and gifts tax Up to 5%

170
Regional Rural Development Standing Working Group in SEE
All natural Croatian and foreign persons who earn income in Croatia are subject to this tax. The deductible allowance has equaled HRK 1.800 (approx. € 243) since 1 July 2008.
Monthly tax base Annual tax base Tax rates
Up to HRK 2,200 (€ 297) Up to HRK 26.400 (€ 3,567,5) 12%
Over HRK 2,200 up to 8,800 Over HRK 26,400 up to HRK 105,600 25%
Over HRK 8,800 (€ 1,189 ) Over HRK 105,600 (€ 14,270) 40%
Source: MELE
A tax payer is a Croatian resident that has acquired income in the country or abroad. Other tax payers are non-residents that have acquired income in Croatia. The tax base of a resident as well as of a non-resident is the total amount of income that the taxpayer obtains in the Republic of Croatia - personal allowances. Other types of income, such as income earned from membership to corporate bodies, are subject to withholding tax at a rate of 25%. Surtax on income tax is applied to those liable to pay income tax with a domicile or a common residence in the area of the city/municipality that has prescribed the obligation to pay the tax. The taxable base is the amount of income tax and the tax rate is:
A municipality at the rate of up to 10%
A city with a population below 30,000 at a rate of up to 12%
A city with a population over 30,000 at a rate of up to 15%
The city of Zagreb at a rate of up to 30% (9). 5.4 Tax on sales of real estate The seller is liable for tax at a rate of 5% of the sale price for real estate that was built before 31 December 1997. Buildings constructed after this date are subject to VAT (22%), if the transaction is for commercial purposes. A tax of 1 to 5% is charged on the rezoning of agricultural land for building purposes which is based on the average value of development sites. The taxable base is the market value of a real estate at the moment when the tax liability is incurred. The subject of taxation is the transfer of real estate (9). 5.5 Value-added tax Natural persons or legal entities who/which provide goods or services are required to pay VAT over the turnover limit of HRK 85,000 (€ 11,486). The EU VAT guideline was implemented in Croatia and resulted in the elimination of tax exemptions for financial service companies. The submission of original invoices and authentication of the seller are not required for VAT reimbursement. Tax rates of 0%, 10% or 25% are also applied for selected products/services. VAT shall be paid at a rate of 0% on:
All kinds of baked bread
All kinds of milk for sale in liquid state, fresh, pasteurized, homogenized, condensed (apart from soured milk, yoghurt, kefir, chocolate milk and other products), milk substitutes
Books with contents that are professional, scientific, artistic, cultural and educational, textbooks for education, printed on paper or other media
Medicines determined by the List of Medicines of the Croatian Institute for Health Insurance
Products surgically implanted into the human body – implants and other medical products for treating physical impairment
VAT shall be paid at a rate of 10% on:
Services of accommodation or accommodation with breakfast, full or half board in all kinds of commercial hospitality facilities and on services of agency commission for these services
Services of preparing food and restaurant services, preparing and serving non-alcoholic drinks and beverages and wine and beer in such premises in accordance with legislations
Daily and periodic newspapers and magazines printed on paper with the exception of those that, in their entirety or mainly, contain advertisements or serve for advertising purposes

171
Regional Rural Development Standing Working Group in SEE
Oil and fats for human consumption, of either vegetable or animal origin
Baby food and processed grain food for infants and small children
Water, with the exception of water marketed in bottles or any other packaging
White sugar produced from sugar cane or sugar beet VAT shall be paid at a rate of 25% on taxable base of supplies of all other taxable goods and services. The right to the tax refund is granted to taxpayers with a domestic place of taxation, who have not engaged in supplies of goods and services during the period they claim the tax refund for, with the exception of transport and transport-related services exempted from VAT, in connection with the import, transit or export of goods, and services subject to the calculation and payment of tax by a domestic recipient (9).
5.6 Sub-sectors taxation details Croatia is applying a value-added tax (VAT) of 25% for most agricultural goods, provided that the seller is registered (most of the individual producers are not) as a VAT subscriber or the produce is not exported. In the case when the seller is not registered as a VAT subscriber, VAT is not calculated. Unregistered VAT suppliers have no right to claim paid VAT on production inputs, including diesel. The vast majority of individual producers do not find it feasible to be VAT subscribers. Individual farmers pay approximately 12-20% of personal income tax on registered income depending on the annual turnover. Farmers also pay some 25% of taxes on the amount paid to the seasonal workers.
II SUB-SECTOR – MANDARINS
1. DETAILED ASSESSMENT OF THE SUB-SECTOR 1.1 Production of mandarins In Croatia some 50,000 ha are covered with fruit trees predominantly cultivated by private smallholders. In terms of land surface, mandarins account for some 17% of the fruit production, second only to the apple production. Intensive mandarin production also accounts for 6% of the total intensive orchards in Croatia. The mandarins were introduced in the country in 1933 from Japan, and ever since their quantity has slowly increased. The development of the commercial production dates to the 1950s with the first organized plantation and distribution to individual farmers. The real expansion started in the 1970s in individual households with the introduction of the early variety Kawano wase, moving the harvest period 20 days earlier than usual. Since 1980, further expansion in Dalmatia and the islands is noted, with an introduction of varieties for the extension of the harvest season. Due to the political situation in the 1990s, the orchards suffered some neglect, only to be in the focus once again in independent Croatia. The production of mandarins has been significantly increasing in the last decade due to the high returns on the investments, despite the long waiting periods (six - eight years) from planting to full productivity. Mandarins in the world are cultivated between 20° and 40° northern and southern latitude, yet due to the warm Adriatic currents in Croatia, they are produced between 42° and 44° northern latitude. Mandarin production is possible in a few parts of the Adriatic coast, in the following agro- ecological areas: the municipality of Dubrovnik, the Neretva valley, the coast of Split, the Losinj-Zadar group of islands and the west coast of Istra (2). The total area where mandarins can be produced accounts for 54,894 ha of arable land with different soil qualities. The largest production is located in the Neretva valley (some 90% of the total production) due to the significantly lower risk of frost damages, in addition to the lack of quality soil or irrigation water in other areas. Smaller commercial cultivars are found on the islands of Brac and Vis. It is important to underline that different citrus varieties, as well as the grape and olive production, compete for the same production areas. Mandarin production is carried out on some 2,000 ha, belonging to some 1,500 farmers.

172
Regional Rural Development Standing Working Group in SEE
Table 2.1: Area harvested under fruits
Crop 2006 2007 2008 2009 2010
Area (ha)
Apples 5 863 5 993 6 404 6515 6 932
Pears 1 371 1 396 1 484 1 504 1 853 Peaches 1 081 1 098 1 225 1 291 1 899
Apricots 266 270 314 335 409
Cherries 2 144 2 325 3 266 3 502 4 067
Sweet cherries 696 698 836 847 950
Sour cherries 1 447 1 627 2 430 2 655 3117 Plums 4 225 4 375 4 754 4 882 6 563 Walnuts 6 197 6 327 6 945 7 062 7 025 Hazelnuts 978 1 246 1 877 1 918 2 391 Figs 376 378 394 389 432 Strawberries 269 128 167 166 220 Oranges 146 158 159 160 66 Mandarins 1 188 1 201 1 213 1 223 1 983
Olives 13 363 14 346 14 971 15 304 17000
Source: Croatian Bureau of Statistics Graph 2.1: Mandarin production in Croatia (in tons)
Source: FAOSTAT Table 2.2: Mandarin production in Croatia (in tons)
2006 2007 2008 2009 2010
42,120 43,139 50,138 37,500 55,486
Source: Croatian Bureau of Statistics
The total production of mandarins has been increasing in the last decade. The average yield is 34 tons/ha, although climatic conditions (droughts, storms and hail) have contributed to significant variations of the yields (up to 20,000 tons) (15).
Table 2.3: Mandarin yields/ha
2006 2007 2008 2009 2010
34.7 34.7 39.8 29.4 27.7
Source: Croatian Bureau of Statistics

173
Regional Rural Development Standing Working Group in SEE
In total it is estimated that some 1,800,000 trees are planted, out of which an estimated 500,000 have been planted in the last few years. These new plantations are gradually yielding, thus continually increasing the total output (2). Croatia is ranked at 22 in the world based on mandarin production. On the basis of the continuous investments, it is estimated that some 100,000 tons of fruits will be available from the currently planted trees in a few years. The vast majority of the production is carried out on commercial farms, as shown in the table below (15).
Table 2.4: Production by commercial farmers in intensive grown orchards
2006 2007 2008 2009 2010
41,201 41,655 48,297 35,907 55,000
Source: Croatian Bureau of Statistics
The technical level of production is relatively advanced, however, due to the investments costs, drip irrigation and anti-hail protection are rarely present in the fields. The extensive production accounts for up to 10% of the total production, mainly destined for home consumption and sales at green markets.
Table 2.5: Production in extensive orchards by subsistence farmers
2006 2007 2008 2009 2010
919 1,484 1,841 1,593 486
Source: Croatian Bureau of Statistics
A total of 17 varieties of mandarins are grown in Croatia, offering a relatively even distribution of fruits for some two months. Late varieties are less present, offering less production from November to January. Varieties planted include:
Very early varieties (Ichimaru, Wakiyama, Ueno, Zorica, Chahara) with 125-145 days from blossoming to harvest; harvested in September and October
Early varieties (Okitshu, Miho, Kavano, Miyagawa) with 150-160 days from blossoming to harvest; harvested in October
Mid-season varieties (Haraguchi and Saygon) with 170 days from blossoming to the harvest in November;
Late varieties (Owari and Ootsu 4) with 190 days from blossoming to the harvest in November and December;
Very late variety (Aoshima) with 190 days from blossoming to the harvest in December and January (2).
In the composition of the intensive plantations, the most present varieties are the Kavano wase (34,6%), Chahara (21,4%), Zorica rana (15,5%) and Unshiu owari (14,6%) (2). Most mandarins are produced on the rootstock of Poncirus trifoliata due to the higher resistance to freezing. Most of the mandarins including the rootstock plantations are infected by viruses and/or virus type organisms. A predominant strain is the Citrus tristeza virus which is one of the most dangerous diseases in citruses. The affected plots can be treated and the treatments have resulted in 25 varieties of citruses (mandarins, lemons, oranges and grapefruits) without the viral infection within a rootstock in the Institute for Adriatic crops in Split (2). The density of the planting and the age structure are shown in the table below. There is a significant portion of plantations with low density, accounting for the low average yield (2).

174
Regional Rural Development Standing Working Group in SEE
Table 2.6: Age structure of mandarin orchards Table 2.7: Net area by planting density
Source: Croatian Bureau of Statistics
In the age structure of the intensive plantations, 26% are younger than ten years, 50% are between ten and 25 years, while 24% are older than 25 years, indicating a relatively balanced age structure of the mandarins (2). 1.2 Trade Croatia has a negative trade balance of fruits importing some ten times more fruits than it produces. Croatia only produces sufficient quantities (for its own consumption needs) of mandarins and, recently, strawberries (6). Croatia imports citrus fruits from Spain and Greece and smaller amounts from Turkey, Argentina, Egypt, South Africa and Italy. Mandarins are imported in very small quantities on occasions when the local production has been consumed. The imports are showing decreasing trends. Some 15,000 tons of mandarins are consumed in Croatia, or some 2 kg/inhabitant/year. The quantity consumed locally is small for investing in cool storing of the mandarins for the Croatian market. On average, the mandarins are eaten by the end of the year and are scarce afterwards. In general, mandarins are stored for up to three months although they are storable for up to six - eight months.
The harvest begins in September, somewhat earlier than the main competitors, and lasts for approximately three months. This is a comparative advantage for the sector. Most of the mandarins are harvested in September and early October and exported by the end of October. Smaller quantities are exported in November and as shown below, negligible quantities are exported in December. This implies that little value is added through storing of the production. Croatia exports up to 41,000 tons of mandarins, valued up to € 20.7 million. The mandarins are exported mainly in CEFTA countries, Russia and in smaller quantities to the EU. During the tourist season mandarins are sold on the roads for 20 - 25 HRK (€ 2.7-3.37) for packets of 5 kg.
Age of orchards (years) Mandarin (ha)
0-4 123,1
5-9 198,4
10-14 268,7
15-24 344,0
20 and more -
25 and more -
25-39 270,3
40 and more 19,5
Number of trees/ha Mandarin (ha)
less than 249 - 250-499 34,1
500 - 749 86,1
750-999 355,7
1,000- 1,499 489,6
1,500-1,999 142,6
2,000-2,499 50,6
2,500-2,999 41,8
3,000 and more 22,9

175
Regional Rural Development Standing Working Group in SEE
Graph 2.2: Monthly exports of mandarins
Source: ITC calculations based on UN COMTRADE statistics
The buyout and export of mandarins is highly regulated by the government. Companies involved in the buyout do not compete with the price. The farm gate price goes up to 4 HRK (€ 0.54), although the average is at some 3.3 HRK/kg (€ 0.4). The mandarins are exported at € 0.55-0.6 /kg or € 2 - 4 per crate (21). The average farm gate prices of mandarins in the last decade ranged between 2.39 HRK/kg (€ 0.32) (2006) and 4.63 HRK/kg (€ 0.62) (2005). The highest price in the gross markets was recorded in February and March (8.50 – 12.8 HRK/kg (€ 1.14 – 1.72)), while the lowest price is recorded in November and December (3.59 – 6.03 HRK/kg (€ 0.48 – 0.81)). In the retail trade the highest price was recorded in March (11.99 HRK/kg (€ 1.62)), while the lowest price was recorded in November (5,04 HRK/kg (€ 0.68)) (2). The interviewed producers consider that the buyout prices are slowly growing while the production costs have increased by 150%. Table 2.8: List of importing markets for fresh mandarins exported by Croatia
Importers Exported value
2002 2003 2004 2005 2006 2007 2008 2009 2010 2011
World 1403 1488 6173 1311 10045 14257 19646 17578 27046 16299
Serbia 168 52 884 85 2940 6176 7701 6230 7856 4671
Russia 0 0 0 0 0 0 74 791 4104 3659
Slovenia 1098 1369 2773 861 3509 3724 4254 4502 4862 2947
BiH 123 54 1653 340 2655 2424 3972 3323 3723 1950
Czech Rep.
0 0 451 0 667 549 1423 296 2753 885
Slovakia 0 0 125 0 183 779 727 1344 1445 883
UK 0 0 0 0 0 0 511 515 999 636
Macedonia 1 0 42 0 32 0 51 94 239 286
Austria 0 0 2 12 0 345 349 90 295 241
Germany 0 0 0 0 4 0 17 0 256 38

176
Regional Rural Development Standing Working Group in SEE
Importers 2002 2003 2004 2005 2006 2007 2008 2009 2010 2011
Exported quantity, tons
World 2377 1843 13447 1962 20844 20417 32035 22866 41441 22788
Serbia 0 0 0 0 5577 8367 11533 7556 11673 5788
BiH 332 73 4798 780 7529 4995 10081 6582 9819 5323
Russia 0 0 0 0 0 0 112 1086 6507 5242
Slovenia 1785 1692 5145 1018 6127 4719 5672 4680 5806 3099
Slovakia 0 0 234 0 312 992 1001 1544 1835 1022
Czech Rep. 0 0 862 0 1132 633 1752 305 3212 921
UK 0 0 0 0 0 0 591 496 1092 605
Macedonia 1 0 88 0 76 0 78 115 332 375
Austria 0 0 3 17 0 414 436 95 311 252
Germany 0 0 0 0 7 0 19 0 237 37 Source: ITC calculations based on UN COMTRADE statistics
2. SUPPLY CHAIN DESCRIPTION A schematic of the supply chain and parties who directly support or have an effect on the performance of the chains is depicted below.
Source: SWG 2.1 Supply chain participants
2.1.1 Regulators of the supply chain The government regulates all aspects of the market, including: 1) minimum buyout prices 2) selection of buyers for buyout and resale 3) ensuring that produce is in accordance to the prescribed quality criteria 4) seasonal workers inclusion. Public competitions for support for buyout of mandarins are announced by the Ministry of Agriculture as part of the market regulation system, aiming to eliminate the gray trade and protect the producers, as well as to brand the product. The government co-finances the costs for buyout, post-harvest activities and storing, under the condition that buyers cover at least the minimum prescribed price of mandarins. The government also prescribes the quota of subsidized trade, currently set at 55,000 tons or the entire production. Applications are submitted by resident legal entities to the payment agency. The ministry is signing contracts with the selected buyers for allocation of subsidies on the basis of procured and paid kilograms of fruit. The state prescribes the amount of support as well as the minimum buyout price, calculated on the basis of the estimated production costs.
Supply chain role-players
Banks and lenders
Ministries and Payment Agency
Retail input shops
Horizontal associations and organizations
Insurance agents
Certification bodies
Government inspections
Export and business promoters

177
Regional Rural Development Standing Working Group in SEE
The buyers are obliged to have paid the full value of the fruits prior applying to the ministry for the support.
Source: SWG
The provision of support was flexible and has changed in the last few years. In 2010, the government prescribed a lower buyout price and lower co-financing of costs for some 6,000 tons of fruits of lesser quality. The prescribed price is subject to periodic revisions, including increases of up to 30% evident in the last few years. Most farmers and buyers are content with the system in place. The public competitions are a subject of constant debate, as a legal entity with the status of an individual craftsman cannot participate in the tender. This is limiting the possibilities of farmer organizations to evenly compete. Yet in the public competition for grapes such craftsmen are allowed to compete. The traded mandarins are subject to 23% of VAT on weight. The programme provides support to the extent of some 36 million HRK (€ 4,86 million) in subsidies. With rulebooks on fruit quality, the government prescribes the market quality standards and models of control and inspections. The rulebooks apply to mandarins of the following varieties: Citrus unshiu Marcow, Citrus clementina Hort. ex Tan, Citrus deliciosa Ten., Citrus tangerina Hort. ex Tan. and their hybrids. They define the requirements of mandarins packed for marketing, including sizes, quality, marking as well as allowed variations. In this manner the government aims to regulate standards affecting the image of the product on the market. Agricultural inspectors control the harvest and prevent/penalize marketing of green mandarins ripened in special chambers. Such mandarins fetch a higher price but are also undermining the market. The government can confiscate fruits that do not meet the prescribed quality in terms of sugar and acidic content. The rulebook on fruit producer organizations prescribes the conditions for their recognition and submission of their plans. The rulebooks on support for producer organizations prescribe the types of support for financing of operational funds and programmes of the POs.

178
Regional Rural Development Standing Working Group in SEE
2.1.2 Agriculture input suppliers The input suppliers can generally be divided into wholesalers and retailers. Wholesalers are often producers/packers/importers of different agricultural inputs. They rely on a network of agricultural pharmacies for retail of inputs to the producers. Some wholesalers are involved in retail operations, while some retailers are involved in import operations. Certain buyout traders from their own retail shops (agricultural pharmacies) are crediting the producers with agricultural inputs to be paid after the harvest, however, these are increased prices compared to inputs paid in cash. Croatia in general produces its own planting material for mandarins (78,000 saplings in 2010) representing 1.64 % of the total sapling production. Depending on the year, the production in the last decade has oscillated between 37,000 and 96,000 saplings. There are eight nurseries with rootstocks selling saplings produced from a total of 585 rootstock trees. All of the saplings are sold on the local market through nurseries, fairs, retail suppliers and agricultural pharmacies. The prices of saplings on the local market have remained relatively stable despite the growing demand; prices ranged between 21.4 (2008) and 27.79 HRK (2010). In the period of 2009/2010, a total of 2,500 mandarin saplings were imported (2). 2.1.3 Producers The mandarin production is carried out on largely small plots averaging approximately 1 ha, however, there are plantations of up to 5 ha as well as subsistence farmers. Table 2.9: Production sizes of mandarin production plots
Source: Croatian Bureau of Statistics
In the Dubrovnik–Neretva municipality there are some 7,200 farming units, out of which 6,437 are farming households further divided into one half commercial farmers and one half subsistence farmers. In total, more than 15,300 residents are involved in mandarin production. Out of which 77,3% cultivate less than 1 ha of land. Several legal entities have ventured into mandarin production. In the Dubrovnik–Neretva municipality the age structure is similar to the national average of some 18% of residents being older than 65. However, like all rural areas, there are trends for the migration of young people. The unemployment rate is not significantly different than in urban areas. The number of residents relying on salaries (29%) is lower compared to urban areas (37%), due to the seasonal employment opportunities in tourism and agriculture (2). The number of small farmers with less than 3 ha is significantly higher (5,196 households) than the national average, while the average size of the arable land per household is 0.9 ha, on average divided into 4.4 plots. Reinvestments in the modernization or enlargement of the production are limited as producers prefer to develop slowly rather than to borrow and invest. In many cases the ownership of the land is not resolved, preventing further investments.
Utilized agricultural land (ha) Number of agricultural households Share (%)
Up to 0,10 2,351 15,3 0,11-0,50 7,123 46,4
0,51-1,00 2,386 15,6
1,01-2,00 1,722 11,2
2,01-3,00 740 4,8
3,01-5,00 475 3,1
5,01-10,00 355 2,3
10,01-20,00 140 0,9
More than 20,00 52 0,3
Total 15,344 100,0

179
Regional Rural Development Standing Working Group in SEE
10% of the farmers insure their production as the majority see it as economically unfeasible
to do so. 70% of farmers own a tractor to be on average 20 years-old, while 20% have
access to irrigation. 5 % have additional mechanization.
The main criteria for making decisions on where to sell the produce are the security of payments and the agreed quality and price. Next is the pre-harvest crediting with inputs, variety and so on. The large producers are heavily dependent on the seasonal workforce for the harvest. Strict labor laws were making it hard for mandarin growers to find pickers. The lack of labor has been supplied by workers (Croatian citizens) from Bosnia and Herzegovina. Unemployed Croatians were not interested in the job, as if they are caught by frequent enforcements; they will lose the unemployment or welfare benefits. This has changed since the legalization of seasonal work in 2012. The new law stipulates that everyone working in the orchards must be reported to the pension and the health insurance authorities. If a farmer needs 100 workers he will need to buy 100 tickets at a cost of 20.9 HRK (€ 2.82), which will cover the contribution for the retirement and health fund. In addition, farmers will be required to buy contracts with attendance records at 3 HRK (€ 0,4) and distribute them to the workers. The longest seasonal contract will be for 90 days. The contracts have 30 pages and on each page three tickets of 20.9 HRK (€ 2.82) can be added at the start of each day. The worker will be obliged to have the contract on his/her person in case of government controls. Registered unemployed persons can also work without risk of being deleted from the list and losing their benefits. Unemployed people and retirees will also be able to work, apart from minors and those employed. The working day will be limited to 6-12 hours with a 30 minutes break, and 12 hours of rest within a 24 hour period. The Ministry of Labor has decided that the lowest pay for a seasonal worker will be a minimum of 70.40 HRK/day (€ 9.51). The levies for the pickers account for an additional 25% to the wages paid to the pickers. Bosnian Croats can freely enter the country and benefit from the relatively high fees. A picker can earn between 200 and 300 HRK (€ 27 and 40) per day. Illegal pickers could also be banned from re-entering the country next year. Certain farmers have introduced new methods by attracting tourists to participate in the mandarin harvest for a day or two. They can take tours of the mandarin harvest and participate in the harvest
40.
The organization of the Croatian mandarin producers needs to be improved. In particular support for joining in a single sales point for easier marketing and access to the EU support funds.
2.1.4 Buyout traders/exporters The buyers are companies licensed by the government to perform the buyout of mandarins. The minimum quantities for buyout were revised from 1,000 to 500 tons in order to allow smaller companies to participate in the competitions. In general, there are seven large buyers of mandarins and six smaller ones that are usually awarded with subsidized contracts (Agrofructus, Jesenska, Vagros, Pasko Trafe, Frigo Bonsai and Mandarinko). The largest buyer is Agrofructus, a subsidiary of Agrocor, a well-known agriculture and food giant in Croatia. Agrofructus accounts for approximately half of the total production (25,000 tons) through a repurchase center in Opruzen, and for 18,000 tons of exports. The post-harvest processing of 35 tons/hour of mandarins is possible, in addition to the storing capacity of 50,000 tons (11,000 m
2 of which 6,000 m
2 is refrigerated). The company works
with some 850 subcontractors. The buyout companies are often using credits from the commercial banks for turnover capital, while at the same time they are crediting the end buyers with delayed payments ranging from 30-90 days.
40
http://www.mps.hr/ipard/default.aspx?id=79

180
Regional Rural Development Standing Working Group in SEE
2.2 Current constraints and limitations The major constraints on the key actors in the sector are explained below. Fragmentation and small surface area covered by the average orchard is an obstacle to raising competitiveness through reducing production costs and increasing incomes. In addition, the increasing demand is likely to increase the land prices for small farmers willing to expand. Although land can be rented from individuals, it is difficult to gather a significant area and therefore few ventures exist in multiannual crops on rented land. Disputes around improper distribution of the state-owned land have plagued the mandarin and the olive sectors in the last few years. This is mostly on account of the local authorities who are responsible for the leasing and selling of the land. The income generated by leasing state-owned land significantly contributed to the municipality’s income.
41
Although in some cases land was given on short-term concession, the new owners have planted mandarins which are a multi-annual crop. In accordance to the law a concession of 30 years is a prerequisite for multiannual crops. This means that many inconsistencies occurred in the practices of the local authorities. Due to these developments the government announced in 2012 that further sales of state-owned land by the municipalities will be prohibited. The introduction of technologies, such as drip irrigation and anti-hail nets for mandarins and olives, is developing; however, there is still a relatively small percentage of the total area covered. The Neretva valley has been facing increasing salinization from contamination of the irrigation water with sea water, resulting in decreased yields and long-term damage. The salinization contributes to frost damage in winter. The Ministry of Agriculture has prepared a concept which calls for the erection of a dam (envisaged as a mobile structure) which will be elevated during high tides, preventing contamination of the fresh waters in the delta. At present (2012) there is no funding available for the finalization of the plan and the local authorities lack the capacity to apply for EU funding. There are little or no efforts by the mandarin producers to join and sell their produce jointly and capitalize on the government subsidies. The establishment of producer organizations is a highly debated topic but it is still in development. Part of the reluctance is connected to the negative experience from Slovenia where producer organizations were closed due to inconsistencies after the intervention of the EU Commission. The main inconsistency was that farmers were not documenting what was done and did not submit three year plans. Many farmers in Croatia are also unable to document their financial transactions, sparking fears of a possible repetition of the scenario. A shortage of the workforce is being addressed by the government, however, this is at increased costs for the producers. In 2012, the proposed model was to be tested (see chapter 2.1.3).
41
The municipality of Dubrovnik-Neretva, for instance, reports that 5.782 ha state owned land out of which 2,871
ha is destined to be sold, 1,652 is for long term lease and 819 for short term lease, while 361 ha will be denationalized to the previous owners, while 78 will be used for infrastructure.

181
Regional Rural Development Standing Working Group in SEE
2.3 Solutions for the identified constraints and limitations A mix of interventions at farmer, industry and sector level are feasible and are presented below. Special attention should be given to sustainable solutions in light of the EU accession. The table below lists the compounded constraints and limitations and ways to address them, as identified by the role players of the sub-sector.
3. SWOT ANALYSIS
The following sub-chapters illustrate a SWOT analysis, based on the assessment of the sector and taking into account the ultimate goal of preparing the sector for participation on the EU market,
3.1 Primary production
3.1.1 Strengths
The government is supporting the establishment of new, the maintenance of existing and
the renewal of old plantations
Demand from Russian market is rapidly growing in value and quantity
The number of trees of productive age is high
Citrus-growing tradition
Favorable agro-ecological conditions for the production of organic mandarins
Exports of most of the mandarin production
Proximity of export markets
Efficient system of mandarin fruit purchase
High interest of farmers for investments in citrus growing 3.1.2 Weaknesses
Fragmented production with high costs and low technology improvement possibilities
Old plantations with medium productivity need renewal
Tree density is relatively low
Education in both general and organic agriculture is insufficient
Yield oscillation
Failure to maintain the existing agro-melioration system in the lower Neretva river where there are most of the production areas
Constraints Why does this prohibit development
How can this problem be solved
Lack of modern technology
Limited yields
Study tours to producers Study tours to agriculture technology fairs
Lack of modern production knowledge
Limited productivity Limited diversification of products
Organize study tours to foreign producers and post-harvest, storing and packing centers Assistance with harvesting issues, proper harvesting techniques, correct timing for optimum storability and sustained quality
Lack of organic products
Limited access to organic markets Reduced prices
Support producers/processors in getting certified in organic production Work with organic associations to educate local producers on organic markets
Lack of seasonal workforce
Increased costs for the producers Inability to expand production
Appropriate motivation of the local population and potentially interested subgroups (students, welfare beneficiaries, residents of poorer municipalities) etc.
Lack of associations and integrated approach
Farmers are unable to organize producer groups and venture into direct sales of their produce
Development of prerequisites needed for producer organizations

182
Regional Rural Development Standing Working Group in SEE
Inappropriate level of managing and marketing knowledge shown by citrus growers 3.1.3 Opportunities
Possibility to lease/buy state-owned agricultural land
The demand is increasing at seasonal markets with little demand for continuity of supply
New plantations using modern practices resulting in improved quality and yields
Growing methods/irrigation systems and anti-hail nets can increase the quantity and the quality of fruit produced
Integration of producer organizations in the buyout and incorporation of functions like post-harvest handling, storage, and packaging
Expansion of product assortment with very early cultivars of mandarin 3.1.4 Threats
The anticipated growth of the average wages of seasonal workers and taxes in the coming years will put pressure on growers to improve yields and productivity and decrease production costs
Depopulation and aging in rural areas (leading to regional labor shortages)
Farms cannot develop to the level of international competiveness due to limited support and investments
Further land fragmentation
Natural calamities and climate change affecting the production more severely
Harmonization with prescribed specific market standards for citrus fruits
Harmonization of agriculture legislation with the EU agriculture legislation will reduce the level of subsidies to farmers
Pressure from cheap imported substitutes
limited possibility of land consolidation
The global economic crisis impact on the trade of mandarins 4. COMPARATIVE ADVANTAGES
Limited or no competitors in the CEFTA region
The average farmer is experienced and willing to invest in agriculture
Both the government and the crediting system are available and are supporting the sector
The low average wages on national level contribute to the low cost of the produce, while further mechanization can reduce the harvest and maintenance costs
Earlier harvest compared to most of the competitors
5. INVESTMENT POTENTIALS Domestic investors from the sector comprise of farmers, farming co-operatives, traders including exporters and importers as well as other role players connected with the sector. The Croatian government is committed to supporting the improvement of the production and export. The subsidy system is adapted to this long term goal and mandarins are at the forefront. The government has managed to attract investments accounting for 50% of the planned mandarin plantation through subsidies implemented by the Fruit operational programme. Investment in primary agricultural production is limited for large plantations due to the fragmentation and private ownership of land. However, the investment potential is significant as there is sufficient land area for a significant increase in the production. Local farmers have shown interest in further investment in the mandarin production as long as the market is appropriately regulated. In addition, they have demonstrated that they are able to profitably operate even on fragmented plots. Larger investments are feasible mainly on state-owned land or in co-operation with entities already leasing state land. State-owned land is provided to investors through public competitions (on lease for up to 50 years).

183
Regional Rural Development Standing Working Group in SEE
Due to the long period between planting and harvest, investments in primary production are effective in the medium- and long-term. On the other hand, modernizing the production can significantly increase the productivity and profitability of the existing plantations. Investments in the buyout and trade sector is preconditioned with the award of appropriate licenses on public competitions, organized annually by the Ministry of Agriculture or as joint ventures with companies already involved in the buyout. With the prospect of double output in the next few years, there is room for the involvement of more role players. Storing beyond the harvest season is feasible only for domestic and CEFTA markets as the currently available quantities are not sufficient for a significant penetration on the larger markets. This is especially true, taking into account the main comparative advantages of Croatia and the increasing competition from countries leading the mandarin sector, such as China, Argentina, Pakistan, Peru, Chile and South Africa, which meet criteria for the storing and shipping of mandarins to the global markets.
6. MARKET OPPORTUNITIES There is a good outlook for the Croatian mandarins both in the neighboring (CEFTA countries) as well as the EU markets and Russia. The comparative advantage of ripening some two to three weeks earlier than most of the competitors ensures market opportunities in spite of the booming (world and European) mandarin production and exports. Croatia is already present on the Russian market which is the largest import market in the world. This market can easily absorb the whole quantity of Croatian mandarins. In addition, the comparative advantage and the proximity are attractive for the second, third and fourth largest markets (Germany, France and the UK). The traditional CEFTA markets are attractive for the later varieties of mandarins as they do not distinguish much between varieties; however, they have limited purchase power for premium prices for the early production. They are expected to stagnate in their quantity demand but could provide a very important market diversification (including lower classes of fruits).
Graph 2.3: List of importers for fresh mandarins in 2011
Source: ITC calculations based on UN COMTRADE statistics
With the increase of its supply, Croatia will need to invest more into adding value through storage, in order to offer a longer (more than two months) supply in the markets.

184
Regional Rural Development Standing Working Group in SEE
Graph 2.4: Prospects for market diversification for fresh mandarins exported by Croatia
Source: ITC calculations based on UN COMTRADE statistics
Croatia’s mandarins are sold at a cheaper price compared to Spanish and Moroccan mandarins, and a similar price as Italian and Turkish produce but more expensive than Greek mandarins. Some 35% of the mandarins (Russian and Bosnia and Herzegovina markets) are sold below the average price. On the other markets Croatian mandarins reach relatively high prices. This is especially evident if we remove the share of exports to Bosnia and Herzegovina, where Croatia exports at less than half of the price compared to the Russian market, and at a third of the price compared to the EU markets. Both the CEFTA and CIS markets may offer diversification alternatives to the EU market. The ample markets provide sufficient room for the growth of the sub-sector. 6.1 Main competitors Croatian mandarins become available in the market in mid September, some two weeks earlier compared to the main competitors. Spain is reaching the peak of exports in December (Christmas) and their export season of stored mandarins lasts up to May. The quality of Spanish mandarins is not constant after the rain season in November. Regarding this matter, supermarkets shift their preference from clementine to clemenvile. Spanish mandarins are sold mainly to EU countries (Germany, UK, France, Poland etc.). The available quantity of Spanish mandarins has been slowly increasing in the last decade. Italian mandarins have similar seasonal availability and destinations to the Spanish production. However, Italy has significantly increased its export quantity in the last decade.
Turkey’s mandarins are also available later in the year, from October onwards. They overlap in season with the Spanish mandarins, however, they are of different varieties. Buyers in Germany, the Netherlands and Austria tend to incline towards the more expensive Turkish Unshiu mandarin (satsuma) without seeds and easily pealed rather than the clementine. The Turkish mandarins and Croatian mandarins share the property of being easily peeled. Turkish mandarins are mostly sold to Russia (almost half of the production), to CEFTA countries, Ukraine, Iraq and Saudi Arabia. Turkey’s production and export over the last decade is soaring. Greek mandarins are available from October. The export quantity has been rapidly growing in the last decade. The quantities are exported to the wider region (Romania, Albania, Bulgaria, Serbia, Macedonia etc.) and the EU. Moroccan mandarins are of good quality and competitive to the Croatian mandarins both in terms of quality and season (September - April). Almost half of the Moroccan production is destined for the Russian market. In addition, large quantities are sold in the Netherlands,

185
Regional Rural Development Standing Working Group in SEE
Canada and USA (growing trend) and France (stagnating trend). Morocco has almost doubled its exports of mandarins in the last few years. Graph 2.5 List of exporters of fresh mandarins in 2011
Source: ITC calculations based on UN COMTRADE statistics
7. SUB-SECTOR GROWTH POTENTIAL
7.1 Size and productivity The increase of the total area under mandarins in the last decade indicates an increased interest for investments. However, the Croatian production has been plagued with difficulties related to the climate, soil and applied technology, leading to oscillations in the quality and quantity of the produce for many years. Growth opportunities are available on the level of producers, beyond the self-organization for maximization of income. The average yields of Croatia (55,486 Hg/Ha), according to the FAO statistics, are almost at the bottom of the mandarin producing countries. The yields are somewhat lower compared to Italy, significantly lower compared to Greece and Albania, and much lower compared to the leading countries and competitors (Morocco, Spain and Turkey). The low yields/ha are mainly a result of the low density of planting in the orchards and the lack of irrigation. These arguments point to further growth possibilities through an improvement of the technology of production and especially the tree density per hectare and investments in irrigation. Part of the problems (increasing salinity of the soil and water) are solvable only through large infrastructural projects. The sub-sector and its benefits for the municipality/Croatia will likely need to increase before having the political weight to capture the attention and willingness of the local and central government for such infrastructural projects. The real limiting factor in the most productive Neretva valley is the lack of large parcels of available land. In other suitable locations, preconditions such as irrigation water and soil quality are limiting the growth. In addition, the government is yet to find an appropriate mechanism for land consolidation and state land distribution, allowing further development of the production. The Neretva valley is part of a pilot project for addressing the above mentioned land-related constraints. Based on the available land and water resources, as well as planned infrastructure projects, it is estimated that the growth of the sub-sector in area with the current resources can be approximately 30% in medium term regarding new plantations, and up to 50% through the introduction of appropriate irrigation and hail protection.

186
Regional Rural Development Standing Working Group in SEE
7.2 Labor and skill available locally, and improvement possibilities Most of the producers consider the mandarin production as an additional income rather than the main source of income. Farmers often diversify their production with vineyards or olive plantations in order to avoid peaks of labor requirements and risks associated with open field production. This further prevents employment in contrast to seasonal workforces. Many farmers and almost all legal entities are highly dependent on seasonal labor for the harvest. Prices of seasonal laborers have been increasing in the last few years. Field seasonal workers are paid some HRK 25-30 (€ 9 - 11 per day), (for harvest, loading etc.) excluding lodging and food costs. With the ongoing rural aging and migration, labor shortages may have an impact on the mandarin production, placing boundaries for its development in the next decade. The introduction of mechanization in the harvest is not possible. The government will progress in the enforcement of the labor laws as part of the EU accession. The possibility to include unemployed people from Croatia as seasonal workers will be tested in 2012 and is likely to be counterbalanced by the opportunities in the EU labor for the Bosnian Croats which will be fully open for them.
8. PRODUCTION-RELATED INPUTS
Part of the inputs used by the primary producers (fuel, plant protection, drip systems etc.) is imported, including part of the used agricultural machinery. Fertilizer, planting material, some plant protection and some mechanization and agricultural implements are produced locally
42.
The producers face little problems in accessing any production inputs. The customs duty on the import of agricultural inputs is 25%. Farmers use the VAT compensation scheme very little, since they have not been sufficiently informed and few generate more income on accounts above the prescribed VAT threshold. Packing materials for the mandarins are produced locally. Additional equipment for sorting, packing and grading of the produce is imported
43.
9. ESTIMATED INVESTMENT COSTS PER SIZE OR OUTPUT UNIT AND ESTIMATED
CURRENT RETURN ON INVESTMENT FOR EXISTING OPERATIONS
The estimated profitability and investment costs for primary production are based on data from average agricultural producers. The estimated profitability and investment costs for post-harvest and packing centers are based on data from startup businesses which have gradually increased their capacity.
The investment cost for the planting of mandarins is some 35,000 HRK/ha (€ 4,400)--depending on the level of equipment--without including the actual work for planting and the land. Land prices for plots suitable for the planting of mandarins are about 30,000 €/ha. Initial fruit production is achieved after five years, while full fruit bearing is reached in eight years. Investments in drip irrigation average at some €3,000/ha while the anti-hail nets are installed for some €110,000/ha. The average yields account for some 35,000 kg per ha, bringing some 100,000 HRK (€ 13,513) profit to the farmer. However, approximately one half of this earning is costs for the maintenance of the orchards, resulting in net profits of some 1.6 HRK/kg on average (€ 0.21). Having in mind the long period between planting (initial investments) and harvest, as well as the incurred costs for maintenance during the non-yielding period, the return of the investment is estimated to be reached within the third year of yielding.
42
http://www.fertilizers1.com/fertilizer-suppliers/croatia.html http://www.list-of-companies.org/Croatia/Agriculture/Farm_Machinery/ 43
EU and mostly Italy

187
Regional Rural Development Standing Working Group in SEE
III. SUB-SECTOR – OLIVES AND OLIVE OIL 1. DETAILED ASSESSMENT OF THE SUB-SECTOR
1.1 Primary production Olive trees are one of the main determinants of the Adriatic Region of Croatia that covers the continental Mediterranean Sea coast areas and the islands. It ranges 1,777 km from Istria in the north-west to the coastal areas of Rijeka with the islands of the Kvarner Bay, Dalmatia with the cliffy coast from Zadar, Split to Dubrovnik and Konavli in the south, thereby having an enormous variation in the breadth of the coastline. The Adriatic region is characterized by karst areas and a Mediterranean climate with an increase of annual temperature and decrease in rainfall from north to south. The sunny and hot climate favors the growth of high quality Mediterranean olives. Due to its specific geographical location, this region has a very complex natural environment and a very diverse flora and fauna, separate natural landscapes such as islands, mountain massifs and coastal areas. The history of olive growing dates back to Roman times. Different from other Mediterranean countries, in Croatia olive growing was deteriorating during the last century, especially before the Second World War and in the following years. During socialism, family farming stagnated, which led to the devastation of the olives trees. A large number of olive trees were destroyed for the construction of tourist facilities. Many of them were burnt in frequent fires. Due to these developments the areas under olive trees were cut in half in the course of 50 years. During the Croatian war in the early 1990’s, many olive tree businesses ceased to exist. With the change of Croatia to a market economy, especially since its post-war developments, agricultural producers of olives as well as the industrial processors of olive oil become more and more interested in expanding their production (6). The positive development in the sector was supported by the introduction of state support schemes and a consumer demand pattern, offering possibilities to achieve better prices as well as to further develop the tourism industry. Today, olives in Croatia are produced on around 40,000 farms. Olive growing is one of the most present agricultural branches. A large number of the producers are semi-subsistence farms (21). The olive growing in the coastal areas has significant social impact and potential for revitalization of the rural areas, especially of the less favorite areas
44. The olive production also
contributes to the prevention and recovery from wild fires. The area on which olive trees are cultivated is shown below. Some 3.7 million olive trees are planted out of which 86.5% (3.2 mil) are productive trees. This area accounts for 1.3% of the total agricultural area (28). Table 3.1: Area planted with olive groves in Croatia (ha)
2006 2007 2008 2009 2010
13,363 14,346 14,971 15,304 17,000 Source: Croatian Bureau of Statistics
The production of olives (due to climate, support schemes, etc.) shows fluctuating output, as shown in the table below. Table 3.2: Total olive production in Croatia (t)
2006 2007 2008 2009 2010
27,530 34,527 35,955 32,592 38,001
Source: Croatian Bureau of Statistics
44
Residents of less favourite areas in general have access to the same IPARD measures, however they are entitled to larger share (10-20%) contribution by the government. http://www.mps.hr/ipard/default.aspx?id=8

188
Regional Rural Development Standing Working Group in SEE
The average yield per hectare is shown in the table below, while the yield per tree (from 2000 to 2004) ranged from three to 10.63 kg. In 2005, a boost was noted in the average yield/tree amounting to 16.3 kg/tree (28). Table 3.3: Average yields in Croatia (t/ha)
2006 2007 2008 2009 2010
2,1 2,4 2,4 2,1 2,2 Source: Croatian Bureau of Statistics
Olives start producing after a few years, however, the maximum yields are obtained some 12 years after planting. Climate change influences the blossoming of olives in accordance with the temperature variations. In certain varieties blossoming is much earlier and sometimes the temperatures condition breaks in the blossoming. Graph 3.1: Olive production in Croatia (in tons)
Source: FAOSTAT
The terrain configuration and age of olive groves very often prohibit any intensification of the production. However, these circumstances allow for achieving higher commercial value of the product through PDO/PGI and organic cultivation. On the other hand, new cultivations tend to be more intensive and those being raised during the last ten years significantly consist of imported cultivars. It significantly changes the original collection of native cultivars that has been inherited (28). The largest share of olive production belongs to the indigenous varieties but there are also other domestic and foreign varieties:
Oblica is the most important as well as the most abundant olive variety. This variety is indigenous to the Adriatic littoral. This olive provides oil of very good quality which is also appropriate for preservation
Drobnica and Sitnica are more susceptible to drought and low temperatures than Oblica. They give oil of better quality and are more fruitful compared to Oblica
Buzha variety gives outstanding oil quality which is also used for preservation
Lastovka has a regular yield of 90 kg and oil yield of 20 – 22%. The olive fruit is used exclusively for oil production. Its drought endurance is very good
Leccino is an Italian variety, with a share of 80% in intensive olive plantations in Istria. It is auto sterile and therefore it is planted with the variety Pendolino as a pollinator. It gives satisfactory yields. The oil yield reaches 20% and it can also be used as a table olive
Frantoio has an aroma reminiscent of herbs and apples; the taste is overcome with almonds and a spicy overtone
Ascolana Tenera is one of the most valuable table varieties; it is widespread in all areas where olives are grown

189
Regional Rural Development Standing Working Group in SEE
Rosulja is golden and green in color and has an intense fruity smell with a hint of olive in the background. Spiciness and bitterness is strong, overflowing into a strong paprika flavor
1.2 Processing industry and olive oil The processing of olive oil is conducted by some 148 modern facilities as well as in 27 small family-owned traditional establishments. In the last few years the processing industry has significantly increased and modernized. 80 processors are using both cold pressing and centrifuges while 49 have presses (28). The modern technology used in most oil processing plants today mitigates the risk of chemically induced changes in the oil composition. Table 3.4: Olive production in Croatia (in hl)
2003 2004 2005 2006 2007 2008 2009 2010
17,086 37,146 60,232 45,652 57,790 57,665 53,735 52,055 Source: Croatian Bureau of Statistics
Olive oil has become an important economic potential in the Mediterranean part of Croatia, yet the quantity of production and processing is still at a low stage compared to the EU Member States, although in terms of quality it is a premium product. Table 3.5: Distribution of olive oil processors in Croatia
County Number of olive processing plants
Pressing Centrifugation Capacity (t/hour)
Lstarska 20 - 20 17.00
Primorsko-goranska 9 2 7 6.00
Licko-senjska 1 - 1 0,30
Zadarska 21 14 7 31.00
Sibensko-kninska 15 5 10 12.50
Splitsko-dalmatinska 39 17 22 28.00
Dubrovacko-neretvanska 24 11 13 18.00
Total 129 49 80 113.80
Source: Gugić, 2010
The autochthonous olive cultivars and climate and soil are the main factors determining the characteristics of the olive oil. The fatty acids composition of olive oil in Croatia is homogenous (on average 0.39%). This is a characteristic, useful and significant for PDO/PGI protection, although local varieties affect the speed of the registration. Good oil quality and relatively high amount of polyphenols (from 230 to 690 mg/kg) can be obtained from olive cultivars during rapid olive processing. From the point of view of productivity, the most important factor is the quantity of oil extracted during processing. The most abundant (average of 22% in fresh olive fruit and 50.5% in dry matter) are the Bianchera cultivars (polyphenols >450 mg/kg). The least abundant are (19.0% of oil in fresh fruit and 41.4% in dry matter) the Karbonera-Vodnjan cultivars (28). The production (quantity) of olive oil is dependent on the olive yields and the olive quality. As illustrated below, the peak in olive yields had a very low usage rate (15.1 %) on account of weather fluctuations (28) in 2005.

190
Regional Rural Development Standing Working Group in SEE
Table 3.6: Olive oil production and yields in Croatia
Year Oil production (t) Yield of olive oil (%)
Base indices of production (2000 = 100)
Chain indices of production
2000 2,579 15.9 100,0 - 2001 3,089 15.9 119.8 119.8
2002 5,033 15.3 195.1 162.9
2003 1,563 16.5 60.6 31.1
2004 3,399 16.5 131.8 217.4
2005 5,511 15.1 213.7 162.1
2006 4,177 15.2 162.0 75.8
2007 5,288 15.3 205.0 126.6
2008 5,276 14.7 204.6 99.8
2009 4,917 15.1 190.6 93.2
Source: Croatian Bureau of Statistics, and Gugić, 2010
The processors are well distributed and on average they process some 300 tons of olives (apart from the Sibenin-Knin where they process some 600 t of olives/year). The installed capacitites range from 0.35 t to 4 t of olives/hour, although the most commonly installed capacity is 1.5 t/hour. There are 14 processing units for confectioning of olive oil and a total of nine processing plants for packing of table olives. The installed capacities can, in principle, process the entire production of the country within 40 working days operating at one shift (28). The processing units are adapted for the production of mainly virgin olive oil and very few capacities are used for other olive oil derivates (refined, raw olive oil, olive oil from pomace etc.). Croatia has recently been included in the most prestigious guide for extra virgin oil – Flos Olei, also formerly known as L’extravergine. The criteria for being listed are demanding, and inclusion on the list makes an olive oil a quality recommendation. The guide includes olive oil from 42 countries on five continents. Italy has the largest number of listed oils, France has 12, Greece five, while Croatia has 45 listings. 1.3 Trade The production of table olives is variable and fluctuates between 500 to 2,600 tons, as many of the varieties produced are with dual purpose (26). The import of olives has been higher than the export for many years. The total consumption of table olives is variable and larger than the local production. Consumption per capita fluctuates from 0.10 to 0.84 kg. Out of the total olive oil production (average 60,000 hl), a significant quantity of the Croatian olive oil is produced in mills which operate as service providers. Up to 70% of the oil is given back to the producers. The oil is used for home consumption and sold individually by farmers. Pending demand, home-sold oil reaches both higher and lower prices compared to the bottled oil by processors. Improper storage at producer level affects the quality of the oil. Most of the olive oil sold directly by farmers has not had its quality confirmed by laboratories, making the quality a topic for a lively debate. The total local consumption of olive oil is between 2,815 and 6,571 tons per year. Consumption per capita on average is approximately 1 liter/capita (28). The positive trend in demand has been influenced by consumer awareness regarding the health and nutritional value of olive oil, especially in the last few years.
Table 3.2: Quantities of olive oil exported by Croatia

191
Regional Rural Development Standing Working Group in SEE
Source: ITC calculations based on UN COMTRADE statistics
The exported olive oil is produced by larger processing companies which buy it from farmers after processing their olives. The buyout of the olive oil is subsidized by the government through competitions open to Croatian physical and legal entities. The buyers are obliged to pay in full the total quantity of oil to the producers by the end of the year (26). Since the independence of Croatia, the production and export of olive oil has been constantly growing but as with the export, import is also increasing. Croatia is largely not self-sufficient in olive oil production. Table 3.7: List of importing markets for olive oil exported by Croatia
Source: ITC calculations based on UN COMTRADE statistics
Croatia exports between 150 and 450 tons of olive oil, mostly on the neighboring markets of Bosnia and Herzegovina (40%), Austria (7%) and Slovenia (15.6), while a significant part is also exported to Germany (16.3%). High quality olive oil is exported to the EU countries at high prices ranging from 18,500-36,800 US$/ton, while lower quality oil is exported to the main trade partner, Bosnia and Herzegovina, at an average price of 6,000 US$/ton.
Exported value in Euro
Importers 2007 2008 2009 2010 2011
World 1,815.07 1,888.76 1,472.07 1,219.98 1,134.38
BiH 834.58 666.74 542.8 464.65 455.9
Germany 89 176.71 201.49 216.13 185.23
Slovenia 531.83 491.39 395.8 208.6 176.62
Austria 20.43 44.18 30.83 59.49 79.69
United Kingdom 29.18 44.86 40.87 61.75 39.49
Montenegro 84.63 122.34 139.82 28.62 30.15
France 15.32 24.47 0 18.83 28
Italy 2.92 37.38 10.76 31.63 28
USA 36.48 42.82 53.06 60.25 22.97
Serbia 72.95 80.88 23.66 28.62 20.1

192
Regional Rural Development Standing Working Group in SEE
2. SUPPLY CHAIN DESCRIPTION A schematic of the supply chain parties and influencers is depicted below.
Source: SWG 2.1 Supply chain actors
2.1.1 Regulators of the supply chain The government regulates all aspects of the market of olive oil: 1) minimum buyout prices 2) selection of buyers for buyout and resale 3) ensuring that produce is in accordance to the prescribed quality criteria 4) seasonal workers inclusion
Source: SWG
Supply chain role players
Banks and lenders
Ministries and Payment Agency
Retail input shops
Horizontal associations and organizations
Insurance agents
Certification bodies
Government inspections
Export and business promoters

193
Regional Rural Development Standing Working Group in SEE
The government announces public competitions as part of the market regulation system, aiming to eliminate the gray trade and protect the producers/processors, as well as to brand the product. The government also prescribes the quota of subsidized trade, currently set at 500 tons each of extra virgin oil and virgin olive oil. The law on geographical designations regulates the process for awarding special recognition status at EU level. The law on market regulation prescribes the measures for regulation of the market, the applicable measures, the beneficiaries of the measures and the control and inspection practices. The rulebook on oil from olives and olive pomace prescribes the characteristics of the olive products being sold, including: categorization, labeling and definitions, technological processes in production and processing of olives, packing physical and sensor properties of the oil, the raw materials and the additives, the sampling and laboratory analyses, registration of processing and packing facilities in particular with PDO/PGI. The rulebook on the quality of fruit prescribes the quality of table olives. The rulebook on fruit producer organizations prescribes the conditions for their recognition and submission of their plans, and the types of support for the financing of their operational programmes (26). 2.1.2 Agriculture input suppliers The input suppliers can generally be divided into wholesalers and retailers. Wholesalers are often producers/packers/importers of different agricultural inputs. They rely on a network of agricultural pharmacies for the distribution of inputs to the agricultural producers. Some wholesalers are involved in retail operations, while some retailers are involved in import operations. Certain buyout traders from their own retail shops (agricultural pharmacies) credit the producers with agricultural inputs/saplings to be paid after the harvest, however, this comes at increased prices compared to inputs paid in cash. Most of the farmers can also obtain crediting in inputs from the agricultural pharmacies (up to
90 days).
Croatia, in general, produces its own planting material for olives. However, there are also significant imports of planting materials which peaked in 2009 - 2010 and accounted for more than 154,000 saplings. In Croatia there are 15 nurseries with olive rootstocks. The nurseries offer some 30 varieties, out of which 56% are autochthonous and 44% are introduced. The most cultivated varieties in the nurseries are Buza and Oblica. Nurseries in 2009 produced 405,507 trees (22 cultivars), participating with 8.65% in the total production of fruit trees in Croatia. Mist propagation is today a dominant method (90%) of nursery olive tree production. The wholesale prices of olive oil planting material range from 35 to 80 HRK/tree (€ 4.7-10.8). The average wholesale price is 37.38 HRK/root (€ 5), while the average retail price is 42.71 HRK/root (€ 5.77). The most valued variety is Levitinka, which is more than double the price compared to most of the varieties. A total of 12% of the planting material producers are located in Istra, while the rest is located in Dalmatia. This matches the distribution of the olive groves. Regarding the structure, 54.4% of the produced planting materials are varieties with dual use (consumption and processing), 43.9% are varieties intended for processing and 1.7% are table varieties. The whole production is sold locally trough a network of retailers. The planting material production is regulated by a legal framework with detailed requirements on quality, packing, declaring and storing. According to the regulations, the saplings have to be at least 1 m tall and 1 cm in diameter (28). 2.1.3 Primary production More than 40,000 households and 38 legal entities are involved in olive production. The individual sector owns 98% of the olive groves. This is proportional to the ratios in the leading olive producers in the world.

194
Regional Rural Development Standing Working Group in SEE
Companies that produce olives usually also farm/market other agricultural crops/products (28). Table 3.8: Size of legal entities involved in olive production
Utilized agricultural land (ha)
Number of business entities Share (%)
Up to 1 6 15.8
2 4 10.5
3 1 2.6
4-5 6 15.8
6-10 10 26.3
11-20 5 13.2
21-30 1 2.6
31-50 2 5.3
51-100 1 2.6
More than 100 2 5.3
Total 38 100.0
Source: Croatian Bureau of Statistics
Olive growers are associated in 38 organizations and are usually very active in the organization of numerous events. However, most of the growers are still not members of associations or producer organizations. The individual olive growers have 121 tress on average, usually distributed on three plots,
totaling to 0.71 ha. Most represented (40%) are farms which occupy a small area between
0.5 – 2 ha. 37% of the olive tree plantations are smaller than 0.5 ha and plantations bigger
than 2 ha make up 23% of the total planted area.
Compared to the EU, which produces 75% of the global olives, a total of some two million farmers are producing olives. The average size of the olive groves are 2 ha. The oscillations in the production point to the predominance of extensive production with a low density of trees, no irrigation, irregular agricultural practices, hand harvesting and low and variable yields. Apart from the islands, the age structure and birth rate of the farmers are similar to the national average. However, like all rural areas, there are trends for the migration of young people. Reinvestments in the modernization or enlargement of the production are limited, apart from
the credits provided by the operational programme. Farmers in general are not attracted to
crediting with over 3% annual interest. In many cases the ownership of the land is not
resolved, preventing further investments.
The main criteria for making decisions on where to sell the produce are the security of payments, the agreed quality and price, followed by pre-harvest crediting with inputs and so on. Large individual producers (both individual farmers and legal entities) are heavily dependent on seasonal workforces for the harvest. Strict labor laws are making it hard for growers to find pickers. Currently, most of the pickers in Istria come from Slavonia, and in Dalmatia, from Bosnia and Herzegovina. The average daily fee is 250 HRK/day (€ 33.7) in Istria and 200 HRK/day (€ 27) in Dalmatia. Unemployed Croatians were not interested in the jobs, as if they are caught by frequent enforcements; they will lose the unemployment or welfare benefits. This has changed with the legalization of the seasonal work in 2012, The new law stipulates that everyone working in the orchards must be reported to the pension and health insurance authorities. If a farmer needs 100 workers he/she will need to buy 100 tickets at a cost of 20.9 HRK (€ 2.82) which will cover the contribution for the retirement and health fund. In addition to that, farmers will be required to buy contracts with attendance records at 3 HRK (€ 0.4) and distribute them to the workers. The longest seasonal contract will be for 90 days. The contracts have 30 pages

195
Regional Rural Development Standing Working Group in SEE
and on each page three tickets of 20.9 HRK (€ 2.82) can be added at the start of each day. The worker will be obliged to have the contract on his/her person in case of governmental controls. Registered unemployed people can also work without the risk of them being deleted from the list and losing their benefits. Unemployed people and retirees—apart from minors and employed people-- will also be able to work. Working days will be limited to 6 - 12 hours with a 30 minutes break, and 12 hours of rest within a 24 hour period. The Ministry of Labor has decided that the lowest pay for a seasonal worker will be a minimum of 70.4 HRK/day (€ 9.51). The levies for the pickers account for an additional 25% to the wages paid to the pickers. 2.1.4 Processing industry Oil mills are mostly service providers conducting the basic processing of olives into olive oil with no raw oil processing, filtration or refining capacities. There are no facilities dedicated to oil extraction from pomace. The olive processors (companies and co-operatives) have a range of economic activities and are not specialized in the production and marketing of olive oil. They provide services for the processing and buyout of olive oil and very few are actually packing oil for direct marketing. Few oil mills have laboratories for basic chemical analyses. The quality level of olive oil extracted is affected, among other factors, by time passed from harvest to process, i.e. abiding period before the processing and storing of oil. The largest number of quality oil is processed within two days from harvesting of the olives which results in premium quality. The distribution of the processors in Croatia allows for quick extraction and the production of high quality oil. The oil is produced either the same day or the day after, depending on the daily workload of the oil mil. The harvesting and processing season can last between one and two weeks. Farmers transport the daily harvest to a nearby oil mil to be extracted. Green olives, if picked too early, can be bitter, while overripe olives yield more oil but the quality is significantly lower. The following categories of olive oil are produced:
Virgin olive oil: When grinding is completed, the paste is pressed to separate the liquid from the paste. Cold pressing for virgin oil is done at less than 27
oC. This ensures the
texture, taste and aroma. In virgin olive oil the acidity level must not exceed 2%
The extra virgin olive oil has to satisfy specific chemical and organoleptic criteria (such as low free acidity). Extra virgin olive oil is exclusively retrieved from virgin oil. Increase of acidity over 0.8% prevents extraction of extra virgin oil
Pure olive oil is a step down from virgin olive oil as it is a blend of virgin and refined olive oil
Olive pomace oil focused less on quality and more on quantity. It can be found as an imported product in Croatia
Lampante oil is still olive oil, yet it is used for oil burning lamps
Refined olive oil is the lowest grade of olive oil. It is retrieved by the use of chemical solvents and charcoal in collaboration with really poor quality olive oil
Most of the processors are equipped with processing equipment from Pieralisi, Italy, including cold pressing and centrifuges preserving the quality of oil. There are a few presses using stone presses which influence the quality of the production, however, they are processing a very limited quantity of the production. The processors are organized in an association of processors (founded in 2008) which lobby the government and protect the common interests of the branch. The association also agrees on the price for services provided to the farmers. The processors are not crediting their end buyers and experience minor inconveniences in terms of accessing investment or turnover finances. This allows for appropriate cash flows along the supply chain.

196
Regional Rural Development Standing Working Group in SEE
2.2 Current constraints and limitations The major constraints on the key actors in the sector are explained below. The olive production on the coast and the islands has a significant economic and social value, especially in the context of controlling the ongoing depopulation. However, the olive sector is currently driven by government subsidies. Fragmentation and the small surface area covered by the average groove is an obstacle to raising competitiveness with regard to reducing production costs and increasing income. Due to the land fragmentation, development based on state-owned land remains the only possibility for larger plantations. However, having in mind the average size of farms in the other Mediterranean countries it will not be difficult to develop the Croatian olive industry to the same level with the currently available state support. Please see chapter II, 2.2 for more details on agricultural land, production technologies and producer organizations. The labor for harvesting remains a problem for the extensive growers where often even basic tools are not applicable. In some cases the producers insist on picking by hand in order to preserve the quality. In other cases the terrain is not accessible for mechanization. It is a very demanding job and most of the old orchards were sized in accordance to the available workforce. However, in the most newly planted and renewed orchards, mechanized harvesting is applicable, and can significantly reduce the costs of the harvest. Being a significant part of the production cost, the harvest will be a determining factor for the future of the olive oil pricing and share of the market. Because Croatia currently imports refined olive oil, the country needs a refinery plant that would refine oil and distribute it on the market. This could be used in the production of olive oil made of refined olive oil and virgin olive oil. Olive pomace not used for compost or for heating further influences the end price of the produced olive oil (26). As much as 70% of the olive oil is retained by the producers and sold directly to consumers. It is of utmost importance to further support the verification of the quality. Equipping laboratories for basic chemical analyses would encourage sales of quality oil to the end customers. There is a noticeable disproportion in the investments of funds and efforts for the increase and improvement of the production and quality, compared to the organization of the market of olive products. There is a lack of activities for commercial organization of small farmers engaged in olive production and the marketing of olive oil and table olives. Intensification of the activities and investment in market regulation and marketing are needed in the coming period.

197
Regional Rural Development Standing Working Group in SEE
2.3 Solutions for the identified constraints and limitations A mix of interventions at company, industry and sector level are feasible and are presented in the table below which lists the compounded constraints and limitations and ways to address them as identified by the supporters of the supply chain.
3. SWOT ANALYSIS
The following sub-chapters illustrate a SWOT analysis based on the above factual assessment of the sector, taking into account EU accession and the ultimate goal of preparing the sector for participation in the EU market and building up capacity to resist the resulting pressure of competition.
3.1 Primary production
3.1.1 Strengths
The government is financially supporting the maintenance of new plantations and the
renewal of the existing olive productions
The number of trees of productive age has been improving in the past years, resulting in
increased outputs
Centuries-long olive farming tradition
Product authenticity
Relatively low utilization of agrochemicals in the production of olive which enables an
increased production of organic olives
Area planted and outputs are increasing 3.1.2 Weaknesses
Fragmented primary production with high costs and low technology improvement
Most plantations are old with medium productivity and in need of renewal
Farming practices are at locations that are up to traditional and not up to international standards
Education in both general and organic agriculture is insufficient, resulting in low yields and limited organic production
Great yield oscillation
A large number of fragmented lots where olive trees are grown
Constraints for the sector
Why does this prohibit development
How can this problem be solved
Lack of modern technology and modern production knowledge
Limited yields Underutilization of raw materials Increasing import of olives with lower grades
Study tours to producers Feasibility studies for use of olive pomace Support for establishment of facilities for utilization of olive pomace Feasibility study for refining of olive oil Support for establishment of olive oil training facilities Assistance with harvesting issues and introduction of mechanization Organize olive oil analysis Organize study tours to foreign producers Support for intensification of the primary production Introduction of other olive-based value added products (olive paste etc.)
Lack of standards, including organic products
Limited access to markets
Support producers/processors in getting certified in Global GAP , HACCP, BRC, Halal, Kosher , organic Work with organic associations on educating local producers on organic markets
Lack of associations and integrated approach
Development of export associations and integrated producer organizations

198
Regional Rural Development Standing Working Group in SEE
Insufficient domestic production to meet demand of the processing industry
Olive growers’ abstention from investments through credits, preventing rapid improvements
Inappropriate level of managing and marketing knowledge shown by the olive growers
Low utilization of olives and low yields 3.1.3 Opportunities
Possibility to lease state-owned agricultural land
New plantations using modern practices resulting in improved quality and yields
Investments in mechanization, varieties and appropriate extension can increase the production quantity and quality
Potential for maintenance of viable middle-sized producers in compliance with community
standards, allowing for professionalization and sustainability of the farming units
A higher interest in establishment of new olive groves and regeneration of old and fire-
affected olive groves 3.1.4 Threats
The growth of average wages in the coming years will put pressure on growers to improve yields and productivity and decrease production costs
Depopulation and aging in rural areas (leading to regional labor shortages)
Farms cannot develop to the level of international competiveness due to lack of support and investments
Further land fragmentation
3.2 Processing industry
3.2.1 Strengths
High quality of olive oil produced (two Croatian oils are among the global top 20 in 2011
and 2012 (Flos Olei – Zigante, Olea))
Companies invest in expansion, modernization and quality management
Present institutional support and subsidized investments in improvements of the production
Tariff-free access to the CEFTA and EU markets
Good territorial distribution of processing units
EU entrance ensures compliance with EU regulations and increasing competiveness
Sufficient processing capacities
3.2.2 Weaknesses
The current fragmentation of the fruit industry limits economies of scale and profitability
Insufficient organization of the branch leading to lack of co-operation for export
Marketing is underdeveloped
Poorly organized market for olive oil, with major grey market share and poor quality affecting the image of Croatian olive oil
Service of fruit processing is mainly provided by the processors, and farmers marketing the oil themselves limits the available quantity for processors interested in developing sales of olive oil
Insufficient monitoring and control of olive products in domestic market by the authorities, resulting in low quality oil offered on the market, affecting the image of Croatian oil
High production costs per unit 3.2.3 Opportunities
Good investment incentives for foreign investors and favorable taxation policy
Co-operation between all marketing participants in a unified system could greatly increase the profitability of the production
Co-operation with primary producers can improve the raw material supply for processors rather than home processing

199
Regional Rural Development Standing Working Group in SEE
Popularization of the awareness of olive oil nutritive values
Favorable oil price on domestic market;
Export potential of product
Complementarity with tourism
Product assortment extension
Consolidation of production and sale through established processors
Registration of protected designations of origin/protected geographical indication (PDO/PGI)
Possibility to decrease production costs through modernization 3.2.4 Threats
Political situation may change, introducing less investor and export support
Sector fails to be acknowledged at political level as the driving force in agriculture
Sector support is marginalized compared to other countries offering similar products, reducing sustainability
No harmonization of agriculture legislation with EU agriculture legislation
Pressure on local producers due to cheaper imported olive oil
Negative developments affecting the image of the Croatian olive oil
Stockpiling due to reduced demand and loss of quality and image
Strong competition in the EU and the international market
Limited possibility of land consolidation
4. COMPARATIVE ADVANTAGES
4.1. Primary agriculture
Croatia has an excellent climate and conditions for olive production, especially in terms of producing high quality olive oil
Cheaper workforce compared to main competitors
The possibilities for the intensification and automation of the harvest can account for the needed reduction in overall costs
The average farmer is experienced and willing to invest in agriculture
Limited investments (in irrigation renovation of plantations) can significantly boost the yields of the production
Both the government and the crediting system are available and are supporting the sector
Croatian olive oil tends to supply a niche market focused on quality. This was further backed with the inclusion of Croatian olive oil in top world olive oil catalogues in several competition categories
4.2 Olive oil
The high representation of authentic varieties of olives guarantees specific, unique and appreciated properties of excellence
Very high participation of extra virgin olive oil in the total production
Premium quality qualifying for exclusive boutique production of olive oil targeted for niche markets
The prices of the Croatian premium olive oil match the quality and are affordable in its category
The recent and ongoing investments into primary production guarantee an increase in availability of raw materials for the decades to come
Development of the awareness for quality and marketing of the products kept and increased access to the vast markets of EU, CEFTA, CIS etc.
The production process allows automation and increase of capacity at limited costs
Good geographical positioning and access to European Corridors
Available human resources which involve a professional and qualified workforce, large experience and productivity and a readiness for new technologies
.

200
Regional Rural Development Standing Working Group in SEE
5. INVESTMENT POTENTIALS Domestic investors from the sector comprise of various actors, including farmers, farming co-operatives, traders (including exporters and importers), as well as other role players connected with the sector. The Croatian government has estimated that some € 1 billion in investments is needed in order to improve the fruit production and export to a significant level (export of € 300 - 350 million). The subsidy system is adapted to this long term goal and mandarins are at the forefront of the fruit sector. The government has managed to attract investments accounting for 50% of the area envisaged through subsidies in the fruit operational programme. Investment for foreign investors in primary agricultural production on private land is somewhat limited due to the fragmentation and private ownership of land, however, it is possible given the relatively small size of plantations across Europe. Investments in large olive groves are feasible mainly on plots of government-owned land (leased for up to 50 years through a one-time payment) or in co-operation with entities already owning and cultivating state land. The government and local authorities are supportive of such investments. Due to the long period between planting and the harvest, investments in primary production are effective in the long-term, taking into account the growing market demand. On the other hand, modernizing the production can significantly increase its productivity and profitability. The investment potential in the individual farmer sector is significant, as there is sufficient land area for an increase in the production. Local farmers (on the coast) have shown significant interest in further investments in the olive production, as long as the market is appropriately regulated. In addition, they have also demonstrated up to now that they are even able to handle production on fragmented plots. Investments in the processing sector are supported by the government in the form of grants and credits. This goes especially for the neglected parts of the sub-sector, such as an oil refinery or olive pomace processing. The interviewed role players have emphasized the possibilities of investments in portable processing units for immediate on-field processing. Mobile processing units can further improve the quality through immediate processing after the harvest, as well as to reduce the cost of transporting some 85% of the weight of the olive pomace. All interviewed processors are interested in joint ventures with foreign investors which could improve/increase their share in the procurement of olives, complement the modernization of the processing facilities or improve the access to more lucrative markets. The government support and licensing mechanisms of the processing sector through public competitions ensures the continuous investments. An investor can consider a joint venture with established local companies already processing olives as many of them need further modernization and technological improvements.
6. MARKET OPPORTUNITIES Market opportunities for Croatian olive oil exist both on the local and the international markets. Croatia produces high quality oils that will have to find their place in the marked amid tough competition in its immediate region. At the same time, however, olive oil is a predominantly expensive product which is exported to countries that can afford it and that appreciate quality. The entrance into the EU on one side limits the growth possibilities due to the quotas, however, it also accounts for easier marketing in EU non-Mediterranean countries using favorable EU trading regimes. The policies of the government in the near future will also shape the market potentials of Croatia. Support for the bottling of premium olive oil and PGO/PDI registration for protection of the image of Croatian high quality oil will be crucial. Regulations on olive oil production, including blending using imported olive oil, will also have a significant impact.

201
Regional Rural Development Standing Working Group in SEE
6.1 Local market The market of olive oil in Croatia is not well developed in terms of organization or infrastructural development, with a high percentage of uncontrolled trade. A part of the population keeps oil as in kind savings and sells the old oil only when the stocks are being replenished. The average consumption is low compared to other Mediterranean countries (Greece 20 l/annum/capita, Italy 12.5 l/annum/capita and Spain 10.5 l/annum/capita). The consumption has been growing for years in parallel to the improvements of the quality. In this context, extra virgin oil participates with 60% of the production of olive oil--the virgin oil with 35%--which is higher compared to most competitors. The average production price for olive oil in the local market ranged from 44.78 to 54.13 HRK/l (€ 6 - 7.3) in the last five years. While the prices paid for olives ranged from 4.90 to 8,00 HRK/kg (€ 0.66 - 1.08) (28). Table 3.9: Trade of olive oil
Year
Import Export Balance
in tons in USD in tons in USD in tons in USD
2000 671 1,082,840 211 728,713 -460 -354,127
2001 1438 2,340,803 339 975,989 -1099 -1,364,814
2002 1702 3,277,589 352 1,125,375 -1350 -2,152,214
2003 1725 4,138,823 339 1,422,637 -1386 -2,716,186
2004 2334 7,416,028 458 2,161,015 -1876 -5,255,013
2005 1914 7,377,449 344 1,9 1,532 -1570 -5,455,917
2006 1494 6,536,649 239 1,909,875 -1255 -4,626,774
2007 1781 6,844,117 309 2,604,489 -1472 -4,239,628
2008 1610 6,792,306 317 2,905,735 -1293 -3,886,571
2009 1918 7,127,486 224 2,216,083 -1694 -4,911,403
Source: MIS in Agriculture and Customs Administration of Croatia, Gugic
According to the International olive oil council the average monthly prices for extra virgin olive oil in 2009/2010 in the stock markets ranged from 2,00 to 3,00 €/kg, an increase compared to the previous period when they ranged from 1,7 to 2,7 €/kg. The prices of olive oil on the Croatian market are considerably higher compared to those on the international market. The trade balance of Croatia for olive oil has been negative in the past decade. Table 3.10: Prices of olives and olive oil
Source: Croatian Bureau of Statistics, Gugic In the imports of olive oil, oil from Italy and Greece is dominant. The negative balance also extends to table olives as most of the preserved olives are imported from EU countries. 6.2 International market Further developments are of utmost importance in order to increase Croatia’s share on the world markets regarding olive oil.
The accession to the EU will increase Croatia’s market access. Aggregate demand will continue to grow in most countries with ample margins existing for further expansions in per capita consumption levels, both in developed and developing countries.
Year Olive oil (HRK/l) Olives (kg)
2005 51.10 6.35 2006 44.78 4.90
2007 51.56 6.87
2008 52.37 7.56
2009 54.13 8.00

202
Regional Rural Development Standing Working Group in SEE
The quantitative expansion of the markets is expected to go hand-in-hand with an increase in quality-based product diversification and a differentiation of marketing strategies. An increasing share of consumers demand olive oil differentiated on the basis of quality attributes, such as PDO/PGI and organic products (35). Table 3.11: List of importers of olive oil in 2011
Importers Imported value in Euro
2007 2008 2009 2010 2011
World 4,380,470 4,219,832 3,736,669 4,117,812 4,170,836 Italy 1,330,716 1,258,069 980,227 1,160,002 1,166,399 US A 712,899 708,689 658,305 680,389 689,297 France 329,049 312,139 290,188 290,638 298,450 Brazil 124,112 157,137 150,872 174,422 205,568 Germany 222,696 199,252 196,594 178,476 193,635 Portugal 177,690 185,525 142,197 159,757 164,898 United Kingdom 172,927 179,455 153,454 157,263 149,667 Japan 115,343 119,934 122,273 149,694 133,321 Canada 110,015 105,900 94,526 111,715 112,252
Source: ITC calculations based on UN COMTRADE statistics Production with quality attributes will help to expand the market in countries where premium prices for premium olive oils are paid. The 2004 reform of the EU Common Market Organization for olive oil significantly reduced domestic distortions and may soon bring a reduction in production and an increase in quality. Therefore Croatia’s share of the market will depend on added value and high quality olive oil available at limited quantities. Strict and effectively implemented and promoted schemes for PDO/PGI are possibly the best way to make olive oil producers increase their market power within the “chain” and capture the value consumers. Table 3.3: Import markets for virgin olive oil
Source: ITC calculations based on UN COMTRADE statistics

203
Regional Rural Development Standing Working Group in SEE
Graph 3.3: Prospects for market diversification for olive oil exported by Croatia
Source: ITC calculations based on UN COMTRADE statistics
6.1.3 Main competitors The EU is the largest producer of olive oil with 80% of the world production and 70% of the total consumption. The EU is also the largest consumer of olive oil with an average of 1.8 million tons which accounts for 71.5% of world consumption. Italy, Spain and Greece are the largest producers of olive oil. Comparatively, Portugal is similar to Croatia in terms of olive groves (340,000 ha) and olive trees (almost 38 million) (35). Table 3.12: List of exporters of olive oil in 2011
Exporters 2007 2008 2009 2010 2011
Exported quantity Unit Exported quantity
World 1766675 Tons 1378674 1369193 1550824 1572889
Spain 641458 Tons 654523 661572 846855 842451
Italy 294513 Tons 306267 294420 343328 363562
Tunisia 172613 Tons 169039 141688 108772 88047
Greece 93387 Tons 86813 91980 80854 86807
Portugal 31515 Tons 33972 36929 49653 66052
Morocco 3380 Tons 2573 3080 20882 35949
Argentina 18244 Tons 15631 18951 12028 22627
Turkey 40139 Tons 17161 29685 18341 12672
USA 5549 Tons 4837 5386 5765 7343 Source: ITC calculations based on UN COMTRADE statistics
7. SUB-SECTOR GROWTH POTENTIAL
7.1 Size and productivity The real growth expectancy of the sub-sector will be determined by the quotas agreed with the EU during the last phase of negotiations at the beginning of 2013. However, given the massive planting campaigns led in the last few years and the number of young/unyielding plantations, it can be easily estimated that the olive and olive oil output will at least double in the coming few years. In addition, most of the interviewed processors are considering getting involved or already are involved in the primary production of olives as a way of ensuring core raw material supplies. Growth opportunities are available on the level of producers, beyond self-organization, for maximization of income.

204
Regional Rural Development Standing Working Group in SEE
The average yields of Croatia (some 2.2 t/ha) are some 15-20% lower compared to those of Spain and Italy, according to the EU statistics. However, yields are slowly but constantly growing in the last decade. This is likely to be connected to the areas of olive groves under irrigation which in Spain, Greece and Italy range between 20.5 and 28% of the total area used for olives. In Croatia the irrigated land percentage is very low. The quantity of oil obtained per hectare in Spain and Italy ranges from 0.44-0.56 t/ha, while in Croatia (some 15.5% of the average yields of 2.3 t/ha), the oil yield is an estimated 0.35 t/ha (35). The lower quantity of oil is related to the level of modernization of the processing facilities and the number of grades of olive oil produced. Croatia is currently not producing lower grade olive oil. The low average yields (olives/ha and olive oil/ha) can be addressed through tree density improvements, irrigation and the renewal of plantations, accounting for further growth of the output. 7.2 Labor and skill available locally, and improvement possibilities Although investments are rising, most of the producers have considered the olive production as an additional income source rather than the main income source. It seems that due to the ongoing rural aging and migration, labor shortages may in the next few years somewhat limit the growth. However, most of the interviewed farmers see their children continuing with agricultural production, both as part of the tradition and for appropriate profitability. Many farmers and legal entities are highly dependent on seasonal labor for the harvest. The prices of seasonal laborers have been increasing in the last few years. The introduction of mechanization in harvest can overcome any serious shortages of seasonal workers. The possibility to include unemployed people from Croatia as seasonal workers has been tested in 2012 and is likely to be counterbalanced by the opportunities in EU labor for the Croats which will be fully open for them.
8. PRODUCTION- AND PROCESSING-RELATED INPUTS
8.1 Primary production Most of the inputs used by the primary producers (fuel, plant protection, drip systems etc.) are imported, including part of the used agricultural machinery. Few inputs (fertilizers, plant protection products) and some mechanization and agricultural implements are also produced by local commercial suppliers
45.
The supply network in the country is well developed with the presence of both wholesalers and retailers. The producers face little problems in accessing any production inputs. Farmers use the VAT compensation scheme very little, primarily because they are not sufficiently informed and few generate more income on accounts above the prescribed threshold in order to be registered. 8.2 Processing industry All materials for packing olive oil (bottles, lids, additives) are produced locally.
46 Plastic crates
used for the harvest of olives are available both locally and in the region. Processing equipment is mainly equipped by European manufacturers
45.
45
http://www.fertilizers1.com/fertilizer-suppliers/croatia.html http://www.list-of-companies.org/Croatia/Agriculture/Farm_Machinery/ 46 Vetropack, http://www.bumbar.hr/, http://www.innogroup.biz/module/item/catname,Oprema-za-kartoniranje,-zbirna-i-transportna-pakovanja-i-paletizaciju/item,51/
205
Regional Rural Development Standing Working Group in SEE
9. ESTIMATED INVESTMENT COSTS PER SIZE OR OUTPUT UNIT AND ESTIMATED CURRENT RETURN ON INVESTMENT FOR EXISTING OPERATIONS
The estimated profitability and investment costs for primary production are based on data from average, small agricultural producers which represent the majority of the raw material suppliers. The estimated profitability and investment costs for the processing industry is based on data from small startup processors that have gradually increased their capacity.
The investment cost for the planting of olives is some 100,000 HRK/ha (€ 13,513), although this depends on the level of equipment and does not include the actual work for the planting and the land. Land prices for plots suitable for the planting of olives are on average about 25.000 €/ha, while leasing prices on state-owned land range between 80 and 200 HRK/year/ha (€ 10.8 - 27). Initial fruit production is achieved in a minimum of five years, while full fruit bearing is reached in eight years. Investments in drip irrigation average at some €3,000/ha, while the anti-hail nets are installed for some €10.000/ha. The average current yields account for some 2.300 kg per ha
47, yielding some 16% of olive oil (368
l/ha) or sold at an average price of 60 - 80 HRK/l (€ 8.1 - 10.8), bringing an estimated return to the farmer of € 2,860/ha/year. However, approximately 40 - 50 HRK (€ 5.4 - 7) of this income is costs for the maintenance of the orchards, resulting in average net profits of some 30 - 40 HRK/l (€ 4 - 5.4) of olive oil. Bearing in mind the long period between planting (initial investments) and harvest, as well as the incurred costs for maintenance during the non-yielding period, the return of the investment is estimated to be reached within 10 - 12 years, i.e. the third year of yielding, not taking into consideration the cost of land and the savings in investments on account of government incentives.
47
New plantations with some 300 trees per ha are yielding approximately double quantity of olives.

206
Regional Rural Development Standing Working Group in SEE
Annex 1: Trade indicators on olive oil
Importers Trade Indicators
Exported value 2011 (USD
thousand)
Trade balance
2011 (USD
thousand)
Share in Croatia's exports
(%)
Exported quantity
2011
Quantity unit
Unit value (USD /unit)
Exported growth in
value 2007-
2011 (%, p.a.)
Exported growth in quantity
2007-2011 (%, p.a.)
Ranking in world imports
Total import
growth in value 2007-
2011 (%)
World 1,580 -4,917 100 159 Tons 9,937 -13 -17 -2
BiH 635 594 40.2 105 Tons 6,048 -15 -12 80 -3
Germany 258 239 16.3 7 Tons 36,857 17 9 5 -4
Slovenia 246 245 15.6 17 Tons 14,471 -27 -32 49 -1
Austria 111 107 7 6 Tons 18,500 34 53 19 -2
UK 55 55 3.5 2 Tons 27,500 9 7 7 -5
Montenegro 42 42 2.7 1 Tons 42,000 -30 -57 119 -7
France 39 39 2.5 2 Tons 19,500 9 19 3 -3
Italy 39 -2,973 2.5 3 Tons 13,000 53 -4 1 -4
USA 32 31 2 2 Tons 16,000 -6 -16 2 -2
Serbia 28 28 1.8 1 Tons 28,000 -31 -51 64 2
Source: ITC calculations based on UN COMTRADE statistics

207
Regional Rural Development Standing Working Group in SEE
Annex 2: Information providers
No. Name and Surname Entity Sector
1 Jerko Soče Jasenska d.o.o. – buyout/export Mandarins
2 Marko Vukša Farmer Mandarins
3 Matija Vukusic Consultant Agriculture
4 Nebojša Jerković Farmer Mandarins
5 Ilija Vukša Farmer Mandarins
6 Marko Čubranić Farmer Mandarins
7 Cobic Zdravko Agro Istra Input supplier
8 Melinda Cossetto Processor – Mih d.o.o. Olive oil
9 Davor Martinović Processor – Poljopromet d.o.o Olive oil
10 Boranka Marević Farmer Olives
11 Mijo Vukušić Modro zelena- Co-operative Olives/Olive oil
12 Ivan Milicevic Consultant Agriculture
13 Dominik Ćibarić Garden d.o.o Organic
Annex 3 – International statistics on Croatia and its agriculture

208
Regional Rural Development Standing Working Group in SEE
Croatia and Croatian Agriculture in Brief
Population 4,480,043 The World FactBook, 2011
Population (urban) 58% The World FactBook, 2010
Population – (rural) 42% The World FactBook, 2010
Currency Kuna (HRK) The World FactBook, 2011
Languages Croatian 96.1%, Serbian 1%, other 2.9%
The World FactBook, 2011
Total GDP (US$ bn) 60.8 The World FactBook, 2011
GDP per Capita (US$) 18,300.0 The World FactBook, 2011
Real GDP Growth Rate 0.7% The World FactBook, 2011
Consumer Price Inflation (%; av) 2.1% The World FactBook, 2011
Agriculture GDP % of Total 5% The World FactBook, 2011
Total Labour Force 1,717,000 The World FactBook, 2011
Agricultural % of Labour Force 5% The World FactBook, 2008
Unemployed % of Labour Force 17.7% The World FactBook, 2011
Total Area 5, 659,000 Hectare (ha) FAOSTAT, 2009
Total Agricultural Land 1,300,000 Hectare (ha) FAOSTAT, 2009
Agricultural Land % of Total Land 23% FAOSTAT, 2009
Arable Land + Permanent Crops 957,000 Hectare (ha) FAOSTAT, 2009
Arable Land + Permanent Crops % of Total Area
17% FAOSTAT, 2009
Arable Land 869,000 Hectare (ha) FAOSTAT, 2009
Arable Land % of Total Area 15% FAOSTAT, 2009
Irrigated Land 31,000 Hectare (ha) FAOSTAT, 2009
Irrigated Land % of Agricultural Land 2% FAOSTAT, 2009
Maize 2,067,820 Metric tonnes FAOSTAT, 2010
Sugar beet 1,249,150 Metric tonnes
Cow milk, whole, fresh 760,000 Metric tonnes
Wheat 681,017 Metric tonnes
Grapes 207,743 Metric tonnes
Potatoes 178,611 Metric tonnes
Total Export of Goods FOB 10.6 billion US$ FAOSTAT, 2009
Agricultural Exports 1.2 billion US$ FAOSTAT, 2009
Agricultural Exports % of Total Exports 11% FAOSTAT, 2009
Major Exports (tonnes) FAOSTAT, 2009
Sugar Refined 173,873.0
Food Prep Nes 66,459.0
Cigarettes 6,638.0
Wheat 298,528.0
Chocolate Prsnes 10,769.0
Total Import of Goods FOB 21.2 billion US$ FAOSTAT, 2009
Agricultural Imports 2.1 billion US$ FAOSTAT, 2009
Agricultural Imports % of Total Imports 10% FAOSTAT, 2009
Major Imports (tonnes) FAOSTAT, 2009
Food Prep Nes 45,281.0
Cattle meat 7,692.0
Pork 26,198.0
Chocolate Prsnes 16,423.0
Pastry 25,810.0 Source: www.eastagri.org

209
Regional Rural Development Standing Working Group in SEE
Annex 4 - References:
(1) Croatia Investment Climate 2009 - EU Business News – 2010
(2) Status overview and prospects of citrus growing in Croatia - J. Gugić, L. Cukrov – 2011
(3) COUNTRY REPORT FOR INVESTORS AND EXPORTERS CROATIA – Coface – 2010
(4) Akcijski plan razvoja ekološke poljoprivrede u republici hrvatskoj za razdoblje 2012- 2016.
godine - ministarstvo poljoprivrede, ribarstva i ruralnog razvoja - 2011
(5) Country Report - CROATIA - ARCOTRASS- Consortium – 2006
(6) CROATIAN AGRICULTURE - Ministry of Agriculture, Fisheries and Rural Development of the
Republic of Croatia – 2009
(7) Fruits and Vegetables Market Brief –USDA- 2011
(8) JAVNE POLJOPRIVREDNE SAVJETODAVNE SLUŽBE ZA 2011. GODINU - HRVATSKA
POLJOPRIVREDNA KOMORA – 2012
(9) The Croatian Tax System- Ministry of Finance- Tax Administration – 2012
(10) TIME TO INVEST IN CROATIA - INVESTMENT GUIDE - Ministry of Economy, Labour and
Entrepreneurship – 2011
(11) IPARD PROGRAMME 2007 – 2013 - Agriculture and rural development - MAFRD - 2009
(12) OPERATIVNI PROGRAM PODIZANJA TRAJNIH NASADA 2008.-2012. - MAFRD -2008
(13) Reforma sustava poljoprivredne potpore u hrvatskoj u razdoblju 2010-2013 - Konceptualni
okvir za poljoprivrednu politiku u pretpristupnom razdoblju - MAFRD -2010
(14) State of olive growing and oil production in the Republic of Croatia - Višnja Šimunovic -
POMOLOGIA CROATICA – 2005
(15) Statistical Yearbook of Republic of Croatia – Croatian Buerau of Statistic – 2011
(16) Strategija ruralnog razvoja rh 2008. – 2013. MAFRD -2008
(17) Strateški plan 2012-2014 - Ministarstvo poljoprivrede, ribarstva i ruralnog razvoja – 2011
(18) IPARD vodič za korisnike - Agencija za plaćanja u poljoprivredi i ruralnom razvoju – 2012
(19) www.porezna-uprava.hr
(20) www.carina.hr
(21) www.mps.hr
(22) Pravilnik o primjeni zakona o trošarinama što se odnosi na plinsko ulje obojano plavom
bojom za namjene u poljoprivredi, ribolovu i akvakulturi - Ministarstvo financija – 2009
(23) Smjernice razvoja voćarstva 2008.-2013. Agronomski fakultet – 2009
(24) Pravilnik o potpori kapitalnim ulaganjima u poljoprivredi - MAFRD – 2009
(25) www.tisup.mps.hr
(26) www.hbor.hr
(27) Analysis of Local Situations + SWOT + Possible Trends – Moreintelegentenergy.eu – 2008
(28) Status overview and prospects of olive growing in Croatia - J. Gugić, M. Tratnik, F. Strikić,
M. Gugić, P. Kursan POMOLOGIA CROATICA – 2010
(29) Investment Horizons: Western Balkans - The World Bank Group/MIGA – 2006
(30) www.fao.org
(31) www.eastagri.org
(32) Export Development of High Value Agricultural Products of SEE Countries-CBI/SWG-2011
(33) Food Industry Study in Southeast Europe – GFA- 2011
(34) www.trademap.org
(35) Economic analysis of the olive sector - European Commission, Directorate-General for
Agriculture and Rural Development – 2012
(36) www.croinvest.org
(37) www.gfmag.com/gdp-data-country-reports/289-croatia-gdp-country-
report.html#axzz2EjIGoFZM

210
Regional Rural Development Standing Working Group in SEE
COUNTRY PROFILE - ALBANIA
- Medicinal and aromatic herbs

211
Regional Rural Development Standing Working Group in SEE
I COUNTRY SPECIFICS - ALBANIA
1. GENERAL DATA ON THE COUNTRY
1.1 General data Albania is bordered by Greece to the south and south-east, by Macedonia and Kosovo* to the east and Montenegro to the north. To the west are the Adriatic and the Ionian seas (362 km) coastline). Albania covers an area of 28,748 km
2, of which approximately 25% are plains, about
47% hills, about 28% highlands, and approximately 1,350 km2 are covered by water. Annual
rainfall varies from 1000 ml to 2500 ml. Albania is a parliamentary republic with a population of 3,220,000 inhabitants (32) and a population density of 110.3 inhabitants/km
2 (31). Albania is growing at a relatively low rate (0.6
%) due to a high level of emigration and a continuous decrease of the number of births. The Albanian population is young, with an average age of 32.5 years. The urban population grew to 48.7 %, while the rural population decreased to 51.3 %.(30). In the last two decades it is estimated that about 860,485 Albanians have migrated abroad, accounting for some 27.5% of the total population. The emigration provides, on average, 1 billion US$/year with an decreasing trend in the last few years (964 million US$ in 2011) (32). The country is administratively divided into 12 counties and 374 local government units (communes and municipalities). Albania submitted its application to be an EU candidate country in April 2009. 1.2 Economy The Albanian economy has been on a solid path of growth throughout the last decade and achieves, on average, high real growth and low inflation that typically ranges between 2 and 3,5%, and all in a relatively stable exchange rate of the Albanian Lek (ALL
48). Household
expenditures have increased more than threefold since. The absolute poverty rate fell to 12.4% while the unemployment rate remains relatively high. The Albanian economy is characterized by positive growth of about 3% (32).
Table 1.1: Macroeconomic indicators
Source: IAMO, www.theglobaleconomy.com
In rural areas, non-farm development is often informal and restricted to low-grade construction, an underdeveloped service sector and petty trade. SMEs dominate Albania’s economy, representing 99.6% of all registered businesses.
48
Exchange rates: 1 € = 140,1 ALL, 1 USD = 108.3 ALL during the preparation of the study. Bank of Albania. 49
Source: http://www.theglobaleconomy.com/Albania/indicator-NY.GDP.PCAP.PP.KD/ 50
Billion US$ 51
Source: https://www.cia.gov/library/publications/the-world-factbook/geos/al.html 52
Percent of GDP
Indicator 2008 2009 2010 201149
Real GDP growth rate 7.6 % 3.6 % 3.5% 3%
GDP (current prices in ALL millions) 1,087,867 1,143,373 6.14 6.3250
GDP per capita (USD) 4,073 3,765 7,669 7,861
Employment (thousand persons) 970 972
Annual unemployment rate 12.6 % 12.8 % 13.7% 13.3%51
Annual inflation rate 3.4 % 3.5 % 3.55% 3.45%
Average monthly gross salary (ALL) 38, 310 38, 310
Minimum salary ( 000 ALL) 18 19
Budget deficit (as % of GDP) - 5.7 % – 7.0 %
Public debt (% of GDP) 55.9 % 59.5 % 58.3% 58.9%51
External debt (% of GDP) 18.3 % 23.1 %
Average exchange rate (ALL/USD) 83.9 95.0
Average exchange rate (ALL/Euro) 122.8 132.1
Current account (excluding official transfers, in % of GDP) -15.2 -15.6
Foreign Direct Investment (Euro millions) 650 680 9.3652

212
Regional Rural Development Standing Working Group in SEE
1.3 Foreign Investment The total amount of Foreign Direct Investments (FDI) between 2000 and 2010 is estimated to be € 3 billion. The Public Procurement Law (PPL) takes into account the principles of non-discrimination and equal treatment, transparency and legal protection of interests of bidders on public contracts. With effect from 1 January 2008, Albania implemented a 10% flat-tax system, one of the lowest in Europe. The latter reform is one of the biggest steps towards the improvement of the business climate. Albania has signed Double Tax Treaty (DTT) agreements with 36 countries, out of which 30 are currently in force.
2 ALBANIAN AGRICULTURE AND FOOD SECTOR Agriculture remains one of the largest and most important sectors. Agriculture is undergoing a transition from a largely subsistence-based sector to a commercial sector. It contributed about 20% to the total GDP in 2011 which is high when compared to the EU and neighboring countries. The agricultural sector participation is down by 10% in the last decade (32). A substantial portion of agricultural production remains subsistence-oriented. The average farm size in Albania is very small at 1.2 ha. About 25% of farms have less than 0.5 ha; about 64% have from 0.6-2 ha, while about 11% of farms have more than 2 ha of land. In addition, these farms are composed by an average of 3.9 parcels, with an average size of 0.3 ha. The majority of farms (84%) combine crop and livestock farming, with the rest having crops only. Crops are cultivated by about 99% of farms. About 40% of farms have fruit trees, while about 32% of farms leave at least a portion of the farmland fallow (3). The overall number of farms has decreased by about 14% compared to 2000. The overall agricultural and food sector production has slightly increased during the last ten years, amounting to approximately € 2.14 billion, of which about 26% was in agriculture only. Livestock is the most important agricultural sub-sector, representing 52% of the total value of agricultural production, followed by field crops with about 29%, and then fruit trees with about 15% (3). Table 1.2: Family farms and area cultivated
2000 2008 Change
Number of farms 1,000 413 357 Area farmed 1,000 ha 429.5 420.4 0%
Average size of farms ha 1.04 1.20 15%
Source: MAFCP
2.1 Land Agricultural land (about 1.12 million ha) covers about 39% of the total surface of the country, of which 584.000 ha (about 52%) is arable land, 123.000 ha is under permanent crops and 415,000 ha (37%) is grassland. The forest area covers about 36% of the total surface of the country and other land about 25%. During the last 15 years, the agricultural area decreased by 1.4%, especially due to the expansion of urban areas on what was formerly agricultural land (3). Over 75% of Albania is hilly and mountainous, with most arable land and fruit tree areas concentrated in the coastal and western plains (about 43%). A further 34% lies in river valleys, while about 23% is in mountainous areas. Only 16% of the land lies below 100 m above sea level, 55% falls between 100 and 1,000 m, and 29% is above 1,000 m. About 76.5% of arable land is privately owned by rural families, and the remaining part (about 137,000 ha) is still state property, of which 110,000 ha are low quality and remote, while 27,000 ha is still available public land (3).
Graph 1.1: Agricultural area as share of total land area

213
Regional Rural Development Standing Working Group in SEE
Source: FAOSTAT
2.2 Irrigation The existing infrastructure of irrigation, drainage and flood protection has been designed for the irrigation of around 360,000 ha, ensuring drainage to 280,000 ha, and reduction of the risk against river and sea flooding to a potentially endangered surface of 130,000 ha. The total area with rehabilitated irrigation infrastructure is 200.000 ha, while the total area with rehabilitated drainage infrastructure is 220.000 ha. Out of a total 626 dams, 80 are rehabilitated dams for irrigation. The Ministry of Agriculture, Food and Consumer Protection (MAFCP) has currently transferred the ownership of 315 reservoirs with the respective irrigation schemes to local government units. Pilot Water Use Organizations have irrigation infrastructure in use for about 12.000 ha, while a considerable number are in the process of being established (1).
2.3 Plant Production Graph 1.2: Field crops structure
Out of the total arable land (some 584,000 ha), 33.2% was utilized for fodder production, 14,3% for wheat, and 8,4% for maize and other cereals, showing also a big share of unutilized areas and fallow land. The agricultural production has increased significantly in recent years. Field crops occupy about 31% of the total agricultural production. Cereals, vegetables and potatoes continue to be dominant crops (3).
Source: INSTAT
As a result of the supporting schemes applied, orchard production has been continuously increasing in recent years. It occupies about 17% of the total agricultural production, with grape and fruit trees the dominant aspects, as well as a continuous increase in olive production. The area under greenhouses has notably increased; the actual planted area with vegetables is 856 ha (3). 2.3 Livestock production Livestock is a strategic sector. It occupies about 52% of the agricultural output. The overall number of livestock has decreased in the last decade. The strongest decrease was observed in cattle. The number of small ruminants has slightly decreased during the same period, while the number of pigs has increased by more than 50% (3). The total output of livestock production has significantly increased as a result of improved production techniques.

214
Regional Rural Development Standing Working Group in SEE
Graph 1.3: Livestock structure
The number of commercial cattle farms (more than ten heads) is gradually increasing. The same tendency is observed in small ruminants with the number of commercially-sized flocks of sheep and goats increasing rapidly (3).
Source: INSTAT Table 1.3: Number of main livestock categories (thousands)
2000 2001 2002 2003 2004 2005 2006 2007 2008
Cattle 728 708 690 664 654 655 634 577 541
of which cows 446 441 435 443 435 430 420 396 360
Pigs 103 106 114 132 143 147 152 147 161
Sheep and goats 3,045 2,933 2,773 2,919 2,736 2,701 2,770 2,729 2,620
Source: MAFCP
2.4 Employment and labor in agriculture With a 47.8% (2011) (33) showing in total labor, the agricultural sector continues to be one of the most important sectors of the Albanian economy. The majority of agricultural production remains self-subsistence-oriented, while about 35 - 40% of the production is marketed. Approximately 12% of farms earn less than € 822 from crops and livestock sales and about 30% earn from € 82 to 820. 45% are employed in the agricultural sector; the average value added per employee is € 1,700 (12). Remittances are also an increasingly important factor in rural incomes. Around one third of farming households receive income from remittances. More than half of the population still lives in rural areas and is largely engaged in agriculture. This implies that agricultural development affects the socio-economic conditions of a large number of people. 2.5 Credits and loans availability A lack of loans in the agricultural sector is evident. The agricultural and food processing portfolio of banks is 1% of the total loans. Few banks are actively crediting agriculture. The system of micro-credits is not developed in rural areas; it covers only 10 – 15% of rural families and enterprises. The loans for agriculture from the banking sector were 0.33% of the GDP in 2010. Factors preventing banks from crediting farmers include high risks, lack of insurance systems for the production, no collateral, small loans requested, high interests of micro-credits (24%) and the distance of the banks from rural areas. The investments in most of the enterprises are financed by the farmers own capital or loans on a private basis (borrowed from relatives or friends). The Albanian government has established a Credit Guarantee Fund for Small and Medium Enterprises with the assistance of the Italian government. The US$3.5 million fund is used as collateral for companies applying for commercial loans. ALB Invest, the business promotion agency, has also established an annual fund of US$300,000 to assist exporting companies including agricultural exports (27).

215
Regional Rural Development Standing Working Group in SEE
3 FOREIGN TRADE OF AGRO-FOOD PRODUCTS
3.1 Foreign trade statistics The foreign trade regime and major regulations of Albanian foreign trade has been liberalized since 1990, following guidelines set by the EU. As a result of the ongoing process of harmonization of the Albanian customs regulations with the EU system, imports and exports of commodities are not generally subject to special authorization requirements. Exceptions apply to quotas or control requirements imposed through different bilateral or multilateral agreements signed by Albania. Licenses are required for specific commodities with restricted circulation within the country. Exports are not subject to any export taxes, fees or other barriers with a similar effect. Most imports of goods from the EU are tax-free. All imports are subject to VAT and some items, such as tobacco, alcoholic beverages and fuel, are also subject to an excise tax. Albania applies WTO rules on import licensing, e.g. to products affecting life, health and the environment. Since 1999, Albanian exports to EU countries have benefited from the asymmetric regime in the form of autonomous measures. The regime is applicable both to agricultural and industrial goods. Despite the high share of agriculture in GDP, Albania’s agricultural export performance is weak, with an export/import ratio of 1:10, leading to a trade deficit of about € 531 million (3). The largest Albanian export products are niche market products which require labor-intensive production methods (oleaginous herbs and seeds, frog legs, and fish). The domestic meat processing sector relies largely on imported raw meat (mainly from Brazil and Argentina). This is partially also the case for wine and vegetable oil. The EU is the main trading partner (77% of exports and 62% of imports) (3). Graph 1.5: Agriculture and food industry trade (€ million)
Source: General Directory of Customs
Table 1.4: Agriculture and food industry trade (€ thousands)
Description Exports Imports
2008 2009 2010 2008 2009 2010 Crops 24,806 19,851 23,571 170,129 131,006 149,174
Livestock 8,592 7,296 7,212 73,726 70,374 71,039
Agroindustry 27,057 29,752 35,673 376,280 337,861 380,204
Total 60,456 56,899 66,456 620,135 539,241 600,416 Source: General Directory of Customs
3.2 Memberships and agreements fostering foreign trade
Membership of the World Trade Organization
Member of CEFTA – Free Trade Agreements with Croatia, Bosnia and Herzegovina, Serbia, Montenegro 3.3 Customs

216
Regional Rural Development Standing Working Group in SEE
The General Directorate of Customs is responsible for the management of customs. The Albanian Customs Code is based on EU principles. Albania has been a member of the World Customs Organization since 1992. Since 1985, Albania has been a member of the TIR (Transport International Routier) Convention of the United Nations. Custom tariffs are applied to all goods specified in the nomenclature based on the Harmonized System (HS) of the World Customs Organisation (WCO). Albania has developed a relatively liberal trade regime for the agricultural and food sector which uses a of combined nomenclature for the classification of goods (HS-EU 2009), a simple tariff system composed of five tariff levels for the most favored nations (MFN): 0, 2, 5, 10 and 15%, respectively, and no tariff quotas for the MFN. Differentiated seasonal tariffs are used for a group of products of HS 07 and HS 08 and no import or export promotion/support measures for agricultural products are used within the MFN system (3).
4 GOVERNMENT PROVIDED FOREIGN INVESTMENT SUPPORT AND SUPPORT TO THE
AGRO AND FOOD SECTOR
4.1 Tax-free zones The current legislation regulates the establishment of economic zones and related matters and makes the establishment and the functioning of such zones more efficient. Economic zones are proposed by the Ministry of Economy and approved on a case-by-case basis by the Council of Ministers. During 2007-2008, the construction of five industrial parks was approved: Shengjin, Koplik, Vlore, Elbasan and Shkoder and one industrial and energy park in Spitalle, Durres. Industrial zones may be used for production, manufacturing, agro-processing, trade, export-import and supporting activities. Albinvest serves as a “one-stop-shop” for the licensing tenants. 4.2 Investment incentives Foreign investors willing to operate their business in Albania will benefit from the following factors:
No prior government authorization is needed and no sector is closed to foreign investment
There is no limitation on the share of foreign participation in companies
Foreign investment may not be expropriated or nationalized directly or indirectly, except for designated special cases, in the interest of public use and as defined by law
A flat corporate and personal income tax rate of 10% Foreign individuals cannot purchase agricultural land in Albania and have the right to lease agricultural land for up to 99 years. Foreign investors have the right to transfer abroad acquisitions originating from the investment, including:
revenues
compensations
payments deriving from an investment dispute
payments made pursuant to a contract, including loan and interest payments made according to a loan agreement
proceeds deriving from the sale or the partial or complete liquidation of an investment
dividends deriving from the reduction of the capital of the company in accordance with legislation
So-called special protection for foreign investments is granted to all foreign investments that exceed or are expected to exceed the value of € 10 million. This protection sets out that the foreign investor is substituted in the judiciary process by the Albanian state. Once this special state protection is granted, any injunction order issued by the court shall be executed over state properties. This special state protection is granted until 31 December 2014.

217
Regional Rural Development Standing Working Group in SEE
The “Albania 1 Euro” initiative aims to grant entry into the market for literally one Euro. This initiative focuses on offering state-owned properties (assets, natural resources, economic activities, fees for public services etc.) for a fee of one euro to qualified investors. Concessions for socially indispensable services such as the health service, education, water and waste disposal, infrastructure, energy and raw material production are also included in this initiative. 4.3 Government support for the agro and food processing sector
The agriculture and food sector strategy foresees payments in the form of grants or credits, interest rate subsidies (or credit guarantees) for investment in production technologies, new plantations or breeding animals, equipment, agricultural machinery and storage capacities, etc. Support is foreseen for the production and processing levels of the agro-food chain. The measures foreseen in the Rural Development Crosscutting Strategy 2007-2013 are organized around four main axes as follows:
Axis 1: Improving the competitiveness of agriculture, agribusiness and forestry, including: (i) modernization and restructuring of agriculture (ii) increase of value-added and quality in production and processing (iii) sustainable and efficient forest management (iv) increase of competence levels and employment
Axis 2: Preservation of cultural landscape and environmental protection, including: (i) preservation of landscape in less-favored areas (ii) environmentally-friendly agricultural practices
Axis 3: Improving the quality of life in rural areas and the promotion of diversification, including: (i) creation of employment opportunities in rural areas (ii) improvement of quality of life in rural areas
Axis 4: Participatory rural development, including support for: (i) preparation of local development strategies (ii) setting up and starting operation of platforms review of agricultural policy for rural innovation (iii) setting up and strengthening local action groups (iv) implementation of local development strategies (v) promotion of co-operation among regions (vi) development of international cooperation (3)
4.3.1 Market and direct producer support measures The new direct support measures introduced in 2007 have two objectives: firstly, to increase the area covered by fruit trees, olives and vineyards by new plantations; and secondly, to target the further development of the livestock and arable crop production sub-sector. Furthermore, the support schemes of 2007-2009 for the agricultural sector are as follows (3):
Market and direct producer support measures
Dairy cows 77 EUR/cow Official milk sales, Min. 10 max 30 milking cows ear-tagged and registered
Sheep 3.80 EUR/sheep Min. 50 heads ear-tagged and registered Official milk sales
Beekeeping 3.80 EUR/beehive min. 50 beehives
Olive plantations 125 EUR/ha of not less than 100 ha
Extra virgin olive oil 0.75 EUR/liter
Source: MAFCP
4.3.4 Structural and rural development measures New support measures were introduced in 2007 which aimed to promote and support investments in new plantations of fruits, olives and vineyards. In 2008, the range of

218
Regional Rural Development Standing Working Group in SEE
measures (schemes) and beneficiaries was expanded, as was the budget which further increased in 2009 and 2010. In the context of rural development the priority has been to increase the area planted by fruit trees and to increase farm/production size to achieve economies of scale. The Albanian government has foreseen the following support measures: (3)
Structural and rural development measures
Planting of fruit trees 50% of costs up to 3,100 €/ha Min. 0.4 ha for individual farmers and min 1 ha for groups of farmers
New vineyards 50% of costs up to 4,600 €/ha Min. 0.5 ha for individual farmers and min 1 ha for groups of farmers
Drip irrigation 50% of costs up to 2,280 €/ha intensive orchards, citrus, and olives
Organic certification 50% of costs up to 532 €/farm cultivated plants
Establishing wells 50% of costs up to 760 €/well citrus and olive trees
Modernization of greenhouse heating systems
2,300 EUR/ha - 11,400 €/ha Min. 0.3 ha
Plastic sheets for new greenhouses
2,280 EUR/ha Min. 0.2 ha
Mushroom production 50% of costs up to 3,780 €/ha
Interest rate subsidy for loans
50 % of the interest rate up to
€15,200
no longer than 3 years
Autochthonous varieties of vegetables
maximum of 1,520 €/ha 0.1-1 ha for individual farms, 1-5 ha for farmers groups
Autochthonous varieties of the grape
9,120 €/ha no less than 0.3 ha Varieties Kallmet, Debinë, Pules and Vlosh
Source: MAFCP
4.3.5 Other payments Other agricultural support measures
Reduction in obligatory social contributions
Annually calculated Self-employed in agriculture
Exclusion from land tax Excluded for a period of 5 years land area planted with fruit trees
Source: MAFCP
4.3.7 Export promotion and investments support
The Albanian Investment Development Agency (AIDA) was established in 2010 and has been operating ever since. The main objectives of AIDA consist of attracting foreign investment, increasing the competitiveness of the Albanian economy through supporting small and medium enterprises and innovation. AIDA’s direct contribution to the economic development of the country is emphasized through:
Facilitating and supporting direct investments in Albania
Increasing the competitiveness of small and medium enterprises (SME)
Promoting and providing assistance to exports of goods and services AIDA offers foreign and domestic investors comprehensive support for their investment projects as assistance with market analysis and potential sectors for investment, advice on suitable properties and locations, and assistance in identifying new and existing projects. AIDA also offers additional aftercare services aiming at successfully fulfilling the demands of foreign investors (16).
4.4 QAS and organic sector

219
Regional Rural Development Standing Working Group in SEE
Food safety and quality is another major challenge and one of the key factors limiting Albanian agro-food exports to EU countries, causing large trade deficits. Currently, the export market for organic produce from Albania relates very strongly to natural resources grown and collected in rural areas of the country. The most important are medicinal and aromatic plants. These crops relate to 250,000 ha of organically certified land for the wild collection of aromatic plants, involving thousands of collectors in different rural areas. A special export opportunity relates to organic olives, where currently two companies are involved which export mainly to Switzerland. Regarding support for organic farmers, BioAdria and the Institute of Organic Agriculture are the two most important service providers. Regarding organic certification, besides one Albanian certification body with international recognition, seven foreign certificating bodies operate exclusively for exports. In 2010 a total of 137 operators were certified for organic production (110 primary producers, 25 processors, 20 collectors, 18 exporters). Support measures for the organic sector are provided by MAFCP. The subsidies were related to the certification costs up to 2010. In 2011 the provided support per farm was fixed at a single contribution of 70,000 ALL/farm (equal to € 500) (20), regardless of the type or size of operations.
5 OVERVIEW OF THE TAXATION IN THE COUNTRY
5.1 Corporate income tax Corporate income tax (CIT) is paid by all Albanian entities on the profit realized in the territory of Albania and/or abroad. The taxable period for CIT purposes runs from 1 January until 31 December of each calendar year. The current CIT rate in Albania is a flat rate of 10%. CIT is self-assessed by the taxpayer by adjusting the accounting profit for all items of taxable income and non- deductible expenses. Taxable persons are all juridical persons, who are registered for VAT purposes, provided that they are not subject to the small business tax. Taxable profit is based on accounting profit adjusted for tax purposes with non-deductible expenses. Capital gains are treated as ordinary taxable income. Dividends and other profit distributions received from Albanian entities, as well as foreign entities subject to CIT, are exempted from CIT in Albania. Fiscal losses may be carried forward for up to three consecutive years. However, losses may not be carried forward, if more than 25% of direct or indirect ownership of the share capital or voting rights of the company is transferred during the tax year. An Albanian entity that makes payments to a non-registered foreign entity for services is required to withhold from the invoiced amount and pay to the tax authorities the withholding tax (WHT). The standard WHT rate in Albania is 10%. Reduced WHT rates are applied in cases where a Treaty for the Avoidance of Double Taxation on Income and Capital exists between Albania and the country of residence of the foreign entity. The payment of WHT might be avoided or reduced, provided that the conditions set up are satisfied. The reduced rates may vary from 0 to 5% (11). 5.2 Personal income tax Personal income tax is paid on the overall income earned from various sources in Albania and abroad during a calendar year, excluding the exempt income. Tax rates applied to income generated from employment are: 0 up to 10.000 (ALL) (€ 71), 0%, and above 10,001, 10% of the total amount. The minimum monthly salary in Albania is ALL 20,000 (€ 142) effective from 1 July 2011. Individual taxpayers, both residents and non-residents, are subject to personal income tax. Albanian law applies the principle of world-wide taxation. Non-resident individuals are taxed on income generated only in the territory of Albania.
Subject to compulsory social and health contributions (SHC) are employed persons, the self-employed, employers and persons who obtain regular income from different sources.

220
Regional Rural Development Standing Working Group in SEE
Foreign individuals who work in Albania under a local employment agreement are required to pay SHC in the same manner as local employees. Foreign employees have the right to choose between the Albanian social and health insurance scheme or another scheme of their home country. Employees pay social security contributions at the rate of 11.2%. The employee contributions are composed of 9.5% social insurance contributions and 1.7% health insurance contributions. Employers are liable to pay social security contributions for their employees at the rate of 16.7%. The employer contribution is made up of 15% social insurance contributions and 1.7% health insurance contributions. The monthly minimum and maximum salaries for social and health contributions purposes are 17,540 ALL (€ 125) and 87,700 ALL (€ 96), respectively (11).
5.3 Value added tax Value added tax (VAT) is a tax imposed by the government at each stage in the production of a good or service. The standard VAT period is one calendar month. The standard rate is 20% and applies to all goods and services not qualifying for reduced or zero rates. A reduced 10% VAT rate is applicable on the supply of drugs and health services provided by private or public institutions. Zero-rate VAT applies to the following supplies:
Export of goods
The supply of goods and services related to the international transport of goods/passengers
The supply of goods and services in relation to trading and industrial activities at sea
Services related to the transport of goods and passengers
Services related to international telecommunications The amount of VAT to be paid is calculated as the difference between the VAT applied to purchases (input VAT) and the VAT applied to sales (output VAT). If the input is higher than the output, then the difference is a VAT credit which can be carried forward to subsequent months. Otherwise, if the output VAT is higher than the input VAT, the difference represents VAT payable to the state. Taxpayers who carry out VAT activities as well as VAT exempt activities can credit only that portion of their input VAT that corresponds to the VAT subject activities. The VAT deferred scheme for machinery and equipment imported for the purposes of business activities is applicable for a period of up to 12 months from the moment of importation. The VAT may be deferred for a term beyond the 12 month period upon a decision of the Minister of Finance when certain requirements have been met. Taxable entities have the right to claim a VAT reimbursement, if the following two conditions are met:
The period in which VAT credits are carried forward exceeds three months
The total amount of VAT credits is equal to or above ALL 400,000 (€ 2.857) VAT taxpayers who are in a VAT credit position have the right to request the reimbursement of the VAT credit within 30 days after the request is submitted to the relevant tax authority. 5.4 Excise tax Any individual or legal entity that either produces or imports into the territory of Albania any commercial goods defined to be subject to excise tax is subject to excise tax in Albania. In the case of imports, the taxable base is the customs value of the imported goods, including customs duties. As a general rule for produced goods, the taxable base is the sales price of the goods. Goods subject to excise do not require the payment of excise in Albania when they are to be exported under the excise custom suspension regime, or imported by diplomatic representatives or by international organizations. The reimbursement of excise tax can be obtained on the following actions: the excise tax paid on fuel used by entities engaged in the constitution of energy resources for both its own needs and for sale; the tax paid on fuel used in greenhouses as well as in the production of industrial and agricultural products; plastic, glass, and mixed packaging, used as input in local recycling

221
Regional Rural Development Standing Working Group in SEE
industries for these materials, are reimbursed at the rate of 50% of the excise paid for the packaging (11). 5.5 Local taxes The local tax offices, as part of the municipalities and communes administration, are responsible for the collection of all local taxes. Local taxes are applied either as a percentage or as specific amounts and vary depending on location and/or the type of activity. Municipal taxes are applicable to SMEs and individual entrepreneurs that conduct business activities in Albania and have an annual turnover of less than or equal to ALL 5 million (€ 35,714). A fixed tax is applied for small businesses with an annual turnover less than or equal to ALL 2 million (€ 14,285), depending on the business category (11). 5.7 Real estate tax All physical persons and legal entities, whether local or foreign, who own real estate property in Albania, are subject to real estate tax. The tax amount is paid based on the size of the property, and varies depending on the district where the building is located. For real estate on land the tax is levied on each hectare and varies depending on the district where the agricultural land is located and on the land productivity categorization (11). 5.8 Tax on transfer of ownership rights for real estate For buildings, the tax is paid based on the size of the building that is the subject of ownership transfer, and varies according to the district and the purpose of use of the real estate. For other kinds of real estate, except buildings, the transfer tax is defined as 2% of the sale price.

222
Regional Rural Development Standing Working Group in SEE
I SUB-SECTOR – MEDICINAL AND AROMATIC PLANTS
1. DETAILED ASSESSMENT OF THE SUB-SECTOR
1.1 Harvesting and processing of herbs (aromatic and medicinal plants – MAPs) The collection of MAPs is well developed in Albania. The herbs and spices sector is perhaps the biggest in terms of the number of people involved. Although there are no official statistics, an estimated amount of 76,000 farmers are involved part-time in the collection of medicinal and aromatic plants. This number is less than the pre-transition involvement which reached more than 100,000 people. The collection of herbs accounts for an important share of the collector’s income. Albania offers a wide range of MAPs which are presently sold to international markets mainly as bulk and essential oil. Over 95% of MAPs are wild collections grown all over the country. A very limited share of the total production of herbs and spices is cultivated, although it appears that this is changing.
Table 2.1: Harvested/exported herbs in Albania
There are roughly 3,200 species of medicinal herbs in Albania, of which 250 species are harvested for commercial purposes. The most important export items are sage, oregano, juniper, thyme, savory and laurel. Transitional developments in the country over the last decade have contributed to a new design of the branch. As a result of the recent evolution of the sector, there has been a certain specialization of processors for selected MAPs. In recent years, competition among traders for the procurement of MAPs has increased, contributing to increased purchase prices (13).
Source: General Directory of Customs
1.2 Trade In general, countries of the region are a major source of MAPs as raw materials or semi-finished products suitable for many industries and across different sectors in the EU and the United States. Albania is the third largest exporter of MAPs in Europe, and is the second-ranked European country (after Bulgaria) with a trade surplus in MAPs. Albania is not a newcomer to the MAPs market and has held a major role in the international trade of MAPs for decades. Today, Albania only exports about 8,000 tons of medicinal herbs per year, valued at up to € 15 million. The export accounts for more than half of the timber and non-timber forestry products exported from Albania and 25% of all agro-food exports. Among those most important to the sector is sage, which accounts for about 50% of all exports, with an estimated volume of 2,000 to 2,500 tons/year with a total export value of almost € 2 million/year (10). Other important products include oregano, thyme and winter savory (13). The value of exports of MAPs has increased continuously during the last decade. Despite the alleged quality problems, exports are growing rapidly, indicating the strong competitive position in the market. The increase can be attributed to increased prices and also the higher volumes harvested, accelerated by local, national and international interest, the latter notably from the Western pharmaceutical industry (13).
Plants Ton/annum
Plant parts used
Salvia officinalis 1,000 leaves Origanum vulgare 800 herb
Satureja montana 500 herb
Thymus vulgaris 440 herb
Hypericum perforatum 424 herb
Rubus idaeus 380 leaves/fruits
Melissa officinalis 350 leaves
Juniperus oxycedrus 285 berries
Crataegus monogyna 240 leaves/berries
Rosa canina 200 fruits
Trifolium spp. 152 flowers
Primula veris 105 flowers
Orchis morio 100 tubers
Juniperus communis 85 berries
Sideritis raeseri 75 herb

223
Regional Rural Development Standing Working Group in SEE
The main countries of destination for exported MAPs and essential oil are USA, Turkey, Germany, Austria, Italy and France. Some fresh herbs are also exported to Switzerland. Table 2.2: List of importing markets for MAPs exported by Albania
Exported value (€)
Importers 2007 2008 2009 2010 2011
World 13677,25 15628,64 9510,77 10543,82 14007,4
Germany 6802,15 6206,6 3408,07 4264,67 6776,82
USA 1772,76 2415,49 1730,21 1674,09 1700,13
Turkey 1056,36 1964,88 1149,41 1154,47 1214,07
Macedonia 662,41 813,55 625,97 551,25 864,42
Italy 1060,74 1036,47 689,07 448,08 537,03
France 736,1 838,01 368,56 387,08 469,55
Czech Republic 129,13 366,33 397,24 330,6 427,9
Austria 75,14 71,36 97,52 314,03 382,67
Poland 124,75 351,38 132,65 139,32 363,29
Switzerland 176,55 232,44 119,75 178,48 180,21
Bulgaria 40,12 128,45 49,48 85,85 152,21
Croatia 205,73 358,18 168,5 154,38 152,21
Greece 83,17 256,23 5,74 17,32 127,8
Source: ITC calculations based on UN COMTRADE statistics
The main international trade for spices and herbs is dried and in crude form, cleaned but not further processed. It is estimated that about 85% of the trade is in this form. The remainder is crushed or ground spices, essential oil or oleo resins. The main streams of herb-based products are spices, personal care products and herbal teas as well as nutritional supplements. The MAP may be reported in two categories if they are imported for sales in herbal shops or pharmacies and also if they are used in the production process to extract chemicals used in traditional medicine processing. Different target markets demand different types of plants. For instance, more than 42-50% of all sage imported by the USA comes from Albania, as well as 70% of all the wild thyme imported in Germany, which is the main European market for medicinal and aromatic plants (8). There are also differences in the markets depending on the intended use of the MAPs. France is a more important market for secondary processing and the world’s most significant market for essential oil, while the Italian market is more closely associated with cooking and herbal medicine. A share of MAPs exports are processed further and then re-exported to other countries.
Importers 2007 2008 2009 2010 2011
Exported quantity, tons
World 8095 8367 4855 5565 7377
Germany 3625 2949 1697 2031 3412
Turkey 812 1166 622 691 820
USA 959 1252 705 639 690
Macedonia 382 441 327 273 456
France 437 419 208 219 281
Czech Republic 118 195 206 206 253
Italy 617 507 365 277 242
Poland 153 305 101 112 203
Greece 82 259 49 69 156
Bulgaria 31 133 35 97 148
Slovakia 82 83 63 71 129
Croatia 122 171 86 92 108
Austria 27 29 28 57 68
Serbia 50 23 56 112 65

224
Regional Rural Development Standing Working Group in SEE
Albanian MAPs in general have prices significantly lower than those of the rest of the world. Low prices are attributed, to a large extent, to poor post-collection practices (involving sorting, cleaning, varietal purity, phytosanitary conditions, food safety treatments, freshness, moisture level, etc.), that can affect the quality characteristics. The demand for MAPs on the domestic market is limited. A wide range of MAPs is commonly sold on fresh fruit and vegetable markets and other retail outlets. The main products traded on the domestic market are herbal teas and spices used for cooking. At present, tea and salep are packaged by Albanian companies and sold in retail outlets, including supermarkets as well as restaurants. Other herbs and spices are sold in fresh fruit and vegetable markets, packaged in simple plastic bags.
2. SUPPLY CHAIN DESCRIPTION A schematic of the supply chain and parties who directly support or have an effect on the performance of the chains is depicted below.
Source: SWG
Supply chain role players
Banks and lenders
Certification bodies
Export and business promoters

225
Regional Rural Development Standing Working Group in SEE
2.1 Supply chain actors
2.1.1 Regulators of the supply chain The Albanian government and public institutions show very limited involvement in the MAP sector despite its importance. The development of the sector is not being embedded in the wider framework of Albania’s rural development strategy. 2.1.2 Gatherers/harvesters The gatherers collecting the herbs are mostly women and children from remote regions of Albania’s rural population. Apart from growing agricultural products or rearing livestock, commercial picking of MAPs is one of the ways of improving the gatherers’ income. In some rural remote areas, 80% of the farmers are involved, to some extent, in the harvesting and collection of MAPs. One harvester can gather 15 kg of natural sage per day. One person can collect in a year the equivalent of 2,000 US$ during three and four months of the harvest season. This figure is similar to the minimal wage in Albania (13). Usually gatherers do some initial sorting and cleaning, for drying and storing (up to a metric ton of herbs) until delivery to the consolidators. Drying takes place in open space under sunlight, while some gatherers have constructed storage houses that can store up to 30 metric tons. Generally, gatherers sell to consolidators, however, when harvesters are located in the proximity, processors may buy quantities directly from the harvesters, bypassing collectors. Personal trust is a key factor in the relationships between gatherers and consolidators/processors. Gatherers are generally not practicing proper harvesting and drying. Products (such as thyme, oregano and winter savory) are characterized by quality problems as they are often not collected at the optimal time or may be poorly cleaned and dried. Sage is frequently harvested too early, affecting its quality. Although sage ripens at the beginning of July, farmers harvest it in June and sell it in July. Gatherers often cut the whole plant instead of only the leaves, damaging the plant’s regeneration potential and future production. Most harvesters collect plants in plastic sheets which they dry in open air under direct sunlight, although sage should be dried in shadow and not exposed to sunlight. 2.1.3 Consolidators There are around 160 individuals or companies who collect herbs from the gatherers. Their main job is to accumulate volume. They usually provide some other services such as grading, re-packing and transportation. They are usually equipped with weighing scales. Since this is a part-time activity, very often the assembly of goods in remote areas is conducted by owners of village retail shops. They store the plants in their warehouses, which are the typical warehouse buildings of former state-owned co-operatives. In each district there are at least two to four main collectors who each may accumulate up to 20 - 100 tons annually (13). Consolidators have established regular supplier relationships with processors, traders and exporters. However, they may supply different customers with different products or they may switch to another buyer who offers better prices. The margin they charge is usually negotiated with processors, and on average it varies from 10 to 15% depending on the degree of competition (13). In some cases major consolidators have even sold directly to foreign buyers.
2.1.4 Processors There are 27 herb processing companies which are supplied by the consolidators or gatherers. Large processors have collection agents or branches in selected districts. Most processors are collectors who have managed to enlarge their business. In other cases, these companies are small joint ventures between local collectors and foreign traders. Herb processing is small, with processors employing on average 11-20 workers. The average turnover is 100 to 500 tons, valued at € 0.5 – 1 million/year (10). Most processors use traditional low tech and labor intensive technology, and raw materials represent more than half of the total operating costs.

226
Regional Rural Development Standing Working Group in SEE
Processors operate processing lines to perform cleaning and packaging operations. A typical cleaning and packing line first performs pre-cleaning tasks, i.e. the removal of stalks, elimination of other grasses, dust and stones and the elimination of other physical impurities. The herbs are then pressed and packaged, usually in 50 kg sacks (13). Processors are not adapting and investing to stay competitive in the international environment. Deficiencies in standards and practices result in unit values lower in comparison to competitors in other countries. Graph 2.1: Markups for different parts of the supply chain
Small processors mostly sell to large export companies in Albania but on some occasions they also sell directly to foreign buyers. Some medium (five - seven) and the two large-sized processors are exploring foreign markets. Alb Ducros is the largest of these companies and enjoyed a near monopoly of the export market. However, in the last decade, other operators have entered the market, increasing competition (13). Source: Imami, Leonetti, Stefanllari The position of most large- and medium-sized processors on international markets is that of suppliers of raw material. Few companies add value to their products through organic certification and through the production of essential oil, etc. Payments are usually immediate and made in cash along the supply chain. Sometimes major exporters lend capital in advance, especially for key products. Yet in exchange for the advance payment, the harvesters must provide products exclusively to the collector and at lower prices.
Cultivation In addition to arrangements with regular consolidators, large- and medium-sized companies have contract production arrangements with a number of farmers who cultivate limited surface areas. The cultivation of herbs has the potential to control (and lower) production costs, the capacity to improve the quality of raw materials and to assure continuous and expanding volumes. Few herbs are in sufficient demand to encourage their widespread commercial cultivation. During the planned economy, herbs were commonly planted. However, the cultivation nearly ceased after the country’s transition. From the 1990s, competition has pushed trading companies to again invest in cultivation. Accurate data on the volumes cultivated is nonexistent. According to the most recent estimations (in 2008), there are a couple of hundred hectare with oregano and thyme, and a few tens of hectare with sage and lavender. The total area does not exceed 500 ha (13). This activity takes place in different seasons of the year. The large operators distribute free seeds to farmers in order to increase production.
Essential oil 15 small-, medium- and large-sized processing companies produce between 35 and 40 tons of essential oil annually (13). All processors use steam distillation. The medium- and large-sized producers of essential oil operate their own distilleries but they also buy

227
Regional Rural Development Standing Working Group in SEE
essential oil from smaller processors. For the most part, stems are used in the distillation process as dried leaves are exported as a separate product. The production of essential oil was performed in Western countries a decade ago. The output was regarded as a ’partially-finished’ product. Therefore, some essential oils are today considered to be a commodity, not profitable enough to be processed in the wealthiest countries, and their production is shifting towards the originating countries.
2.1.5 Exporters There are about ten export companies that deal exclusively in herbs (10). The bulk of the trade enters the EU through a small number of major brokers and trader/importers. In the past few years, direct trade between medium-sized and large producers/exporters in developing countries and grinders/manufacturers in consuming markets has become more prevalent. Manufacturers/importers are increasingly moving away from dealing with many small growers, choosing to deal with providers of high quality, high volume, and a consistent product. Within the European spice and herb market, the German firm, Fuchs, is the market leader, holding about 10% of the total market, followed by Unilever and McCormick (10). The exporters are represented through an existing association. The association does not have any significant activities besides its participation in negotiations on prices.
2.2 Current constraints and limitations
Although many producers claim to comply with the ASTA quality standards, their product quality is perceived to be lower. This disadvantage can be ascribed to underdeveloped processing practices. Partially processed products are often sold in bulk to Turkey where value is added using relatively simple processing techniques, before being sold to end consumers. This loss of opportunity is widely recognized. Given that they deal with foodstuffs for export, working conditions are often below what is required by regulations and/or good practices. With the EU approximation, Albania will have to tackle this problem through the introduction of HACCP at least in the upper segments of the supply chain. Lack of policies (specific development strategy or action plan), addressing the sector and in particular its sustainability is evident. Ideally, such a strategy should be embedded in the wider framework of the Rural Development Strategy of Albania 2007-2013, which is the basis for public investments and facilitating private investments in rural areas. Despite the sector's importance for economic and rural development, there is no support scheme. Limited self-governance is also an important issue. The sector association, mainly composed of exporters, does not offer the provision of services and building of knowledge on sustainable use in operators (13). Without a strong trade association, the quality of supply, proper training in collecting, drying and storing quality of the products will not improve. The buyers need to help train gatherers to maintain higher standards, and must also be willing to pay more for higher quality herbs. Limited training is provided exclusively by foreign development projects. Increased cultivation is expected to continue in the next decade. Technical assistance is needed to improve production quality and efficiency The large-scale cultivation could strongly impact the business models, market environment, perspectives, rural development and environmental protection in the sector. The capacity and the interest in making such analyses go beyond the decision criteria used by individual companies. Many of the herb species being collected in Albania are protected by the Convention on International Trade in Endangered Species (CITES). Albania is not yet a signatory to this agreement (18). Large areas of wild medicinal and aromatic plants are being damaged because of improper harvesting practices and a lack of control by institutions. Other problems include environmental damage, diminishing quality due to over-picking, and a decline in certain species of MAPs.

228
Regional Rural Development Standing Working Group in SEE
The authorities need to clearly define the picking areas and the species of MAPs according to their value (13). In Albania’s lesser developed mountain regions, migration, especially among young people, is rife. Abandonment of the rural areas may eventually lead to a lack of gatherers, in turn affecting the supply. 2.5 Solutions for the identified constraints and limitations A mix of interventions at farmer, industry and sector level are feasible. The table below lists the compounded constraints and limitations and ways to address them.
3. SWOT ANALYSIS
The following sub-chapters illustrate a SWOT analysis, based on the above factual assessment of the sector, taking into account EU accession and the ultimate goal of securing the sustainability of the sector.
3.1 Production and supply of raw materials
3.1.1 Strengths
Favorable climatic condition, export industry and long tradition
Raw materials supply
Labor for harvesting available at low cost
Highly competitive prices
Free tariff access with CEFTA and EU markets
EU pre-candidacy fostering compliance with regulations and increasing competiveness
3.1.2 Weaknesses
Little cultivation efforts
Harvesting and post-harvest practices are not up to international standards
Limited value added
Many small unorganized harvesters are difficult to deal with
Education in harvesting techniques, QAS and cultivation is insufficient
Reducing working force due to rural depopulation
Overharvesting in certain areas
Lack of capital across the supply chain
Export is predominantly in bulk
Dependency on foreign agents for marketing of products 3.1.3 Opportunities
Constraints Why does this prohibit development
How can this problem be solved
Lack of vertical and horizontal integration
Affected quality, reduced effectiveness
Combination of vertical and horizontal integration
Lack of application of ASTA , underdeveloped processing practices
Affected quality Implementation of ASTA quality standards
Sales in bulk No value added, limited profits Introduction of processing practices
Limited application of food safety standards
Less appreciated product over prices
Introduction of food safety standards along the entire supply chain
Lack of policies on sustainable development
Unsustainable harvesting Introduction of the sector in strategic policies and actions plan
Lack of knowledge on collecting, drying and storing
Affected quality Training on appropriate collecting, drying and storing
Limited investments in cultivation
Dwindling supply, limited sustainability
Investments and training in cultivation

229
Regional Rural Development Standing Working Group in SEE
Transfer of processing industries from most developed to source countries
Investments in modernization improving quality of the products
Producing added value products
Introduction of QAS
Development of reliable cultivation of herbs
Good investment incentives for foreign investors and favorable taxation policy
Training in harvesting and processing can improve the output of the companies
Demand from markets is increasing with growth of export value/quantities
3.1.4 Threats
The anticipated growth of average wages in coming years will increase production costs
Depopulation and aging in rural areas (leading to regional labor shortages)
Farms cannot develop to the level of international competiveness
Herb vegetation is permanently damaged due to overharvesting
4. COMPARATIVE ADVANTAGES
Price competitiveness for production of certain plants
Limited competitors in CEFTA region
Large workforce in the rural areas
Experience in cultivation of herbs
The low average wages on national level contribute to the low cost of the source material
Traditional relations with largest importers
5. INVESTMENT POTENTIALS
Companies indicate that they need investment to increase production and improve quality. Current production systems usually do not comply with modern business standards and consequently do not result in high quality products. This situation can be considered an opportunity for medium-sized investments. Investments in cleaning and sterilization facilities are a definite consideration for preserving export as well as expanding and modernizing the processing. Investment in the Albanian herbs sector should not be considered as an isolated activity concerning processing. Investors should also address supply chain management, including the development of market intelligence, quality measures with gatherers and collectors, the development of cultivated production and quality and efficiency improvement at processing level. Investments into the quantity and range of processed products, particularly essential oil, are also viable. However, joint ventures should aim at medium-scale as small units are not usually profitable due to their limited output when compared to the level of technical expertise and management skill required to integrate such a complex function into existing businesses. The possible entrance of larger foreign companies in the Albanian MAP market is feasible through subsidiary companies. Foreign investors with sufficient and larger financial, organizational and technical resources could easily compete with the local competitors. Major investments are now being made to transfer processing activities to source countries. Such investments are ongoing in Turkey, Bulgaria and Egypt, with larger production facilities, a better developed industrial base and better access to capital than in Albania (10). 6. MARKET OPPORTUNITIES The sub-sector is a consolidated and growing agribusiness. For the foreseeable future, the international market will remain the primary target for sales of Albanian MAPs. The sub-sector has grown in both size and efficiency in the last decade and in parallel, western European nations have almost doubled their imports of MAPs.

230
Regional Rural Development Standing Working Group in SEE
The international market demand can vary for certain herbs. The market demand for sage, though, is stable, and the total quantity exported is dependent upon the amounts collected annually.
Table 2.3: List of importers for medicinal plants (€ thousands)
Source: ITC calculations based on UN COMTRADE statistics
There is a steady market demand for oregano, thyme, winter savory, blueberries, lemon balm, rosemary, wild apple, juniper and dog rose. Consolidation processes are continuing on the international market. The result will be a few conglomerates of large companies which will seek to expand the co-operation with large-scale suppliers such as Albania (10). Graph 2.2: Prospects for market diversification for herbs exported by Albania
Source: ITC calculations based on UN COMTRADE statistics
6.1 Main competitors The re-export of MAPs is an essential part of the business throughout the world. This is evident from the review of the exports in Europe. Albanian exporters have not yet developed the agribusiness management practices to respond to this challenge. Regional competitors for Albanian exports primarily include Bulgaria and Turkey, and to a smaller degree Serbia and Macedonia.
Importers 2007 2008 2009 2010 2011
World 1310225 1359482 1368340 1682096 1829463
USA 180633 187661 182214 201947 212110
Hong Kong, China 130623 118963 126122 161938 173764
Japan 86072 100939 104717 126865 160231
Germany 114272 123272 134009 144855 158435
Singapore 60660 52407 51257 66021 90075
China 25229 27500 28787 53426 83955
Chinese Taipei 50942 41127 47186 59851 74698
Vietnam 6328 6258 7962 67235 64732
France 58370 63820 57019 62563 61237
Canada 37122 43117 48280 53557 59828
Republic of Korea 40428 36610 35801 56020 56326
Italy 48730 51409 41804 40323 54911
Malaysia 38864 32403 36276 49491 52460

231
Regional Rural Development Standing Working Group in SEE
In the downstream of the sub-sector, Albanian operators have become stronger over the last ten years but their competitors in other Balkan and Mediterranean countries have grown more quickly and have developed in a more structured manner. In addition, competition for the main markets (Germany, the United States, Italy and France) is becoming fiercer (13).
Table 2.4 List of exporters of MAPs in 2011
Exporters 2007 2008 2009 2010 2011
Exported quantity, tons
World 623519 No Quantity 568356 No Quantity No Quantity
Germany 18361 18865 17986 18953 20013
Poland 18058 18274 16449 16069 13394
Bulgaria 9217 8366 7690 10695 10098
Albania 8095 8367 4855 5565 7377
France 8312 6716 6199 6825 6546
Spain 4923 6177 5508 6537 6378
Netherlands 2631 4243 4986 5785 4174
Belgium 4154 3911 3528 3504 4010
Ukraine 2294 3451 3122 3181 3938
Italy 2214 2647 3562 2786 3330
Austria 3866 2586 2140 3121 3094
Turkey 3001 3331 3587 3674 3636
Czech Republic 2145 1259 3215 2816 1727
Serbia 1120 1156 1020 1451 1691
Croatia 1381 1969 1506 1500 1418 Source: ITC calculations based on UN COMTRADE statistics
7. SUB-SECTOR GROWTH POTENTIAL
7.1 Size and productivity The growing conditions are excellent and the production process is very labor intensive. While the current performance of the sector is reasonable, improvement may be expected through an improved supply chain management. The collection system can be improved in order to enhance the quality of the end product. A lack of processing facilities has been a factor that prevented Albania from offering higher added value to its export customers. Further growth of the production and trade of processed products can be expected as investors shift primary and secondary processing to source countries. Investing in processing will increase the value of the exports without a further increase of the supply. For some herbs, cultivation is a more efficient option than collection in the wild, offering new opportunities for growth. 7.2 Labor and skill available locally, and improvement possibilities Albania is the world’s largest exporter of sage and one of the leading exporters of MAPs in Europe. Still, because of competition and migration, the medicinal herbs industry is shrinking. In contrast, traders’ margins have already decreased and the share of final value is staying with farmers who already obtain about 20% higher prices for sage compared to two - three years ago. This trend is expected to counterbalance the loss of labor for wild plant gathering, with mild effects on the collection capacity (14). However, this has already resulted in sage in high hills and mountain areas being harvested less, while wild MAPs nearer to villages are over-harvested.
8. PRODUCTION- AND PROCESSING-RELATED INPUTS Packaging such as paper/carton packages and bags is both imported and offered by several domestic producers.

232
Regional Rural Development Standing Working Group in SEE
Annex 1 – International statistics on Albania and its agriculture Albania and Albanian agriculture in brief
Population 3,002,859 The World FactBook, 2011
Population (urban) 52% The World FactBook, 2010
Population – (rural) 48% The World FactBook, 2010
Currency Lek (ALL) The World FactBook, 2011
Languages Albanian, Greek, Vlach, Romani, Slavic dialects.
The World FactBook, 2011
Total GDP (US$ bn) 13.3 The World FactBook, 2011
GDP per Capita (US$) 7,800.0 The World FactBook, 2011
Real GDP Growth Rate 2.5% The World FactBook, 2011
Consumer Price Inflation (%; av) 3.9% The World FactBook, 2011
Agriculture GDP % of Total 21% The World FactBook, 2011
Total Labour Force 1,053,000 The World Factbook, 2010
Agricultural % of Labour Force 48% The World Factbook, 2010
Unemployed % of Labour Force 13.3% The World FactBook, 2011
Total Area 2,875,000 Hectare (ha) FAOSTAT, 2009
Total Agricultural Land 1,204,029 Hectare (ha) FAOSTAT, 2009
Agricultural Land % of Total Land 42% FAOSTAT, 2009
Arable Land + Permanent Crops 699,000 Hectare (ha) FAOSTAT, 2009
Arable Land + Permanent Crops % of Total Area
24% FAOSTAT, 2009
Arable Land 612,000 Hectare (ha) FAOSTAT, 2009
Arable Land % of Total Area 21% FAOSTAT, 2009
Irrigated Land 365,000 Hectare (ha) FAOSTAT, 2009
Irrigated Land % of Agricultural Land 30% FAOSTAT, 2009
Cow’s milk, whole, fresh 930,000 Metric tonnes FAOSTAT, 2010
Maize 362,000 Metric tonnes
Wheat 294,900 Metric tonnes
Potatoes 208,000 Metric tonnes
Watermelons 199,364 Metric tonnes
Tomatoes 199,283 Metric tonnes
Total Export of Goods FOB 1.09 billion US$ FAOSTAT, 2009
Agricultural Exports 60 million US$ FAOSTAT, 2009
Agricultural Exports % of Total Exports 5% FAOSTAT, 2009
Major Exports (tonnes)
Beverage non-alc. 1,767.0 FAOSTAT, 2009
Tobacco, unmanufactured 649.0
Hides Wet Salted Cattle 3,276.0
Hen eggs, in shell 1,825.0
Olives Preserved 1,007.0
Skins With Wool Sheep 514.0
Total Import of Goods FOB 4.6 billion US$ FAOSTAT, 2009
Agricultural Imports 774.3 million US$ FAOSTAT, 2009
Agricultural Imports % of Total Imports 17% FAOSTAT, 2009
Major Imports (tonnes)
Wheat 267,257.0 FAOSTAT, 2009
Cigarettes 4,064.0
Sunflower oil 37,957.0
Pastry 14,164.0
Cattle meat 1,378.0
Sugar refined 43,574.0

233
Regional Rural Development Standing Working Group in SEE
Annex 2 - References:
(1) ALBANIAN AGRICULTURE Fact sheet - Ministry of Agriculture, Food and Consumer
Protection – 2011
(2) Export of agricultural and food products – INSTAT – 2011
(3) Agriculture in the Western Balkan Countries – IAMO – 2010
(4) Statistical yearbook – INSTAT – 2011
(5) Albania - Agriculture and Enlargement - European Commission– Agriculture and Rural
development - 2011
(6) ALBANIA Country Report - ARCOTRASS- Consortium – 2006
(7) Medicinal and Aromatic Plants of South-East European Countries – AMAPSEEC – 2006
(8) INTERNATIONAL TRADE IN MEDICINAL AND AROMATIC PLANTS - R.J. Bogers, L.E.
Craker and D. Lange (eds.), - 2006
(9) THE SPICES AND HERBS MARKET IN THE EU - CBI – 2007
(10) The Agribusiness Sector in Albania - Inward Investment opportunities – UNDP - 2005
(11) Guide to doing business and investing in Albania – PWC – 2011
(12) POTENTIAL FOR DIVERSIFICATION OF THE RURAL SECTORS IN ALBANIA AND
MONTENEGRO – NACCON – 2011
(13) THE EVOLUTION OF THE MEDICINAL AND AROMATIC PLANTS VALUE CHAIN IN
ALBANIA - IMPLICATIONS FOR POVERTY REDUCTION AND RURAL DEVELOPMENT -
Drini Imami, Luciano Leonet, Andi Stefanllari – FAO – 2009
(14) Albania Enterprise Development & Export Market Services (EDEM) - ANNUAL REPORT –
2004
(15) Southeast Europe Investment Guide Albania - www.seeforum.org – 2007
(16) www.albinvest.gov.al
(17) www.instat.gov.al
(18) Medicinal and Aromatic Plants in Albania, Bosnia-Herzegovina, Bulgaria, Croatia and
Romania - Federal Agency for Nature Conservation - 2003
(19) Organic Agriculture in Albania – Sector Study – SDC -2011
(20) Albania - Strategic Policies for a More Competitive Agriculture Sector – WB – 2007
(21) Investment Horizons: Western Balkans - The World Bank Group/MIGA – 2006
(22) www.fao.org
(23) www.eastagri.org
(24) Export Development of High Value Agricultural Products of SEE Countries - CBI/SWG -
2011
(25) Food Industry Study in Southeast Europe – GFA- 2011
(26) www.trademap.org
(27) Lending Problems of Agriculture and Agro-Industry in Albania - Dr. Anila Mançka – 2011
(28) JUNGBLUTH, F., LUGG, D. (2002): Albania Rural Development Strategy: Underpinning
Growth and Sustainable Development, World Bank/FAO.
(29) MAFCP (2010): Statistical Yearbooks (various years), Statistics Department of the Ministry
Agriculture, Food and Consumer Protection, Tirana, Albania
(30) UNDP (2008): Country profile (various years)
(31) INSTITUTE OF STATISTICS (2009): Albania in Figure (various years), INSTAT, Tirana
(32) http://www.theglobaleconomy.com/Albania/indicator-NY.GDP.PCAP.PP.KD/
(33) https://www.cia.gov/library/publications/the-world-factbook/geos/al.html
i Kosovo* "This designation is without prejudice to positions on status, and is in line with UNSCR 1244 and the ICJ Opinion on the Kosovo declaration
of independence."