agricultural service firms: organizational characteristics...
TRANSCRIPT

AGRICULTURAL SERVICE FIRMS: ORGANIZATIONAL CHARACTERISTICS AND LINKAGES TO PBODUCTIOA AGRICULTURE^
Thomas A. Lyson Department of Agricultural Economics and Bural Sociology, Clemson University
ABSTRACT Using data from the 1978 Census of Agriculture and the 1978 Census of Agricultural Services, this paper examines some of the organizational characteristics of firms in seven agricultural service industry subgroups. Using the 48 contiguous states as units of analysis, an ecological analysis attempts to identify structure characteristics of farm systems that give rise to, and foster development of, off-farm agricultural service firms. Results show that considerable variation exists in the organizational and labor force characteristics across the seven industry subgroups. Other findings indicate that the spread of agricultural services in a state is positively associated with the proportion of farmland controlled by nonfamily corporations and with large-scale farming. Energy intOnsity and mechanization, on the other hand, are inversely correlated with the incursion of agricultural services in a state. Recommendations for future avenues of research in this area are offered.
Introduction
Production and distribution of agricultural products and commodities in the United States have been shaped by four interrelated trends: 1) the substitution of machinery and chemicals for production labor; 2) increased specialization of production along crop and animal enterprise lines; 3) increased concentration of production into a smaller number of operating units; and 4) increased reliance on off-farm industries and firms for production services (Lee, 1983; U.S. Department of Agriculture, 1981; Congressional Budget Office, 1978). Of these four trends, the first three have been subjected to increasing scrutiny by rural sociologists and have served to focus sociological investigations on what has become known as structure issues of American agriculture. The fourth trend, on the other hand, has received considerably less analytical attention by sociologists.
The failure to examine occupations and industries providing direct assistance and service in the production and marketing of agricultural products is unfortunate. There is good reason to suspect that large-scale, capital-intensive, and increasingly specialized farming in the United States is not only dependent upon large amounts
Support for this research was provided by the South Carolina Agricultural Experiment Station in conjunction with USDA/CSRS regional research project S-148.

Lyson
of manufactured inputs provided by nonfarm firms and industries (Goss, et al., 1980; Hamm, 1979; Meisner and Rhodes, 1974), but also it relies on a set of production service industries whose activities are designed to supplement, complement, and in many cases replace the labor and management input of the farmer (Rodefeld, 1982).
The Census of Agricultural Services, the best and most comprehensive source of data on these agricultural support industries, indicates that between 1974 and 1978 the number of agricultural support firms increased 52 percent. By 1979 there were more than 93,000 firms primarily engaged in performing soil preparation and crop services, veterinary and other animal Services, farm labor and management services, and landscape and horticultural services (United States Bureau of the Census, 1980). These 93,000 establishments had gross receipts of more than $7 billion in 1978 and employed more than 1 million workers on a full or part-time basis.
A full understanding of the structure of production agriculture in the United States necessitates increased attention to the conceptual and empirical linkages between production service industries and farm structure. This paper briefly describes the nature and composition of the production support sector, provides a descriptive overview of some of the organizational characteristics of these agricultural service industries, and tests a set of hypothesized relationships between structure and enterprise characteristics of state level agricultural systems and the proportion of gross farm receipts paid to various agricultural service industries. Data are from the 1978 Census of Agricultural Services and from the 1978 Census of Agriculture.
Census of agricultural services
The 1978 Census of Agricultural Services is the third such census taken for the United States. Data were collected via mail questionnaire from 93,220 U.S. agricultural service establishments. The Census Bureau estimates that this total constitutes 98 percent of all such establishments in the United States and the District of Columbia. The firms included are classified into 67 subgroups under Standard Industrial Classification (SIC) major group 07 -- "Agricultural Services."
For the sake of parsimony, the 67 subcategories are aggregated here into a sevenfold classification of establishments in the agricultural service sector of the economy based on their principal activities. Table 1 and the following provide a descriptive overview of the types of establishments included.
Soil preparation and crop production services include firms whose principal activities are plowing or land breaking, harrowing or seedbed preparation, fertilization and lime spreading, weed control, custom irrigation, and machine harvesting. They account for about 8 percent of

Table 1. Descriptive characteristics of agricultural service industry subgro~ips derived from the 1978 Census of Agriculture
Agricultural service industries
Establishments SIC codes (N) ( a )
Workers Payroll (N) (XI (8 (m) ( 9 0 )
Soil preparation and 07110-07119 7,986 8.6 599,951 8.3 59,482 5.6 172,438 6.7 crop production 07210-17229
Crop marketing 07230-07249 3,344 3.6 1,160,736 3.6 1,160,736 16.0 153,912 14.0
Large animal
Smll animal
Farm labor 07610-07611 1,882 2.0 441,235 6.1 316,127 29.7 287,213 11.3
Farm magement 07620-07629 887 1.0 225,880 3.1 46,374 4.4 98,848 3.9
Landscape and horticulture 07810-07831 46,584 50.0 2,639,954 36.4 317,016 29.8 947,248 37.1
Totals 93,120 100.0 7,250,920 100.0 1,064,972 100.0 2,550,87(! 100.0

Lyson
the establishments and gross receipts, 5 percent of the workers, and 6 percent of the payroll.
Crop marketing firms deal with shelling, drying, grinding, cleaning, sorting, grading, and packing agricultural products. Also included are cotton ginning and cotton pickery. This is a labor-intensive set of activities where 3.6 percent of the firms employ 14 percent of the workers.
Large animal services include professional veterinarv o~erations. hos~ital care. artificial insemination; pedigree serbices, slaughtering for individuals, sheep dipping, and poultry services. Animals include cattle, hogs, sheep, goats, and poultry. These establishments account for 7 percent of the firms and 7 percent of the gross receipts.
Small animal services also include professional veterinary activities, hospital care, artificial insemination, and pedigree services. They also handle boarding, showing, and training of horses, cats, dogs. Unlike the large animal services, small animal establishments cater more to pet owners than to farmers. As a group, these firms account for about 25 percent of all gross receipts.
Farm labor firms engage in supplying labor for agricultural production and harvesting. Not surprisingly, this is the most labor intensive of all agricultural service industries. The payroll, however, is not proportional to the number of workers. These firms account for 2 percent of all establishments and 6 percent of the gross receipts.
Farm management firms provide complete management and maintenance of citrus groves, orchards, vineyards, and other types of farm operations. The service is provided mostly to absentee landlords, farm estates, and farm trusts. In 1978 this was the smallest set of firms.
Landscape and horticulture firms engage in general lawn and garden maintenance for private residences and public lands as well as shrub and tree services. Also included are landscape architecture firms. This is the largest group of establishments covered by the agricultural service census, but it accounts for only about 36 percent of the gross receipts.
Organizational characteristics
More detailed information about the agricultural service

industry subgroups provided in Table 2 shows that considerable variation exists in their organizational and labor force characteristics. For instance, over 60 percent of the firms in the soil preparation/crop production, small and large animal, farm labor, and landscape and horticulture categories are owned or controlled by a single individual. On the other hand, most firms in the crop marketing and management subgroups are controlled by corporations. As might be expected, those industry subgroups dominated by corporate ownership generate proportionately more revenue (gross receipts) than those characterized by individual ownership (Table 1). And with the exception of farm labor firms, corporate dominated subgroups are more labor intensive than other industries.
Panel B of Table 2 shows that many of the industry subgroups rely heavily on seasonal or part-time labor (i.e., individuals working fewer than 150 days a year). Over 80 percent of the 316,127 farm labor workers, for example, are hired for fewer than 150 days. Soil preparation, crop production, crop marketing, and management firms also rely heavily on seasonal labor. Animal service firms, on the other hand, have a more stable work force. Over 60 percent of the workers in these firms are employed more than 150 days a year. No doubt the relatively steady demand for animal care, unlike the fluctuations in the crop cycle, enhance the chances for full-time employment for these workers. Additionally, the bottom half of panel B shows that firms in the crop marketing, farm labor, and farm management industries, on average, employ more workers per firm than the other industry subgroups, though most are employed for only short periods of time.
Finally, average annual wages for individuals working 150 or more days a year and those working fewer than 150 days a year were computed. Panel C shows that the most labor-intensive industry subgroups (i.e., crop marketing, farm labor, and farm management) have the lowest average wage rates. Further, with the exception of workers in the farm labor sector, who are generally employed by crew leaders or labor contractors, over 70 percent of the wages are paid by corporations. However, workers in the less labor-intensive categories in which corporations pay'a large share of the wage bill (i.e., soil preparation/crop production services and horticulture and landscape establishments) receive considerably higher wages. Highest average wages are paid in the animal service areas, which tend to be dominated by professional veterinary and para-veterinary establishments. Wages in animal service firms are no doubt kept high by the relatively skilled nature of the tasks performed.
Agricultural service industries and farm structure
To trace the linkages between agricultural services and farm structure, data from the 1978 Census of Agricultural Services were merged with the data from the 1978 Census of Agriculture (United States Bureau of the Census, 1981). Using the 48 contiguous states as units of analysis, an ecological analysis was developed to identify structure
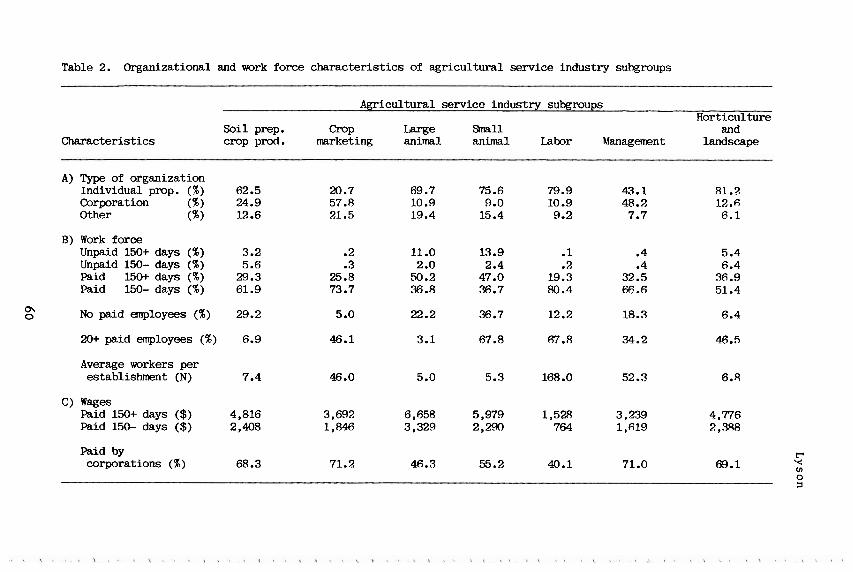
Table 2. Organizational and work force characteristics of agricultural service industry suhgroilps
Agricultural service industry subgroups Horticulture
Soil prep. m~ m e Small and Characteristics cropprod. marketing animal animal Labor Management landscape
A) Type of organization Individual prop. (%) 62.5 20.7 69.7 75.6 79.9 43.1 81.2 Corporation (%) 24.9 57.8 10 .9 9.0 10.9 48.2 12.6 Other (%) 12.6 21.5 19.4 15.4 9.2 7.7 6.1
B) Work force Unpaid 150+ days (%) 3.2 .2 11 -0 13.9 .1 .4 5.4 Unpaid 150- days (%) 5.6 .3 2.0 2.4 .2 .4 6.4 Paid 150+ days (%) 29.3 25.8 50.2 47 .O 19.3 32.5 36.9 Paid 150- days (%) 61.9 73.7 36.8 36.7 80.4 66.6 51.4
m o No paid employees (%) 29.2 5.0 22.2 36.7 12.2 18.3 6.4
20+ paid employees (%) 6.9 46.1 3.1 67.8 67.8 34.2 46.5
Average workers per establishment (N) 7.4 46.0 5.0 5.3 168.0 52.3 6.8
I
C) Wages Paid 150+ days ($) 4,816 3,692 6,658 5,979 1,528 3,239 4,776 Paid 150- days ($) 2,408 1,846 3,329 2,290 764 1,619 2,388
Paid by r corporations (%) 68.3 71.2 46.3 55.2 40.1 71.0 69.1 Y
V) 0 1

characteristics of farm systems that give rise to, and foster the development of, off-farm agricultural service establishments. Gross receipts of an agricultural service industry subgroup as a percentage of a state's gross farm receipts was computed as the main problematic variable for five of the seven industry subgroups listed in Table 1. Because the services of the small animal establishments and the landscape and horticultural firms are not directly linked to the production or marketing of agricultural products, these two subgroups were eliminated from consideration.
Selection of independent ( i e , farm structure) variables for the analysis was guided by literature that shows that large-scale farm systems devote more of their gross receipts for off-farm inputs (i.., energy, fertilizer, machinery, etc.) than do small-scale, less specialized units (Butte1 and Larson, 1979; Perelman, 1976; Fox, et al., 1968; Vollmar, et al., 1968). We expected that large-scale units would also spend proportionately more for agricultural services. This variable was operationalized as the percentage of farms in a state with annual sales over $100,000.
Further, we expected that the amount devoted to purchasing agricultural services would be conditioned by farm organization characteristics. Because of their large size, nonfamily corporate farms generally spend more for farm inputs than do family farms (Baker, 1976; Hubert and Hauck, 1973). We expected that some of these purchased inputs would be in the form of agricultural services. By definition, of course, nonfamily corporations purchase both labor and management. Percentage of total farm acres in a state operated by nonfamily corporations is used as an indictor of the importance of this type of farm organization.
Two additional independent variables, energy expenditure as a percentage of gross sales and value of machinery as a percentage of gross sales, are also examined. It was assumed that farming systems utilizing large amounts of off-farm production services are in effect substituting labor for capital (i.e., energy, machinery). Conversely, energy-intensive and highly mechanized farming systems would be less likely to rely on labor inputs (Lu, 1979). Consequently, we expected both of these measures to be inversely related to the amount of agricultural services used in a state.
The percentage of gross farm sales devoted to purchasing production services is, of course, related to particular enterprise characteristics. Labor services, for example, are more likely to be important in states with large amounts of fruits and vegetables. To eliminate any association that could be attributed to the mix of products sold, the proportion of gross sales in seven mutually exclusive and exhaustive groups are controlled. These seven groups are fruits and vegetables, grains, other crops, dairy, hogs, poultry, and cattle.

Lyson
Results
The analysis begins with an examination of zero-order correlations among the five dependent variables. Table 3 indicates that a strong relationship exists among four pairs of industry subgroups: soil preparation/crop production and crop marketing (r = .828); crop marketing and labor (r = .784); crop marketing and management (r = .636); and labor and labor and management (r = .940). More moderate associations are found between soil preparation/crop production and labor (r = .500) and management (r = .329) services. Large animal services, on the other hand, show a consistently negative relationship with other industry subgroups.
Taken together, these findings suggest a relatively high degree of interconnection among the crop-related production services. In broad form at least, it appears that the presence of a particular set of agricultural service firms in a state is associated with a wider set of complementary service firms in that state. Animal/livestock services, however, are not part of this service network. That is, states that devote a large share of their gross receipts to animal services do not devote a similar proportion to crop-related services.
The second part of Table 3 reports the partial correlation coefficients between four measures of agricultural structure and expenditures for various productions services, controlling for seven commodity groups. As expected, percentage of farmland controlled by nonfamily corporations is positively associated with agricultural service expenditures. Not surprisingly, this relationship is especially strong for labor and management services. Clearly, the incursion of nonfamily corporations into agriculture is associated with the growth and development of a specialized support service sector.
The percentage of farms with annual sales over $100,000 is moderately correlated with expenditures for soil preparation/crop production and crop marketing services, but not associated with other types of services. This set of correlations suggests that while large-scale farming is not necessarily dependent upon off-farm labor and management services, it may benefit from the availability of specialized crop and soil services.
Finally, both energy expenditures and the value of farm machinery as percentages of gross sales are inversely related to the amount spent for production services. These associations conform to our expectations and indicate that, in general, labor (in the form of production support services) is substituted for capital (in the form of energy and machinery) in many states.
Discussion
The growth in the number of agricultural service firms during the last decade suggests that this agribusiness sector is playing an increasingly important role in the production and distribution of farm products in the United States. Using state level data from the 1978 Census of

Table 3. Zero order correlations for the relationships among dependent variables and partial correlations between farm structure indicants and dependent variables
Agricultural Agricultural service industry subgrouips service industry
subgroup Soil b crop Crop market Large animal Labor hlanagement
Zero order Soil & crop - correlations Crop market
Jaxe animal Lab& Management
Farm structure indicants
Partial Comrate acres .288 correlations* ~ar'ge fams
Energy Machinery
*Proportions of gross sales of seven farm enterprises are controlled.

Lyson
Agriculture and the 1978 Census of Agricultural Services, this paper examined some of the organizational characteristics of firms in seven agricultural service industry subgroups and identified some linkages between a set of agricultural structure variables and the proportion of gross farm sales devoted to various production agricultural services.
At a descriptive level, considerable variation in organization and labor force characteristics was found across industry subgroups. Some industry subgroups (e.g., crop marketing, management) were characterized by corporate forms of ownership, while others (soil preparation and crop production, large and small animal, and horticultural) were operated primarily by individual proprietors. Perhaps the most interesting descriptive finding was the discovery of what appears to be a relatively large secondary labor market. The substantial number of low-wage and part-time workers suggests that employment opportunities in many of the agricultural service subgroups attract individuals who have few othey occupational alternatives. Although detailed background information about workers in this agribusiness sector is not readily available, based on what we know about other groups of agricultural workers (Pollack, 1981; Holt, 1979) we might expect to find disproportionate numbers of women, minorities, and less educated and less skilled workers in many of the agricultural service firms.
At a more analytical level, Table 3 identified a set of structural variables related to the amount spent for agricultural services. These findings showed that the spread of agricultural services, especially those directly related to production agriculture, was positively associated with the proportion of farmland controlled by nonfamily corporations as well as with large-scale farming. Energy intensity and mechanization, on the other hand, were inversely correlated with the incursion of production agricultural services in a state. If nonfamily corporations continue to make inroads into farming and if the proportion of large-scale farm units in a state increases, one outcome might be a proliferation of, and increased reliance on, the types of agricultural service firms discussed here.
The inverse relationship between energy use and mechanization and amount of money spent for production agriculture services specifies a particular type of structural differentiation within American farming. At one level these correlations indicate that production capital and labor are increasingly being shifted to off-farm control. At the same time, the increasing dependence on production services by certain types of farms may obfuscate actual energy use and mechanization on American farms, since these production resources have been transferred from the farm to an off-farm industry.
The findings reported here suggest that future research in this area is certainly warranted and would especially benefit from additional inquiry in two areas.
First, surveys of individual farm operators in different regions of the country that focus on the use of production agricultural services are needed. Areas that should be addressed include 1) the relationship of farm size,

enterprise mix, and other organizational/structural characteristics to the nature and range of services utilized; 2) the processes of adoption and diffusion of agricultural services in a given region; and 3) the personal characteristics of farm operators/managers (e.g., age, race, education, etc.) associated with the substitution of off-farm production services for on-farm labor and capital.
A second group of studies should focus on the agricultural service workers themselves. The fact remains that we know comparatively little about the one million workers and owners of these firms. Although this data may be difficult to obtain, the Public Use Sample of the U.S. Census and various Current Population Surveys might yield a reliable subset of agricultural service workers. In addition to providing a general social and demographic profile, the PUS and CPS data could address issues of recruitment, mobility, and socioeconomic processes among these individuals.
In sum, now is the time for rural sociologists to begin examining the emergence and growth of this sector of the agribusiness complex. There is no reason not to expect the various agricultural services discussed here to play an increasingly important role in American agriculture in the future. By focusing on the linkages between production services and farm structures as they emerge and develop, and the dynamics of the agricultural service work force as they evolve, we will be better able to respond to the need for information in the formation of future farm policy.
References
Baker, George L. 1976 "The invisible workers: labor organization on
American farms. Pp. 143-170 in R. Merrill (ed.), Radical Agriculture. New York: Harper Colophon.
Buttel, Frederick H., and Oscar W. Larson 111. 1979 "Farm size, structure, and energy intensity: an
ecological analysis of U.S. agriculture." Rural Sociology 44 (Fall): 471-488.
Congressional Budget Office 1978 Public Policy and Changing Structure of American
Agriculture. Washington, D.C.: U.S. Government Printing Office.
Fox, Austin, Theodore Eichers, and Paul Andrilenas 1968 "Extent of farm pesticide use on crops in 1966."
Agricultural Economics Report No. 147. United States Department of Agriculture, Economic Research Service.
Goss, Kevin F., Richard D. Rodefeld, and Frederick H. Butte1 1980 "The political economy of class structure in U.S.
agriculture: a theoretical outline." Pp. 83-132 in Frederick H. Butte1 and Howard Newby (eds.), The Rural Sociology of the Advanced Societies. Mountclair, NJ: Allanheld, Osmun.
Hamm, L. G. 1979 "Farm input industries and farm structure." Pp.
218-225 in Structure Issues of American

Lyson
Agriculture. U.S. Department of Agriculture, ESCS, Agricultural Economic Report 438.
Holt , James S . 1979 "Farm labor and the structure of agriculture." Pp.
143-149 in Structure Issues of American Agriculture. U.S. Department of Agriculture, ESCS, Agricultural Economic Report 438.
Hubert, Dick, and Peter Hauck 1973 "How Fred Andrew tills the soil with a computer."
Saturday Review (March):52-58. Lee, John E.
1983 "Some consequences of the new reality in U.S. agriculture." Pp. 3-22 in D. E. Brewster, W. D. Rasmussen, and G. Youngberg (eds.), Farms in Transition. Ames: Iowa State University Press.
Lu, Yao-Chi 1979 "Technological change and structure." Pp. 121-127
in Structure Issues of American Agriculture. U.S. Department of Agriculture, ESCS, Agricultural Economic Report 438.
Meisner, J.C., and V. J. Rhodes 1974 The Changing Structure of U.S. Cattle Feeding.
Columbia : Missouri Agricultural Experiment Station, Special Report 167.
Perelman, Michael 1976 "Efficiency and agriculture: The economics of
energy." Pp. 64-86 in R. Merrill (ed.), Radical Agriculture. New York: Harper Colophon.
Pollack, Susan L. 1981 The Hired Farm Working Force of 1979. U.S.
Department of Agriculture, ERS, Agricultural Economic Report 473.
Rodefeld, Richard D. 1982 "Who will own and operate America's farms?" Pp.
328-336 in D. A. Dillman and D. J. Hobbs (eds.), Rural Society in the U.S.: Issues for the 1980's. Boulder, CO: Westview.
United States Bureau of the Census 1980 0.5. Census of Agriculture: 1978. Vol. 3,
Agricultural Services. Washington, D.C.: U.S. Government Printing Office.
1981 U.S. Census of Agriculture: 1978. Vol. 1, Part 51 Summary and State Data, United States. Washington, D.C.: U.S. Government Printing Office.
United States Department of Agriculture 1981 A Time to Choose: Summary Report on the Structure
of Agriculture. Washington, D.C. : U.S. Government Printing Office.
Vollmar, G. J., G. A . Helmers, and R. Retzloff 1968 "Wheat production cost and economics of enterprise
size in growing wheat in the Nebraska Panhandle." Report S.B. 500. Lincoln: Nebraska Agricultural Experiment Station.