agricultural output aggregation at a crossroads?
TRANSCRIPT

Agricultural Output Aggregation at a
Crossroads?Insights from the Interface of Mathematics, Agricultural Modernization and Indigenous Knowledge, 1961-2005Modernization and Indigenous Knowledge, 1961-2005
by Moyo, D.Z., Edriss, A.K., & Moyo, B.H.Z.
Introduction
• Measurement of agric. GDP or output is almost always in monetary terms; local currency & PPP dollars, for example.
• Central question: need this always be the case?– Is there analytical power as it were in alternatives like tonne and wheat
unit measurement.
– Should we be searching for even more alternatives?
• Paper, in brief, engages debate about tonnage, wheat unit and I$ output aggregation/measurement.output aggregation/measurement.– Debate seems to be quietening down.
• Question; Key contribution = No! The debate need not quiet down.– and demonstrates that engaging this debate (further) can be
worthwhile.
– Also demonstrates use of IK to expand the frontiers of maths/science.
• 2 parts: resilience modelling and actual output.
Presentation Outline
1. Introduction
2. Methodologya. Data & data sources
b. MPP/MVP vs agricultural resilience
3. Results/findingsa. Resilience modellinga. Resilience modelling
b. Output correlation coefficients
c. Output graphs (superimposed)
4. Discussiona. Questions
b. Contributions to answers
5. Summary & Conclusion

Data & data sources
• All data from FAOSTAT, 124 countries, 1961-
2005 (FAO, 2011).
• Key data includes output aggregated in tonnes,
wheat units and I$.
• Zone demarcation: agric tractors + chem.
Fertilisers: HIs, Intermediates & LIs.

MPP/MVP measurement of agricultural resilience
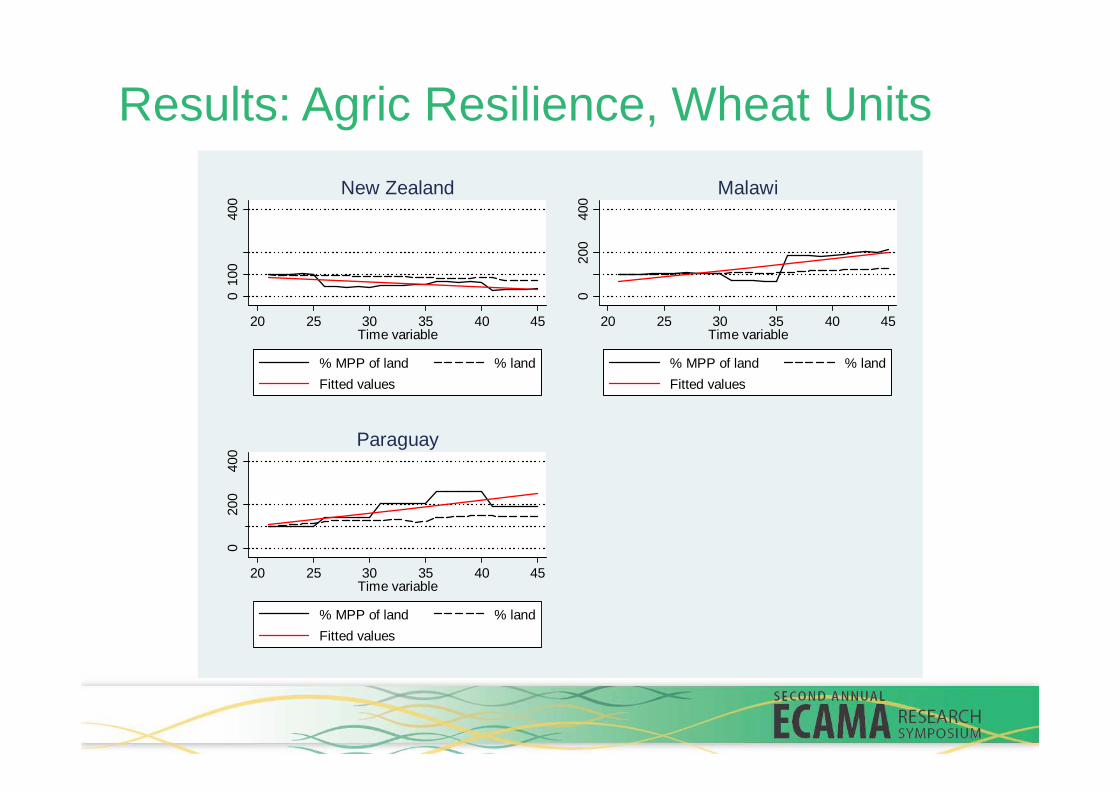
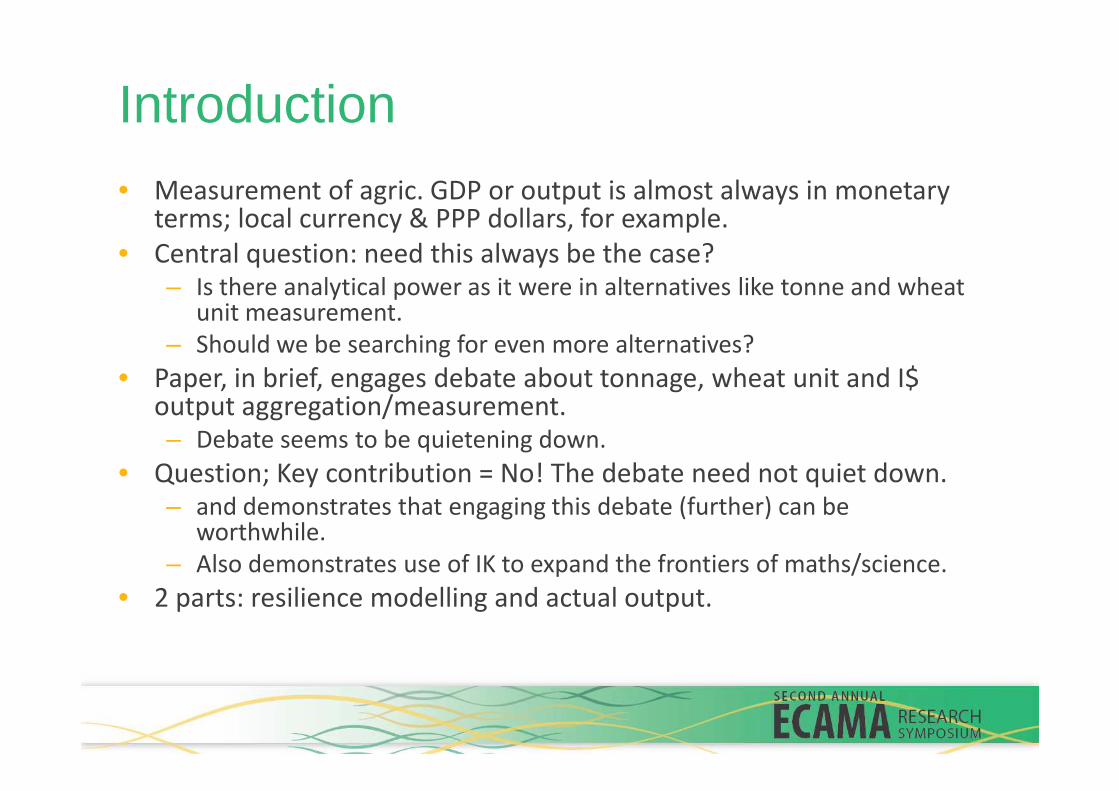
Results: Agric Resilience, Wheat Units
010
040
0
20 25 30 35 40 45Time variable
% MPP of land % land
Fitted values
New Zealand
020
040
0
20 25 30 35 40 45Time variable
% MPP of land % land
Fitted values
Malawi
020
040
0
20 25 30 35 40 45Time variable
% MPP of land % land
Fitted values
Paraguay
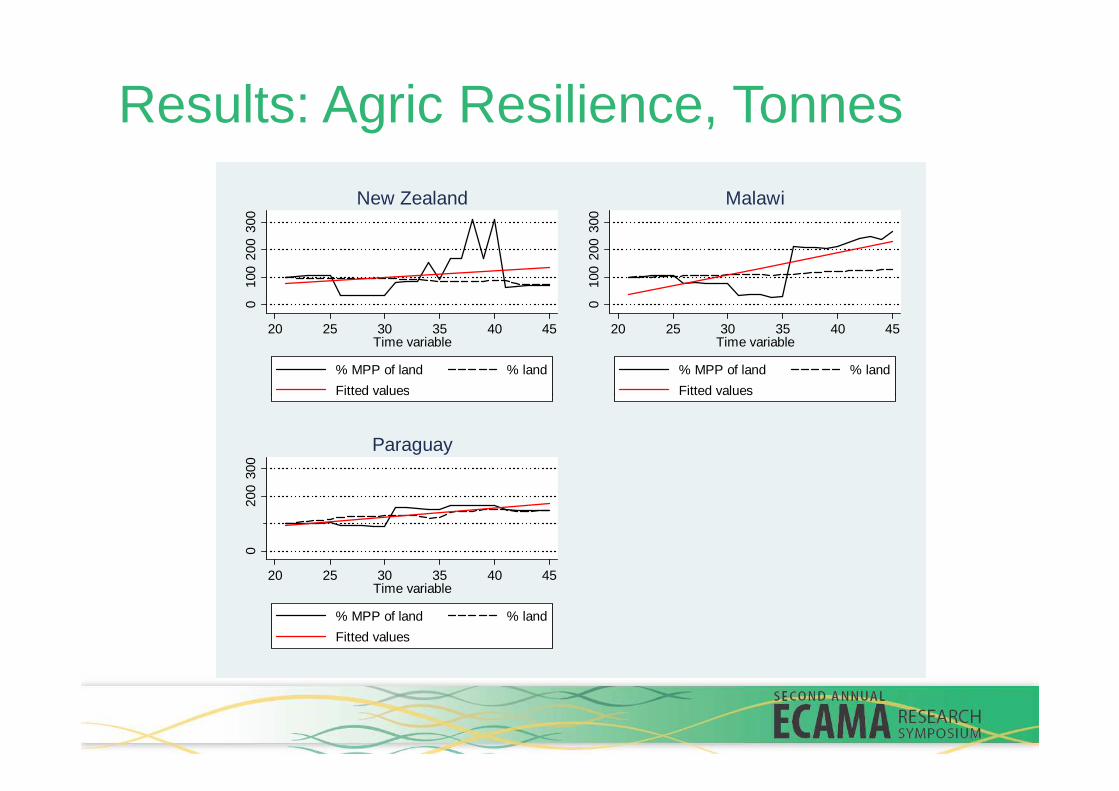
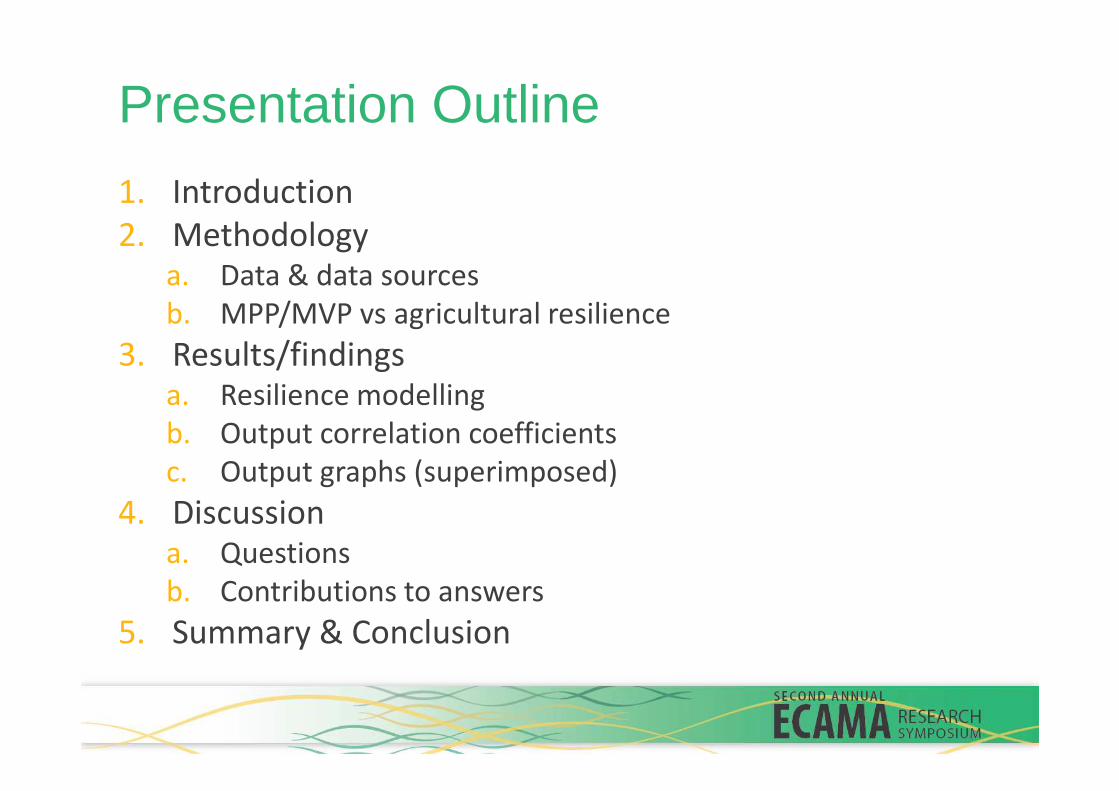
Results: Agric Resilience, Tonnes
010
020
030
0
20 25 30 35 40 45Time variable
% MPP of land % land
Fitted values
New Zealand
010
020
030
0
20 25 30 35 40 45Time variable
% MPP of land % land
Fitted values
Malawi
Fitted values Fitted values
020
030
0
20 25 30 35 40 45Time variable
% MPP of land % land
Fitted values
Paraguay

Results: Agric Resilience, I$
010
020
0
20 25 30 35 40 45Time variable
% MVP of land % land
Fitted values
New Zealand
010
020
030
0
20 25 30 35 40 45Time variable
% MVP of land % land
Fitted values
Malawi
050
200
20 25 30 35 40 45Time variable
% MVP of land % land
Fitted values
Paraguay

Results: PW Correlation Coefficients
• Tables 4.7-4.9: Table 4.7 Pairwise correlation coefficients for agricultural output measured in international dollars (PPP), wheat units (W) and tonnes (T), high external input using countries, 1961-2005 Country name TW p-value TPPP p-value WPPP p-value
Albania 0.9210* 0.0000 0.9947* 0.0000 0.8851* 0.0000
Austria 0.9301* 0.0000 0.9510* 0.0000 0.8987* 0.0000 Bahamas 0.9484* 0.0000 0.8922* 0.0000 0.8325* 0.0000
Barbados 0.9982* 0.0000 0.9177* 0.0000 0.9043* 0.0000 Belize 0.9695* 0.0000 0.9808* 0.0000 0.9040* 0.0000
Bulgaria 0.8139* 0.0000 0.9782* 0.0000 0.7612* 0.0000 Canada 0.9214* 0.0000 0.9845* 0.0000 0.8951* 0.0000
Cuba 0.9865* 0.0000 0.9301* 0.0000 0.8584* 0.0000
Cyprus 0.0652 0.6703 0.8850* 0.0000 -0.3846* 0.0091 Democratic People's Republic of
Korea 0.9873* 0.0000 0.9969* 0.0000 0.9941* 0.0000
Egypt 0.9983* 0.0000 0.9961* 0.0000 0.9967* 0.0000
Fiji 0.9763* 0.0000 0.9219* 0.0000 0.9154* 0.0000 France 0.9670* 0.0000 0.9807* 0.0000 0.9709* 0.0000
Germany 0.9773* 0.0000 0.7148* 0.0000 0.6703* 0.0000 Greece 0.9842* 0.0000 0.9954* 0.0000 0.9783* 0.0000
Hungary 0.8237* 0.0000 0.9893* 0.0000 0.8084* 0.0000
India 0.9986* 0.0000 0.9948* 0.0000 0.9933* 0.0000 Israel 0.2921* 0.0516 0.9735* 0.0000 0.2098 0.1666
Italy 0.8133* 0.0000 0.9751* 0.0000 0.8176* 0.0000 Jamaica 0.7183* 0.0000 0.2831* 0.0595 -0.4476* 0.0020
Lebanon 0.9878* 0.0000 0.9979* 0.0000 0.9841* 0.0000 Lebanon 0.9878* 0.0000 0.9979* 0.0000 0.9841* 0.0000 Mauritius 0.9634* 0.0000 0.7897* 0.0000 0.5979* 0.0000
New Zealand 0.9785* 0.0000 0.9842* 0.0000 0.9933* 0.0000
Norway 0.5774* 0.0000 0.4963* 0.0005 0.4791* 0.0009 Pakistan 0.9976* 0.0000 0.9963* 0.0000 0.9911* 0.0000
Poland 0.5402* 0.0001 0.8410* 0.0000 0.6440* 0.0000 Portugal 0.7196* 0.0000 0.4129* 0.0048 -0.0287 0.8517
Republic of Korea 0.1444 0.3440 0.9255* 0.0000 -0.2173 0.1516 Romania 0.8109* 0.0000 0.9635* 0.0000 0.8441* 0.0000
Saint Kitts and Nevis 0.9996* 0.0000 0.9988* 0.0000 0.9973* 0.0000
Saint Lucia 0.9810* 0.0000 0.9903* 0.0000 0.9648* 0.0000
Saint Vincent and the Grenadines 0.9704* 0.0000 0.8780* 0.0000 0.9122* 0.0000
Spain 0.8141* 0.0000 0.9931* 0.0000 0.7964* 0.0000
Sri Lanka 0.9905* 0.0000 0.9909* 0.0000 0.9822* 0.0000 Sweden 0.9208* 0.0000 0.5829* 0.0000 0.7757* 0.0000
Switzerland 0.9002* 0.0000 0.6067* 0.0000 0.4703* 0.0011 Thailand 0.9934* 0.0000 0.9892* 0.0000 0.9916* 0.0000
Turkey 0.9889* 0.0000 0.9987* 0.0000 0.9928* 0.0000
United Kingdom 0.8691* 0.0000 0.8727* 0.0000 0.9590* 0.0000
United States of America 0.9716* 0.0000 0.9988* 0.0000 0.9738* 0.0000
Viet Nam 0.9952* 0.0000 0.9994* 0.0000 0.9960* 0.0000
TW = correlation between tonnage and wheat unit output; TPPP = correlation between tonnage and international dollar output; WPPP = correlation between wheat unit and internal dollar output; Colour coding denotes variations in magnitude and statistical significance of association; * denotes statistical significance at 10% significance level.

Results: Aggreg. Output, HIs
6.0e
+06
8.0e
+06
1.0e
+07
Out
put (
I$)
1.0e
+07
1.5e
+07
2.0e
+07
Out
put (
tons
)
2.0e
+07
4.0e
+07
6.0e
+07
Out
put (
whe
at u
nits
)
New Zealand
4.0e
+06
6.0e
+06Out
put (
I$)
5.0e
+06
1.0e
+07
Out
put (
tons
)
02.
0e+
07O
utpu
t (w
heat
uni
ts)
0 10 20 30 40 50Time var
Output (wheat units) Output (tons)Output (I$)
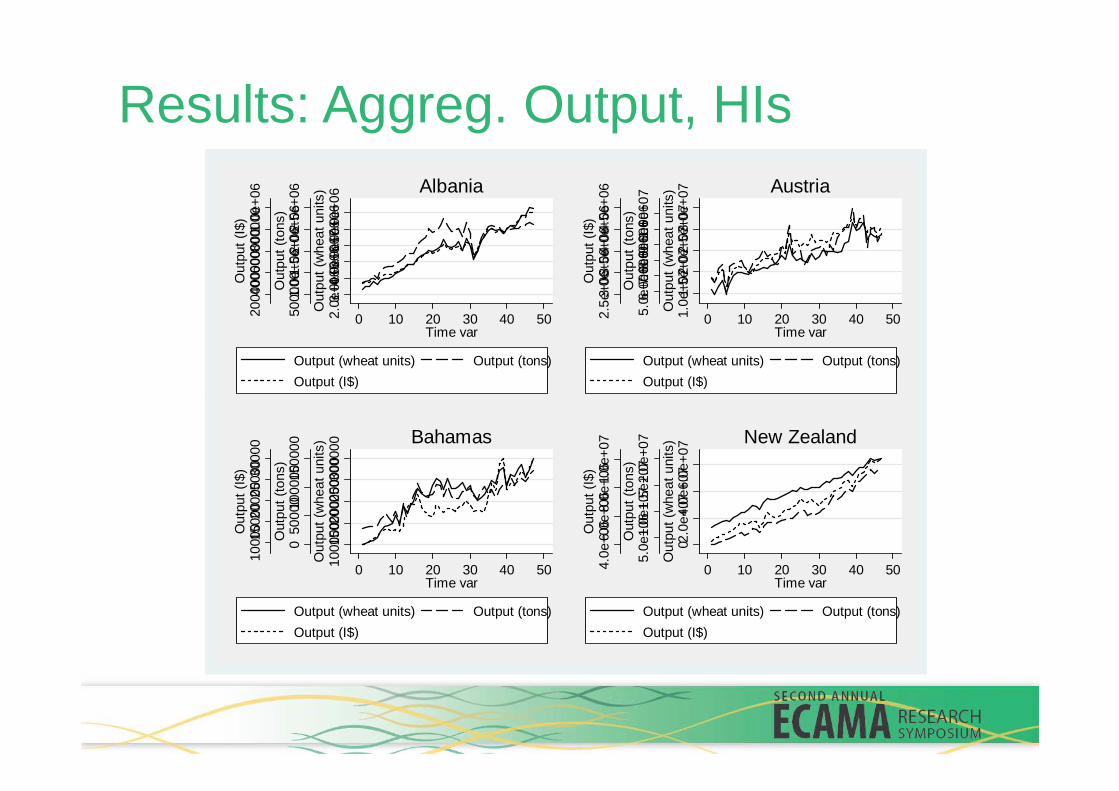
Results: Aggreg. Output, HIs
2000
0040
0000
6000
0080
0000
1.0e
+06
Out
put
(I$)
5000
001.
0e+0
61.
5e+0
62.
0e+
062.
5e+
06O
utpu
t (to
ns)
2.0e
+06
3.0e
+06
4.0e
+06
5.0e
+06
6.0e
+06
7.0e
+06
Out
put
(whe
at u
nits
)0 10 20 30 40 50
Time var
Output (wheat units) Output (tons)
Output (I$)
Albania
2.5e
+06
3.0e
+06
3.5e
+06
4.0e
+06
4.5e
+06
Out
put
(I$)
5.0e
+06
6.0e
+06
7.0e
+06
8.0e
+06
9.0e
+06
1.0e
+07
Out
put (
tons
)
1.0e
+07
1.5e
+07
2.0e
+07
2.5e
+07
3.0e
+07
Out
put
(whe
at u
nits
)
0 10 20 30 40 50Time var
Output (wheat units) Output (tons)
Output (I$)
Austria
1000
015
000
2000
025
000
3000
0O
utpu
t (I$
)
050
00010
000015
0000
Out
put (
tons
)
1000
0015
0000
2000
002500
0030
0000
Out
put (
whe
at u
nits
)
0 10 20 30 40 50Time var
Output (wheat units) Output (tons)
Output (I$)
Bahamas
4.0e
+06
6.0e
+068.0e
+061.0e
+07
Out
put (
I$)
5.0e
+06
1.0e
+071.5e
+07
2.0e
+07
Out
put (
tons
)
02.0
e+074.0e
+076.0e
+07
Out
put (
whe
at u
nits
)
0 10 20 30 40 50Time var
Output (wheat units) Output (tons)
Output (I$)
New Zealand
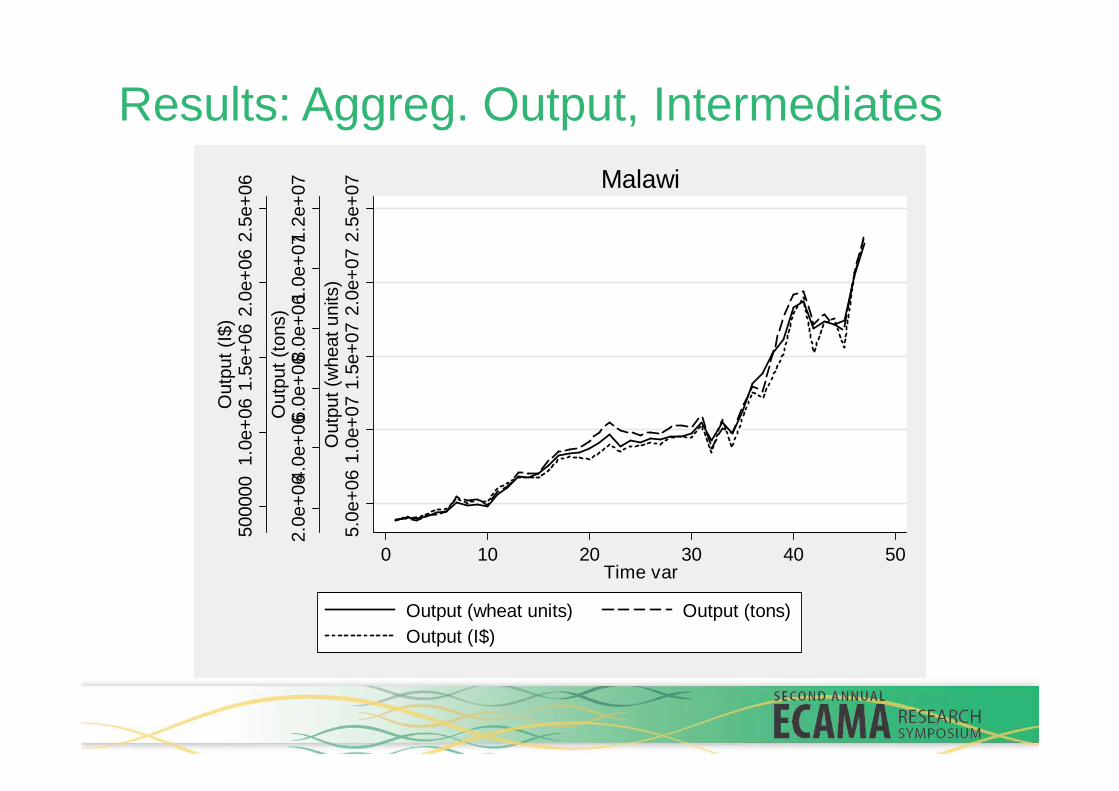
Results: Aggreg. Output, Intermediates
1.5e
+06
2.0e
+06
2.5e
+06
Out
put (
I$)
6.0e
+06
8.0e
+06
1.0e
+07
1.2e
+07
Out
put (
tons
)
1.5e
+07
2.0e
+07
2.5e
+07
Out
put (
whe
at u
nits
)
Malawi
5000
001.
0e+
06Out
put (
I$)
2.0e
+06
4.0e
+06
6.0e
+06
Out
put (
tons
)
5.0e
+06
1.0e
+07
Out
put (
whe
at u
nits
)
0 10 20 30 40 50Time var
Output (wheat units) Output (tons)Output (I$)

Results: Aggreg. Output, Intermediates
2000
0040
0000
6000
0080
0000
1.0e
+06
Out
put
(I$)
5000
001.
0e+
061.
5e+0
62.
0e+
062.
5e+
06O
utpu
t (t
ons)
2.0e
+06
3.0e
+06
4.0e
+06
5.0e
+06
6.0e
+06
7.0e
+06
Out
put
(whe
at u
nits
)0 10 20 30 40 50
Time var
Output (wheat units) Output (tons)
Output (I$)
Algeria
1.5e
+07
2.0e
+07
2.5e
+07
3.0e
+07
3.5e
+07
4.0e
+07
Out
put
(I$)
4.0e
+07
6.0e
+07
8.0e
+07
1.0e
+08
1.2e
+08
1.4e
+08
Out
put
(ton
s)
1.0e
+08
1.5e
+08
2.0e
+08
2.5e
+08
3.0e
+08
Out
put
(whe
at u
nits
)
0 10 20 30 40 50Time var
Output (wheat units) Output (tons)
Output (I$)
Argentina
1.0e
+071.5e
+072.0e
+072.5e
+07
Out
put
(I$)
2.0e
+07
4.0e
+07
6.0e
+07
8.0e
+07
1.0e
+08
Out
put (
tons
)
5.0e
+071.0e
+081.5e
+082.0e
+08
Out
put
(whe
at u
nits
)
0 10 20 30 40 50Time var
Output (wheat units) Output (tons)
Output (I$)
Australia
5000
001.
0e+
061.
5e+
062.
0e+
062.
5e+
06O
utpu
t (I
$)
2.0e
+06
4.0e
+06
6.0e
+06
8.0e
+06
1.0e
+07
1.2e
+07
Out
put (
tons
)
5.0e
+06
1.0e
+07
1.5e
+07
2.0e
+07
2.5e
+07
Out
put
(whe
at u
nits
)
0 10 20 30 40 50Time var
Output (wheat units) Output (tons)
Output (I$)
Malawi

Results: Aggreg. Output, LIs
2.0e
+06
3.0e
+06
4.0e
+06
Out
put (
I$)
5.0e
+06
1.0e
+07
1.5e
+07
Out
put (
tons
)
2.0e
+07
3.0e
+07
Out
put (
whe
at u
nits
)
Paraguay
01.
0e+
062.
0e+
06O
utpu
t (I$
)
05.
0e+
06O
utpu
t (to
ns)
01.
0e+
07O
utpu
t (w
heat
uni
ts)
0 10 20 30 40 50Time var
Output (wheat units) Output (tons)Output (I$)

Results: Aggreg. Output, LIs
5000
001.
0e+
061.
5e+
062.
0e+
062.
5e+
06O
utpu
t (I
$)
2.0e
+06
4.0e
+06
6.0e
+06
8.0e
+06
1.0e
+07
Out
put
(ton
s)
1.0e
+07
1.5e
+07
2.0e
+07
2.5e
+07
3.0e
+07
Out
put
(whe
at u
nits
)0 10 20 30 40 50
Time var
Output (wheat units) Output (tons)
Output (I$)
Angola
050
00001.0e
+061.5e
+06
Out
put
(I$)
1.0e
+06
1.5e
+06
2.0e
+06
2.5e
+06
3.0e
+06
Out
put
(ton
s)
2.0e
+06
4.0e
+06
6.0e
+06
8.0e
+06
1.0e
+07
1.2e
+07
Out
put
(whe
at u
nits
)
0 10 20 30 40 50Time var
Output (wheat units) Output (tons)
Output (I$)
Yemen
2000
0040
0000
6000
0080
0000
1.0e
+06
1.2e
+06
Out
put
(I$)
1.0e
+06
2.0e
+06
3.0e
+06
4.0e
+06
5.0e
+06
6.0e
+06
Out
put
(ton
s)
05.0
e+061.0e
+071.5e
+07
Out
put
(whe
at u
nits
)
0 10 20 30 40 50Time var
Output (wheat units) Output (tons)
Output (I$)
Zambia
01.0e
+06
2.0e
+06
3.0e
+06
4.0e
+06
Out
put
(I$)
05.0
e+061.0e
+071.5e
+07
Out
put
(ton
s)
01.0
e+072.0e
+07
3.0e
+07
Out
put
(whe
at u
nits
)
0 10 20 30 40 50Time var
Output (wheat units) Output (tons)
Output (I$)
Paraguay
Poking questions
• Key questions are: Why should/(are) the results be so? What explains them? What do we learn?
• e.g. peculiarity(ies) associated with LIs and intermediates: careful thought and further investigation regarding appropr. mensurationinvestigation regarding appropr. mensurationapproaches and methods in theses areas?
• Association levels: TPPP, TW, WPPP: Might output correlation values be a measure or an indicator or a form of metaphorical representation of resilience?

Making sense of the findings (in part?)
1. Not just mensuration theory, but also the
strong possibility that there are important
livelihood elements at play.
� At macro and micro levels.
� e.g. rationality of man as a producer and the � e.g. rationality of man as a producer and the
multiplicity of agricultural outputs produced, even
at the country level.

Making sense of the findings (in part?)
2. Science has not yet explored and discovered everything, and we need not act as if it has.
� vs starting point.
� Reality ought to mould our models, when modelling is necessary and useful, not the other modelling is necessary and useful, not the other way round.
� A firm understanding of reality should be the main or key thing, the compelling force, as opposed to being satisfied with ‘beautiful’ models and theories.
� vs agricultural development impasse.
Summary & Conclusion
• Nature of the discourse on agricultural output aggregation so far makes for good theoretical progress in that it forewarns us of perceived or conceived potential pitfall areas.
• However falls short of overtly specifying the • However falls short of overtly specifying the theoretical assumptions/premises that must first hold.
– & appears to have been readily accepted by many with little question.
• Paper offers empirical insights into the realism of the posited concerns.
Summary & Conclusion
• Results: more research into:i. more specific specifications of when the pitfall
concerns would hold.
ii. conditions (for example, why and how) that allow for strong correlations.
iii. (possible) implications/interpretation in terms of the iii. (possible) implications/interpretation in terms of the underlying livelihood structures, strategies, systems and dynamics.
iv. implications for economics and research.i. e.g. reality must mould models and theories, and do so only
when modelling is necessary in as much as it is reductionistand simplistic. Contrast with cases where models are, rather superficially, virtually exclusively used to explain reality.

Thank you