agricultural and food policy center texas a&m...
TRANSCRIPT
AFPC
Economic contributions of thE us ricE industry to thE us Economy
Agricultural and Food Policy CenterTexas A&M University
August 2010
Department of Agricultural EconomicsTexas AgriLife ResearchTexas AgriLife Extension ServiceTexas A&M University
College Station, Texas 77843-2124Telephone: (979) 845-5913
Fax: (979) 845-3140http://www.afpc.tamu.edu

This research was funded in part by the USA Rice Federation.
© 2010 by the Agricultural and Food Policy Center
Research Report 10-3
Agricultural and Food Policy CenterDepartment of Agricultural Economics2124 TAMUCollege Station, TX 77843-2124Web site: www.afpc.tamu.edu

Economic Contributions of the US Rice Industry to the US Economy 1
James W. RichardsonJoe L. Outlaw
Agricultural & Food Policy CenterDepartment of Agricultural Economics
Texas AgriLife ResearchTexas AgriLife Extension Service
Texas A&M University
AFPC Research Report 10-3
August 2010
College Station, Texas 77843-2124Telephone: 979.845.5913
Fax: 979.845.3140Web site: http://www.afpc.tamu.edu/
Economic contributions of thE us ricEindustry to thE us Economy
AFPCAgricultural and Food Policy Center
The Texas A&M University System

Economic Contributions of the US Rice Industry to the US Economy2
Economic Contributions of the US Rice Industry to the US Economy 3
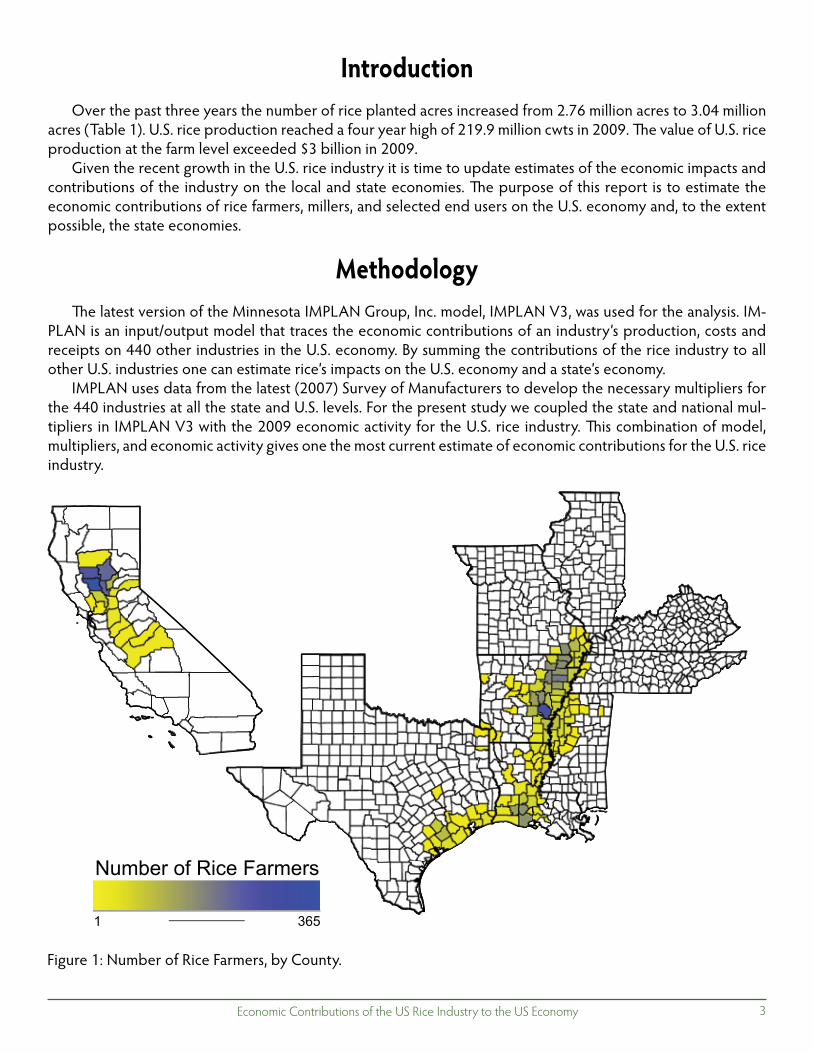
Introduction Over the past three years the number of rice planted acres increased from 2.76 million acres to 3.04 million acres (Table 1). U.S. rice production reached a four year high of 219.9 million cwts in 2009. The value of U.S. rice production at the farm level exceeded $3 billion in 2009. Given the recent growth in the U.S. rice industry it is time to update estimates of the economic impacts and contributions of the industry on the local and state economies. The purpose of this report is to estimate the economic contributions of rice farmers, millers, and selected end users on the U.S. economy and, to the extent possible, the state economies.
Methodology The latest version of the Minnesota IMPLAN Group, Inc. model, IMPLAN V3, was used for the analysis. IM-PLAN is an input/output model that traces the economic contributions of an industry’s production, costs and receipts on 440 other industries in the U.S. economy. By summing the contributions of the rice industry to all other U.S. industries one can estimate rice’s impacts on the U.S. economy and a state’s economy. IMPLAN uses data from the latest (2007) Survey of Manufacturers to develop the necessary multipliers for the 440 industries at all the state and U.S. levels. For the present study we coupled the state and national mul-tipliers in IMPLAN V3 with the 2009 economic activity for the U.S. rice industry. This combination of model, multipliers, and economic activity gives one the most current estimate of economic contributions for the U.S. rice industry.
Figure 1: Number of Rice Farmers, by County.
Number of Rice Farmers
1 365

Economic Contributions of the US Rice Industry to the US Economy4
Tabl
e 1.
US
Ric
e In
dust
ry S
umm
ary
Info
rmat
ion,
200
6-20
09.
Plan
ted
Har
vest
ed
Ave
rage
Ave
rage
Pric
eFa
rmB
ase
Num
ber o
fM
illed
Ave
rage
Pric
eSt
ates
Acr
es (1
)A
cres
(1)
Yiel
d (1
)Pr
oduc
tion
Rou
gh R
ice
(1)
Ope
rato
rs (2
)A
cres
(3)
Ric
e M
ills
(4)
Ric
e (1
)M
illed
Ric
e (1
)(A
cres
)(A
cres
)(C
WT/
Acr
e)(C
wts
.)($
/CW
T)(N
o.)
(M.A
c.)
(No.
)(C
wts
.)($
/CW
T)20
06 Ark
ansa
s1,
406,
000
1,
400,
000
69
.00
96
,600
,000
9.43
385,258,36
18.2
3C
alifo
rnia
526,
000
523,
000
76.6
0
40,0
61,8
00
13
.00
750,120,03
23.5
6
34
5,00
0
58
.80
20
,286
,000
9.83
322,974,31
18.2
6Te
xas
150,
000
150,
000
71.7
0
10,7
55,0
00
10
.00
124,836,7
17
.53
Mis
siss
ippi
190,
000
189,
000
70.0
0
13,2
30,0
00
9.
38107,559,6
18.2
3M
isso
uri
216,
000
214,
000
64.0
0
13,6
96,0
00
9.
38999,204,01
18
.23
Tota
l2,
838,
000
2,
821,
000
68
.35
19
4,62
8,80
013
2,34
9,98
3
2007 Ark
ansa
s1,
331,
000
1,
325,
000
72
.30
95
,797
,500
12.1
0
4,60
261
63,3
22,1
30
20
.64
534,
000
533,
000
82.0
0
43,7
06,0
00
16
.20
2,
518
71
32
,751
,906
26.0
838
0,00
0
37
8,00
0
61
.40
23
,209
,200
12.7
0
1,30
37
15,4
21,5
71
21
.00
Texa
s14
6,00
0
14
5,00
0
65
.50
9,
497,
500
12
.40
66
701
6,74
5,31
9
21.1
0M
issi
ssip
pi19
0,00
0
18
9,00
0
73
.50
13
,891
,500
12.6
0
621
2
7,
303,
486
20
.64
Mis
sour
i18
0,00
0
17
8,00
0
69
.00
12
,282
,000
11.9
0
720
1
9,
328,
974
20
.64
Tota
l2,
761,
000
2,
748,
000
70
.62
19
8,38
3,70
0134,01
35
134,
873,
386
2008 Ark
ansa
s1,
401,
000
1,
395,
000
66
.60
92
,938
,000
15.0
0100,234,16
29
.33
Cal
iforn
ia51
9,00
0
51
7,00
0
83
.20
43
,030
,000
27.5
0333,542,23
32
.34
470,
000
464,
000
58.3
0
27,0
37,0
00
15
.40
989,469,71
28.4
4Te
xas
175,
000
172,
000
69.0
0
11,8
68,0
00
15
.70
698,824,8
29
.58
Mis
siss
ippi
230,
000
229,
000
68.5
0
15,6
87,0
00
15
.40
474,742,8
29
.33
Mis
sour
i20
0,00
0
19
9,00
0
66
.20
13
,173
,000
13.8
0647,500,01
29
.33
Tota
l2,
995,
000
2,
976,
000
68
.63
20
3,73
3,00
013
8,32
4,43
9
2009 Ark
ansa
s1,
486,
000
1,
470,
000
68
.00
99,9
60,0
00
13
.40
823,158,1
245,370,66
38.3
2C
alifo
rnia
461,
000
556,
000
86.0
047
,816
,000
18.6
0919,516
118,138,53
50
.62
470,
000
464,
000
63.0
029
,232
,000
12.6
0427,297
774,324,91
36
.05
Texa
s17
1,00
0
17
0,00
0
77
.70
13,2
09,0
00
12
.50
250,095
203,183,9
33
.01
Mis
siss
ippi
245,
000
243,
000
67.0
016
,281
,000
12.8
0996,593
077,955,8
38.3
2M
isso
uri
202,
000
200,
000
67.1
013
,420
,000
13.1
0657,812
953,391,01
38
.32
Tota
l3,
035,
000
3,
103,
000
71
.47
21
9,91
8,00
014
9,46
3,26
1.
:secruoS (1
) Val
ues
com
e fro
m v
ario
us N
AS
S-U
SD
A re
ports
(2) V
alue
s co
me
from
200
7 C
ensu
s of
Agr
icul
ture
(3) V
alue
s co
me
from
US
DA
-FS
A
(4) V
alue
s co
me
from
200
7 C
ensu
s of
Man
ufac
ture
s
350,
000
Loui
sian
a
Cal
iforn
iaLo
uisi
ana
Loui
sian
a
Loui
sian
a

Economic Contributions of the US Rice Industry to the US Economy 5
Scope of the Industry The USDA census reports that in 2007 there were 10,431 rice farm operators1 with 44% of them in Arkansas (Table 1). About 24% of rice farmers are in California with the remainder in Louisiana, Mississippi, Missouri and Texas. Figure 1 shows the concentration of rice farmers by county and Table A1 presents the numbers for Figure 1. Planted acres of rice correspond closely to where rice farmers are located (Figure 2). Base acres of rice indicate historical production of rice (Figure 3). For example, Texas is presently under planting base acres of rice so the planted acres and base acres for Texas do not show the same concentration. County base acres are presented in Table A1 and state level base acres are presented in Table 1. Rice millers are located in all six rice producing states (Table 1). The number of rice mills reported in Table 1 comes from the 2007 U.S. Survey of Manufacturers. Locations of millers and merchants are summarized in Figure 4.1 A farm operator is the person who runs the farm, making the day-to-day decisions.
Figure 2: Planted Rice Acres, by County.
Rice Planted Acres
400 150,000

Economic Contributions of the US Rice Industry to the US Economy6
Figure 3: Rice Base Acres, by County.
MillersMerchants
California615,919 Base Acres
2,518 Farmers18 Millers/Merchants
Texas590,052 Base Acres
667 Farmers14 Millers/Merchants
Arkansas1,851,328 Base Acres
4,602 Farmers16 Millers/Merchants
Missouri218,756 Base Acres
720 Farmers3 Millers/Merchants
Louisiana792,724 Base Acres
1,303 Farmers10 Millers/Merchants
Mississippi395,699 Base Acres
621 Farmers3 Millers/Merchants
Figure 4: Location of US Rice Mills and Merchants.
Rice Base Acres
3 153,300

Economic Contributions of the US Rice Industry to the US Economy 7
Economic Contributions The economic contributions of the U.S. rice industry are presented in three parts: farmers, millers, and end users. For each sector of the industry we reported estimates for: output, value added, and number of jobs sup-ported. To provide further detail the contributions are disaggregated into four types of effects: direct, indirect, induced, and total. Direct effects amount to the sum of contributions that are directly attributable to farmers, millers, or end users. In the case of employment, the direct effect is the number of jobs supported by farmers, millers, or end users. The indirect effects are the economic activity and jobs supported by businesses that supply inputs to farmers, millers, or end users. The induced effect is the economic activity created through purchases and jobs created by the employees of input suppliers and their suppliers. The three main economic contribution categories (output, value added, and jobs) are defined in the box below.
Definitions for IMPLAN Economic Contribution CategoriesOutput is a measure of the value of goods and services produced in the State as a result of the increased demand created by expenditures by rice farms and rice mills. Output is measured by purchases of all intermediate production inputs and value added.
Value Added is the total wages and salaries plus business profits generated by the economic activities of a particular industry. In this case value added is the direct and indirect wages, salaries and profits gener-ated in a state by the activities of buying inputs and production products by rice farmers, rice millers, or end users.
Number of Jobs is the number of all wage and salary employees as well as self-employed jobs resulting from total expenditures by rice farmers and mills. The number of jobs does not accumulate, because it is an annual measure.

Economic Contributions of the US Rice Industry to the US Economy8
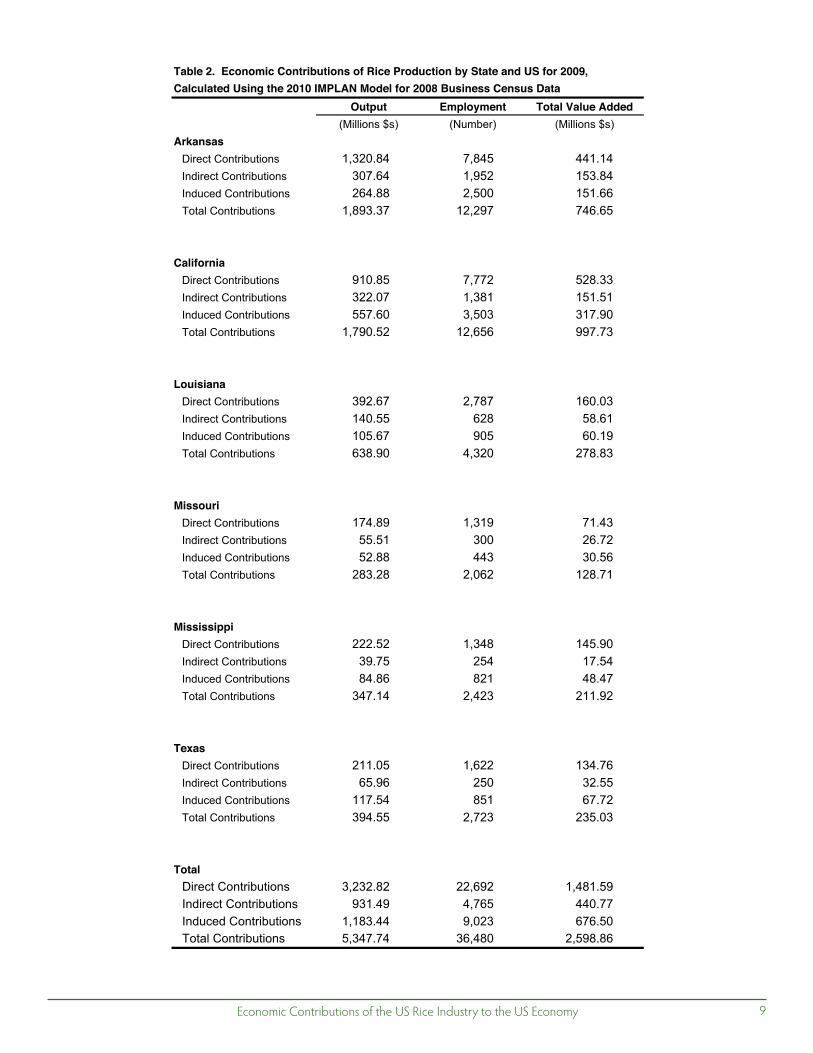
Farmer Contributions The net economic contributions of rice farming on the local and U.S. economies are summarized in Table 2. The total output effect on the U.S. economy was $5.347 billion in 2009. The total number of jobs supported by rice farmers was 36,480 and the value added amounted to about $2.6 billion. At the state level, Arkansas rice farmers support about the same number of direct jobs as California (7,845 vs. 7,772) and more indirect jobs (1,952 vs. 1,381). California has a much greater (3,503 vs. 2,500) induced employ-ment contribution resulting in the California rice farmers supporting 12,656 jobs while Arkansas farmers support 12,297 jobs. Louisiana rice farmers support about 4,320 jobs while, Missouri, Mississippi, and Texas support 2,062, 2,423, and 2,723 jobs, respectively. Total output contributions for Arkansas and California of $1.89 billion and $1.79 billion, respectively, are three times greater than Louisiana’s output contribution. Due in part to lower production 29.2 billion cwt. vs. 99.9 billion cwt. for Arkansas and 47.8 billion cwt. for California. Another factor that reduces Louisiana’s output is lower prices reported for rice in 2009 (Table 1). The 2009 output contributions for Missouri, Mississippi, and Texas were in the $283 to $394 million range. The farmer contributions through value added to the state’s GDP show California leads with $997 million in 2009. Arkansas was second with $746 million in value added. The remaining states’ contributions to their states’ value added is in the $128 million to $279 million range.
Millers Contribution Economic contributions of rice millers in 2009 to the U.S. economy were estimated to be $6.4 billion in value added, 38,092 jobs, and $10.97 billion in increased output (Table 3). These large economic contributions were attributed to the six states with rice mills. The greatest economic contributions from millers was in Arkansas where the industry supported output of $4.19 billion, employment of 13,538 jobs, and value added of $2.5 bil-lion. California rice millers contributed about $2.1 billion in value added to the state’s economy. Louisiana rice millers contributed almost $750 million while Mississippi and Texas millers contributed about $358 million each.
Economic Contributions of the US Rice Industry to the US Economy 9
Table 2. Economic Contributions of Rice Production by State and US for 2009,Calculated Using the 2010 IMPLAN Model for 2008 Business Census Data
Output Employment Total Value Added

Economic Contributions of the US Rice Industry to the US Economy10
Table 3. Economic Contributions of Rice Milling by State and US for 2009, Calculated Usingthe 2010 IMPLAN Model for 2008 Business Census Data
Output Employment Total Value Added(Millions $s) (Number) (Millions $s)
ArkansasDirect ContributionsIndirect ContributionsInduced ContributionsTotal Contributions
CaliforniaDirect ContributionsIndirect ContributionsInduced ContributionsTotal Contributions
LouisianaDirect ContributionsIndirect ContributionsInduced ContributionsTotal Contributions
MississippiDirect ContributionsIndirect ContributionsInduced ContributionsTotal Contributions
Texas
MissouriDirect ContributionsIndirect ContributionsInduced ContributionsTotal Contributions
Total
Total

Economic Contributions of the US Rice Industry to the US Economy 11
Table 4. Summary of Economic Contributions for Rice Farmers and Millers, by State in 2009.States Output Employment Value Added
Arkansas 6,081 25,835 022,3
California 5,423 24,941 290,3
Louisiana 1,978 726,9 520,1
Missouri 854 3,906 664
Mississippi 973 5,073 965
Texas 1,014 191,5 395
Total 16,323 275,47 569,8
- Output is total goods and services produced due to the increased demand by rice farmers and millers- Employment is total number of jobs supported directly and indirectly by rice farmers and millers.- Value Added is total wages and salaries plus business profits generated directly economic activities of rice farmers and millers.
created by purchases
and indirectly by
Jobs (Million $s)(Million $s)
State Level Contributions by Farmers and Millers The total economic contribution of rice farmers and millers to each state’s economy is summarized in Table 4. By state, Table 4 shows the sum of the total output, job creation, and value added for rice farmers and millers. The values come from the total contributions reported in Tables 2 and 3. Total contribution to economic pro-duction in Arkansas was $6.081 billion, 25,835 jobs were supported, and total wages, salaries and profits earned in the state amounted to $3.22 billion in 2009. California is second with their rice farmers and millers supporting 24,941 jobs, adding $5.423 billion to economic output, and $3.092 billion to the state’s wages, salaries and prof-its. The national contribution from rice farmers and millers in 2009 was $16.323 billion in increased economic output, 74,572 jobs, and $8.965 billion of wages, salaries, and profits.
Economic Contributions of the US Rice Industry to the US Economy12
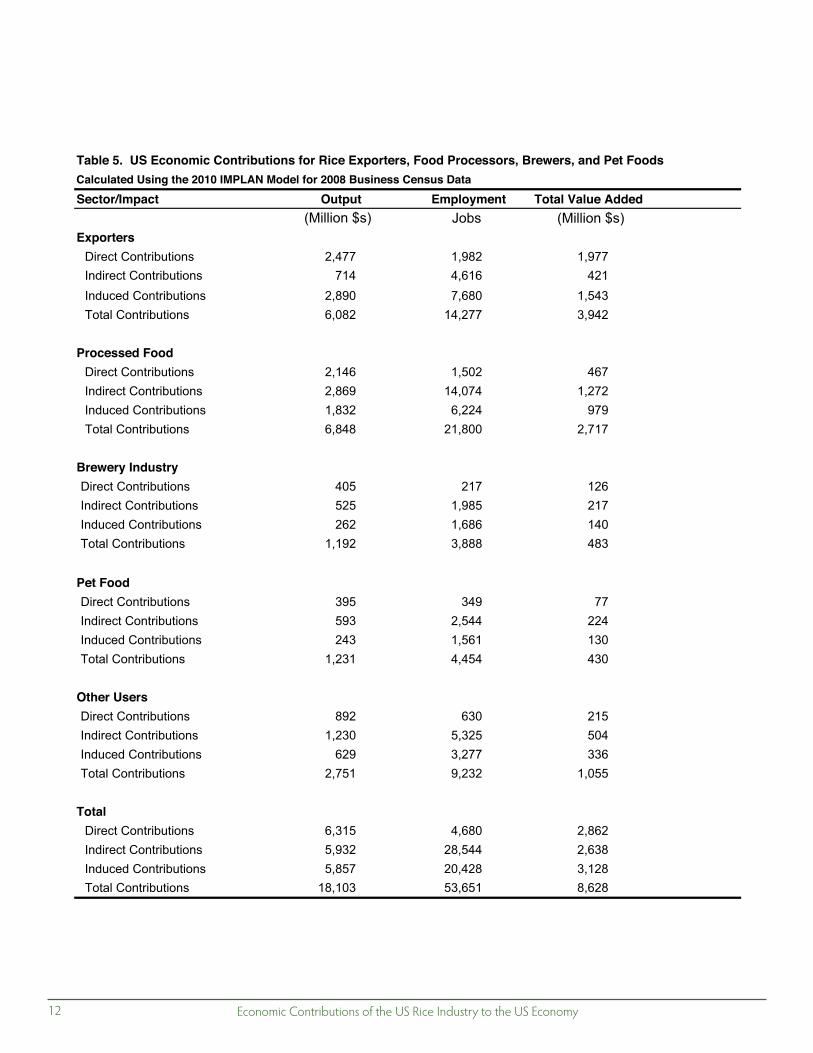
Table 5. US Economic Contributions for Rice Exporters, Food Processors, Brewers, and Pet FoodsCalculated Using the 2010 IMPLAN Model for 2008 Business Census Data
Total Value Added
Exporters774,2snoitubirtnoC tceriD 289,1 779,1 417snoitubirtnoC tceridnI 4,616 124
Induced Contributions 2,890 086,7 345,1 280,6snoitubirtnoC latoT 14,277 249,3
Processed Food641,2snoitubirtnoC tceriD 205,1 764
Indirect Contributions 2,869 14,074 272,1 Induced Contributions 1,832 422,6 979
848,6snoitubirtnoC latoT 21,800 717,2
Brewery Industry504snoitubirtnoC tceriD 217 126 525snoitubirtnoC tceridnI 1,985 712 262snoitubirtnoC decudnI 1,686 041 291,1snoitubirtnoC latoT 888,3 384
Pet Food593snoitubirtnoC tceriD 349 77 395snoitubirtnoC tceridnI 2,544 422 342snoitubirtnoC decudnI 1,561 031 132,1snoitubirtnoC latoT 454,4 034
Other Users298snoitubirtnoC tceriD 630 215 032,1snoitubirtnoC tceridnI 523,5 405 926snoitubirtnoC decudnI 3,277 633 157,2snoitubirtnoC latoT 232,9 550,1
Total513,6snoitubirtnoC tceriD 086,4 268,2
Indirect Contributions 5,932 28,544 836,2 Induced Contributions 5,857 20,428 821,3
301,81snoitubirtnoC latoT 156,35 826,8
Jobs (Million $s)(Million $s)Sector/Impact Output Employment

Economic Contributions of the US Rice Industry to the US Economy 13
End User Contributions There are numerous end users for rice, however, the quantities of rice used becomes quite small after we consider exporters, processed food manufacturers, brewers, and pet food manufacturers. The 2009 economic contributions for exporters, food processors, brewers, and pet food, in terms of contributions directly related to the rice they purchased and processed, are reported in Table 5. Rice exporters purchased, transported, warehoused, and exported about 90.5 million cwts in 2009. For this level of trade the IMPLAN economic contributions were estimated at: $6.1 billion of economic output, 1,982 direct jobs and 14,277 total jobs supported, and about $4 billion of value added to the U.S. economy (Table 5). The processed food sector had a smaller direct jobs impact (1,502 jobs) but the sector has much greater in-direct jobs multipliers (Table 5). The indirect jobs contribution result comes from the industry purchasing other inputs from many more industries than the export sector. The processed food sector in total supported 21,800 jobs that can be traced to its purchasing and processing of rice. Value added to the U.S. economy from food processors was $2.7 billion. The brewery industry contributed 3,888 jobs and a value added of $483 million that is attributable to its use of rice in 2009. Pet food manufacturers use rice but like breweries, their labor efficiency is so great that the number of jobs directly attributable to rice was small (349) in 2009. Total U.S. economic output from rice use by pet food manufacturers is small at $1.2 billion, as well as the total value added contribution of $430 million. These four end users for rice do not account for all rice used by end users. To account for the many other end users we created a residual or other users sector and assumed the average multipliers for the processed food, brewery and pet foods sectors. The economic contributions for all other rice end users is reported in Table 5. After accounting for the other users an estimate of the total 2009 economic contributions of rice end users was $18 billion of output, 53,651 jobs and $8.6 billion in value added.
SummaryThe impacts of the U.S. rice industry on the United States’ economy are summarized in Table 6. More than 128,000 jobs were supported directly and indirectly by rice production in 2009. Rice contributed more than $17.6 billion to U.S. wages, salaries, and profits. Rice was also responsible for more than $34 billion of economic output nationally.
Table 6. Summary of Economic Impacts of the US Rice Industry on the US Economy.Output Jobs Supported Value Added
)s$M()s$M(Farming Sector 5,348 36,480 2,599
Milling Sector 10,975 38,092 6,366
Final Users 18,103 53,651 8,628
Total 34,426 128,224 17,593

Economic Contributions of the US Rice Industry to the US Economy14
Appendix Table
Table A1. County Values for the Number oof Rice Farmers, Ricee Planted Acres and RRice Base Acres.
State County Farmers Planted Acres Base AcresAlabama Baldwin 0 0 49
Arkansas Arkansas 275 106,000 128,225Arkansas Ashley 21 11,200 32,484Arkansas Chicot 56 25,100 59,013Arkansas Clark 0 0 3,253Arkansas Clay 158 73,500 94,882Arkansas Cleburne 0 0 53Arkansas Conway 1 0 1,446Arkansas Craighead 150 78,200 96,720Arkansas Crawford 1 0 364Arkansas Crittenden 73 36,800 45,302Arkansas Cross 140 85,200 119,492Arkansas Dallas Cleveland 0 0 197Arkansas Desha 83 27,600 59,974Arkansas Drew 34 10,300 21,567Arkansas Faulkner 2 0 5,686Arkansas Franklin 0 0 275Arkansas Greene 165 67,700 73,931Arkansas Hempstead 0 0 419Arkansas Hot Spring 1 0 1,307Arkansas Independence 36 0 12,357Arkansas Jackson 170 92,500 119,732Arkansas Jefferson 102 58,200 72,844Arkansas Johnson 0 0 46Arkansas Lafayette 9 2,100 8,320Arkansas Lawrence 157 98,500 99,901Arkansas Lee 46 17,900 47,849Arkansas Lincoln 45 26,600 38,782Arkansas Little River 2 0 2,539Arkansas Logan 0 0 681Arkansas Lonoke 134 73,700 101,654Arkansas Miller 2 0 13,610Arkansas Mississippi 75 37,500 34,077Arkansas Monroe 89 46,700 67,027Arkansas Nevada 0 0 152Arkansas Perry 1 0 2,782Arkansas Phillips 66 19,900 38,533Arkansas Poinsett 192 117,500 151,439Arkansas Pope 4 0 1,039Arkansas Prairie 158 60,000 79,376Arkansas Pulaski 14 3,800 8,676Arkansas Randolph 52 32,600 30,294Arkansas Saline 0 0 20Arkansas Sevier 0 0 18Arkansas Sharp 0 0 26Arkansas St Francis 76 34,300 58,992Arkansas Stone 0 0 11Arkansas Unassigned 0 31,100 0Arkansas White 60 0 36,285Arkansas Woodruff 102 56,500 76,378Arkansas Yell 0 0 3,300

Economic Contributions of the US Rice Industry to the US Economy 15
State County Farmers Planted Acres Base AcresTable A1. Contiued
California Butte 217 102,000 106,530California Colusa 365 155,000 153,302California Fresno 7 2,900 3,304California Glenn 249 86,500 93,482California Kern 0 0 2,128California Kings 0 0 213California Madera 1 0 46California Merced 5 2,600 12,720California Napa 1 0 0California Placer 26 10,500 18,798California Sacramento 15 3,700 14,622California San Joaquin 12 4,800 6,583California Solano 1 0 75California Stanislaus 6 1,700 2,652California Sutter 222 106,000 115,086California Tehama 6 800 3,503California Tulare 0 0 455California Yolo 69 23,800 43,304California Yuba 102 33,700 39,116Florida Glades 0 0 779Florida Gulf 0 0 20Florida Hendry 0 0 6Florida Palm Beach 7 11,376 16,870Illinois Alexander 3 0 182Illinois Union 0 0 6Illinois Williamson 0 0 8Kentucky Fulton 0 0 146Louisiana Acadia 154 64,800 114,730Louisiana Allen 27 11,300 36,584Louisiana Avoyelles 25 14,700 17,522Louisiana Beauregard 4 1,100 4,308Louisiana Bossier 0 0 108Louisiana Caddo 0 0 118Louisiana Calcasieu 23 12,600 38,646Louisiana Caldwell 1 0 3,000Louisiana Cameron 15 11,400 27,505Louisiana Catahoula 9 2,400 11,457Louisiana Concordia 12 11,700 16,005Louisiana East Carroll 25 6,600 23,420Louisiana Evangeline 78 35,400 57,918Louisiana Franklin 2 0 3,534Louisiana Iberia 5 0 2,956Louisiana Iberville 0 0 109Louisiana Jefferson Davis 134 66,800 112,881Louisiana Lafayette 11 0 9,290Louisiana Lincoln 4 0 0Louisiana Madison 12 5,200 10,503Louisiana Morehouse 35 21,900 67,814Louisiana Natchitoches 2 3,800 5,581Louisiana Ouachita 3 0 10,830Louisiana Pointe Coupee 2 2,400 4,265

Economic Contributions of the US Rice Industry to the US Economy16
State County Farmers Planted Acres Base AcresTable A1. Contiued
Louisiana Rapides 13 7,600 9,031Louisiana Red River 0 0 457Louisiana Richland 12 9,500 19,183Louisiana St Landry 55 18,700 32,795Louisiana St Martin 18 4,700 8,329Louisiana Tensas 2 1,100 6,714Louisiana Unassigned 0 12,500 0Louisiana Vermilion 157 50,000 126,272Louisiana West Carroll 8 3,700 10,858Mississippi Adams 0 0 97Mississippi Alcorn 0 0 8Mississippi Attala 0 0 11Mississippi Bolivar 86 54,500 106,604Mississippi Carroll 1 0 19Mississippi Coahoma 25 12,200 32,040Mississippi Desoto 5 0 1,921Mississippi Grenada 0 0 3,011Mississippi Hancock 0 0 130Mississippi Holmes 2 0 2,503Mississippi Humphreys 10 2,100 12,865Mississippi Issaquena 1 0 3,778Mississippi Lafayette 1 0 0Mississippi Lee 1 0 0Mississippi Leflore 29 10,800 31,962Mississippi Madison 0 0 400Mississippi Marion 0 0 42Mississippi Noxubee 0 0 31Mississippi Panola 7 3,800 3,645Mississippi Quitman 24 13,900 26,325Mississippi Sharkey 2 1,200 10,919Mississippi Sunflower 56 30,000 63,155Mississippi Tallahatchie 24 11,400 23,950Mississippi Tate 3 0 1,050Mississippi Tippah 0 0 3Mississippi Tunica 24 21,500 26,783Mississippi Unassigned 0 5,600 0Mississippi Washington 38 23,000 42,679Mississippi Yazoo 2 0 1,767Missouri Bollinger 2 800 870Missouri Butler 161 65,000 82,669Missouri Cape Girardeau 2 0 0Missouri Dunklin 36 16,200 7,849Missouri Mississippi 6 0 1,132Missouri New Madrid 57 19,900 29,931Missouri Pemiscot 55 26,300 10,917Missouri Ripley 14 6,200 5,594Missouri Scott 5 900 1,099Missouri Stoddard 97 43,800 78,677Missouri Unassigned 0 900 0Missouri Wayne 0 0 18
Economic Contributions of the US Rice Industry to the US Economy 17
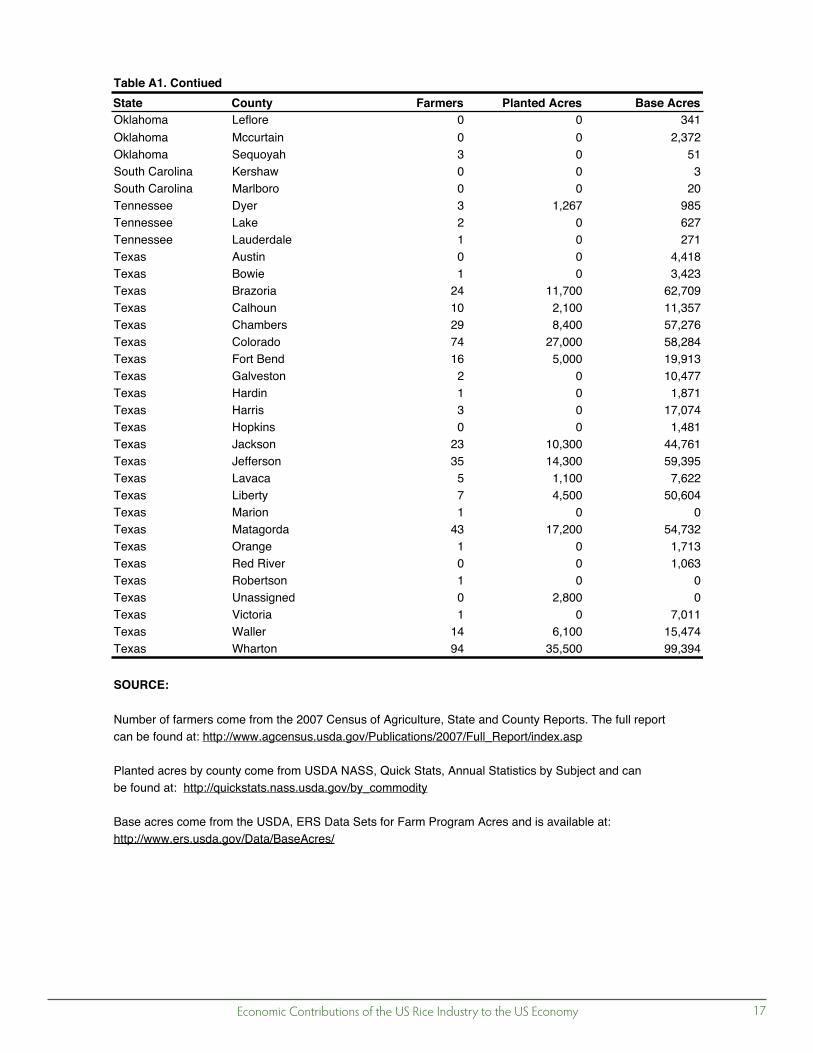
State County Farmers Planted Acres Base AcresTable A1. Contiued
Oklahoma Leflore 0 0 341Oklahoma Mccurtain 0 0 2,372Oklahoma Sequoyah 3 0 51South Carolina Kershaw 0 0 3South Carolina Marlboro 0 0 20Tennessee Dyer 3 1,267 985Tennessee Lake 2 0 627Tennessee Lauderdale 1 0 271Texas Austin 0 0 4,418Texas Bowie 1 0 3,423Texas Brazoria 24 11,700 62,709Texas Calhoun 10 2,100 11,357Texas Chambers 29 8,400 57,276Texas Colorado 74 27,000 58,284Texas Fort Bend 16 5,000 19,913Texas Galveston 2 0 10,477Texas Hardin 1 0 1,871Texas Harris 3 0 17,074Texas Hopkins 0 0 1,481Texas Jackson 23 10,300 44,761Texas Jefferson 35 14,300 59,395Texas Lavaca 5 1,100 7,622Texas Liberty 7 4,500 50,604Texas Marion 1 0 0Texas Matagorda 43 17,200 54,732Texas Orange 1 0 1,713Texas Red River 0 0 1,063Texas Robertson 1 0 0Texas Unassigned 0 2,800 0Texas Victoria 1 0 7,011Texas Waller 14 6,100 15,474Texas Wharton 94 35,500 99,394
SOURCE:
Number of farmers come from the 2007 Census of Agriculture, Statte and County Reports. The full reportcan be found at: http://www.agcensus.usda.gov/Publications/2007/Full_Report/index.asp
Planted acres by county come from USDA NASS, Quick Stats, Annual Statistics by Subject and can be found at: http://quickstats.nass.usda.gov/by_commodity
Base acres come fromm the USDA, ERS Dataa Sets for Farm Programm Acres and is available at: http://www.ers.usda.gov/Data/BaseAcres/

Economic Contributions of the US Rice Industry to the US Economy18
A policy research report presents the final results of a research project undertaken by AFPC faculty. At least a portion of the contents of this report may have been published previously as an AFPC issue paper or working paper. Since issue and working papers are preliminary reports, the final results contained in a research paper may differ - but, hopefully, in only marginal terms. Research reports are viewed by faculty of AFPC and the Department of Agricultural Economics, Texas A&M University. AFPC welcomes comments and discussions of these results and their implications. Address such comments to the author(s) at:
Agricultural and Food Policy Center Department of Agricultural Economics Texas A&M University College Station, Texas 77843-2124
or call (979) 845-5913.
Copies of this publication have been deposited with the Texas State Library in compliance with the State Depository Law.
Mention of a trademark or a proprietary product does not constitute a guarantee or a warranty of the product by Texas AgriLife Research or Texas AgriLife Extension Service and does not imply its approval to the exclusion of other products that also may be suitable.
All programs and information of Texas AgriLife Research or Texas AgriLife Extension Service are available to everyone without regard to race, color, religion, sex, age, handicap, or national origin.