agreement no. ce 35/2006(ce) kai tak development
TRANSCRIPT

Agreement No. CE 35/2006(CE) Kai Tak Development Engineering Study cum Design and Construction of Advance Works Annex A – Investigation, Design and Construction KTAC and KTTS Studies
i
Agreement No. CE 35/2006(CE) Kai Tak Development Engineering Study
cum Design and Construction of Advance Works – Investigation, Design and Construction
Annex A REPORT ON KTAC and KTTS STUDIES
Contents
1 INTRODUCTION..................................................................................................................1-1
1.1 Background ............................................................................................................ 1-1
1.2 Overall Approach of Odour Impact Assessment .................................................... 1-2
1.3 Purpose and Structure of this Report ..................................................................... 1-3
2 IDENTIFICATION OF ENVIRONMENTAL PROBLEMS ASSOCIATED WITH KTAC AND KTTS ....................................................................................................................................2-1
2.1 Existing Environmental Conditions ......................................................................... 2-1
2.2 Existing Drainage and Sewerage Systems in the Catchment Areas of KTAC and KTTS....................................................................................................................... 2-1
2.3 Existing Odour, Water and Sediment Pollution Sources ........................................ 2-2
2.4 Extent of Environmental Problems Based on Findings of Previous Surveys and Investigations .......................................................................................................... 2-4
2.5 Reference ............................................................................................................. 2-10
3 FURTHER DETAILED FIELD SURVEYS............................................................................3-1
3.1 Purpose and Objectives ......................................................................................... 3-1
3.2 Approach and Methodology ................................................................................... 3-1
3.3 Results of Field Surveys......................................................................................... 3-6
3.4 Interpretation of Field Survey Results .................................................................... 3-8
4 FURTHER DETAILED LABORATORY TESTING ..............................................................4-1
4.1 Purpose and Objectives ......................................................................................... 4-1
4.2 Approach and Methodology ................................................................................... 4-1
4.3 Results of Laboratory Testing ................................................................................ 4-5
4.4 Interpretation of Laboratory Testing Results .......................................................... 4-8
4.5 Summary and Conclusion .................................................................................... 4-10
Agreement No. CE 35/2006(CE) Kai Tak Development Engineering Study Annex A cum Design and Construction of Advance Works KTAC and KTTS Studies – Investigation, Design and Construction
ii
5 ODOUR GENERATION MECHANISM................................................................................5-1
5.1 Introduction............................................................................................................. 5-1
5.2 Types of Emissions ................................................................................................ 5-1
5.3 Spatial Variation of Odour Emissions in KTAC and KTTS..................................... 5-3
5.4 Variation of Odour Emissions Against Environmental Factors .............................. 5-5
5.5 Summary ................................................................................................................ 5-7
6 TREATMENT OF SEDIMENT..............................................................................................6-1
6.1 Introduction............................................................................................................. 6-1
6.2 Review of Sediment Treatment Technologies ....................................................... 6-1
6.3 Remediation Selection Strategy............................................................................. 6-4
6.4 Comparison of Sediment Treatment Technologies................................................ 6-7
6.5 In-situ Bioremediation Pilot Scale Field Trial........................................................ 6-15
6.6 Odour Removal by Bioremediation ...................................................................... 6-20
6.7 Treatment for Sediments on/within Seawalls ....................................................... 6-22
6.8 Recommendations................................................................................................ 6-36
6.9 References ........................................................................................................... 6-36
7 IMPROVEMENT OF WATER CIRCULATION.....................................................................7-1
7.1 Introduction............................................................................................................. 7-1
7.2 Legislation, Policies, Plans, Standards and Criteria............................................... 7-2
7.3 Baseline Conditions................................................................................................ 7-6
7.4 Key Findings of the KTPR ...................................................................................... 7-8
7.5 Assessment Methodology .................................................................................... 7-10
7.6 Prediction and Evaluation..................................................................................... 7-15
7.7 Summary .............................................................................................................. 7-17
8 CONTAINMENT OF POLLUTION ENTERING KTAC AND KTTS.....................................8-1
8.1 Introduction............................................................................................................. 8-1
8.2 Review of Previous and On-Going Relevant Project ............................................. 8-1
8.3 Dry Weather Flow Interception Scheme............................................................... 8-12
8.4 Description of Drainage Culvert System in KTN .................................................. 8-13
8.5 Desilting Procedures and Preliminary Maintenance Plan .................................... 8-15
8.6 Maintenance Operations during Rainstorms, Tropical Cyclones or inclement Weather ................................................................................................................ 8-21
8.7 Summary .............................................................................................................. 8-21

Agreement No. CE 35/2006(CE) Kai Tak Development Engineering Study cum Design and Construction of Advance Works Annex A – Investigation, Design and Construction KTAC and KTTS Studies
iii
9 ODOUR IMPACT ASSESSMENT .......................................................................................9-1
9.1 Introduction ............................................................................................................. 9-1
9.2 Odour Assessment Criteria..................................................................................... 9-1
9.3 Air Sensitive Receivers ........................................................................................... 9-1
9.4 Odour Emission Inventory ...................................................................................... 9-2
9.5 Odour Modelling Methodology................................................................................ 9-6
9.6 Evaluation and Prediction of Potential Odour Impacts ......................................... 9-14
List of Tables Table 3.1 Sampling Design at Water Zones and Culvert Discharges
Table 3.2 Water Sampling Locations
Table 3.3 Summary of In-situ Marine Water Quality Measurement Results in Water Zones and Culvert Discharges
Table 3.4 Summary of Laboratory Analyses Results for Odour Emission Samples
Table 3.5 Summary of Laboratory Analyses Results for Air Samples
Table 3.6 Results of Odour Potential of Water Samples
Table 3.7 Ratios of H2S Concentration over Odour Concentration at Different Sampling Zones
Table 4.1 Sampling Locations of Sediment Core and Marine Water and Rationale for Selection
Table 4.2 Summary Results of H2S and Odour Concentration Measurements and Hedonic Tone Test of the 49 Scenarios
Table 5.1 Measured SOER near JVCO
Table 5.2 Comparison of Odour Emissions with and without Water Column (Incubation Temperature: 25
oC)
Table 5.3 Summary of Key Odour Sources, Generation Mechanism and Influencing Factors
Table 6.1 Sediments Treatment Technologies
Table 6.2 Comparison of In-situ Sediment Treatment Methods
Table 6.3 Dosage of Nitrate Applied to Treatment Area
Table 6.4 Work Schedule of Bioremediation Pilot Scale Field Test
Table 6.5 Different Treatment Conditions Set in the Bench-Scale Testing
Table 6.6 Results of Odour Emission Rate Experiment for Treated and Untreated Sediments
Table 6.7 Results of Odour Potential Experiment for Treated and Untreated Sediments
Table 6.8 Odour Emissions Comparison Between Areas with and without Bioremediation
Table 6.9 Hydrogen Sulphide Emission Comparison Between Areas with and without Bioremediation
Table 6.10 Laboratory Analysis of AVS in Sediment Samples
Table 6.11 Advantages and Disadvantages of Different Options for Kai Tak Airport Runway Seawall Sedimentation Cleaning
Table 6.12 Comparison of the Pros and Cons of Different Solutions to Seawall Sedimentation
Table 7.1 Summary of Water Quality Objectives for Victoria Harbour WCZ

Agreement No. CE 35/2006(CE) Kai Tak Development Engineering Study Annex A cum Design and Construction of Advance Works KTAC and KTTS Studies – Investigation, Design and Construction
iv
Table 7.2 Summary Statistics of Marine Water Quality in the Kwun Tong and To Kwa Wan Typhoon Shelters in 2006
Table 7.3 Pollution Levels Measured at KTAC in October 2005
Table 7.4 Pollution Levels Measured at KTAC in January 2006
Table 7.5 Mitigation Proposals Considered
Table 7.6 Assumed Effluent Flow and Concentrations for THEES
Table 7.7 Pollution Loading from Stonecutters Sewage Treatment Works under HATS
Table 7.8 Predicted Water Quality at Indicator Points
Table 7.9 Approximate Dimension of Mixing Zones in KTAC and KTTS
Table 8.1 Relevant Projects Reviewed
Table 8.2 List of Existing DWFIs Under Proposed Upgrading Works
Table 8.3(a) Distribution of Pollution Loads in KTAC and Kowloon Bay
Table 8.3(b) Distribution of Pollution Loads in KTAC and Kowloon Bay
Table 8.4 Comparison of 6 Interception Options
Table 8.5 Comparison of 4 Disposal Options
Table 8.6 Interfacing Projects / Works
Table 8.7 Details of DSD Desilting Compound in KTD
Table 9.1 Representative ASRs selected for Odour Impact Assessment
Table 9.2 Existing Odour Emission Rates of KTN, KTAC, and KTTS
Table 9.3 Conversion Factors for Hourly to 5-second Average Concentration
Table 9.4 Odour Emission Rates (SOER (ou/m2/s) of KTN, KTAC, and KTTS under Different Modelling Scenarios
Table 9.5 Predicted Odour Concentrations at Representative ASRs under Different Assessment Scenarios
Table 9.6 Predicted Frequency of Exceedance of Odour Criterion at Representative ASRs under Mitigated Scenarios A1 and B1
Table 9.7 Predicted Frequency of Exceedance of Odour Criterion at Representative ASRs under Mitigated Scenarios A2 and B2
List of Figures Figure 1.1 Kai Tak Development Area
Figure 2.1 Locations of Storm Outfalls
Figure 3.1 Sampling Locations at KTN, KTAC and KTTS
Figure 3.2 Water Sampling Locations at Culvert Discharges
Figure 4.1 Proposed Sediment and Water Sampling at KTAC Areas
Figure 4.2 Typical Setup of Controlled Environmental for Odour Emission Laboratory Testing
Figure 5.1 Odour Generation mode in KTAC
Figure 5.2 Variations of Odour Concentration with Temperature
Figure 5.3 Variations of Odour Concentration with Water Depths
Figure 6.1 Remediation Selection Strategy
Figure 6.2 Layout Plan of the Trial Site and Treatment Areas for In-Situ Bioremediation Trial Test
Figure 7.1 Contribution of Existing Pollution Loading by Storm Outfalls

Agreement No. CE 35/2006(CE) Kai Tak Development Engineering Study cum Design and Construction of Advance Works Annex A – Investigation, Design and Construction KTAC and KTTS Studies
v
Figure 7.2 Locations of Monitoring Stations
Figure 8.1 Drainage Networks of Kai Tak Development
Figure 8.2 Proposed Drainage Networks (Ultimate Scheme) – Key Plan
Figure 8.3 Proposed Drainage Networks (Ultimate Scheme) (Sheet 1 of 11)
Figure 8.4 Proposed Drainage Networks (Ultimate Scheme) (Sheet 2 of 11)
Figure 8.5 Proposed Drainage Networks (Ultimate Scheme) (Sheet 3 of 11)
Figure 8.6 Proposed Drainage Networks (Ultimate Scheme) (Sheet 4 of 11)
Figure 8.7 Proposed Drainage Networks (Ultimate Scheme) (Sheet 5 of 11)
Figure 8.8 Proposed Drainage Networks (Ultimate Scheme) (Sheet 6 of 11)
Figure 8.9 Proposed Drainage Networks (Ultimate Scheme) (Sheet 7 of 11)
Figure 8.10 Proposed Drainage Networks (Ultimate Scheme) (Sheet 8 of 11)
Figure 8.11 Proposed Drainage Networks (Ultimate Scheme) (Sheet 9 of 11)
Figure 8.12 Proposed Drainage Networks (Ultimate Scheme) (Sheet 10 of 11)
Figure 8.13 Proposed Drainage Networks (Ultimate Scheme) (Sheet 11 of 11)
Figure 8.14 Proposed DSD Desilting Compound Sites under Recommended Outline Development Plan
Figure 8.15 General Layout Plan of Primary Desilting Compound in KTN
Figure 8.16 General Layout Plan of Secondary Desilting Compound in KTN
Figure 8.17 Details of Proposed Penstock for Box Culvert
Figure 8.18 Schematic Layouts of Operations at Box Culvert
Figure 8.19 Survey Sites for Man-entry Survey for Existing Drainage System
Figure 8.20 Typical Section of Desilting Compound in KTN
Figure 9.1 Representative ASRs selected for Odour Impact Assessment
Figure 9.2 Plan of Odour Source Sampling Locations
Figure 9.3 Existing Odour Strength of KTN, KTAC and KTTS
Figure 9.4 SOER vs Water Depth (KTAC and KTTS)
Figure 9.5 SOER vs DO Level (KTAC and KTTS)
Figure 9.6 SOER vs DO Level (Southern KTAC and KTTS)
Figure 9.7 Sampling Grids within KTAC and KTTS with Water Depth Less than 3m
Figure 9.8 Areas Proposed for In-situ Bioremediation
Figure 9.9 Odour Contour Plot for Existing (Unmitigated) Scenario
Figure 9.10 Odour Contour Plot for Mitigated Scenario A1
Figure 9.11 Odour Contour Plot for Mitigated Scenario B1
Figure 9.12 Odour Contour Plot for Mitigated Scenario A2
Figure 9.13 Odour Contour Plot for Mitigated Scenario B2

Agreement No. CE 35/2006(CE) Kai Tak Development Engineering Study Annex A cum Design and Construction of Advance Works KTAC and KTTS Studies – Investigation, Design and Construction
vi
List of Appendices Appendix 3.1 Sampling and Laboratory Analysis Report
Appendix 4.1 Laboratory Study of Odour Emissions From Sediment Under Different Environmental Conditions
Appendix 6.1 As-built Record Drawings for North Section Seawall
Appendix 6.2 As-built Record Drawings for South Section Seawall
Appendix 6.3 Location and Photos of Marine Growth and Sediment Samples
Appendix 6.4 Sketches for Options 2a, 3 and 4
Appendix 6.5 Photos of Site Inspection (North Section Seawall)
Appendix 6.6 Photos of Site Inspection (South Section Seawall)
Appendix 6.7 Cost Estimate on Options for Sediment Removal
Appendix 7.1 Methodology for Compiling the Pollution Loading Inventory
Appendix 7.2 Flow Vector Plots
Appendix 7.3 Time Series Plots for Current Speeds
Appendix 7.4 Water Quality Contour Plots
Appendix 8.1 Programme of Operation and Maintenance for Drainage Culvert System
Appendix 8.2 Manufacturer’s Catalogues for Maintenance Equipment

Agreement No. CE 35/2006(CE) Kai Tak Development Engineering Study cum Design and Construction of Advance Works Annex A – Investigation, Design and Construction KTAC and KTTS Studies
1-1
1 INTRODUCTION 1.1 Background 1.1.1 Kai Tak Approach Channel (KTAC) was identified as a distinctive issue for attention under
Stage 1 (Planning Review) of the South East Kowloon Development Comprehensive Planning and Engineering Review. According to all the previous studies conducted for the Kai Tak site, KTAC has been proposed to be reclaimed as part of the South East Kowloon Development. However, under the Stage 1 Planning Review, “no reclamation” has become the planning basis to formulate conceptual development options for Kai Tak Development (i.e. Outline Concept Plans [OCPs]) as well as in the preparation of the Preliminary Outline Development Plan (PODP). The PODP taking into account the findings of the preliminary technical assessments and the public views has been served as the basis for the environmental impact assessment and the engineering study in the Stage 2 Engineering Review of the Kai Tak Development.
1.1.2 Without reclamation at KTAC, the environmental impacts of the water bodies and sediments need to be addressed as they may impose constraints to the future development particularly on the landside. The impacts might include potential odour, water quality, and biogas impacts on the future developments around KTAC, Kowloon Bay and the Kwun Tong Typhoon Shelter (KTTS). The locality of KTAC is indicated in Figure 1.1.
1.1.3 One of the key environmental issues of the KTAC and nearby water bodies is the potential odour emissions. The unpleasant odour would cause nuisance and potential concern to the surrounding sensitive receivers and affect the potential surrounding landuses in the future. Yet, there is little useful information available on the odour issue of KTAC and odour control for sediments from overseas experience. In addition to KTAC, other major potential odour sources are also identified in the vicinity of the Kai Tak Development, including Kai Tak Nullah (KTN), Jordan Valley Culvert (JVC) Outfall, KTTS, sewage pumping stations, proposed culvert de-silting plants and nearby sewage treatment works.
1.1.4 The Kai Tak Development is classified as a Schedule 3 Designated Project under the Environmental Impact Assessment Ordinance (EIAO) and the final environmental acceptability of any proposed mitigation measures to address the potential odour problem of KTAC is subject to the EIAO process. Pursuant to Section 5(7)(a) of the EIAO, the Director of Environmental Protection (DEP) issued EIA Study Brief No. ESB-152/2006 “Kai Tak Development” in August 2006 for the Kai Tak Development project.
1.1.5 In the Stage 1 Planning Review, a number of studies had been carried out in relation to odour issue and sediment contamination in order to establish the site-specific emission inventory. Additional investigation and field surveys were commissioned in periods of hot summer season in order to assess the more severe odour impact by using predictive model. These investigations and surveys included:
(i) Odour surveys to understand odour impact distribution and source strength and to compare with representative sites;
(ii) Studies on sediment treatment and Bioremediation Pilot Scale Field Test to assess treatment methods through bench-scale tests and field tests; and
(iii) Water quality surveys to collect water quality and hydrodynamic data for detailed modelling of KTAC and other water bodies of Kai Tak Development (KTD) and to assess pollution loading and mitigation measures.

Agreement No. CE 35/2006(CE) Kai Tak Development Engineering Study cum Design and Construction of Advance Works Annex A – Investigation, Design and Construction KTAC and KTTS Studies
1-2
1.1.6 The report titled “Situation Report on Odour Issue of Kai Tak Development, Issue 3” (Situation Report) in November 2006 has provided the collective assessments on the odour issue based on the investigations and surveys. However, there are still limitations and uncertainties in the assessments that required further assessment in order to satisfy the EIAO requirements.
1.2 Overall Approach of Odour Impact Assessment 1.2.1 The overall approach to the odour impact assessment is illustrated below.
1.2.2 A background review study has been conducted to understand the existing environmental
problems associated with KTAC and KTTS. The review examined various previous studies undertaken for KTAC and KTTS, with particular emphasis on the Stage 1 Planning Review, in which a great deal of works had been conducted to address the environmental problems in KTAC and KTTS. The review study enabled the identification of the extent and magnitude as well as the possible causes of the environmental problems in KTAC and KTTS.
1.2.3 Findings of the review study also facilitated the identification of data gaps and the proposal to further surveys and laboratory testing to devise the possible odour generation mechanism within KTAC and KTTS. The accuracy of prediction of the odour generation mechanism is considered to be vital in formulating the appropriate mitigation measures.
1.2.4 Based on the above, a comprehensive assessment on the mitigating proposals for KTAC and KTTS has been performed. Assessments on the following mitigating proposals have been carried out:
(i) Treatment of sediments by appropriate technologies;
(ii) Improvement of water circulation by creating openings in the runway or installation of sluice gate to enhance tidal flushing effect; and
(iii) Containment of pollution entering the KTAC and KTTS.
Understand & Identifying Existing Environmental Problems
Odour Impact Assessment
Devising Odour Generation Mechanism and Formulate Possible Mitigation Measures
Finalize Appropriate Mitigation Measures for KTAC & KTTS
Identify Residual Odour Impacts
Evaluate Sediment Treatment Options
Examine Possible Containment of
Pollution Entering the KTAC & KTTS
Further Field Surveys & Laboratory Tests
Assess Possible Water Circulation
Improvement Options

Agreement No. CE 35/2006(CE) Kai Tak Development Engineering Study cum Design and Construction of Advance Works Annex A – Investigation, Design and Construction KTAC and KTTS Studies
1-3
1.2.5 Based on the data collected from the further odour surveys and laboratory testing, a quantitative odour impact assessment has been conducted in order to predict the residual odour impact, if any, of KTAC and KTTS on nearby air sensitive receivers after the implementation of mitigating proposals.
1.2.6 The results from the above would help to determine the appropriate proposal of mitigation measures for tackling the environmental problems of KTAC and KTTS.
1.3 Purpose and Structure of this Annex
Purpose of the Annex
1.3.1 The purposes of the odour impact assessment include the following:
(i) To identify the nature, extent and sources of the environmental problems in KTAC and KTTS;
(ii) To perform field investigation and laboratory tests to further quantity the environmental problems;
(iii) To devise the odour generation mechanism within KTAC and KTTS;
(iv) To carry out a comprehensive assessments on the mitigating proposals including the need for reclamation and its minimum extent at KTAC having regard to EIAO and PHO, sediment treatment, water circulation improvements and containment of pollution entering the KTAC and KTTS;
(v) To assess and quantify, if any, the residual odour impact; and
(vi) To recommend the appropriate approach and methodology for mitigating the environmental problems.
Structure of the Annex
1.3.2 The remainder of this Annex is structured as follows:
- Section 2 describes the identified environmental problems associated with KTAC and KTTS;
- Section 3 discusses the scope, methodology and findings of further detailed field surveys conducted under this Assignment;
- Section 4 discusses the scope, methodology and findings of further detailed laboratory testing performed under this Assignment;
- Section 5 outlines the odour generation mechanism within KTAC and KTTS;
- Section 6 describes and compares the possible sediment treatment techniques and recommends the most appropriate treatment method for KTAC and KTTS;
- Section 7 outlines the approach and results for the hydrodynamic and water quality impact assessments to improve water circulation within the Study Area;
- Section 8 presents the review of the preview and on-going relevant projects on the containment of pollution entering KTAC and KTTS; and

Agreement No. CE 35/2006(CE) Kai Tak Development Engineering Study cum Design and Construction of Advance Works Annex A – Investigation, Design and Construction KTAC and KTTS Studies
1-4
- Section 9 presents the approach and results of the odour modelling for the existing (unmitigated) and a number of mitigated scenarios as well as the residual odour impacts, if any, predicted at the air sensitive receivers.

Agreement No. CE 35/2006(CE) Kai Tak Development Engineering Study cum Design and Construction of Advance Works Annex A – Investigation, Design and Construction KTAC and KTTS Studies
2-1
2 IDENTIFICATION OF ENVIRONMENTAL PROBLEMS ASSOCIATED WITH KTAC AND KTTS
2.1 Existing Environmental Conditions
2.1.1 Kai Tak Approach Channel (KTAC) is a semi-enclosed water body bounded by the former Kai Tak Airport runway to the west and the breakwaters of the Kwun Tong Typhoon Shelter (KTTS) to the south. Waters from the northernmost of Kai Tak Nullah (KTN) requires travelling of about 3 km before reaching the outside water body of the Victoria Harbour via KTAC. The relatively long and narrow shape of KTAC together with the presence of a pair of breakwaters for KTTS at its outlet has severely constrained the water circulation in this marine channel. Water flow and its circulation within KTAC are slow and poor.
2.1.2 KTAC receives discharges from several large drainage systems of East Kowloon including Wong Tai Sin, San Po Kong, Kowloon Bay, Jordan Valley and Kwun Tong (see Figure 2.1). Currently, these systems receive primarily stormwater and street runoffs. However, contamination of KTAC by sewage from expedient connections (or other improper “sewage connection”) are also found.
2.1.3 Dated back to the 1960’s, due to lack of proper sewerage infrastructure, wastewater from domestic and industrial sources from upstream of KTAC were discharged to KTN when urban development was rapidly undertaken. Most of these discharges have then ceased due to the completed redevelopment, improvement of sewerage system through the East Kowloon Sewerage Master Plan and implementation of pollution control namely the completion of the Harbour Area Treatment Scheme Phase 2 in 2001. In recent years, with the demobilization of factories and industries within the catchment area of KTAC and the decommissioning of the former Kai Tak Airport, the discharge into KTAC are mainly domestic in nature.
2.1.4 KTTS is semi-enclosed by the former Kai Tak Airport runway and the existing breakwaters. Due to the low exchange rate of tidal flow, the water quality in this typhoon shelter was one of the poorest amongst all the typhoon shelters in Hong Kong.
2.1.5 Nevertheless, as wastewater from the previous discharges contain high levels of pollutants, together with the rather stagnant water system of the KTAC and KTTS, it stimulated deposition of the contaminated particles and thus resulting in a contaminated sediment layer at present.
2.2 Existing Drainage and Sewerage Systems in the Catchment Areas of KTAC and KTTS
2.2.1 Connecting to the upper portion of KTAC is the KTN, where it collects storm water from San Po Kong, Diamond Hill, Tsz Wan Shan, Wong Tai Sin, Wang Tau Hom, Lok Fu and Kowloon City and discharges into the KTAC. It also collects stormwater runoffs conveyed from the upland of West Kowloon via a bored tunnel under Kai Tak Transfer Scheme. The purpose of the transfer scheme is to relieve the flooding risk in West Kowloon and reduce part of the pipe upgrading works in that congested area. The Kai Tak Transfer Scheme will divert a maximum flow of about 40 m
3/s and 33 m
3/s respectively for a 1 in 50 year and 1 in
10 year design rainstorm event.
2.2.2 Apart from surface runoff, KTN also receives the secondary treated sewage effluent from Shatin and Tai Po Sewage Treatment Works (STWs) under the Tolo Harbour Effluent Export Scheme (THEES). The THEES has been designed to remove the nutrients input to the Tolo Harbour from Sha Tin and Tai Po STWs in the Tolo Harbour Catchment. The current flow discharging from these two sewage treatment works is about 6.6 m
3/s. At
present, about 400,000 m3 of effluent is being discharged to KTN everyday and it is planned
to be increased in future.

Agreement No. CE 35/2006(CE) Kai Tak Development Engineering Study Annex A cum Design and Construction of Advance Works KTAC and KTTS Studies – Investigation, Design and Construction
2-2
2.2.3 KTN is a rectangular open channel serving the Diamond Hill, Ngau Chi Wan and former Kai Tak Airport catchment areas of 1,121 ha. It is about 12 m wide at the upstream near San Po Kong and increases to about 22 m near Prince Edward Road East. Under the Preliminary Outline Development Plan (PODP) of the Kai Tak Development (KTD), the channel will be decked and convert to a 7-cell box culvert after Prince Edward Road East, and eventually become a 14-cell culvert at the outfall. The size of each cell is 5 m wide and 4.5 m high. The invert level of the outfall is -0.68 mPD and similar to Jordan Valley Box Culvert (JVBC), the culvert is influenced by tidal and always submerged in seawater. The upstream of the KTN connecting to 3 major drainages, including twin-cell box culvert from Lok Sin Road, 4-cell box culvert from North Apron (decked nullah no. 3), and single cell box culvert from San Po Kong area.
2.2.4 Three major existing culvert outfalls are serving Kowloon City, San Po Kong and Diamond Hill/ Ngau Chi Wan areas into KTN. Dry weather flow interceptors (DWFIs) have been installed by the Drainage Services Department (DSD) at the upstream of these culverts along the channel section of KTN, so as to intercept and collect discharges (including sewage) from expedient connections.
2.2.5 Information from DSD indicated that there are 21 existing drainage connections to KTN with 12 major drainage connections intercepted into the DWFI pipes. The remaining 9 existing drainage connections not intercepted by DWFI are mostly exclusive road drainage connection (6 nos.) and the pipes with size not greater than 525 mm diameter with small catchment areas (3 nos.).
2.2.6 There may also be some unidentified misconnections and building expedient connections in the catchment areas of KTAC and KTTS. However, according to the Environmental Protection Department (EPD), over 80% of some 90 numbers of expedient connections had already been rectified according to an expedient connection survey for Wong Tai Sin area undertaken in 2002.
2.2.7 Jordan Valley Box Culvert (JVBC) is a stormwater drain serving a drainage catchment of 592 ha. It is the arterial drainage system collecting flow from Kowloon Bay, Ngau Tau Kok, Jordan Valley and the rural area of Fei Ngo Shan. The existing 7-cell box culvert is of 4,120mm wide and 3,800 mm high. The invert level of the outfall is -0.83 mPD and the culverts are under tidal influence most of the time.
2.2.8 The upstream of the JVBC consists of two limbs. The Jordan Valley Limb is a four-cell culvert collecting runoff from Telford Garden and Jordan Valley. The Ngau Chi Wan Limb is a three-cell box culvert serving northern Kowloon Bay and Ngau Chi Wan. Based on drainage impact assessment conducted under South East Kowloon Development Planning Review, no upgrading works was proposed under Drainage Improvement in East Kowloon – Design & Construction and East Kowloon Drainage Master Plan Study.
2.3 Existing Odour, Water and Sediment Pollution Sources
KTAC as the Key Odorous Area
2.3.1 Based on the review and field observations undertaken under this study, it was found that the upper portion of KTAC and some locations in its vicinity are the odour hotspots locations. The possible odour sources at KTAC would be:
(i) Historical accumulation of contaminated sediments which far exceeds the natural attenuation capacity of the channel;
(ii) Sediments exposed during very low tides along the seawall;
(iii) Possible contribution from continuous polluted discharges from KTN, a culvert next to the mouth of KTN and Jordan Valley Culvert Outfall; and
(iv) Odorous gases from headspace of conduits at Jordan Valley Culvert Outfall.

Agreement No. CE 35/2006(CE) Kai Tak Development Engineering Study cum Design and Construction of Advance Works Annex A – Investigation, Design and Construction KTAC and KTTS Studies
2-3
At North Apron Section of KTN
2.3.2 This section of KTN is located at the North Apron of the former Kai Tak Airport in a fairly flat gradient. The section starting from the middle part of the North Apron is affected by the tidal influx and is always flooded with water. The water quality begins to deteriorate at this section as there are culverts from the hinterland discharging polluted runoffs into the KTN. While the tidal influence caused backup of seawater, sediments originated from polluted discharges starts to deposit at the channel bed. Bubbles of odorous gases were observed evolving from the deposit of channel bottom with smell of H2S.
2.3.3 At the mouth of KTN, there are polluted discharges from culverts joining KTN slightly upstream due to expedient connections and cumulated sediment. H2S bubbles were constantly observed.
2.3.4 The possible odorous sources of this section of KTN are:
(i) Polluted discharges from Kowloon City, San Po Kong, Ngau Tau Kok, Diamond Hill / Ngau Chi Wan connected to culverts located in North Apron, where anaerobic degradation of pollution load carried by polluted discharges releasing odour with sewage smell at the openings of culverts adjoining KTN; turbulent during mixing with KTN water also enhancing the release of odour;
(ii) Anaerobic degradation of accumulated sediment at the nullah bed resulting in evolution of H2S gas from water. It is found at the downstream KTN (starting around the middle of North Apron) where it is affected by tidal current with slow water flow.
2.3.5 Although there are DWFIs installed at the upstream of these culverts, continuous polluted discharges were observed in the nullah. These drainage culverts have rather large catchment size and are likely the major pollution load contributor to this section of KTN. Other pollution load contributor may be some unidentified misconnections and building expedient connections. These are subject to further investigation by the relevant Government departments.
THEES and Upstream of KTN North to Prince Edward Road East
2.3.6 Effluent from THEES is exported from Tai Po and Sha Tin STWs, where the sewage is secondary treated. The treated effluent is exported through a tunnel system connecting Sha Tin STWs to KTN and discharges at a location near Wong Tai Sin Police Station. Despite the treated effluent from THEES is not identified as the key odour source, it has some characteristics odorous smell but is not irritating. Based on the observation on site, the smell was like “soil odour after rain”. The long standing time inside the tunnel system may give rise to some odour generation possibly from the anoxic conditions of the tunnel.
2.3.7 The origin of odour is different from that generated from the sediment in KTAC. The turbulent water surface due to the high flow rate would enhance the release of odorous chemicals to the atmosphere at a local level. This type of odour would be reduced significantly further downstream. The downstream area of KTN is benefited by a large base flow and the flushing effects provided by THEES.
DWFI Openings at KTN
2.3.8 Field observations showed that most of the connections discharging to KTN have been equipped with DWFIs. Only some minor points still have discharges in dry weather condition. Decomposition of polluted discharge generates odour inside the conduits. Odorous gases are trapped at the headspace of conduits at various DWFI points. The conduit length may be quite long in some cases and the trapped odorous gases may be released to the surroundings at the openings of DWFI. It was also observed that the odour was localized at these openings along KTN. The major one is that located adjacent to the bridge of Lok Sin Road.

Agreement No. CE 35/2006(CE) Kai Tak Development Engineering Study Annex A cum Design and Construction of Advance Works KTAC and KTTS Studies – Investigation, Design and Construction
2-4
At Jordan Valley Culvert Outfall
2.3.9 This outfall has the same characteristics as those of DWFI openings of KTN. As it is the only outlet to KTAC, the outfall exhibits odour from the headspace of the culvert particularly during flood tides.
At KTTS
2.3.10 The water quality in KTTS has also been heavily polluted by sewage discharges and discharges from polluting industries in the past. Similar to KTAC, the current discharge into KTTS are mainly domestic in nature.
2.3.11 Besides, vast amount of sediments has been deposited on the bottom of these areas. These sediments contain high concentrations of heavy metals and organic matter which generates odorous chemicals under anoxic conditions. The mechanism of odour generation is described below.
2.4 Extent of Environmental Problems Based on Findings of Previous Surveys and Investigations
2.4.1 In the previous study Agreement No. CE 4/2004 (TP) South East Kowloon Development Comprehensive Planning and Engineering Review Stage 1: Planning Review, several odour surveys and assessments have been conducted and reports prepared as listed below.
Report No.1 2.4.2 Odour Patrol and Air Sampling in Kai Tak Development Area, Final Report, 15 March
2006 by Odour Research Laboratory, Department of Civil & Structural Engineering, the Hong Kong Polytechnic University. It was completed between December 2005 and January 2006 with over 34 spots in KTD study area and gave an initial indication of odour situation of the KTD area during winter season.
Report No.2 2.4.3 Laboratory Analysis of Odorous Chemicals, 6 March 2006 by Lam Geotechnics Limited.
It was completed in January 2006 giving the chemical analysis of the air samples collected at 10 representative locations over KTD.
Report No. 3 2.4.4 Benchmark Odour Survey at Kai Tak Approach Channel/Kowloon Bay and
Representative Sites Odour Sampling and Analysis, Final Report, 26 June 2006 by Odour Research Laboratory, Department of Civil & Structural Engineering, the Hong Kong Polytechnic University. Four sites with odour concern at present or in the past were studied namely Shing Mun River, Sam Ka Tsuen Typhoon Shelter, Kowloon Bay and Kai Tak Approach Channel which was competed in May 2006.
Report No.4 2.4.5 Test Report of Benchmark Odour Survey, May 2006 by Fugro Technical Services Limited.
It gave a report on the odorous chemical testings of air samples collected at Shing Mun River, Sam Ka Tsuen Typhoon Shelter, Kowloon Bay and Kai Tak Approach Channel which was competed in May 2006.
Report No.5 2.4.6 Kai Tak Planning Review: Odour Patrol and Air Sampling in Kai Tak Development
Areas (Including Additional Sampling and Survey Work), Final Report by Odour Research Laboratory, Department of Civil & Structural Engineering, the Hong Kong Polytechnic University. It included a comprehensive surveys over KTD completed in July and August 2006 with odour patrol, emission source surveys, olfactometry analysis, hedonic tone test and hydrogen sulphide measurements.

Agreement No. CE 35/2006(CE) Kai Tak Development Engineering Study cum Design and Construction of Advance Works Annex A – Investigation, Design and Construction KTAC and KTTS Studies
2-5
Report No.6 2.4.7 Kai Tak Planning Review: Odour Potential Analysis For Water and Sediment Samples,
Final Report, 6 October 2006 by Odour Research Laboratory, Department of Civil & Structural Engineering, the Hong Kong Polytechnic University. It contains odour emission testing in relation to the bioremediation pilot field trial.
Report No.7 2.4.8 Kai Tak Planning Review: Odour Survey at Representative Sites Around Victoria
Harbour/Shing Mun River, Final Report, 6 October 2006 by Odour Research Laboratory, Department of Civil & Structural Engineering, the Hong Kong Polytechnic University. An odour survey at the selected representative sites around Victoria Harbour and Shing Mun River to collect baseline information that may be valuable to compare with the ambient odour levels and the predicted odour levels at the Kai Tak Development.
Odour Surveys and Measurements Completed in the Vicinity of the Study Area
2.4.9 Odour surveys including odour patrol, daytime and evening odour emission rate measurement and ambient air odour survey, etc. were carried out in July and August 2006. The results of odour patrol indicated that high odour intensity was detected at the upper and mid KTAC area and the smell was like a decayed waste flavour. Some gas bubbles were also intermittently coming out of the water surface. Moderate odour intensity was detected at the lower KTAC area.
2.4.10 Regarding KTN, high odour intensity (smell like “soil odour after rain”) was detected at the THEES location, while moderate odour intensity was detected at the mid KTN.
2.4.11 Slight odour intensity was detected at the KTTS. Yet, no objectionable odour was detected at the Kowloon Bay (along the runway facing Kowloon Bay), To Kwa Wan Typhoon Shelter and Ma Tak Kok Public Pier.
2.4.12 Key areas with potential odour emissions are located at:
(i) areas around KTAC, particularly northern portion and near Jordan Valley Culvert; (ii) embankments of the North Apron section of KTN (extent around 30m - 50m from
the source); and (iii) parts of the area within KTTS.
2.4.13 The results of hedonic tone test, which is a test showing whether the air sample is pleasant
or not, demonstrated that “objectionable” odour was only detected in KTAC, KTN and KTTS areas in daytime. Among these areas, the strongest odour was detected in the upper KTAC area. The negativity of hedonic tone test results generally corresponds to the results of the laboratory H2S measurement. The level of odour emission rates on the water surfaces from high to low are ranked as: upper KTAC > mid KTAC > lower KTAC > KTN > KTTS. This ties in with the general understanding that the pollutant in sediment is strongest and thickest at upstream where siltation readily takes place.
2.4.14 The odour concentrations and emission rates at mid-stream of KTAC showed a vast difference between levels at bank and at centre, with the former being generally higher. The results showed that the bank has about 2.4 times odour unit and about 4.14 times emission rate higher than the centre.
2.4.15 At bank, the pollutants tend to settle at a faster rate and thus thicker deposits. In addition, the water is shallower there. Shallow water offers some favourable conditions to the evolution of H2S to atmosphere, namely: (a) offers less static resistance for gas bubbles to overcome, (b) offers shorter path and smaller pressure to dissolve H2S and (c) diffuses less H2S to elsewhere due to the shorter water column.

Agreement No. CE 35/2006(CE) Kai Tak Development Engineering Study Annex A cum Design and Construction of Advance Works KTAC and KTTS Studies – Investigation, Design and Construction
2-6
2.4.16 Measurements of odour emission rate in the evening were also taken in view of the possible worst dispersion condition during that time of a day. Similar to the results of hedonic tone test for the daytime, the strongest odour was also detected in the upper KTAC area in the evening time. The level of odour strength on the water surfaces from high to low is also ranked as: upper KTAC > mid KTAC > lower KTAC.
2.4.17 Evening values appear to be slightly higher than daytime values in terms of emission rates at upper and mid-KTAC. However, precaution must be taken when interpreting the individual odour levels detected as there are other factors affecting them namely the water depth of sediment sample, water/sediment temperature, etc. Results also showed that the odour concentrations are greatly affected by the water depth.
Ambient Air Odour Survey
2.4.18 Ambient air samples for olfactometry analysis were also undertaken at the selected locations of KTAC and KTN. The ambient odour concentrations at the sampling locations were affected by wind speed and wind direction. It was found that downwind of odour source such as KTAC received higher odour concentrations.
2.4.19 High ambient odour concentrations were found at the mouth of KTN and at the junction with a polluted culvert noted with sewage discharges due to expedient connections. Results also indicated that the polluted discharges are at lower KTN. Thus, it is very likely that the odour generated from the sediments cumulating on the channel bed contribute to quite a significant odour problem.
2.4.20 As observed in the previous odour survey, most of the dry weather discharges along the upper KTN from Wong Tai Sin Police Station to Prince Edward Road East have been collected by the DWFIs. For KTN section in the North Apron, minimal odour contributing from the upper KTN section was noted. At the downstream section of KTN, however, as the gradient of KTN is gentle and the section is affected by tidal effects, causing siltation and thus greater odour problem arises.
Headspace Gas Survey
2.4.21 Ambient air samples were also collected at the headspace of two DWFIs and the Jordan Valley Outfall. The air samples were analysed for odour concentration.
2.4.22 DWFI is a source of odour emission because of the degradation of pollutants within the dry weather flow within the network of culverts. DWFI is an opening exposed to the ambient area. Similarly, outfalls like Jordan Valley Outfall are also emitting odour. It was found that the odour concentration is closely associated with the H2S concentration.
2.4.23 The trapped gas was found to be odorous due to stagnant condition there. Generally, odour emission from DWFIs is likely in the form of passive diffusion which will in turn have only localized impact. At Jordan Valley Outfall, however, the headspace gas would be propelled during high tide due to displacement. Due to the larger volume of gas and closer proximity of the latter to Kai Tak Development, the threat from the latter should be more closely attended to.
Further Laboratory Analysis of Ambient Air Samples
2.4.24 An additional 6 more ambient air samples were collected for laboratory analysis in order to determine the composition of the “most odorous” gases at the worst locations. Twenty two different odorous chemicals were tested.

Agreement No. CE 35/2006(CE) Kai Tak Development Engineering Study cum Design and Construction of Advance Works Annex A – Investigation, Design and Construction KTAC and KTTS Studies
2-7
2.4.25 As the “smell” of odour is a combined effect of odorous chemicals, the relationship between chemicals and odour unit is in general difficult to be drawn. However, one obvious phenomenon is that the general higher H2S concentration and its low threshold value indicate that its contribution to the odour problem of KTAC is most significant. This is in line with the high H2S concentration observed in domestic sewage.
Key Findings of Previous Odour Surveys and Measurements
2.4.26 It is found that the highest emission rate is found at upper KTAC area both in daytime and evening. The most negative value of hedonic tone test, which indicate the relative dislike of the odour, is also found in upper KTAC area.
2.4.27 In southern Kai Tak Runway and To Kwa Wan Typhoon Shelter/ Kowloon Bay, the result of Hedonic Tone test is 0. This indicates that no offensive odour was detected in these areas.
2.4.28 Comparing the results at bank and in the centre, the odour concentrations and emission rates at the bank are much higher than those at centre. In particular, odour concentration shows a larger deviation. This is due to higher odour concentration would be emitted from the dirtier and thicker sediment at bank, where water depth is also shallowest. Shallow water is also favourable for odour liberations.
2.4.29 Apart from the spatial variation between bank and centre of KTAC, higher odour level is also observed at the two major outfalls (i.e. KTN and Jordan Valley Outfalls) where polluted sediment tends to settle when discharges meet seawater at KTAC. Settlement causes accumulation of pollutants and provides a suitable environment such that biomass tends to develop to liberate obnoxious H2S. Desilting at outfalls is therefore an effective mitigation measure, apart from measures that could stop pollution at source. In line with that, odour intensity decreases generally from upstream to downstream. This is expected as siltation is not so serious at downstream.
2.4.30 There is an obvious trend that odour due to THEES drops quickly as it flows along the Wong Tai Shin/ San Po Kong area, indicating that by the time the flow reaches KTAC, most of the odorous portions might have been evaporated. Contribution from THEES to KTAC odour is thus negligible. Odour problem associated with DWFI is also localized.
2.4.31 It is noted that high odour concentration was detected at the air spaces of JVBC, which is substantially higher than most of the KTAC areas. Specifically high odour levels could be due to the piston effect of foul gas being expelled from the long stretch of the heavy silted JVBC during period of flood tides.
Benchmark Odour Surveys and Measurements in Other Areas of Hong Kong
2.4.32 A benchmark odour survey has been carried out in order to understand the seriousness of the odour problem at KTAC and to compare with other bioremediated sites in Hong Kong,
Benchmark Odour Survey in May 2006
2.4.33 The benchmark odour survey has conducted sampling and analysis of sediment, water and air samples for odour characteristics at four areas namely:
(i) Shing Mun River (SMR) area with previous application of bioremediation;
(ii) Sam Ka Tsuen Typhoon Shelter (SKTTS) with previous application of bioremediation;
(iii) KTAC (as project reference); and
(iv) Kowloon Bay (as project reference).

Agreement No. CE 35/2006(CE) Kai Tak Development Engineering Study Annex A cum Design and Construction of Advance Works KTAC and KTTS Studies – Investigation, Design and Construction
2-8
2.4.34 All the air samples were taken above the water surface. In terms of odour emission rates, SKTTS has the lowest odour emission rate while those found at Kowloon Bay is the second lowest. Although the concentration and emission rates at KTAC and SMR appear to be comparable, the latter presents the worst conditions at outfalls whilst the former is a general case of upstream of KTAC.
2.4.35 The acid volatile sulphide (AVS) and total organic carbon (TOC) contents of sediment samples from KTAC were found to be significantly higher than the other sites, except one sample from Kowloon Bay. High AVS is an indicator of odorous sulphides present in sediment. High TOC also indicates the potential for decomposition anaerobically if oxygen is not adequately present. Therefore, higher source odour concentration would be expected for the air samples collected at KTAC.
2.4.36 However, the measured source odour concentrations and hence the source odour emission rates at the four benchmark sites fall within a small range with lower values recorded at SKTTS and Kowloon Bay. This might reflect the inherent limitation of olfactometry analysis with low sensitivity in the low odour concentration range and thus cannot report the true difference in odour source emissions from the four benchmark sites. Another possibility is the measurement results were affected by the non-objectionable background smell (may be regarded as “seawater smell”) of the water at the four benchmark sites.
2.4.37 H2S level at the elevated odour locations (with high odour concentrations) of KTAC, SMR and SKTTS showed the highest concentration measured amongst all the other odorous chemicals tested. This shows that H2S is the main component of odour and is typical characteristic of normal sewage.
2.4.38 H2S is a slightly soluble gas in water and the solubility varies with pH levels. At low pH, more gaseous H2S will be released. In addition, H2S would also dissociate in water to SH
-
and H+ ions and the degree of dissociation would also increase with pH levels. At KTAC
where pH is around 7, liberation of H2S is a common phenomenon. H2S is produced predominantly in the sediment layer which is under anaerobic condition along KTAC and some parts of KTN, and transfers in small bubbles to the atmosphere. This was observed in the field that many bubbles came from the seabed and sometimes brought along by blackish floating scum.
2.4.39 From some studies on odour from wastewater, sulphides are not usually formed in water if the DO concentration in water is greater than 0.5mg/L (ASCE, 1989)
1. For sulphate to be
reduced to sulphide, a state of either no free oxygen or no other oxidizing agent must exist. Thus, DO concentration of 1.0 mg/L is generally sufficient to prevent the formation of sulphides (McLaren 1988
2) under general sewerage environment. Wastestreams with less
than 1.0mg/L DO are favourable for sulphide generation when other factors are also favourable (McLaren 1988).
2.4.40 In this survey, the sulphide concentrations of water at all sites were found less than the reporting limit of 0.1mg/L (far below the solubility limit), implying that sulphide was not found in water with sufficient concentration to contribute to the odour generation. Hydrogen sulphide is likely produced predominantly in the sediment layer which is under anaerobic condition along KTAC and some parts of KTN, and transfers in small bubbles to the atmosphere. This was also in line with the field observation that some odorous bubbles came from the seabed and sometimes brought along with some blackish sludge-like solids.
2.4.41 This survey also revealed that the odour source comes mainly from H2S liberated from sediment in KTAC.
1 American Society of Civil Engineers (ASCE) 1989, Sulphide in Wastewater Collection and Treatment Systems. New York. 324p. 2 McLaren, Frederick R. 1988. Concrete Pipe Handbook. American Concrete Pipe Association. Vienna Virginia. 88p.

Agreement No. CE 35/2006(CE) Kai Tak Development Engineering Study cum Design and Construction of Advance Works Annex A – Investigation, Design and Construction KTAC and KTTS Studies
2-9
Further Benchmark Odour Survey in August 2006
2.4.42 A further odour survey at representative sites around Victoria Harbour and Shing Mun River was conducted in order to understand the background odour levels along the general seashores of Hong Kong. The study locations in this survey included:
Kowloon Side of Victoria Harbour:-
(i) Avenue of Stars at Tsim Sha Tsui Promenade (KLN-1);
(ii) Laguna Verde at Hung Hom (KLN-2);
Hong Kong Side of Victoria Harbour:-
(iii) Expo Promenade near Golden Bauhinia Square, Wanchai (HK-1);
(iv) West Embankment, Provident Centre, North Point (HK-2);
(v) Waterfront at Lei King Wan, Sai Wan Ho (HK-3); and
Shing Mun River:-
(vi) Shing Mun River in the vicinity of Belair Gardens, Shatin (SMR-BG1)
2.4.43 These locations were selected because they are well-known public places with frequent access by the public and could reflect the general situation around Hong Kong seashore as well.
2.4.44 Ambient air samples were collected on shore at these locations for olfactometry analysis and hedonic tone testing. In the vicinity of the selected locations, air samples were further collected above seawater using “hood” method to determine the odour emission rate.
2.4.45 According to the survey results, the hedonic test scale for air ambient samples collected at Victoria Harbour was generally from 0 to -1.2 representing neutral to mildly unpleasant odour. The hedonic tone test results in general equal to or just below -1, which is close to neutral smell. As observed on site, odour was not noticeable along Victoria Harbour and Shing Mun River except at Avenue of Stars and Provident Centre where there was mildly smell of decayed wastes probably due to local stagnant water condition.
2.4.46 The measured ambient odour concentrations and emission rates at KTAC are generally slightly higher than the selected sites in Victoria Harbour/ Shing Mun River, except at lower KTAC.
2.4.47 It is interesting to note that there is significant odour in terms of measured odour concentrations around Victoria Harbour and Shing Mun River in this survey. Around the Victoria Harbour, there is a typical background odour of seawater, which is around 10 to 20 ou/m
3. This may be pleasant or unpleasant, but not offensive
2.4.48 It should be borne in mind that a measured low odour concentration value would normally have a higher degree of error. Judging from the above, we can only conclude that background odour does exist around all waters at the locations tested, in the range of 15-25 ou/m
3.
2.4.49 This further benchmark odour survey concluded that the background odour generally exists around Victoria Harbour, but not necessarily offensive.

Agreement No. CE 35/2006(CE) Kai Tak Development Engineering Study Annex A cum Design and Construction of Advance Works KTAC and KTTS Studies – Investigation, Design and Construction
2-10
Summary of Previous Findings
2.4.50 Previous findings revealed that the major inflows to KTAC are the THEES, culverts from Kowloon City, Diamond Hill and Jordan Valley. It was found that the flows from THEES do not contribute to major odour problem. However, flows from Kowloon City and Diamond Hill are very likely to cause odour problem when the flows are intercepted into downstream of KTN. Apart from this, flows from Jordan Valley also contribute to the odour problem at KTAC.
2.4.51 Based on the data collected from previous studies mentioned above, the key odour problems being identified are at KTAC and its vicinity such as the lower KTN in North Apron, the Jordan Valley Box Culvert and KTTS. Three areas are considered with objectionable odour emission:
� Section of Kai Tak Nullah in North Apron;
� KTAC; and
� Part of KTTS.
2.4.52 While two key observations that supported other areas (i.e. THEES, former Kai Tak Runway area and To Kwa Wan Typhoon Shelter/ Kowloon Bay) do not contribute to the odour problem in the Kai Tak Development:
� There is a clear trend that the odour due to THEES drops quickly as it flows along the Wong Tai Sin/ San Po Kong area, indicating that by the time the flow reaches KTAC, most of the odorous portions might have been evaporated. Contribution from THEES to KTAC odour might become negligible.
� In the southern Kai Tak Runway area and To Kwa Wan Typhoon Shelter/ Kowloon Bay, the result of Hedonic Tone test is 0. This indicates that no offensive odour was detected in these areas.
2.4.53 Based on the findings of previous surveys and investigations as summarized above, it is considered necessary to conduct further detailed field surveys and laboratory testing in order to delineate the odour emitting areas and to determine the mechanism of odour generation of the three key areas listed above namely KTN in North Apron, KTAC and KTTS. Details of the scope, assessment approach and methodology, and the results and analysis of the further detailed field surveys and laboratory testing are presented in Sections 3 and 4 respectively.
2.5 Reference
Odour Research Laboratory, Department of Civil & Structural Engineering, the Hong Kong Polytechnic University, Odour Patrol and Air Sampling in Kai Tak Development Area - Final Report, 2006
Lam Geotechnics Limited, Laboratory Analysis of Odorous Chemicals, 2006
Odour Research Laboratory, Department of Civil & Structural Engineering, the Hong Kong Polytechnic University, Benchmark Odour Survey at Kai Tak Approach Channel/Kowloon Bay and Representative Sites Odour Sampling and Analysis, Final Report, 2006.
Fugro Technical Services Limited, Test Report of Benchmark Odour Survey, 2006
Odour Research Laboratory, Department of Civil & Structural Engineering, the Hong Kong Polytechnic University, Kai Tak Planning Review: Odour Patrol and Air Sampling in Kai Tak Development Areas (Including Additional Sampling and Survey Work), Final Report, 2006

Agreement No. CE 35/2006(CE) Kai Tak Development Engineering Study cum Design and Construction of Advance Works Annex A – Investigation, Design and Construction KTAC and KTTS Studies
2-11
Odour Research Laboratory, Department of Civil & Structural Engineering, the Hong Kong Polytechnic University, Kai Tak Planning Review: Odour Potential Analysis For Water and Sediment Samples, Final Report, 2006
Odour Research Laboratory, Department of Civil & Structural Engineering, the Hong Kong Polytechnic University, Kai Tak Planning Review: Odour Survey at Representative Sites Around Victoria Harbour/Shing Mun River – Final Report, 2006.

Agreement No. CE 35/2006(CE) Kai Tak Development Engineering Study Annex A cum Design and Construction of Advance Works KTAC and KTTS Studies – Investigation, Design and Construction
2-12

Agreement No. CE 35/2006(CE) Kai Tak Development Engineering Study cum Design and Construction of Advance Works Annex A – Investigation, Design and Construction KTAC and KTTS Studies
3-1
3 FURTHER DETAILED FIELD SURVEYS
3.1 Purpose and Objectives 3.1.1 Based on the findings of previous surveys and investigations as discussed in Section 2 of
this report, it is considered necessary to conduct further detailed field surveys in order to delineate as well as to determine the emission strength of the odour emitting areas within the three identified key areas namely KTN in North Apron, KTAC and KTTS.
3.1.2 It is also the purpose of this further detailed field survey to collect relevant environmental data at different sampling locations within KTAC and KTTS for subsequent analysis of their potential correlation with the odour emission strength.
3.2 Approach and Methodology 3.2.1 The scope of this field survey covers the following:
� Conduct odour sampling using a wind tunnel method and in-situ H2S measurements at the designated sampling locations (including one QA/QC station) within KTN, KTAC and KTTS;
� Conduct air sampling using sampling tube and in-situ H2S measurements at Jordan Valley Culvert Outfall (JVCO) and two box culverts at KTN;
� Carry out H2S analysis, olfactometry and hedonic tone tests for the collected samples in the laboratory;
� Carry out in-situ measurements of marine water for dissolved oxygen (% saturation and mg/L), water depth (m), salinity (ppt), redox potential (mV) and pH, and ambient air and water temperature (
oC);
� Conduct water sampling at culvert discharges of KTN and odour potential test on water samples in the laboratory; and
� Record site conditions during each sampling.
3.2.2 There are two available sampling methods for surface area sources like the surface of KTN, KTAC and KTTS. One is dynamic flux hood sampling method and the other one is wind tunnel. Both methods are common used worldwide. The area sources of concern in this survey large open areas where emissions are generally not constant across the site and vary with time being affected by meteorological conditions. Referring to the literature review on the flux hood sampling method, this method is likely to represent odour emission rates under calm atmospheric conditions. On the other hand, the wind tunnel is deemed the most appropriate method for measuring odour emission rates from large area sources (Smith and Watts, 1994; Schmidt and Bicudo, 2002). A detailed discussion of the sampling method is included in Watts (1999a). In regard to the choice between a flux hood and a wind tunnel, Watts (1999a) concluded that the flux hood (isolation chamber) was not designed to take into account convective mass transfer caused by air movement above an emitting surface and the wind tunnel system could better simulate wind movement in the atmosphere and is considered to be the more appropriate sampling technique in the determination of odour and VOC emissions from an area surface than flux hoods. Based on the above reasons, wind tunnel is selected for the odour survey.
3.2.3 For odour sampling by wind tunnel, in order to determine the appropriate inflow rate, a sensitivity test for different inflow rates has been conducted. Details of the inflow rate sensitivity test for wind tunnel are presented in Appendix 3.1.
3.2.4 All measurements and sampling for KTN, KTAC and KTTS were carried out during neap ebb tide with reference to the tidal chart of the Hong Kong Observatory to capture the worst case emissions when the water depth is the shallowest. For JVC and box culverts, measurements were measured during neap tide at both flood and ebb tides to capture the
Agreement No. CE 35/2006(CE) Kai Tak Development Engineering Study Annex A cum Design and Construction of Advance Works KTAC and KTTS Studies – Investigation, Design and Construction
3-2
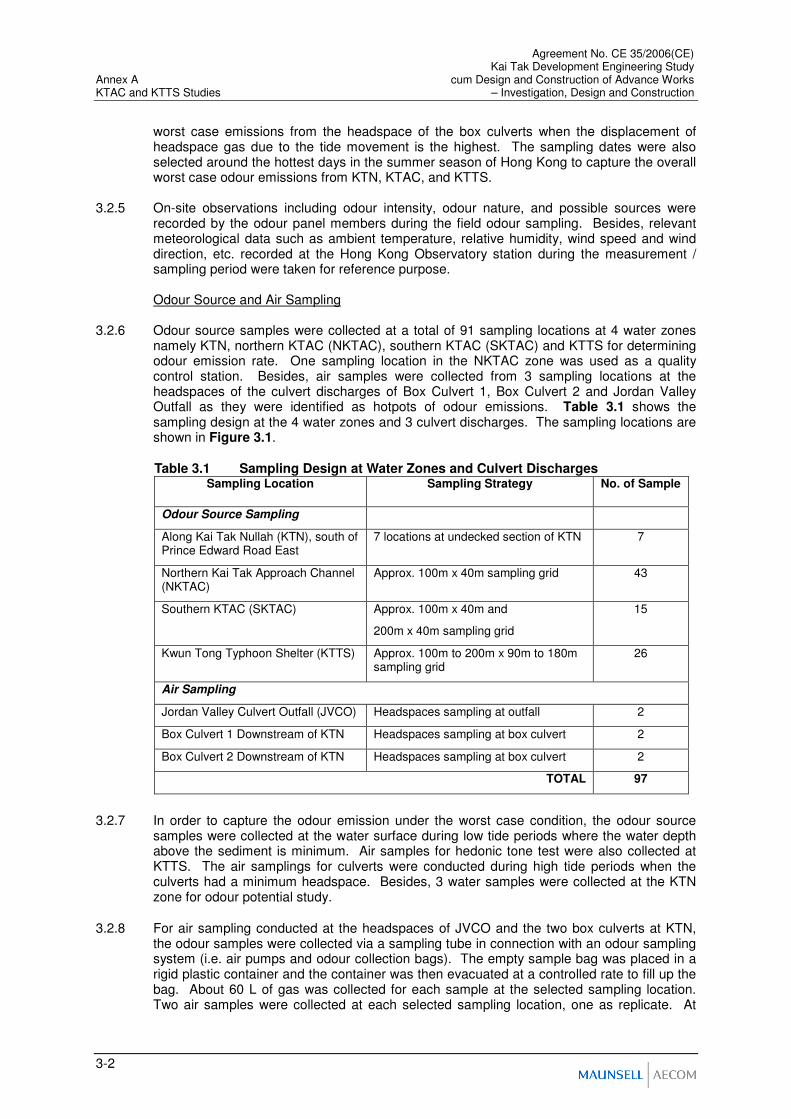
worst case emissions from the headspace of the box culverts when the displacement of headspace gas due to the tide movement is the highest. The sampling dates were also selected around the hottest days in the summer season of Hong Kong to capture the overall worst case odour emissions from KTN, KTAC, and KTTS.
3.2.5 On-site observations including odour intensity, odour nature, and possible sources were
recorded by the odour panel members during the field odour sampling. Besides, relevant meteorological data such as ambient temperature, relative humidity, wind speed and wind direction, etc. recorded at the Hong Kong Observatory station during the measurement / sampling period were taken for reference purpose.
Odour Source and Air Sampling
3.2.6 Odour source samples were collected at a total of 91 sampling locations at 4 water zones namely KTN, northern KTAC (NKTAC), southern KTAC (SKTAC) and KTTS for determining odour emission rate. One sampling location in the NKTAC zone was used as a quality control station. Besides, air samples were collected from 3 sampling locations at the headspaces of the culvert discharges of Box Culvert 1, Box Culvert 2 and Jordan Valley Outfall as they were identified as hotpots of odour emissions. Table 3.1 shows the sampling design at the 4 water zones and 3 culvert discharges. The sampling locations are shown in Figure 3.1.
Table 3.1 Sampling Design at Water Zones and Culvert Discharges Sampling Location Sampling Strategy No. of Sample
Odour Source Sampling
Along Kai Tak Nullah (KTN), south of Prince Edward Road East
7 locations at undecked section of KTN 7
Northern Kai Tak Approach Channel (NKTAC)
Approx. 100m x 40m sampling grid 43
Southern KTAC (SKTAC) Approx. 100m x 40m and
200m x 40m sampling grid
15
Kwun Tong Typhoon Shelter (KTTS) Approx. 100m to 200m x 90m to 180m sampling grid
26
Air Sampling
Jordan Valley Culvert Outfall (JVCO) Headspaces sampling at outfall 2
Box Culvert 1 Downstream of KTN Headspaces sampling at box culvert 2
Box Culvert 2 Downstream of KTN Headspaces sampling at box culvert 2
TOTAL 97
3.2.7 In order to capture the odour emission under the worst case condition, the odour source
samples were collected at the water surface during low tide periods where the water depth above the sediment is minimum. Air samples for hedonic tone test were also collected at KTTS. The air samplings for culverts were conducted during high tide periods when the culverts had a minimum headspace. Besides, 3 water samples were collected at the KTN zone for odour potential study.
3.2.8 For air sampling conducted at the headspaces of JVCO and the two box culverts at KTN, the odour samples were collected via a sampling tube in connection with an odour sampling system (i.e. air pumps and odour collection bags). The empty sample bag was placed in a rigid plastic container and the container was then evacuated at a controlled rate to fill up the bag. About 60 L of gas was collected for each sample at the selected sampling location. Two air samples were collected at each selected sampling location, one as replicate. At

Agreement No. CE 35/2006(CE) Kai Tak Development Engineering Study cum Design and Construction of Advance Works Annex A – Investigation, Design and Construction KTAC and KTTS Studies
3-3
each sampling location, air sample was collected for both H2S measurement and olfactometry analysis in the laboratory.
3.2.9 All the collected odour source and air samples were delivered to the odour laboratory as
soon as the sampling was completed. H2S analysis, olfactometry analysis and hedonic tone test were conducted in the odour laboratory within 24 hours after sampling.
Determination of Specific Odour Emission Rate
3.2.10 To determine the odour emission rate of an area source such as water surface, odour source sampling was performed by using “hood” method, whereby a wind tunnel was placed on the odour emission surface of the designated measurement locations and a stream of odour-free nitrogen gas from a certified gas cylinder was supplied to generate an air inflow at a fixed velocity inside the wind tunnel. The most appropriate and reliable inflow rate inside the wind tunnel was determined by the wind speed inflow rate sensitivity test.
3.2.11 The emission rate was determined by the air flow rate through the hood and the odour concentration of the exit air. A specific odour emission rate (SOER) of each area source was calculated by the following equation:
)(marea surface water Covered
/s)m ( hood inside rateflow Air x )(ou/m ionconcentratOdour .s)(ou/m SOER
2
33
2=
Olfactometry Analysis
3.2.12 The odour concentration of the collected air sample was determined by a Forced-choice
Dynamic Olfactometer (Olfactomat-n2) with a panel of human assessors being the sensor in accordance with the European Standard Method: Air Quality – Determination of Odour Concentration by Dynamic Olfactometry (EN13725). The odour concentration is measured by determining the dilution factor required to reach the detection threshold.
3.2.13 The odour laboratory was ventilated so as to maintain an odour-free environment and to provide fresh air to the panel members. Each odour testing session was comprised at least five qualified panellists. All of the panellists were screened beforehand by using 50 ppm solution / mixture of certified n-butanol standard gas.
Hedonic Tone Test
3.2.14 Hedonic tone is a category judgment of the relative like or dislike of the odour to screen the
“annoyance” odour of collected air samples from KTTS only. Members of a panel of assessors were asked to indicate perceived hedonic tone at each presentation as a value from the three-point hedonic tone scale:
Scale Observation
0 Neutral odour or no odour
-2 Moderately unpleasant or unpleasant
-4 Offensive
3.2.15 The hedonic tone test was conducted by a team of 5 odour panel members, in which each
member presented his/her hedonic tone scale and a mean value of such scale was obtained. Only mean values lower than 0 was considered as “annoying / objectionable”.

Agreement No. CE 35/2006(CE) Kai Tak Development Engineering Study Annex A cum Design and Construction of Advance Works KTAC and KTTS Studies – Investigation, Design and Construction
3-4
In-situ H2S Measurement
3.2.16 In conjunction with the odour sampling within the KTN, KTAC and KTTS, in-situ H2S measurement was conducted at the same sampling locations. The purpose of such measurement is to provide initial idea about the strength of odour emission in terms of H2S concentration.
3.2.17 The H2S concentration of the exit air from the wind tunnel/ odour sampling system was measured by using a portable H2S analyzer (Jerome 631-X).
Laboratory H2S Analysis
3.2.18 Odour samples were analyzed by using a desktop UV fluorescence H2S analyzer
(Teledyne-API Model 101E) to determine the H2S concentration.
In-situ Marine Water Quality Measurement 3.2.19 To determine the marine water quality, a multi-parameter instrument (Sonde YSI 6600M)
was used to conduct the in-situ measurement of several parameters including dissolved oxygen (% saturation and mg/L), ambient and water temperature (
oC), water depth (m),
salinity (ppt), redox potential (mV) and pH at each sampling location.
Odour Potential Analysis for Water Samples 3.2.20 The odour potential test is designed to extract the odour from water through bubbling of
odour-free nitrogen gas. Details of the requirements for the experimental setup and the experimental procedure are presented in Appendix 3.1.
3.2.21 Three surface water samples were collected at the culvert discharges at KTN, San Po Kong and Kowloon City respectively. The sampling locations are shown in Figure 3.2 and details are summarized in Table 3.2 below. Sampling was taken at low tide to preclude as far as possible any mixing effect of tidal water and any possible interference from the sediment effect on water.
Table 3.2 Water Sampling Locations
Sample ID Sampling Location No. of Sample
Sampling Point A KTN Culvert 1
Sampling Point B San Po Kong Culvert 1
Sampling Point C Kowloon City Culvert 1
TOTAL 3
3.2.22 Approximately 5 liters of water samples were collected at each location for carrying out the
odour potential analysis. Appropriate containers, such as PVC, glass or high-density polythene bottles were used for storing the water samples. The water samples were transferred to the appropriate containers to a level without headspace and delivered to the laboratory within 12 hours.
3.2.23 In this study, the water odour potential is defined as the odour emission rate of a water sample during the first 30 minutes sampling time according to the experimental procedure. Odour potential sampling experiments were carried out in the odour laboratory, in which a fixed gas flow rate of 1 L/min for bubbling and a sampling time of 30 minutes were applied for preparing all odour samples. Subsequently, the odour samples were measured by olfactometry to determine odour concentrations and then the water odour potentials were calculated by the following equation:

Agreement No. CE 35/2006(CE) Kai Tak Development Engineering Study cum Design and Construction of Advance Works Annex A – Investigation, Design and Construction KTAC and KTTS Studies
3-5
Odour Potential (ou/L water/h) = OC (ou/m3) x V2 (m
3)/V1 (L)/Bubbling time (h)
Where V1 is the water volume used in odour potential test to prepare the above gaseous odour sample; and V2 is the gas volume in the odour bag which is calculated by 1 L/min x 30 min + 30 L of prefilled N2gas = 60 L

Agreement No. CE 35/2006(CE) Kai Tak Development Engineering Study Annex A cum Design and Construction of Advance Works KTAC and KTTS Studies – Investigation, Design and Construction
3-6
3.3 Results of Field Surveys 3.3.1 Wind tunnel inflow rate sensitivity test was performed in order to determine the most
appropriate and reliable inflow rate to be adopted for wind tunnel during sampling. The results showed that the inflow rate of 0.01m/s (60L/min) should be used when conducting odour sampling by using wind tunnel. The main reason to select the air sweeping flow rate of 0.01m/s (not other higher flow rates) is that at a lower air flow rate the odour concentration inside the sampling hood (wind tunnel) would be built up to a higher level, which is more suitable for olfactometry analysis to obtain reliable results, whereas at other higher flow rates, the collected air samples were at lower odour concentrations and hence subject to larger uncertainties in olfactometry analysis.
3.3.2 The results of in-situ marine water quality measurement, in-situ H2S measurement and on-site observations, laboratory analysis of H2S, water sampling and the odour potential analysis are discussed below. Details of the field survey results are shown in Appendix 3.1.
In-situ Marine Water Quality Measurement
3.3.3 The in-situ marine water quality measurement results conducted on 11, 13, 15, 17, 19, 21 & 26 July 2007 in the water zones and culvert discharges are summarized in Table 3.3 below.
Table 3.3 Summary of In-situ Marine Water Quality Measurement Results in Water Zones and Culvert Discharges
Sample Location
Water Depth
(m)
DO (%)
DO (mg/L)
Water Temp.
(°°°°C)
Ambient Temp.
(°°°°C)
Salinity (%)
Redox Potential
(mV)
pH
KTN 0.5 – 1.1
37.6 – 95.0
2.63 – 6.66
31.2 – 32.0
32.6 – 34.6
9.1 – 9.7
-179.6 - +126.8
7.13 – 7.55
NKTAC 0.8 – 5.0
3.4 – 196.2
0.23 – 13.15
24.3 – 30.7
30.9 – 34.2
11.6 – 33.5
-304.2 - +181.8
7.17 – 8.36
SKTAC 3.2 – 6.2
1.3 – 192.4
0.09 – 13.2
24.5 – 26.7
28.9 – 33.4
28.2 – 33.3
-291.3 – +160.9
7.02 -7.81
KTTS 5.2 – 7.2
1.1 – 119.1
0.07 – 8.3
23.7 – 25.0
28.8 – 32.9
31.3 – 33.5
-240.0 – +210.3
7.35 -7.89
Box Culvert 1 2.2 38.7 2.66 27.4 32.6 25.2 39.8 7.72
Box Culvert 2 1.0 36.3 2.53 27.2 31.6 23.7 55.4 7.75
JVCO 2.0 87.3 5.92 26.7 28.1 29.6 167.4 8.00
3.3.4 The measurement results showed that the marine water in the survey area had typical water
characteristics during the summer period with a water temperature of about 24-32°C, salinity of 9-34 parts per thousands, redox potential of -300 to +210mV and pH of 7-8, while the
ambient temperatures were in a range of about 28-35 °C which represented the ambient temperature during the hottest days in the summer season in Hong Kong. It shall be noted that the low values of salinity below 20 ppt only occurred at the upstreams such as KTN and NTAC, which is far away from the seawater bay such as KTTS.
In-situ H2S Measurement
3.3.5 The results of on-site H2S measurements showed that significant H2S levels from 100 to 3600 ppb and odour intensity above 2 were detected in a number of locations in the KTN and KTAC zones, while low H2S levels (<4 ppb) and weak odour intensity of below 2 were found in the KTTS zone.

Agreement No. CE 35/2006(CE) Kai Tak Development Engineering Study cum Design and Construction of Advance Works Annex A – Investigation, Design and Construction KTAC and KTTS Studies
3-7
3.3.6 During on-site observations, rotten-egg and sewage smell was detected at most part of SKTAC and NKTAC, while septic smell was also noted in some parts of NKTAC. Rotten-egg, sewage and septic smell were found at KTN, Box Culverts 1 & 2 and JVCO. Whereas rotten-egg, septic smell and seawater smell were found in some parts of KTTS.
3.3.7 The possible sources of odour at SKTAC were the sediment and sewage in the upstream. For NKTAC, the possible odour sources include the sediment with gas bubbling and sewage from outfalls/ upstream. The possible odour source of KTN, Box Culverts 1 & 2 and JVCO was the raw sewage from the upstream.
3.3.8 In summary, the odour patrol results indicated that the major odour sources include the treated sewage effluent from upstream, raw sewage discharge at several outfalls, and also the sediment at the bottom of KTAC zones.
Laboratory Analysis of H2S
3.3.9 The results of the laboratory analyses of H2S are summarized in Tables 3.4 and 3.5.
Table 3.4 Summary of Laboratory Analyses Results for Odour Emission Samples
Sample Location
Method V
(m/s)
Average H2S
(ppb)
Average Hedonic
Tone
Average OC
(ou/m3)
Average SOER
(ou/m2.s)
KTN WT 0.01 1,002 N/A 6,896 9.00
NKTAC WT 0.01 682 N/A 3,395 4.24
SKTAC WT 0.01 154 N/A 1,974 2.47
KTTS WT 0.01 3.95 -1.5 282 0.35
Remark: WT: Wind tunnel; V: Sweep air flow velocity: OC: Odour concentration; SOER: Specific odour emission rate
Table 3.5 Summary of Laboratory Analyses Results for Air Samples
Sample ID Type of Sample H2S (ppb) Odour concentration
(ou/m3)
Box Culvert 1-1 Air 44.8 1,640
Box Culvert 1-2 Air 2860 17,544
Box Culvert 2-1 Air 81.2 1,839
Box Culvert 2-2 Air 184 2,697
JVO-1 Air 2.3 278
JVO-2 Air 1.4 213
3.3.10 In this study, only the samples collected at KTTS were examined by the hedonic tone test
and the results are shown in Table 3.4 above. For other sampling locations including KTN, KTAC and the box culverts, they are considered as obvious odour sources and hedonic test was therefore not carried out for samples collected from these locations. An average value of hedonic tone at KTTS was found to be -1.5, representing a moderately unpleasant odour nature.
Odour Potential Test
3.3.11 The odour potentials of the water samples collected at the 3 sampling points are summarized in Table 3.6 below.

Agreement No. CE 35/2006(CE) Kai Tak Development Engineering Study Annex A cum Design and Construction of Advance Works KTAC and KTTS Studies – Investigation, Design and Construction
3-8
Table 3.6 Results of Odour Potential of Water Samples
On-site Water Sampling Odour potential
analysis in laboratory
Results
Sample ID
Location V1
(L)
Time
(min)
V2
(L)
H2S
(ppb)
OC
(ou/m3)
OP
(ou/L[water])/h
Sampling Point A
Kai Tak Nullah Culvert
5 30 60 2.4 137 3.29
Sampling Point B
San Po Kong Culvert
5 30 60 4.0 311 7.47
Sampling Point C
Kowloon City Culvert
5 30 60 11 741 17.79
V1: Water sample volume; V2: Gas volume in odour bag; OC: Odour concentration; OP: Water odour potential
3.3.12 The above results showed that both H2S concentration and odour potential value had a
similar pattern, i.e. a higher H2S concentration would give a higher odour potential value.
3.3.13 The odour potentials of water samples collected at these three locations can be ranked from high to low as Kowloon City Culvert > San Po Kong Culvert > KTN Culvert in this survey.
3.4 Interpretation of Field Survey Results
In-situ Marine Water Quality Measurement
3.4.1 The results demonstrated that the marine water had spatial variation on DO and redox potential values. A number of locations at NKTAC, SKTAC and KTTS showed a very low DO level of below 0.5 mg/L. This might be resulted from the anoxic condition occurred at these locations, and anoxic condition would be beneficial to produce higher odour from the sediment. It is believed that the spatial fluctuation of DO and redox potential in NKTAC might be due to disturbance to the bottom sediment by the discharges from KTN and JVC.
In-situ H2S Measurement
3.4.2 As the results of on-site H2S measurements showed that significant H2S levels with higher odour intensity were detected in a number of locations in the KTN and KTAC zones, it demonstrated that one major odour generation mechanism was the decomposition of organic matters with sulphate under anaerobic condition.
Laboratory Analysis of H2S
3.4.3 As shown in Tables 3.4 & 3.5, the highest odour emission rates were found at KTN, and the odour emission rate was decreasing along NKTAC and SKTAC, with the lowest at KTTS. This indicates that the odour emission rate reduced from the upstream to the downstream of the KTAC significantly.
3.4.4 It was noted that the distribution of H2S concentration has a similar pattern as that of odour emission rates, which means higher H2S concentration was detected at the location where higher odour emission occurred. To further study the relationship between H2S concentration and odour concentration, the ratios of H2S/ Odour concentration at each sampling zone was calculated and compared in Table 3.7 below.

Agreement No. CE 35/2006(CE)Kai Tak Development Engineering Studycum Design and Construction of Advance Works Annex A– Investigation, Design and Construction KTAC and KTTS Studies
3-9
Table 3.7 Ratios of H2S Concentration over Odour Concentration at DifferentSampling Zones
Samplingzone
Mean H2Sconcentration
Mean odourconcentration
Ratio of H2S/OC(ppb/(ou/m3))
KTN 1,002 6,896 0.15
NKTAC 682 3,395 0.20
SKTAC 154 1,974 0.08
KTTS 3.95 282 0.01
3.4.5 The results in Table 3.7 above showed that higher ratios occurred at the upstream andlower ratios occurred at the downstream of KTAC, which means the odour composition atthe upstream contains a higher fraction of H2S component than that at the downstream (apure H2S gas has a threshold ratio of H2S(ppb)/OC (ou/m3) of about 0.5).
3.4.6 As the average value of hedonic tone at KTTS was found to be -1.5, representing amoderately unpleasant odour nature, it is believed that the main source causing the odour atKTTS could be the sediment at the bottom of sea, since where the effect of sewage onodour impact became insignificant. The result of hedonic tone of -1.5 only confirmed thatodour has an unpleasant character. That source causing such an odour could be due to thesediment at the bottom of sea because there is no other significant odour source such asthe discharge outfall nearby the sampling location.
Odour Potential Test
3.4.7 The odour potential of the collected water samples at Kowloon City Culvert was the highest,while KTN Culvert being the lowest. It was found that the H2S concentration was also thehighest at Kowloon City Culvert while KTN Culvert being the lowest. It demonstrated that ahigher H2S concentration would give a higher odour potential value.

Agreement No. CE 35/2006(CE) Kai Tak Development Engineering Study Annex A cum Design and Construction of Advance Works KTAC and KTTS Studies – Investigation, Design and Construction
3-10

Agreement No. CE 35/2006(CE) Kai Tak Development Engineering Study cum Design and Construction of Advance Works Annex A – Investigation, Design and Construction KTAC and KTTS Studies
4-1
4 FURTHER DETAILED LABORATORY TESTING
4.1 Purpose and Objectives 4.1.1 Based on the findings of previous surveys and investigations as summarized in Section 2 of
this report, it is considered necessary to conduct further detailed laboratory testing to determine the mechanism of odour generation as well as the effect of different environmental parameters on the odour generation rate.
4.1.2 The objectives of this further laboratory study are:
(i) To investigate the water depth effects in relation to odour generation;
(ii) To investigate the temperature effects in relation to odour generation;
(iii) To investigate the odour emission arising from culvert discharges; and
(iv) To establish odour removal efficiency for bioremediation after 1 year of treatment.
4.1.3 This laboratory study is specially designed to investigate the odour generation from KTAC
and KTTS by establishing a number of controlled environments in the laboratory to study the effects of water depth above the sediment, water temperature and bioremediation on odour generation.
4.1.4 The scope of works in this laboratory study is to collect water and sediment samples from KTAC, KTTS, KTN, San Po Kong Culvert (SPKC) and Kowloon City Culvert (KCC) to conduct in-situ measurements and subsequent laboratory tests on odour emissions under various controlled environmental conditions.
4.1.5 It is anticipated to provide a relative comparison of the odour generation characteristics for the studied parameters. The results are also referred in odour impact assessment presented in Section 9 of this report.
4.2 Approach and Methodology
Pre-study Trial Experiment 4.2.1 Prior to the field experiment, a series of trial experiments were conducted to test the
applicability of the odour sampling technique, and to facilitate and direct the actual experiment study. It included the tests on moisture content of gas samples, enhancing H2S content of gas samples, and suitable duration time for stabilization of testing cores.
4.2.2 The pre-study trial experiments concluded that the incubation periods should be no longer than 6 hours; a stabilization periods of overnight should be adequate; and the water column of the sediment set up should be primly purged with nitrogen to let DO level ≤ 1 mg/L.
4.2.3 Details of the pre-study trial experiments and the results are presented in Appendix 4.1.
Sediment and Marine Water Sampling
4.2.4 Forty one (41) core sediments and five (5) water samples were collected at the four locations, each within a 25m x 25m grid, in the KTAC and KTTS areas (Figure 4.1 refers) and another three water samples collected at KTN, San Po Kong Culvert and Kowloon City Culvert to represent 49 scenarios for the subsequent laboratory tests in total.
4.2.5 The sampling details including the rationale for the selection of sampling locations are summarized in Table 4.1. Details of the sediment and water sampling procedure are presented in Appendix 4.1.

Agreement No. CE 35/2006(CE) Kai Tak Development Engineering Study Annex A cum Design and Construction of Advance Works KTAC and KTTS Studies t – Investigation, Design and Construction
4-2
Table 4.1 Sampling Locations of Sediment Core and Marine Water and Rationale for Selection
Location Description of Sampling Location and
Rationale of Selection
No. of Sediment
Cores
No. of Water
Samples
KTAC1
Northern KTAC
Major hotspot of odour, bubbles evolved from the water column are observed frequently.
11 1
KTAC2
Northern KTAC
Within the bioremediation pilot scale field test area. Sediment has been treated by bioremediation for almost 1 year. Targeted for comparison with KTAC1 and KTAC3.
10 1
KTAC3
Southern KTAC
Further south, the area is less “severe” than Northern KTAC and to provide information on the medium level of odour release.
13* 1
KTTS1 KTTS
Potential for odour generation is lower here. 10 1
TKWTS (VH1)
Victoria Harbour
Within To Kwa Wan Typhoon Shelter; sample ID VH1 - 1
TOTAL 44 5
*Included 3 scenarios for the KTN, San Po Kong Culvert and Kowloon City Culvert.
4.2.6 The relevant meteorological data (e.g. ambient temperature, wind speed and direction, etc.) from the Hong Kong Observatory station during the sampling period was recorded for reference.
4.2.7 Five litres of marine water samples were collected for the laboratory tests. Water samples
were collected at 1 m above the seabed and the following in-situ measurement for each of the collected water samples has been carried out:
� Dissolved oxygen (DO) (% saturation);
� Dissolved oxygen (DO) (mg/L);
� Temperature (°C);
� Salinity (parts per thousands);
� Redox potential (mV); and
� pH
4.2.8 In addition, turbidity (NTU) was carried out for the water samples collected at the three culverts.
Confirmation Test on Water Quality
4.2.9 Prior to performing the laboratory experiment, the collected water samples were sub-sampled and tested for the parameters as described in Appendix 4.1 in order to confirm the in-situ testing results. The water sub-samples were not re-used in the laboratory experiment.
Laboratory Experiment on Odour Emission 4.2.10 Sediment cores were stabilized in water bath reactor of prescribed temperatures for 24
hours to ensure the homogeneity of the temperature effects. Odour bags were then placed on the top of the sediment core to initiate the incubation period.
Agreement No. CE 35/2006(CE) Kai Tak Development Engineering Study cum Design and Construction of Advance Works Annex A – Investigation, Design and Construction KTAC and KTTS Studies
4-3
4.2.11 The collected sediment and marine water samples were then incubated in a laboratory scale reactor, which was situated in an enclosed container, to simulate 49 different scenarios prior to the subsequent laboratory analysis. The experimental setup of the reactor was set to simulate the environmental conditions with variables for each of the scenarios below:
� Source of marine water (i.e. within or outside KTAC);
� Water temperature (150C; 25
0C or 35
0C);
� Depths of marine water column (1.2m, 0.8m or 0.4m); and
� Combination of normal water/sediment sample matrix, versus presence of sediments or water alone.
Stabilization and Incubation 4.2.12 After transferring the marine water samples to the laboratory, they were purged with N2 gas
until its DO decreased to below 1 mg/L. In the meantime, the sediment samples were cut into the desired length and put into a water tank, which was pre-set to the required temperatures for stabilization. Afterwards, the purged water samples were filled into the sediment cores to form a water/sediment matrix. For sediment samples collected at KTAC2, the black layer of sediment was scooped off before filling of water sample into the cores.
4.2.13 After setting up the controlled environment, a stabilization period of overnight was allowed. During the entire stabilization periods, the water temperature was regulated automatically (to +1
oC) by the water chiller or heater. The temperature inside the container, where the
reactor situated, was maintained above 28oC at all times to prevent possible condensation
within the odour bags. To avoid the release of odorous gas from the cores to the atmosphere prior to measurements, the collected sediments were remained within the sample core during the whole laboratory testing period. Besides, the cores within the reactor were capped tightly by stoppers, which were originally specified to be opened. This was to ensure that H2S released during the stabilization period would “saturate” the overlying water, thus preventing from obtaining gas samples of too weak in strength to be detectable.
4.2.14 After stabilization, the caps of the water/sediment cores were removed and another cap with the inlet of a portable H2S analyzer attached to was put onto the core. The H2S concentrations of the water/sediment cores were then measured. After completion of the H2S measurement, a clean air bag was attached to the water/sediment cores. The air inside the air bag was then pumped out using a vacuum pump. Afterwards, 30 L of pure dry N2 were filled into each air bag, which was then closed. The cores were then incubated in the reactor for 6 hours. Finally, the air bags were removed from the cores and delivered to the laboratory for analysis after the incubation process.
4.2.15 Measurement of water quality and some of the sediment parameters of the water/sediment cores on-site was taken before delivering to the laboratory for detailed chemical analysis. Besides, measurements of DO levels before and after purging of all water samples were performed.
H2S Measurements 4.2.16 After stabilization, the H2S concentration of the air above the water surface of the sediment
cores was measured by a portable H2S analyzer (Jerome 631-X). The purpose of the measurement was to provide an initial idea about the strength of odour emission in terms of H2S.

Agreement No. CE 35/2006(CE) Kai Tak Development Engineering Study Annex A cum Design and Construction of Advance Works KTAC and KTTS Studies t – Investigation, Design and Construction
4-4
4.2.17 Also, the gas emitted from the sample core in each scenario was collected in a 60L sampling bag, which was pre-filled with 30L ultra-high purity dry nitrogen gas. After 6 hours of incubation, the gas bags were disconnected for further H2S analysis on the same day by a desktop UV fluorescence H2S analyzer (Teledyne-API Model 101E) with a low detection limit of 1 ppb in the laboratory. The odour samples were then collected for further olfactometry analysis.
4.2.18 H2S was measured on the collected sediments and water samples under different laboratory
controlled environment (or scenario) in order to determine the various odour emissions.
Olfactometry Analysis 4.2.19 Odour samples were collected for (1) olfactometry analysis only for Scenarios 1 to 30 and
41 and (2) for both olfactometry analysis and hedonic tone test for Scenarios 31 to 40 and 42 to 46. Appendix 4.1 details the 46 scenarios set up for H2S measurements, olfactometry analysis and/or hedonic tone test.
4.2.20 The olfactometry analysis was determined by a forced-choice dynamic olfactometer with a
panel of human assessors being the sensor in accordance with the European Standard Method: Air Quality – Determination of Odour Concentration by Dynamic Olfactometry (EN13725).
4.2.21 The odour laboratory was ventilated to maintain an odour-free environment and to provide
fresh air to the panel members. Each odour testing session was comprised at least five qualified panellists. All of the panellists were screened beforehand by using 50 ppm solution / mixture of certified n-butanol standard gas.
Hedonic Tone Test
4.2.22 Odour samples with H2S concentrations exceeding 5 ppb were subjected to hedonic tone test. In this laboratory study, all KTTS samples which have apparently high level of odour were subjected to a Hedonic Tone Test.
4.2.23 Hedonic tone is a category for judging of the relative likeness or dislikeness of the odour to screen the “annoyance” odour by a panel of assessors, who were asked to indicate the perceived hedonic tone at each presentation as a value from the three-point hedonic tone scale as listed below:
Scale Observation
0 Neutral odour or no odour
-2 Moderately unpleasant or unpleasant
-4 Offensive
4.2.24 A mean value for each sample was calculated to express the result of hedonic tone. Only
the mean values lower than 0 were considered as “annoyance/objectionable” odour.
Laboratory Analysis on Water/ Sediments 4.2.25 After the completion of the H2S measurements and collection of odour samples for analysis,
further chemical testing was carried out for the collected sediments and water column. The surface layer of sediments (from top to approximately 10 cm in depth) was tested for pH, redox, AVS and TOC. While the water columns were analyzed for the following parameters:
� Dissolved oxygen (DO) (% saturation);
� Dissolved oxygen (DO) (mg/L);

Agreement No. CE 35/2006(CE) Kai Tak Development Engineering Study cum Design and Construction of Advance Works Annex A – Investigation, Design and Construction KTAC and KTTS Studies
4-5
� Temperature (°C);
� Salinity (parts per thousands);
� Redox potential (mV);
� pH; and
� TOC (%).
4.3 Results of Laboratory Testing
In-situ Water Quality Measurement Results
4.3.1 The in-situ water quality measurement results including the temperature, salinity, DO saturation (%), DO (mg/L), pH, redox potential (mV) and turbidity (NTU) during on-site sampling are summarized in Appendix 4.1.
4.3.2 It was found that the DO levels measured at all the water samples collected in KTAC 1 to KTAC 3 were below 1mg/L. For the culverts, the DO level was the highest in KTN and generally decreased downstream of the culvert, and it was the lowest in the mouth at KCC.
4.3.3 The redox potential in KTAC1 was the most negative (-271mV) among all the other sampling locations. Negative values of redox potential were also found in the sampling stations of KTAC 2, KTAC 3 and KTTS.
4.3.4 The pH values at all the sampling stations were all greater than 7. KTAC1 has the lowest value of pH 7.31 measured while VH1 has the highest value of pH 8.00 measured.
4.3.5 The laboratory analysis results of the water column in the water/ sediment matrix corer before and after stabilization, and the results of water/ sediment matrix corer after incubation were shown in Appendix 4.1. The measured DO levels during sampling and before purging of nitrogen gas in the laboratory varied significantly from 0.02 to 6.49 mg/L and 0.48 to 6.27 mg/L respectively. However, the DO levels did not significantly change by the incubation process.
H2S and Odour Measurement Results
4.3.6 The laboratory measurement results of H2S concentrations, odour concentrations and the associated Hedonic Tone Test of the marine water and sediment samples are summarized in Table 4.2. Some differences between the H2S concentrations measured on-site and at the laboratory are noted. These may be due to the different technology employed for the analysers on-site and in the laboratory.
4.3.7 The H2S concentrations measured in the laboratory were ranged from 0.9 to 2,820 ppb while the odour concentrations varied from 70 to 16,400 ou/m
3. Among the 49 scenarios,
10 of them are with H2S concentrations exceeding 5 ppb.
4.3.8 The odour concentration of the KCC samples was the highest among all the other samples collected at the culverts. Same observation was found for the H2S concentrations, and the results showed that these 3 water samples were all below 5 ppb (Scenarios 47 to 49).
4.3.9 The Hedonic Tone Test results revealed that all the KTAC samples are within the mean values lower than 0. This implies that the gas emitted can be considered as “annoying/ objectionable”.

A
gre
em
ent
No.
CE
35/2
006(C
E)
K
ai T
ak D
evelo
pm
ent
Engin
eeri
ng S
tud
y
Anne
x A
cum
Desig
n a
nd C
onstr
uction o
f A
dva
nce W
ork
s
KT
AC
an
d K
TT
S S
tudie
s
– I
nvestigation,
Desig
n a
nd C
onstr
uction
4-6
Tab
le 4
.2
Su
mm
ary
Resu
lts o
f H
2S
an
d O
do
ur
Co
ncen
trati
on
Measu
rem
en
ts a
nd
Hed
on
ic T
on
e T
est
of
the 4
9 S
cen
ari
os
H2S
(p
pb
) S
cen
ari
o
So
urc
e o
f S
ed
imen
ts
So
urc
e o
f
Mari
ne W
ate
r T
em
pera
ture
(o
C)
Wate
r D
ep
th
(m)
On
-sit
e
In lab
O
C
(ou
/m3)
Hed
on
ic
To
ne T
est
1
15
0.8
120
4.0
260
N/A
2
25
0.4
2
2.4
269
N/A
3
25
0.8
0
2.0
347
N/A
4
25
1.2
1
2.1
349
N/A
5
Fro
m s
am
plin
g locatio
n
KT
AC
1
35
0.8
3400
2780
16,4
00
N/A
6
15
0.8
11
252
4,3
97
N/A
7
25
0.4
4
4.5
484
N/A
8
25
0.8
129
54.4
1,5
79
N/A
9
25
1.2
4
106
2,6
05
N/A
10
Nort
hern
KT
AC
(K
TA
C1)
(at th
e u
ntr
eate
d a
rea)
Fro
m s
am
plin
g locatio
n
VH
1 (
with
in T
KW
TS
)
35
0.8
1230
2820
14,6
40
N/A
11
15
0.8
2
1.3
138
N/A
12
25
0.4
1
1.4
121
N/A
13
25
0.8
0
1.1
96
N/A
14
25
1.2
1
1.4
70
N/A
15
Fro
m s
am
plin
g locatio
n
KT
AC
2
35
0.8
0
1.0
262
N/A
16
15
0.8
2
1.3
153
N/A
17
25
0.4
1
1.3
303
N/A
18
25
0.8
0
1.3
175
N/A
19
25
1.2
1
1.3
164
N/A
20
Nort
hern
KT
AC
(K
TA
C2)
(within
th
e b
iore
media
tio
n
test are
a)
Fro
m s
am
plin
g locatio
n
VH
1 (
with
in T
KW
TS
)
35
0.8
3
4.4
466
N/A
21
15
0.8
110
0.9
102
N/A
22
25
0.4
2
2.4
484
N/A
23
25
0.8
1
1.3
288
N/A
24
25
1.2
2
1.3
260
N/A
25
Fro
m s
am
plin
g locatio
n
KT
AC
3
35
0.8
54
799
2,9
20
N/A
26
15
0.8
0
1.0
158
N/A
27
25
0.4
2
2.1
310
N/A
28
25
0.8
1
0.9
164
N/A
29
25
1.2
1
1.1
158
N/A
30
South
ern
KT
AC
(K
TA
C3)
Fro
m s
am
plin
g locatio
n
VH
1 (
with
in T
KW
TS
)
35
0.8
35
76.7
852
N/A

Agre
em
ent
No.
CE
35/2
006(C
E)
Kai T
ak D
evelo
pm
ent
Engin
eeri
ng S
tud
y
cum
Desig
n a
nd C
onstr
uction o
f A
dva
nce W
ork
s
Anne
x A
– I
nvestigation,
Desig
n a
nd C
on
str
uction
KT
AC
an
d K
TT
S S
tudie
s
4-7
H2S
(p
pb
) S
cen
ari
o
So
urc
e o
f S
ed
imen
ts
So
urc
e o
f
Mari
ne W
ate
r T
em
pera
ture
(o
C)
Wate
r D
ep
th
(m)
On
-sit
e
In lab
O
C
(ou
/m3)
Hed
on
ic
To
ne T
est
31
15
0.8
2
1.3
164
-0.8
32
25
0.4
1
1.1
164
-1.2
33
Kw
un
Tong T
ypho
on
She
lter
(KT
TS
1)
Fro
m s
am
plin
g locatio
n
KT
TS
1
25
0.8
1
1.0
164
-1.2
34
25
1.2
1
1.2
153
-1.6
35
Fro
m s
am
plin
g locatio
n
KT
TS
1
35
0.8
45
201
1,5
20
-3.2
36
15
0.8
1
1.2
125
-0.4
37
25
0.4
1
1.2
243
-1.6
38
25
0.8
2
1.3
169
-2
39
25
1.2
1
1.1
169
-1.6
40
Kw
un
Tong T
ypho
on
She
lter
(KT
TS
1)
Fro
m s
am
plin
g locatio
n
VH
1 (
with
in T
KW
TS
)
35
0.8
4
307
1,2
11
-2.8
41
Nort
hern
KT
AC
(K
TA
C1)
(at th
e u
ntr
eate
d a
rea)
N/A
25
N/A
150
27.5
1,0
75
N/A
42
^ N
/A
Fro
m s
am
plin
g locatio
n
KT
AC
1
25
0.8
210
1.4
299
-0.8
43
^ N
/A
Fro
m s
am
plin
g locatio
n
KT
AC
2
25
0.8
13
2.0
278
-1.2
44
^ N
/A
Fro
m s
am
plin
g locatio
n
KT
AC
3
25
0.8
1
1.2
213
-2
45
^ N
/A
Fro
m s
am
plin
g locatio
n
KT
TS
1
25
0.8
1
1.2
125
-2
46
^ N
/A
Fro
m s
am
plin
g locatio
n
VH
1 (
with
in T
KW
TS
) 25
0.8
1
0.9
143
-2
47
N/A
K
ai T
ak N
ulla
h C
ulv
ert
25
0.8
1
1.5
269
N/A
48
N/A
S
an P
o K
ong C
ulv
ert
25
0.8
1
1.2
169
N/A
49
N/A
K
ow
loo
n C
ity C
ulv
ert
25
0.8
0
2.5
466
N/A
N
ote
: O
C:
od
ou
r co
nce
ntr
atio
n
^
wa
ter
sa
mple
s o
nly

Agreement No. CE 35/2006(CE) Kai Tak Development Engineering Study Annex A cum Design and Construction of Advance Works KTAC and KTTS Studies – Investigation, Design and Construction
4-8
Limitations of this Laboratory Study
4.3.10 In this laboratory study, it should be noted that it did not have any proven standard for reference and is only derived from research experience. The odour emissions were determined under the controlled laboratory conditions with defined experimental time and scale. It may not truly represent the field conditions where water is flowing and factors such as temperature, water quality, wind speed / direction and water depth are fluctuating.
4.3.11 However, the laboratory conditions do provide an ideal controlled environment for studying the effects of individual parameters: temperature and water depth, with other factors being controlled and isolated. Such effects cannot be studied on site without extensive long-term monitoring. While the results for adjusting temperature and water depth would be used in caution, further supplementary field survey conducted in July / August 2007 under the odour emission source survey (Section 3 of this report refers) has provided additional overall information for the variations in summer.
4.3.12 Some limitations in the experimental work are summarized as follows:
� After stabilization for 24 hours, micro-organism in the sediment samples may not fully adapt to the “new environment” such as different temperatures during the subsequent incubation for 6 hours only. Hence, the biological reaction inside the sediment samples may not return to a normal rate. The situation could be the worst when the sediment temperature of 25
oC was changed to a lower temperature of 15
oC.
� “Still water” in the columns could exhibit different qualities after stabilization / incubation from the “movable water” under actual site condition, which is affected by incoming water flows and tidal level variation all the time. Hence, odour level would normally be exaggerated in the test.
� Purging by N2 gas would provide a low DO environment not only for the sediment, but also affect the biological / chemical reaction in the water column. This may again exaggerate the odour level obtained in the laboratory set up.
� A high portion of on-site H2S measurement data are below the detection limit of 3 ppb in a poor quality range. Judging of odour emission appears to be more accurate than reliance on H2S measurements.
4.4 Interpretation of Laboratory Testing Results
Factors Affecting Release of Odour
4.4.1 For KTAC and KTTS, the thickness of water column, i.e. the water depth, is affected by (i) tidal levels – the changes in water levels during high tide and low tide and (ii) seabed profile – the seabed is uneven and is generally higher near the western bank of KTAC (highest around -2mPD to lowest around -6mPD in KTAC). At downstream KTN and upper/northern KTAC, the water depth can be even shallower, generally less than 0.5m in some areas. The depth of water covering the sediment would have effects on odour release. Presumably the shallower the water, the higher is the chance of odour release.
4.4.2 Temperature also affects odour generation rate. The temperature in Hong Kong varies from
less than 10°C in winter to higher than 30°C in summer. Odour generation in summer is far more intensive than in winter, relating to thermodynamics and activities of micro-organisms at higher temperatures. This laboratory study has studied the odour emissions at different
temperatures at 15°C, 25°C and 35°C respectively.

Agreement No. CE 35/2006(CE) Kai Tak Development Engineering Study cum Design and Construction of Advance Works Annex A – Investigation, Design and Construction KTAC and KTTS Studies
4-9
4.4.3 Dissolved oxygen (DO) level in water column also affects the odour generation rate and the condition of surface sediments in the experiment. Sediment without adequate oxygen supply from the overlying water will slowly become anaerobic and generates hydrogen sulphide through anaerobic breakdown of organics. Since the effects on odour emission from sediment by improving dissolved oxygen level could have a long-term effect in terms of years, it is not the scope of this laboratory study to assess the dissolved oxygen effects in detail, due to the short-term nature of the experiment and the practical difficulty in controlling dissolved oxygen levels. However, the effects of DO have inherently and automatically reflected in the emission rates of this study.
Effects of Water Depth on H2S and Odour Emissions
4.4.4 With an exception of the scenarios in the untreated areas of northern KTAC, the H2S and odour concentrations showed a clear “inverse” relationship with water depth. Such finding is evident when comparing the scenarios with the same incubation temperature but varying the water depth from 0.4 to 0.8 and 1.2m. For example, the odour concentrations in the treated areas of northern KTAC at an incubation temperature of 25
oC decreased from 303
to 175 and 164 ou/m3 when the water depth increased from 0.4 to 0.8 and 1.2 m
respectively.
4.4.5 The noted increase of odour concentration with water depth in the untreated areas of northern KTAC is probably because, rather than diffusing from sediments the water in this area may contain a substantial quantities of odorous suspensions because of continuous bubbling of H2S.
Effects of Temperature on H2S and Odour Emissions
4.4.6 With the same water depth, the results showed that the H2S and odour concentrations are generally increased with incubation temperature in the untreated area of northern KTAC (KTAC 1), southern KTAC (KTAC 3) and KTTS 1. For example, the H2S concentrations in Scenarios 21, 23 and 25 with the same water depth of 0.8m increased from 0.9 to 1.3 ppb and finally 799 ppb when the incubation temperature was elevated from 15
oC to 25
oC and
35oC respectively. The corresponding odour concentrations also increased from 102 to 288
ou/m3 and 2,920 ou/m
3 respectively.
4.4.7 The increases are especially substantial when the temperature increased from 25oC to 35
oC.
In fact, no matter the samples were collected from the treated and untreated areas, the highest H2S and odour concentrations were found in the 35
oC scenarios. These results
suggest that temperature is a critical factor in controlling the generation of H2S and hence the odour emissions.
Odour Emissions at Bioremediation Treatment Areas
4.4.8 Comparing the H2S concentrations and odour concentrations of the samples collected in the untreated area (Scenarios 1-10) and its counterpart subject to bioremediation treatment for almost one year (Scenarios 11-20) in northern KTAC, the H2S concentrations (< 2ppb)and odour concentrations in the treated area are the lowest among all the scenarios.
4.4.9 The odour concentrations are noticeably lower than those in the untreated area particularly for Scenarios 6-10. In the latter case, the H2S concentrations varied from 4.5 to 2,820 ppb while the corresponding odour concentrations reached 484 to 14,640 ou/m
3. These results
suggest that the bioremediation treatment applied in that area is quite efficient in terms of odour removal after 1 year of establishment.

Agreement No. CE 35/2006(CE) Kai Tak Development Engineering Study Annex A cum Design and Construction of Advance Works KTAC and KTTS Studies – Investigation, Design and Construction
4-10
H2S and Odour Concentrations in Sediment and Water Samples
4.4.10 In this laboratory study, the sediment samples were collected from KTAC and KTTS areas, while the water samples were collected from KTAC, KTTS, TKWTS, KTN, San Po Kong Culvert and Kowloon City Culvert. Different sediment and water samples were configured to form different scenarios in different columns containing either of water/sediment samples or water samples alone. The H2S and odour concentrations of the gas samples emitted from the water/sediment columns and the water only columns at the same water depth (0.8 m) and the same incubation temperature (25
oC) were compared. It was found that odour
strength from the column containing sediment covered with water was only moderately higher than that from the column containing water samples only, which means the odour contribution from the water samples was also significant. Yet it is possible that the water samples may contain a lot of odorous suspensions due to constant bubbling effect of H2S from the sediment on-site.
4.5 Summary and Conclusion
4.5.1 In this laboratory study, field sampling of marine water and sediment was conducted. The samples were then stabilized, incubated and finally analyzed in laboratory for the odour emission characteristics. Some important findings could be made and summarized below:
� Noticeable higher H2S and odour concentrations were found in the samples collected in the untreated area than its counterpart subject to bioremediation treatment for almost one year (Scenarios 11-20). This finding suggests that the bioremediation treatment applied in the northern KTAC areas is quite efficient in terms of odour removal after 1 year of establishment.
� The H2S and odour concentrations with same water depth are generally increased with incubation temperature in the untreated area. The increases are especially substantial when the temperature increases from 25
oC to 35
oC. These results suggest that the
temperature is a critical factor in controlling the H2S and odour emissions.
� The H2S and odour concentrations showed a consistent “inverse” relationship with water depth. This exception is probably due to the continuous bubbling of gases generated in the sediment which have been observed. These bubbles are likely to transfer substantial quantities of H2S and other odorous compounds through the water column. This phenomenon was also observed in the reactor where odorous chemicals cannot be readily escaped from the water.

Agreement No. CE 35/2006(CE) Kai Tak Development Engineering Study cum Design and Construction of Advance Works Annex A – Investigation, Design and Construction KTAC and KTTS Studies
5-1
5 ODOUR GENERATION MECHANISM
5.1 Introduction 5.1.1 An odour study for KTAC and KTTS had been carried out under the Stage 1 Planning
Review and based on its findings, further detailed field surveys and laboratory testing were conducted in order to delineate the odour emitting areas and to determine the mechanism of odour generation of the three key areas namely KTN in North Apron, KTAC and KTTS. The results and interpretation of these studies were detailed in Sections 2 to 4 of this report. The purpose of this section is to present a summary of the updated odour generation mechanism.
5.2 Types of Emissions 5.2.1 Based on the findings of the Phase 1 Planning Review and the results from the further
detailed field surveys and laboratory testing, the decomposition of organic matters in the sediments were considered to be the main source of odour. Under normal condition, the organic matter is decomposed by micro-organisms aerobically using the oxygen in the water and also diffused to the sediment. The resultant products are carbon dioxide and water:
Organic matter + oxygen � energy + carbon dioxide + water
5.2.2 When the organic load exceeds the carrying capacity of oxygen within the water, oxygen is not available for aerobic respiration. Sulphate in seawater will be used instead as the alternative source of oxygen for anaerobic respiration by micro-organisms.
5.2.3 Hydrogen sulphide (H2S) is formed when the organic rich sediments act as a substrate for the action of sulphate-reducing bacteria (SRBs) which reduce the sulphate in the absence of oxygen. Organic sulphur compounds, such as mercaptans, also contribute partly to the odour with process similar to H2S:
Organic matter + sulphate � energy + hydrogen sulphide + water
Organic matter with sulphide � energy + mercaptans + water (minor pathway)
5.2.4 For discharge of domestic nature, H2S and mercaptans form the major source of odour especially the former. There are other odorous components such as ammonia, but they are very unstable and their effects are transient and hence trivial. The above mechanisms can be evidenced by the presence of high sulphide content in terms of acid volatile sulphide (AVS) in sediment as analyzed in the laboratory. The AVS content of sediment is typically above 5000 mg/kg. The redox potential of <-200mV as recorded in the Bioremediation Pilot Field Test under the Phase 1 Planning Review further confirmed the reducing state of the sediment signifying the lack of oxygen which favours the formation of sulphides.
5.2.5 Following the above, there are considered to be four distinct types of odour emissions within the Study Area. The types of odour emissions include (i) the main channel area, (ii) culvert / outfall openings, (iii) seawall along the former Kai Tak runway and (iv) the Kai Tak Nullah (KTN). These types of odour emissions are discussed in the following section and are shown in Figure 5.1.
Main Channel Area
5.2.6 The main channel area consisted of the whole of KTAC and KTTS and is considered to be the major contributors to odour emissions. The odour mainly generated from the high AVS contained sediments under highly negative redox conditions, which result in the release of H2S gas to the overlying water and atmosphere. The key factors that affect this type of odour generation are:

Agreement No. CE 35/2006(CE) Kai Tak Development Engineering Study Annex A cum Design and Construction of Advance Works KTAC and KTTS Studies – Investigation, Design and Construction
5-2
- Overlying water depths, influenced by tidal effects;
- Water quality, in particular dissolved oxygen concentration and stratification effect;
- Temperature;
- Sediment quality including total organic content (TOC), redox potential and AVS levels; and
- Water circulation which influence the water quality and rate of sediment deposition in the water system.
Culvert Opening
5.2.7 Based on site observations, odour emissions were detected at the culvert / outfall openings. The culvert / outfall openings include the Jordan Valley Culvert Outfall (JVCO), discharging to north KTAC and three major existing culvert systems discharging to KTN. The three major culvert systems serve the Kowloon City, San Po Kong and Diamond Hill / Ngau Chi Wan catchment areas.
5.2.8 Flows from the culverts were observed to be contaminated with polluted discharges from
possible expedient connections. The polluted discharges would cause the deposition of contaminated silts / sediments, releasing odorous chemicals to the overlying water and headspace. During high tide, when the water level rises, odour accumulated in the headspace would be emitted to the atmosphere, outside of the culverts.
5.2.9 The key factors that affect this type of odour generation are:
- Effluent quality of the culverts;
- Culvert dimensions and headspace size; and
- Amount of contaminated silts / sediments deposited onto the bottom of the culverts.
Northern Seawall of Former Kai Tak Runway
5.2.10 The northern seawall of the former Kai Tak runway is sloped and consisted of a relatively flat bench before sloping to the seabed (see Figure 5.1). It is constructed of rectangular boulders with gaps in between. Based on site observations, sediments were noted deposited at the gaps and bench area and when the sediments were exposed to air during low tide, odour would be released.
5.2.11 The key factors that affect this type of odour generation are:
- Duration of low tide when sediment is exposed to the atmosphere;
- Size of gaps / bench area for the accumulation of contaminated sediments; and
- Water flow, which influenced the rate of sediment deposition.
Kai Tak Nullah (KTN)
5.2.12 The KTN can be divided into two sections. The downstream section of KTN is located at the North Apron of the former Kai Tak Airport and is more or less flat in gradient. The section starting from the middle part of the North Apron is affected by the tidal influx and always flooded with water. The water quality starts to deteriorate at this section as there are culverts from the hinterland discharging polluted runoffs into the KTN. While the tidal influence caused backup of seawater, sediments originated from polluted discharges starts to deposit at the channel bed. Bubbles of odorous gases were observed evolving from the deposit of the channel bottom with smell of H2S.

Agreement No. CE 35/2006(CE) Kai Tak Development Engineering Study cum Design and Construction of Advance Works Annex A – Investigation, Design and Construction KTAC and KTTS Studies
5-3
5.2.13 The flow from the upstream section of KTN is contributed mainly from the THEES (Tolo Harbour Effluent Export Scheme) discharges:- secondary treated effluent from the Tai Po and Sha Tin Sewage Treatment Works. The treated effluent is exported through a tunnel system connecting Sha Tin Sewage Treatment Works to KTN. The THEES effluent is discharging at a location near Wong Tai Sin Police Station. The treated effluent would have some characteristics odour but is not necessarily irritating. As observed on site, it was like “soil odour after rain”. The long standing time inside the tunnel system may give rise to some odour generation possibly from the anoxic conditions of the tunnel. The origin is different from the sediment oriented odour of KTAC. The turbulent water surface resulted from the high flow rate promotes the release of odorous chemicals to the atmosphere at the local level. This type of odour was reduced significantly further downstream, as observed. The downstream area of KTN is benefited by the large base flow and the flushing effects provided by THEES.
5.2.14 The key factors that affect this type of odour generation are:
- Effluent quality of the THEES and culverts;
- Temperature; and
- Water depths, influenced by tidal effects.
5.3 Spatial Variation of Odour Emissions in KTAC and KTTS
5.3.1 Based on the field survey results as discussed in Section 3, the contour plot for the odour source strength was prepared and presented in the odour impact assessment in Section 9 of this report (see Figure 9.3). A number of odour ‘hotspots’ were identified with locations correspond closely with the identified odour sources as discussed above. The spatial variations of odour emissions for KTN, KTAC and KTTS are separately discussed below.
Kai Tak Nullah (KTN)
5.3.2 The odour source strength was relatively low at the northern section of KTN (approximately 2 ou/m
2/s) but was observed to have increased rapidly downstream near the Diamond Hill
and Kowloon City Culverts. The peak of the odour emission occurred just downstream of the culverts and high odour strength was observed down to the mouth of KTN. Based on the field data, the average measured odour concentration recorded at the headspace of Diamond Hill and Kowloon City Culverts were elevated with values of 2,268 ou/m
3 and
9,592 ou/m3 respectively.
5.3.3 At the upstream section of KTN, the measured specific odour emission rate (SOER) in the
vicinity of KTN and San Po Kong Culverts were 0.22 ou/m2.s and 0.9 ou/m
2.s respectively
which were relatively lower than the odour emissions from Diamond Hill and Kowloon City Culverts. In addition, the measured water odour potential at KTN and San Po Kong Culverts were considered low with values of 3.29 ou/L[water]/h and 7.47 ou/L[water]/h respectively. The values were comparatively lower than the water odour potential at Kowloon City Culvert with level of 17.79 ou/L[water]/h. Based on the above, it is considered that the downstream section of KTN was more significant in term of potential odour emissions when compared with the upstream section of KTN.
5.3.4 The observed spatial variations at KTN support the findings of the Stage 1 Planning Review.
The following are considered to be the major contributors for the odour generation at KTN:
- Polluted, sediment-laden discharges and headspace of the culverts, in particular Diamond Hill and Kowloon City Culverts;
- Slow flow due to tidal influence, leading to relatively high sediment depositions; and
- Existing contaminated sediments along the Nullah.

Agreement No. CE 35/2006(CE) Kai Tak Development Engineering Study Annex A cum Design and Construction of Advance Works KTAC and KTTS Studies – Investigation, Design and Construction
5-4
Northern KTAC 5.3.5 As shown in Figure 9.3, relatively high odour source strength was identified at the northern
KTAC. In particular, elevated levels were identified at areas around (i) northern boundary of KTAC, (ii) western bank of KTAC and (iii) JVCO. For the northern boundary and western bank, the elevated levels were mostly located at the shallower areas of KTAC with water depths of less than 2m. The shallower areas might be due to the prolonged deposition of silts / sediments from the upstream KTN. In addition, the seawall of the former Kai Tak runway located at the western bank of KTAC, might also be an odour source.
5.3.6 The area near JVCO was also identified as an odour hotspot. As shown in Table 5.1, the
SOER measured just outside of JVCO (sampling Location NKTAC35) was 17.1 ou/m2.s
which was significantly higher than the SOERs recorded in the nearby sampling locations (with SOERs ranged from 0.19 to 2.9 ou/m
2.s). Furthermore, the measured water depth
(1.1m) at NKTAC35 was also observed to be significantly shallower than nearby sampling locations, caused by the prolonged deposition of silts / sediments from JVCO. The average odour concentration measured at the headspace of JVCO was relatively high with value of 246 ou/m
3.
Table 5.1 Measured SOER near JVCO
Sampling ID* Water Depth
(m) SOER
(ou/m2.s)
Description
NKTAC45 4.4 1.16 North of JVCO
NKTAC44 4.2 0.98 North of JVCO
NKTAC34 3.3 0.19 West of JVCO NKTAC35 1.1 17.10 Closest to JVCO
NKTAC25 4.3 2.90 South of JVCO
NKTAC24 4.2 0.86 South of JVCO * Refer to Figure 3.1 for sampling location.
5.3.7 Based on the above and findings of Stage 1 Planning Review, the following were
considered to be major contributors for the odour generation at northern KTAC:
- Odour contributors from upstream of KTN;
- Contaminated sediments (both old and newly deposited) in seabed;
- Exposed contaminated sediments at the seawall of the former Kai Tak runway along the western bank of KTAC;
- Area with shallow water depths; and
- Polluted, sediment-laden discharges and headspace of JVCO;
Southern KTAC and KTTS
5.3.8 As shown in Figure 9.3, the odour source strength were significantly lower at southern
KTAC and KTTS than northern KTAC and KTN. The odour source strength, with range of 0 to 4 ou/m
2.s, generally decreases from mid-KTAC to KTTS. The observed lower odour
source strength also supported the findings of the Stage 1 Planning Review and could be explained by the higher water depths and relatively less contaminated sediments.
5.3.9 Based on the above and findings of Stage 1 Planning Review, the major contributors for the
odour generation at southern KTAC and KTTS were as follows
- Polluted, sediment-laden discharges from upstream (ie northern KTAC and KTN); and
- Contaminated sediments (both old and newly deposited) on seabed.

Agreement No. CE 35/2006(CE) Kai Tak Development Engineering Study cum Design and Construction of Advance Works Annex A – Investigation, Design and Construction KTAC and KTTS Studies
5-5
5.4 Variation of Odour Emissions Against Environmental Factors
Temperature Effects
5.4.1 The effects of temperature to odour emissions for the different scenarios under the laboratory study are shown in Figure 5.2. The figure presented the results of the odour emissions from sediments / water collected from northern KTAC (KTAC1), northern KTAC with bioremediation treated area (KTAC2), southern KTAC (KTAC3) and KTTS (KTTS1) at incubation temperature of 15
oC, 25
oC and 35
oC. The measured AVS concentrations of the
sediments were also shown in the figure. 5.4.2 Based on Figure 5.2, strong odour emissions were evidenced at high temperature (i.e. 35
oC)
for all scenarios. In particular, profound increases were noted for sediment / water collected from KTAC1 (from 260 ou/m
3 at 15
oC and 347 ou/m
3 at 25
oC to 16,400 ou/m
3 at 35
oC),
KTAC3 (from 102 ou/m3 at 15
oC and 288 ou/m
3 at 25
oC to 2,920 ou/m
3 at 35
oC) and KTTS1
(from 164 ou/m3 at 15
oC and 25
oC to 1,520 ou/m
3 at 35
oC). Smaller increase in odour
emissions was observed at KTAC2 (bioremediation treated area) with value of 138 ou/m3
and 96 ou/m3 at 15
oC and 25
oC to 262 ou/m
3 at 35
oC.
5.4.3 In comparison between 15
oC and 25
oC, slight increase in odour emissions was observed for
KTAC1 (from 260 ou/m3 at 15
oC to 347 ou/m
3 at 25
oC) and KTAC3 (from 102 ou/m
3 at 15
oC
to 288 ou/m3 at 25
oC). The odour emissions for KTAC2 sediment / water were noted to
have decrease (from 138 ou/m3 at 15
oC to 96 ou/m
3 at 25
oC) whereas the odour emissions
for KTTS1 at 15oC and 25
oC were the same. However, it should be noted that the AVS
level for KTTS sediments (3,000 mg-S/kg) at 15oC was much greater than the levels at 25
oC
(1,000 mg-S/kg) which might have significant influence to the odour emission results. In addition, after the change in temperature for the incubation, it is possible that the micro-organisms in the sediment samples might not be able to fully adapt the new environment, causing a slower biological reaction. This phenomenon is considered to have the most significant impacts on the temperature change from 25
oC to 15
oC.
5.4.4 Although limited data were available from the laboratory study and that the intrinsic
properties of the laboratory study (e.g. slower biological reaction due to temperature change), might have influenced the odour emission results, the results of the laboratory study might suggest the following:
- Odour emissions generally increase with incubation temperature; and
- Given the large differences in AVS concentration for KTTS1 at 15oC and 25
oC, the
change in odour emissions might not solely reflect the temperature effects.

Agreement No. CE 35/2006(CE) Kai Tak Development Engineering Study Annex A cum Design and Construction of Advance Works KTAC and KTTS Studies – Investigation, Design and Construction
5-6
Figure 5.2: Variations of Odour Concentration with Temperature
(Water Depth: 0.8m; Water Column Source: In-situ Water)
260 347
16400
138 96 262 102 288
2920
164 164
1520
4200
3400
2200
1600
1900
950
3000
1000
1700
3 2.8 2.
8
0
2000
4000
6000
8000
10000
12000
14000
16000
18000
KTA
C1
(S1)
15o
C
KTAC
1 (S
3) 2
5oC
KTAC
1 (S
5) 3
5oC
KTAC2
(S11
) 15o
C
KTAC2
(S13
) 25o
C
KTAC2
(S15
) 35o
C
KTAC3
(S21
) 15o
C
KTAC3
(S23
) 25o
C
KTAC3
(S25
) 35o
C
KTTS1
(S31
) 15o
C
KTTS1
(S33
) 25o
C
KTTS1
(S35
) 35o
C
Scenario
Odour
Concentr
ation (
ou/m
^3)
0
500
1000
1500
2000
2500
3000
3500
4000
4500
AV
S (
mg-S
/kg)
Water Depth Effects 5.4.5 The effects of water depth to odour emissions for the different scenarios under the
laboratory study are shown in Figure 5.3. The figure presented the results of the odour emissions from sediments / water collected from northern KTAC (KTAC1), northern KTAC with bioremediation treated area (KTAC2), southern KTAC (KTAC3) and KTTS (KTTS1) at incubation temperature of 25
oC with water column depth of 0.4m, 0.8m and 1.2m. The
measured AVS concentrations of the sediments were also shown in the figure. 5.4.6 Based on laboratory results, a decreasing trend in odour emissions were observed at
KTAC2 and KTAC3 with increasing water column depth. For KTAC2, the odour concentration decreases from 121 ou/m
3 for 0.4m water column, 96 ou/m
3 for 0.8m water
column to 70 ou/m3 for 1.2m water column whereas for KTAC3, the odour concentrations
decrease from 484 ou/m3 for 0.4m water column, 288 ou/m
3 for 0.8m water column to 260
ou/m3 for 1.2m water column. On the other hand, an increase trend in odour concentration
was observed for KTAC1 with increase in water depth while for KTTS1, the odour emissions were similar for the three water column depths. The increase in odour concentration as a result of greater water depth in KTAC1 might be due to the continuous bubbling of H2S gas from sediments to the water column. The continuous bubbling resulted in the saturation of H2S gas in the water column, causing the excessive release and measurement of odour.
5.4.7 Although limited data were available from the laboratory study, the results of the laboratory
might suggest the following:
- The odour emissions decrease with increasing water depths at KTAC2 and KTAC3, indicating that higher odour might occurred as a result of low tides; and
- The increasing trend in KTAC1 is possibly due to the intrinsic properties of the laboratory setup.

Agreement No. CE 35/2006(CE) Kai Tak Development Engineering Study cum Design and Construction of Advance Works Annex A – Investigation, Design and Construction KTAC and KTTS Studies
5-7
Figure 5.3 Variations of Odour Concentration with Water Depths
(Temperature: 25oC; Water Column Source: In-situ Water)
269
347 349
121
96
70
484
288
260
164 164153
3300 34
00
2000
1.7
2.8
3.9
1900
930
470
1000
1200
1900
0
100
200
300
400
500
600
KTA
C1
(S2)
0.4
m
KTA
C1
(S3)
0.8
m
KTA
C1
(S4)
1.2
m
KTA
C2
(S12
) 0.4
m
KTA
C2
(S13
) 0.8
m
KTA
C2
(S14
) 1.2
m
KTA
C3
(S22
) 0.4
m
KTA
C3
(S23
) 0.8
m
KTA
C3
(S24
) 1.2
m
KTT
S1
(S32
) 0.4
m
KTT
S1
(S33
) 0.8
m
KTTS
1 (S
34) 1
.2m
Scenario
Odour
Concentr
ation (
ou/m
^3)
0
500
1000
1500
2000
2500
3000
3500
4000
AV
S (
mg-S
/kg)
Sediment Contributions
5.4.8 Table 5.2 below shows the odour emissions generated from scenarios with and without water column under the laboratory study. The sediments were collected from northern KTAC with incubation temperature of 25
oC.
Table 5.2 Comparison of Odour Emissions with and without Water Column
(Incubation Temperature: 25oC)
Scenario Description
Sediment Source
Water Depth (m)
AVS (mg-S/kg)
Odour Concentration
(ou/m3)
Sediment Only N/A 2,400 1,075
0.4 3,300 269
0.8 3,400 347 Sediment and Water Column
Northern KTAC
1.2 2,000 349
5.4.9 As shown in Table 5.2, the odour emissions from sediment alone (1,075 ou/m
3) were much
greater than the scenarios with various water column depths (269 – 349 ou/m3). Although
limited data were available, the results of the laboratory study suggested the following:
- Sediment contribution in odour generation was considered relatively large when compared with water contribution. Existing water over sediments seemed to have dampening rather than synergetic effects on odour emissions; and
- Exposed sediments (e.g. sediment in seawall) would be of concern if the area is sufficiently large.
5.5 Summary
5.5.1 Table 5.3 below summarises the major odour sources, the generation mechanism and the key influencing factors as discussed in this section.

A
gre
em
ent
No.
CE
35/2
006(C
E)
K
ai T
ak D
evelo
pm
ent
Engin
eeri
ng S
tud
y
Anne
x A
cum
Desig
n a
nd C
onstr
uction o
f A
dva
nce W
ork
s
KT
AC
an
d K
TT
S S
tudie
s
– I
nvestigation,
Desig
n a
nd C
on
str
uction
5-8
Tab
le 5
.3
Su
mm
ary
of
Ke
y O
do
ur
So
urc
es,
Gen
era
tio
n M
ech
an
ism
an
d In
flu
en
cin
g F
acto
rs
Are
a
Ke
y O
do
ur
So
urc
e
Gen
era
tio
n M
ech
an
ism
In
flu
en
cin
g F
acto
rs
South
ern
Section
of
KT
N
Conta
min
ate
d S
ed
iments
on
Chan
nel be
d
- C
onta
min
ate
d s
edim
ents
were
dep
osite
d
on c
hann
el
bed
du
e t
o p
ast
an
d c
urr
en
t dis
charg
es.
- O
dour
genera
ted
from
conta
min
ate
d
sedim
ents
, re
leasin
g
H2S
in
to
the
overl
yin
g w
ate
r an
d a
tmosphere
.
- S
low
flo
w d
ue t
o t
idal in
flue
nce, le
ad
ing
to
hig
h s
ed
iment depositio
ns;
- W
ate
r depth
s, in
flue
nced b
y t
ida
l eff
ects
;
- T
em
pera
ture
; and
- E
fflu
ent qu
alit
y o
f culv
ert
s.
D
iam
ond H
ill / K
ow
loo
n C
ity
Culv
ert
s
- C
ulv
ert
flo
ws
were
observ
ed
to
b
e
conta
min
ate
d
with
po
llute
d
dis
charg
es
from
possib
le e
xpe
die
nt co
nnections.
- D
eposited
conta
min
ate
d s
ilts /
se
dim
ents
w
ould
re
lease
od
oro
us c
hem
icals
to t
he
overl
yin
g w
ate
r a
nd
he
adspace.
Duri
ng
hig
h
tid
e,
whe
n
the
wate
r le
vel
rises,
odour
accum
ula
ted
in
th
e
headsp
ace
w
ould
be
em
itte
d
to
the
atm
osphere
, outs
ide o
f th
e c
ulv
ert
s.
- C
aused b
y th
e continu
ous dep
ositio
n of
conta
min
ate
d
silt
s
/ sedim
ents
in
to
the
C
han
nel, lead
ing to o
do
ur
pro
ble
m.
- E
fflu
ent qu
alit
y o
f th
e c
ulv
ert
s;
- C
ulv
ert
dim
ensio
ns a
nd h
eadspace;
and
- A
mount of
conta
min
ate
d s
ilts / s
edim
ent.

Agre
em
ent
No.
CE
35/2
006(C
E)
Kai T
ak D
evelo
pm
ent
Engin
eeri
ng S
tud
y
cum
Desig
n a
nd C
onstr
uction o
f A
dva
nce W
ork
s
Anne
x A
– I
nvestigation,
Desig
n a
nd C
on
str
uction
KT
AC
an
d K
TT
S S
tudie
s
5-9
Are
a
Ke
y O
do
ur
So
urc
e
Gen
era
tio
n M
ech
an
ism
In
flu
en
cin
g F
acto
rs
KT
AC
C
onta
min
ate
d S
ed
iments
on
Chan
nel S
eab
ed
- C
onta
min
ate
d s
edim
ents
were
dep
osite
d
on c
hann
el
bed
du
e t
o p
ast
an
d c
urr
en
t dis
charg
es.
- O
dour
genera
ted
from
conta
min
ate
d
sedim
ents
, re
leasin
g
H2S
in
to
the
overl
yin
g w
ate
r an
d a
tmosphere
.
- O
verl
yin
g
wate
r d
epth
s,
influe
nced
b
y
tida
l eff
ects
;
- W
ate
r qualit
y,
in
part
icula
r dis
so
lved
oxyge
n
concen
tration
an
d
str
atification
eff
ect;
- W
ate
r circula
tio
n; a
nd
- S
ed
iment
qu
alit
y
inclu
din
g
TO
C,
redox
pote
ntial and A
VS
le
ve
ls.
Jord
an V
alle
y C
ulv
ert
Ou
tfall
- C
aused
by
the
depositio
n
of
conta
min
ate
d s
ilts /
se
dim
ents
, re
leasin
g
odoro
us c
hem
icals
to t
he o
verl
yin
g w
ate
r and
headsp
ace
an
d
rele
asin
g
odoro
us
chem
icals
. D
uring h
igh tide,
wh
en th
e
wate
r le
vel
rises,
odo
ur
accum
ula
ted in
th
e h
eadsp
ace w
ould
be em
itte
d to
th
e
atm
osphere
, outs
ide o
f th
e c
ulv
ert
s.
- C
aused b
y th
e continu
ous dep
ositio
n of
conta
min
ate
d
silt
s
/ sedim
ents
in
to
the
C
han
nel.
- E
fflu
ent qu
alit
y o
f th
e c
ulv
ert
s;
- C
ulv
ert
dim
ensio
ns a
nd h
eadspace;
and
- A
mount of
conta
min
ate
d s
ilts / s
edim
ent.
N
ort
hern
Se
aw
all
of
Form
er
Kai T
ak R
unw
ay
- O
dour
caused
by
conta
min
ate
d
sedim
ents
dep
osite
d
at
gaps
betw
ee
n
rock
arm
our
and
b
ench
are
a
of
the
sea
wall.
Inte
nse o
do
ur
is e
xpecte
d d
uri
ng
lo
w tid
e w
he
n s
edim
ents
were
exp
osed
to
th
e a
tmosphere
.
- D
ura
tion
of
low
tide
whe
n
sedim
ent
is
exposed t
o th
e a
tmosphere
;
- S
ize
of
gaps
/ bench
are
a
for
the
accum
ula
tion o
f conta
min
ate
d s
ed
iments
; and
- W
ate
r flow
, w
hic
h i
nfluenced t
he r
ate
of
sedim
ent dep
ositio
ns.

A
gre
em
ent
No.
CE
35/2
006(C
E)
K
ai T
ak D
evelo
pm
ent
Engin
eeri
ng S
tud
y
Anne
x A
cum
Desig
n a
nd C
onstr
uction o
f A
dva
nce W
ork
s
KT
AC
an
d K
TT
S S
tudie
s
– I
nvestigation,
Desig
n a
nd C
on
str
uction
5-1
0
Are
a
Ke
y O
do
ur
So
urc
e
Gen
era
tio
n M
ech
an
ism
In
flu
en
cin
g F
acto
rs
KT
TS
C
onta
min
ate
d
Sed
iments
on
C
han
nel S
eab
ed
- C
onta
min
ate
d s
edim
ents
were
dep
osite
d
on c
hann
el
bed
du
e t
o p
ast
an
d c
urr
en
t dis
charg
es.
- O
dour
genera
ted
from
conta
min
ate
d
sedim
ents
, re
leasin
g
H2S
in
to
the
overl
yin
g w
ate
r an
d a
tmosphere
.
- O
verl
yin
g
wate
r d
epth
s,
influe
nced
b
y
tida
l eff
ects
;
- W
ate
r qualit
y,
in
part
icula
r dis
so
lved
oxyge
n
concen
tration
an
d
str
atification
eff
ect;
- W
ate
r circula
tio
n; a
nd
- S
ed
iment
qu
alit
y
inclu
din
g
TO
C,
redox
pote
ntial and A
VS
le
ve
ls.

Agreement No. CE 35/2006(CE) Kai Tak Development Engineering Study cum Design and Construction of Advance Works Annex A – Investigation, Design and Construction KTAC and KTTS Studies
6-1
6 TREATMENT OF SEDIMENT
6.1 Introduction 6.1.1 Based on the review of previous studies and data as described in Section 2, the emissions
of malodorous chemicals generated from the contaminated sediments at KTAC and KTTS are considered to be the major source of odour. In order to tackle the odour problem in KTAC and KTTS, it is vital that the contaminated sediments are properly addressed.
6.1.2 As discussed in Section 2, there are two sources of odour generation from sediments: (i)
emissions from odorous sediments at water surface covering areas of KTN, KTAC and KTTS and (ii) emissions from exposed sediment during low tide at the seawall of the former runway along KTAC. To address the odour problem from contaminated sediments, this section will be divided into two main parts. The first part will tackle the odour problem generated from the sediments on the seabed of KTAC and KTTS. This will include the review of available sediment treatment, formulate the appropriate remediation selection strategy, compare in detail the applicable sediment treatment technologies and discuss and recommend, if any, the most appropriate technology(s). The second part of the section will discuss the method to eliminate odour generation from exposed contaminated sediments in the former runway seawall along KTAC.
6.2 Review of Sediment Treatment Technologies 6.2.1 A review on the potential in-situ and ex-situ sediment treatment technologies for tackling the
odour problem from the contaminated sediments in KTAC and KTTS had been conducted in this study. Based on the findings of the Stage 1 Planning Review and South East Kowloon Development – Kai Tak Approach Channel Reclamation, the sediment treatment technologies that may be suitable for KTAC and KTTS are shown in Table 6.1 below and are discussed in this section of the report.
Table 6.1 Sediments Treatment Technologies
In-situ Treatment Ex-situ Treatment*
� In-situ Bioremediation
� In-situ capping
� In-situ cement stabilization and solidification (S/S)
� Dredging on barge and cement stabilization and solidification (S/S)
� Sediment washing
� Marine Disposal
� Landfill Disposal
* Ex-situ treatment would require the initial dredging of sediments prior to treatment.
In-Situ Treatment
In-situ Bioremediation
6.2.2 Bioremediation is a technique that degrades, transforms or immobilizes contaminants by using biological organisms, chemicals and/or oxygen to stimulate the microbial activity within the treatment site. The end products of bioremediation may include carbon dioxide, methane, inorganic salts and water. It is a technique that targets primarily of organic contaminants and like most of in-situ techniques, the treatment application is often site-specific and depends on the nature and characteristics of sediment.

Agreement No. CE 35/2006(CE) Kai Tak Development Engineering Study Annex A cum Design and Construction of Advance Works KTAC and KTTS Studies – Investigation, Design and Construction
6-2
6.2.3 The bioremediation method using calcium nitrate has been successfully applied for the treatment of contaminated soil in Hong Kong and has been used to treat odorous sediment at Shing Ming River (SMR) and Sam Ka Tsuen Typhoon Shelter. For the treatment of odorous sediments, bioremediation process relies on the injection of liquid calcium nitrate [Ca(NO3)2] solution into the sediments in a controlled manner. The nitrate serves as an oxidant for micro-organisms to oxidize sulphides, thereby suppressing further odour generation. The nitrate will also be preferentially utilized by the micro-organisms for further biodegradation of organic materials within sediment. The final products of the process will mainly be odourless and harmless gases as nitrogen and carbon dioxide. In this manner, both the acute and chronic odour problems can be addressed.
6.2.4 A pilot study on the use of calcium nitrate had been conducted in the Stage 1 Planning
Review to treat the contaminated sediments in KTAC in 2006. The total treatment area for the pilot study was about 1 hectare (ha) and was situated in one of the most contaminated area in KTAC. A 12-month post-injection monitoring programme was implemented to monitor the treatment performance of the pilot study.
In-situ Capping
6.2.5 In this method, contaminated sediments are covered by stable layers of sand, sediment, gravel, rock, and/or synthetic materials in order to reduce the contaminants mobility and subsequent interaction between aquatic organisms and the contaminants.
6.2.6 Sediment capping is a commercial technology which has been proved effective to contain
volatile organic compounds (VOCs), semi-volatile organic compounds (SVOCs) (including PAHs and PCBs), pesticides and metals in a vast number of projects world-wide. This technology is usually used in ocean shoreline situations and its application for some river situations is being studied.
6.2.7 According to a summary of 109 contaminated sediment capping projects in the USA,
Netherlands, Japan, Norway, Sweden and Germany, the area of sand capping sites ranges from 400 to 1457 x 103 m
2, the cap thickness ranges from 9 to 600cm and the depth of
capping ranges from 1 to 30m below sea level. In some situations, the sediment of concern is too soft to support a cap and a geosynthetic sheet will need to be placed between the cap and the soft sediment, allowing the sand cap to be constructed over the soft foundation. The overlying sand cap would restrain the geosynthetic sheet and prevent migration of contaminated sediment into the water column.
In-situ Cement S/S
6.2.8 Solidification is to solidify the sediment with cement-like materials so that toxic pollutants cannot be released to the environment except by the slow leaching process due to molecular diffusion. Stabilization refers to the chemical reaction that covers contaminants to less toxic and/or less mobile forms when the waste materials react with the solidifying reagents. The most common type of binding agent is Portland cement, although there are other types of binders, including pozzolans, silicates, bitumen and polymers.
6.2.9 The deep mixing method (DMM) copes best with the use of hardening agents for in-situ S/S
processes. Since the late 1960’s, intense researches have been conducted to improve the performance of DMM, especially in Japan and Nordic countries. Two of the more frequently used techniques in DMM are: (i) Wet Method - Deep Cement Mixing (DCM); (ii) Dry and Wet Method - Jet Grouting.
6.2.10 The wet method (DCM) takes advantage of the humid property of the hardening agents
which exist in slurries such as cement mortar and cement slurry. However, inadequate mixing is the shortfall in this method. Their deficiencies have led to the development of Jet Grouting in Japan which achieves better mixing homogeneity, but budget-tight projects may see its costs as a huge obstacle.

Agreement No. CE 35/2006(CE) Kai Tak Development Engineering Study cum Design and Construction of Advance Works Annex A – Investigation, Design and Construction KTAC and KTTS Studies
6-3
Ex-Situ Treatment Dredge and On-barge S/S
6.2.11 This mitigation strategy has been demonstrated successful to solve the management problem of a large volume (4 million cubic yards) of contaminated sediments (impacted by heavy metals, PCBs and other organic contaminants) from maintenance dredging of harbours of New York and New Jersey, which ocean disposal of such sediments is restricted under federal regulations. A brief description of this mitigation measure is given below.
6.2.12 The contaminated sediments were first dredged under environmentally sensitive dredging
operations and loaded to scows. Then, the sediments were dewatered, blended with a Portland cement-based additive slurry and underwent further dehydration, which can be referred as a “Portland cement-based chemical fixation and stabilization process”. After this process was finished, the metals and organic constituents in the sediments were immobilized and a highly impermeable structural fill material was created. The dewatering operation as well as the chemical fixation and stabilization process were conducted on scows, i.e. no loading of contaminated sediments on land was required.
6.2.13 After the above processes were completed, the curing phase of the treatment began. The
curing process lasts for a number of days and during this process the treated dredged material was moved to the intended final disposition site for off-loading, site placement and compaction. The end product can be used as structural fill, capping material for the containment of contaminants at ‘brownfield’ site and landfill cover. The need for removal of the sediments should be satisfactorily demonstrated, under ETWB TCW No. 34/2002 prior to the treatment.
Sediment Washing
6.2.14 A bench-scale testing for ex-situ treatment by sediment washing, using BioGensisTM
technology, was conducted in 2002 (ARUP-Scott Wilson JV, 2003). Bench-scale testing results indicated that the BioGenesis
TM sediment washing technique is effective in
remediation of the sediment. The total organic carbon content was reduced by about 80% after treatment. Apart from sludge arising from wastewater treatment, no sediment disposal would be necessary. Several issues would however need to be further examined and confirmed including odour control during sediment dredging, treatment of large volume of wastewater arising from the washing process and the logistics required for handling the large quantities of sediment. In addition, intensive treatment would be required to achieve high odour removal efficiency, which probably need to be 2-3 times of washing with high cost involved.
6.2.15 The BioGenesis
TM involves the following process:
(i) A Hydrascreen and slurry tank to separate large debris from the sediment slurry (ii) A Mixing Tank to homogenise the sediment slurry with chelating chemicals (iii) Preprocessing using high pressure water jet (iv) An Aeration Tank to remove floatable organics (v) A Collision Chamber using high pressure water to physically separate the
contaminants (that are adsorbed on the particles) from the particles (vi) A Cavitation / Oxidation Unit with addition of oxidants to oxidise the organic
contaminants (vii) A Hydrasander for liquid/solid separation (viii) The liquid faction will undergo traditional wastewater treatment to remove the metals (ix) The solid faction will undergo conditioning for beneficial re-use, such as re-use as fill
material, resulting in no off-site disposal of dredged material

Agreement No. CE 35/2006(CE) Kai Tak Development Engineering Study Annex A cum Design and Construction of Advance Works KTAC and KTTS Studies – Investigation, Design and Construction
6-4
Marine Disposal
6.2.16 Marine disposal is also a possible option, depending on the quantity and timing of the disposal. The existing disposal requirements for Hong Kong stipulate proper pre-treatment of the sediment before disposal. Extensive worldwide experience in the dewatering of sediment and in the use of geosynthetic containers / tube for sediment confinement indicates that the marine disposal option is technically feasible. Further testing will be needed to confirm the performance of the geosynthetic containers under local conditions.
6.2.17 The remaining capacity of the mud pits in Hong Kong to receive dredged mud arising in
future would be very tight. Disposal of large quantities of dredged sediment, i.e. exceeding 500,000 m
3 would be classified as a Designated Project under Schedule 2 Part 1-C of the
EIA Ordinance and would require an EIA study to be carried out to confirm its overall acceptability.
Landfill Disposal
6.2.18 This option is to directly dump the dredged sediments into the designated landfills. Technically, landfill can provide a secure, engineered containment facility for the disposal of contaminated sediments. However, the option of disposing all the dredged sediments to landfill is against the Government’s waste management strategy and international practice on minimizing the amount of wastes sent to landfill.
6.3 Remediation Selection Strategy
Remediation Goals and Intended End-Use of the Site
6.3.1 Prior to developing a project-specific remediation selection strategy, it is important to define the remediation goals and the intended end-use of the site and the sediments.
6.3.2 The principal remediation goal of sediment treatment for KTAC and KTTS is to mitigate
odour emitted from channel bed sediment prior to the future development of the area. As the principal goal is to mitigate odour emissions, the main objective of the remediation is therefore to control odorous chemicals generated, rather than to treat the sediments to an ‘acceptable’ standard. The selection of the remediation technologies should focus on this remediation goal. Furthermore, the “no reclamation” principle, as adopted in the Stage 1 Planning Review, implies that both KTAC and KTTS will be left in place. A long-term effective option to suppress odour emission is therefore necessary to minimize the impacts to future sensitive receivers within the future Kai Tak Development.
Overall Approach
6.3.3 Based on the studies carried out for Stage 1 Planning Review and South East Kowloon Development – Kai Tak Approach Channel Reclamation, in-situ techniques had been considered as the more acceptable on the ground that no dredging are required and that the handling of contaminated sediments would be minimized. It is expected that the disturbance of the heavily contaminated seabed during extensive dredging could cause the release of contaminants (particular heavy metals and organics) from the sediments to the water bodies and could pose significant adverse impacts to the surrounding environment, including KTAC, KTTS, Hoi Sham and Victoria Harbour. Furthermore, there would be environmental concerns associated with the handling, transportation and treatment of the sediment as well as risks in spilling / leaking of contaminated materials. In particular, substantial odour release is expected during extensive dredging as a result of (i) sediment disturbance, (ii) dredging contaminated sediments to barge and (iii) transportation of dredged materials to designated storage / treatment sites. Moreover, sediment texture of KTAC is generally of high water content with a layer of slurry like mixture at the surface. Dredging using conventional grab method may be ineffective and cause further disturbance and re-suspension of sediments.

Agreement No. CE 35/2006(CE) Kai Tak Development Engineering Study cum Design and Construction of Advance Works Annex A – Investigation, Design and Construction KTAC and KTTS Studies
6-5
6.3.4 Although there are mitigation measures that could be implemented to minimize the impacts of extensive dredging (e.g. using suction dredging to prevent the exposure of sediments to the atmosphere, installation of suitable enclosure systems and carrying out pre-treatments using in-situ technique), there are uncertainties in determining the most appropriate set of mitigation measures for the case of KTAC / KTTS given the degree of contamination in the sediments. The high cost and length in time associated with extensive dredging and the implementation of mitigation measures are also a major concern for the ex-situ options.
6.3.5 In addition, while dredging can substantially reduce the odour by removing the sediment, it
is considered not possible for complete removal due to the unavoidable reposition of dredged materials during and after the operation and this problem would be further aggravated in the presence of continuous polluted discharges from upstream of the channel.
6.3.6 Further to the Protection of the Harbour Ordinance (Cap. 531, 1999), the number and scale
of reclamation projects in Hong Kong will be greatly reduced. This would become an important issue to consider if ex-situ options were adopted for the entire KTAC and/or KTTS as large volume of treated sediment would need to be catered for as they are not likely to be used immediately as fill for reclamation in Hong Kong. The difficulties in exporting treated sediments and disposing to designed landfill or marine disposal site would further magnify the problem.
6.3.7 Based the above, the remediation selection strategy is formulated and is shown in
Figure 6.1. As shown in Figure 6.1, in-situ options or combination of in-situ techniques will firstly be evaluated for its appropriateness for tackling the odour problem in KTAC and KTTS. The evaluation would involve the assessments and comparison of the different in-situ techniques. If, based on the evaluation, no in-situ options were found appropriate, the ex-situ techniques or a combination of in-situ / ex-situ techniques will be assessed, in a way similar to the evaluation of the in-situ options. If no options were considered acceptable, other alternative options will need to be recommended for further studies.
Selection Criteria
6.3.8 The key criteria for selecting the sediment treatment method(s) for this study are as follow:
(i) treatment effectiveness and limitations;
(ii) environmental impacts;
(iii) work programme and cost; and
(iv) uncertainty and recognition of the method.
Treatment Effectiveness and Limitations
6.3.9 The treatment effectiveness is the ability of the treatment technologies to achieve the remediation goal, i.e. odour removal. It is important that the technologies could be able to either root out or suppress the odour generation mechanism. The acid volatile sulphide (AVS) levels in sediments are considered to be the key indicator for the odour generation (or removal) in KTAC and KTTS.
6.3.10 There are a number of site-specific issues that needed to be considered in determining the effectiveness of the remediation technologies. These are: (i) the mixture and complexity of the contaminants at KTAC (ii) the relatively large treatment site (28 hectare in area for KTAC alone) and (iii) the ability to deal with possible future upstream pollution sources. The feasibility to re-apply treatments would need to be considered in the latter case.

Agreement No. CE 35/2006(CE) Kai Tak Development Engineering Study Annex A cum Design and Construction of Advance Works KTAC and KTTS Studies – Investigation, Design and Construction
6-6
Environmental Impacts
6.3.11 The environmental impacts as results of applying the remediation technologies should need to be considered. Technologies that successfully suppress odour may not be the most appropriate methods if significant adverse and irreversible environmental impacts were likely. For example, for ex-situ options, dredging activities would cause major disturbances to the sediments and given the heavily contaminated sediments at KTAC, could potentially release toxic contaminants to the surrounding water bodies.
Work Programme and Cost
6.3.12 The time and cost required for the carrying out of the sediment remediation are important for any remediation projects. It is important that the duration and cost of the selected remediation technology are within the programme’s timeframe and budget.
Implementation, Uncertainty and Recognition of the Method
6.3.13 The uncertainty in achieving the remediation goal would be a major barrier for many remediation technologies. Some of the technologies may have no proven record of application or only reach up to bench-scale stage. Higher degree in uncertainties will result in an increased cost and time to formulate and implement further studies / pilot test to confirm the appropriateness of the technology.
Figure 6.1 Remediation Selection Strategy
If in-situ option not appropriate
Evaluation of In-situ Options or combination of In-situ Options
Evaluation of Ex-situ Options or Combination of In-situ / Ex-situ Options
Selection Criteria similar to in-situ option
Selection Criteria (in consideration with the remediation goal and end-use of site) • Treatment Effectiveness and Limitations; • Environmental Impacts; • Work Programme and Cost; and • Implementation, Uncertainty & Recognition of
the Method
If option appropriate
Recommend Alternative Options and Further Studies
If no options appropriate
If option appropriate
Recommend Appropriate
Technology/s for Tackling the
Environmental Problems at KTAC
and KTTS
Possible Sediment Treatment Options Appropriate for
KTAC & KTTS Studies

Agreement No. CE 35/2006(CE) Kai Tak Development Engineering Study cum Design and Construction of Advance Works Annex A – Investigation, Design and Construction KTAC and KTTS Studies
6-7
6.4 Comparison of Sediment Treatment Technologies
6.4.1 Based on the above sediment selection strategy, a detailed evaluation of the in-situ options against a set of pre-defined selection criteria will be performed. As discussed in Section 6.2, in-situ options would include in-situ bioremediation, in-situ cement S/S and in-situ capping. The following sections summarized the detailed assessments of each of these technologies.
In-situ Bioremediation General Description
6.4.2 In-situ bioremediation involves the use of biological organisms, chemicals and/or oxygen to treat the sediments (see Section 6.2 above). An in-situ bioremediation pilot scale field test using calcium nitrate was performed at KTAC in 2006. The test area was located at the upstream end of KTAC, with sediments that were considered to be the most contaminated in the Channel. The total treatment area was 1 hectare (100m x 100m) and two injections were applied at various calcium nitrate dosages to the treatment site. In order to monitor the performance of the treatment and the potential environmental impacts associated with bioremediation activities to the surrounding area, a 12-month post-treatment monitoring and an environmental monitoring and audit (EM&A) programmes were also performed.
Programme and Cost
6.4.3 Based on the Situation Report on Review of Sediment Treatment Methods to Tackle Odour at KTAC, (City Planning – Maunsell JV, 2006) under the Stage 1 Planning Review, one set of treatment with two injections, is expected to take approximately 2 to 3 years. Based on the same report, the estimated cost for in-situ bioremediation was HK$150 million. The costs were based on 860,000 to 1,000,000m
3 of contaminated sediments.
Treatment Effectiveness
6.4.4 Based on the post-monitoring results for the pilot-scale field trial carried out under Stage 1 Planning Review (City Planning – Maunsell Joint Venture, October 2007), a maximum reduction of over 99.9% of AVS (or no detection of AVS) from pre- to post-treatments were recorded at the treatment areas and by the end of the post-monitoring, the AVS levels remained low (<2,000 mg/kg dry wt.). As AVS is considered to be the key indicator for odour emissions in sediments, the reduction level is considered to be successful in suppressing odour at KTAC. Furthermore, the reduction and oxidation potential within the treated sediments had also increased considerably from pre-treatment monitoring. The absolute increases from pre-treatment to post-12-month monitoring range from 165mV to 338 mV indicated the sediments were under anoxic / aerobic conditions rather than the H2S generating anaerobic conditions. In addition, reduction of TOC, PAHs, and PCBs were noted in the post-monitoring results, indicating the degradation of organic pollutants within the sediments. Some toxicity reductions, in particular in sediment bioassays, were also observed.
6.4.5 The major disadvantages of the in-situ bioremediation technique are that the removal of organic contaminants is likely to be slow and that heavy metals removal is minimal. However, given the remediation goal is to remove odour, these disadvantages are expected to have little influence to the selection of the appropriate remediation strategy for KTAC and KTTS.

Agreement No. CE 35/2006(CE) Kai Tak Development Engineering Study Annex A cum Design and Construction of Advance Works KTAC and KTTS Studies – Investigation, Design and Construction
6-8
Environmental Impacts
6.4.6 In comparison to ex-situ treatment, in-situ bioremediation is likely to cause far less environmental impacts as there would be minimal disturbance to the seabed due to dredging. In addition, the method has the environmental benefits in that it utilize biological process to remove odorous compounds and organic contaminants and has the capability to restore the original seabed and to promote recolonization of benthic organisms.
6.4.7 The major environmental concerns associated with in-situ bioremediation are the potential release of nitrate-nitrogen, ammonia and heavy metals from the sediments into the surrounding water bodies during the bioremediation activities. There is the possibility that the sediment disturbance during injections would increase mobilization of heavy metals and release nitrate-nitrogen. However, based on the EM&A results conducted for the pilot scale field tests during and after-injection, there were no significant water quality impacts noted as a result of the bioremediation activities. There were some transient elevated nitrate-nitrogen levels identified in the collected water samples and it was recommended at the time that the injections should be carried out at periods when there are stronger tidal influence so as to reduce any possible impacts (BMT Asia Pacific Limited, May 2006 & City Planning – Maunsell Joint Venture, October 2007).
Implementation, Recognition and Uncertainty of the Method
6.4.8 In-situ bioremediation had been successful applied in tackling the odour problem generated from contaminated sediments in Hong Kong. The sites that have been treated in Hong Kong are Shing Mun River and Sam Ka Tsuen Typhoon Shelter. Based on local experiences, two or more injections are usually required to achieve optimum dosage.
6.4.9 As the injection process is carried out on barge, provision of land for the setting up of handling / treatment facilities are not required.
6.4.10 Comprehensive bench-scale and pilot-scale tests had been carried out for the in-situ bioremediation techniques on KTAC sediments. Based on the testing and monitoring data, in-situ bioremediation technique is considered to be successful in tackling odour problem for KTAC and KTTS.
In-situ Cement Solidification / Stabilization (S/S) General Description
6.4.11 The technique is similar to deep cement mixing where sediments are blended in-situ with Portland cement-based additive slurry and underwent chemical fixation and stabilization process (see Section 6.2 above).
Programme
6.4.12 Based on the Review of Sediment Treatment Technologies Situation Report on Review of Sediment Treatment Methods to Tackle Odour at KTAC, (City Planning – Maunsell JV, 2006) under the Stage 1 Planning Review, one set of treatment with two injections, is expected to take approximately 2 to 3 years.
6.4.13 Based on the on the Review of Sediment Treatment Technologies under the KTAC Design and Construction (Arup-Scott Wilson JV, 2003), the total cost for treatment is considered moderate to high, with cost as high as a few hundred US dollars per cubic metre of contaminated sediments. The cost for the technique on KTAC remediation was estimated to be HK$1,000 million (City Planning – Maunsell JV, August 2006).

Agreement No. CE 35/2006(CE) Kai Tak Development Engineering Study cum Design and Construction of Advance Works Annex A – Investigation, Design and Construction KTAC and KTTS Studies
6-9
Treatment Effectiveness and Limitations
6.4.14 The technique is used primarily to treat inorganic contaminants. Its effectiveness against SVOCs and pesticides is limited and VOCs are generally not immobilized and can escape during mixing. The low treatment effectiveness is possibly due to the unstable and degrading nature of the organic contaminants. Although, binding agents that are effective against organic contaminants are being developed and tested, there is no proven record of using this method for mitigation of odour from sediments. The presence of high organic matter and complexity of contamination in KTAC sediment would make it difficult to formulate an effective binder to suppress odour problem.
6.4.15 Furthermore, there is no guarantee that complete mixing of cement and sediment can be achieved due to the unavoidable gaps between drilling/grouting locations and varying sediments properties across KTAC and KTTS. There is therefore uncertainty in achieving the required odour removal in KTAC by applying this treatment method. In addition, it is anticipated that a relatively high level of residual odour would be resulted from this treatment method because the channel bed after solidification would be hardened and this would hinder the subsequent de-silting or treatment of the recurrent sediment deposition arising from the continuous polluted flows from upstream.
Environmental Impacts
6.4.16 Similar to in-situ bioremediation, the in-situ cement S/S is likely to cause far less environmental impacts than ex-situ options as there would be low disturbance to the seabed due to dredging.
6.4.17 One of the major environmental impacts associated with the in-situ cement S/S is that by hardening the channel floor to concrete like material, the original seabed would be destroyed and would pose temporary impacts to the local marine ecology. In addition, the initiation of the mixing of cement / sediment would result in the release of sediment porewater, which are heavily contaminated. The resulting material may not be suitable for aquatic organisms due to the high pH.
Implementation, Recognition and Uncertainty of the Method
6.4.18 The full scale applications as deep cement mixing had been applied mainly for structural construction, but were not targeted for odour treatment. There is no quantitative data available to support in-situ cement S/S could effectively remove odour although odour removal was observed after bench-scale mixing with cement. In addition, there is little information available on the behaviour of organic contaminants after treatment. Further studies, including pilot tests would need to be carried out to assess the treatability and the environmental impact during treatment.
6.4.19 Although the injection process is carried out on barge, land facilities for storage and handling large quantities of reagents would be required.
In-situ Capping
6.4.20 The technique involves covering contaminated sediments by stable layers of sand, sediment, gravel, rock, and/or synthetic materials under the capping operation. The cap reduces contaminants mobility and subsequent interaction between aquatic organisms and the contaminants (see Section 6.2 above).

Agreement No. CE 35/2006(CE) Kai Tak Development Engineering Study Annex A cum Design and Construction of Advance Works KTAC and KTTS Studies – Investigation, Design and Construction
6-10
Programme
6.4.21 Based on the Review of Sediment Treatment Technologies Situation Report on Review of Sediment Treatment Methods to Tackle Odour at KTAC, (City Planning – Maunsell JV, 2006) under the Stage 1 Planning Review, the time for cap construction is 3 to 5 years for cap construction. Based on the same report, the cost for in-situ capping is estimated to be HK$400 million.
Treatment Effectiveness and Limitations
6.4.22 Although the cap could isolate the contaminants from interacting with the environment, for the case of KTAC and KTTS, there would be a number of geotechnical and hydrologic considerations, which pose a certain degree of uncertainty on the performance of this treatment method. In order to achieve the high odour removal efficiency in the heavily contaminated KTAC, the synthetic membrane for in-situ capping must be both air and water tight over the whole 28 hectare KTAC. As there is no proven record of fabricating such a large membrane, the practicality of constructing such membrane on site is therefore uncertain. In addition, relatively high level of residual odour is anticipated as the integrity of the underlying membrane would hinder the de-silting or treatment of the recurrent sediment deposition arising from potential continuous polluted flows from the upstream. The re-capping of the seabed to tackle the residual odour is considered not feasible as it would significantly reduce the water depth within the already shallow KTAC.
6.4.23 Another major limitation for the in-situ capping technique is the possibility of cap disturbance due to marine traffic movements, in particular in the shallower water depth of KTAC. The disturbance of the cap could result in the exposure and dispersion of the contaminants, which may lead to odour re-generation. This limitation would also pose difficulties to vessels for future cap / channel maintenances.
6.4.24 Furthermore, there are a number of geotechnical considerations such as cap stability, settlement due to consolidation and cap thickness. The soft surface sediments at KTAC are not suitable for effective use of a cap. The cap design would need to overcome a number of technical issues including sufficient cap thickness to offer chemical isolation, intrusion due to bioturbation and protected from breach as the result of erosion.
Environmental Impacts
6.4.25 Similar to in-situ bioremediation, the in-situ capping is likely to cause far less environmental impacts than ex-situ options as there would be low disturbance to the seabed due to dredging. Another environmental benefit of capping is that it has the ability to rebuild a clean sediment layer for re-colonization of benthic organisms.
6.4.26 However, the shallower depth as a result of thicker seabed would influence the hydrodynamics of KTAC and KTTS, leading to more restricted flows and may alter the flushing and sediment-carrying capacity of the channel.
Implementation, Recognition and Uncertainty of the Method
6.4.27 Full scale applications of in-situ capping had been conducted in the USA, Netherlands, Japan, Norway, Sweden and Germany. However, as discussed above, there is uncertainty as to whether a 28 hectare air and water tight membrane could be constructed to suppress odour. In addition, there is little information available on the behaviour of organic contaminants after treatment. Indeed, gas generation, as a result of organic degradation within cap, could either generate significant uplift forces and threaten the physical stability of the overlying capping material, or carry some contaminants through the cap (USEPA, 2005). Further studies, including pilot tests would need to be carried out to support the feasibility of this treatment option and to provide information for detailed cap design.

Agreement No. CE 35/2006(CE) Kai Tak Development Engineering Study cum Design and Construction of Advance Works Annex A – Investigation, Design and Construction KTAC and KTTS Studies
6-11
Discussion on Treatments
6.4.28 An evaluation of the in-situ sediment treatment methods, viz. in-situ bioremediation, in-situ cement S/S and in-situ capping had been carried out in this section of the report. Findings of the evaluation, including cost, programme, treatment effectiveness and limitations, possible environmental impacts, implementation and uncertainties of the treatment methods were summarised in Table 6.2 below.
6.4.29 Based on the evaluation, the key factor that distinguishes the three in-situ technologies is
the limitation and uncertainties in applying the treatments to KTAC and KTTS. Although all of the three options had been applied to local or overseas contaminated sediment sites, there are high degree of uncertainties in applying in-situ cement S/S and in-situ capping to odour removal at KTAC and KTTS. This is due, partially, to the lack of information available for the two techniques to suppress odour generation (let alone the highly contaminated sediments at KTAC) and the difficulties in de-silting / treatment of the recurrent of sediment deposition from upstream continuous pollution sources. For in-situ cement S/S, there are also uncertainties in whether complete mixing could be achieved to suppress odour. The technical difficulties of ‘cold joint’ would be one of the deficiencies for in-situ cement S/S (Hong Kong Polytechnic University, 2005). Cold joints occur as a result of lower strength at the overlapped section of the newly installed cement columns. The overlap sections are essential to prevent unavoidable gaps between the cylindrical columns.
6.4.30 For in-situ capping, there are restrictions in applying the techniques to shallow water depths, in particular at KTAC. The shallower water columns would cause difficulties in re-applying in-situ capping in the treated area and might increase the risk of cap disturbance as a result of marine traffic and cap maintenance in the long term. Cap disturbance would potentially allow the release of malodorous chemicals and organic contaminants into the surrounding environment. In addition, in order to achieve odour removal, the membrane of the in-situ cap must be both air and water tight. The soft sediments also present a major technical challenge for cap placement. There are high uncertainties in whether this could be achieved given the relatively large area of the treatment site.
6.4.31 On the other hand, for in-situ bioremediation, successful applications had been recorded in Hong Kong (i.e. Shing Mun River and Sam Ka Tsuen Typhoon Shelter) as well as the pilot scale field test carried out under the Stage 1 Planning Review. Based on the pilot scale field test (City Planning – Maunsell JV, October 2007), a maximum reduction of over 99.9% of AVS from pre- to post-treatments had been recorded. AVS is considered to be the key indicator for odour emissions in sediments. Furthermore, notable decreases in TOC, PAHs, PCBs and toxicity as well as increases in the reduction and oxidation potential (indication of the anoxic / aerobic and anaerobic conditions within the sediments) were also observed in the post-treatment results of the pilot scale field test. However, issues such as repeated treatments to continue suppress odour and potential release of nitrate-nitrogen would need to be considered if full-scale operations were to be carried out.
6.4.32 In respect to the environmental impacts, it is anticipated that the three techniques would cause lower environmental impacts to the surrounding water bodies and future landuses than ex-situ treatments, in which dredging are required. All three techniques would pose some environmental impacts (in-situ bioremediation – release of nitrate-nitrogen; in-situ cement S/S – release of contaminated sediment porewater during initiation of mixing and temporary impacts to local marine ecology due to hardened channel floor; and in-situ capping – permanently influence the local hydrodynamic conditions) which would need to be dealt with if full-scale operations were to be carried out. For in-situ bioremediation, the release of nitrate-nitrogen is considered to cause minimal environmental impacts if proper mitigation measures were to be implemented. In addition, the injection activity is considered to be mild and gentle enough as to minimize sediment disturbance and generation of sediment plumes. The mild and gentle treatment should prevent any significant volatizing odorous substances into the air and re-suspension and diffusion of contaminants into the surrounding water bodies.

Agreement No. CE 35/2006(CE) Kai Tak Development Engineering Study Annex A cum Design and Construction of Advance Works KTAC and KTTS Studies – Investigation, Design and Construction
6-12
6.4.33 Based on the above, in-situ bioremediation outweighs the other two options and is considered to be an appropriate technology for sediment remediation at KTAC and KTTS. Furthermore, given the limitations of in-situ cement S/S and in-situ capping, it is considered not appropriate to tackle the odour problem in KTAC / KTTS with a combination of these techniques with in-situ bioremediation. In addition, as in-situ option was considered to appropriate for full-scale application, further evaluation on ex-situ and combination of ex-situ / in-situ methods in a full-scale setting was considered not necessary. A detailed discussion on the findings of the in-situ bioremediation pilot scale field test under the Stage 1 Planning Review is presented in Section 6.5.

Agre
em
ent
No.
CE
35/2
006(C
E)
Kai T
ak D
eve
lopm
ent
Engin
eeri
ng S
tud
y cum
Desig
n a
nd C
onstr
uctio
n o
f A
dva
nce W
ork
s A
nne
x A
– I
nve
stigation,
Desig
n a
nd C
on
str
uct
ion
KT
AC
an
d K
TT
S S
tudie
s
6-1
3
Tab
le 6
.2
Co
mp
ari
so
n o
f In
-sit
u S
ed
imen
t T
reatm
en
t M
eth
od
s
Tre
atm
en
t O
pti
on
C
os
t (H
K$
)1
P
rog
ram
me
1
Tre
atm
en
t E
ffe
cti
ve
nes
s a
nd
L
imit
ati
on
s
En
vir
on
me
nta
l Im
pa
cts
Im
ple
me
nta
tio
n
Un
ce
rta
inty
In-s
itu
B
iore
me
dia
tion
$
15
0 m
illio
n
(Lo
we
st)
2
to
3 y
ea
rs
- H
igh
rem
ova
l of
AV
S.
- R
em
ova
l of
org
an
ic c
on
tam
inan
ts
likely
to
be
slo
w.
- R
ep
ea
ted
tre
atm
en
ts a
re r
eq
uire
d
for
con
tinu
ous o
do
ur
su
pp
ress
ion
.
- B
ase
d o
n th
e fin
din
gs o
f th
e P
ilot
Sca
le F
ield
Te
st2
, n
o m
ajo
r e
nvi
ronm
enta
l im
pacts
we
re e
nvi
sag
ed.
- P
ote
ntia
l re
lease
of
nitra
te-
nitro
ge
n to
th
e s
urr
ou
nd
ing
wa
ter
bo
die
s d
urin
g
inje
ctio
n s
ho
uld
be
a
dd
ressed
with
app
rop
ria
te
mitig
atio
n m
easu
res.
- F
ull
sca
le
tre
atm
en
ts h
ad
b
ee
n a
pp
lied in
H
on
g K
ong
, vi
z.
Sh
ing
Mu
n R
ive
r a
nd
Sam
Ka
Tsue
n
Typ
ho
on
Sh
elte
r.
- P
ilot
Sca
le F
ield
T
est
ha
d b
ee
n
ca
rrie
d o
ut
at
KT
AC
.
- In
jection
dep
th a
nd
tim
e r
eq
uir
ed
fo
r re
-a
pp
lica
tion.
- L
on
g-t
erm
e
ffe
ctiv
en
ess a
nd
n
ee
d fo
r re
ap
plic
ation
s.
- P
ote
ntia
l diffic
ultie
s
with
ap
plic
atio
n a
t g
rea
ter
wa
ter
de
pth
s.
In-s
itu
Cem
en
t S
tab
iliza
tion
and
S
olid
ific
atio
n
$1
,000
m
illio
n
(Hig
hest)
2 t
o 3
yea
rs
- E
ffe
ctiv
e a
gain
st h
ea
vy m
eta
ls
bu
t u
nce
rta
in o
n o
rga
nic
s a
nd
o
do
ur
rem
ova
l.
- N
o g
ua
ran
tee o
n c
om
ple
te m
ixin
g
of
cem
ent
and
se
dim
en
ts (
an
is
sue
fo
r e
ffe
ctiv
e t
rea
tmen
t).
- A
ntici
pa
ted
hig
h le
vel o
f re
sid
ua
l o
do
ur
du
e to
ha
rde
ne
d c
ha
nne
l b
ed
wh
ich
wo
uld
hin
de
r th
e
su
bse
que
nt d
e-s
iltin
g o
r tr
ea
tme
nt o
f th
e r
ecu
rren
t se
dim
ent
dep
osi
tion
arisin
g f
rom
th
e c
on
tinu
ou
s p
ollu
ted
flo
ws
fro
m u
pstr
ea
m.
- M
ay
imp
act
fu
ture
activi
ties
in th
e
ch
ann
el s
uch
as n
avi
ga
tion
al
dre
dg
ing
.
- S
we
llin
g o
f cem
en
t m
ixtu
re m
ay
de
cre
ase w
ate
r d
ep
th a
nd
lead
to
re
str
icte
d f
low
s a
nd
ch
ang
es
in
flu
shin
g a
nd s
ed
ime
nt-
ca
rryi
ng
ca
paciti
es.
- In
itia
tion
of m
ixin
g m
igh
t re
su
lt in
th
e r
ele
ase o
f co
nta
min
ate
d s
ed
ime
nt
po
rew
ate
r.
- T
em
po
rary
im
pa
cts to
local
ma
rine
eco
log
y d
ue t
o
ha
rde
nin
g o
f ch
ann
el f
loo
r to
con
cre
te-lik
e m
ate
rial.
- S
we
llin
g o
r in
cre
ase
d
volu
me
ma
y b
e 2
0 to
30%
. T
he
re
su
ltin
g d
ecre
ase
in
wa
ter
de
pth
s a
nd
ch
an
ne
l cro
ss-s
ectio
n m
ay
resu
lt in
h
igh
er
wa
ter
flo
w r
ate
s a
nd
scou
r a
rea
s.
- F
ull
sca
le
ap
plic
atio
ns a
s d
ee
p
ce
me
nt m
ixin
g h
ad
be
en
ap
plie
d m
ain
ly
for
str
uctu
ral
co
nstr
uction
, b
ut
not
for
od
ou
r tr
ea
tme
nt.
- W
hile
in
-situ
S/S
h
as b
eco
me
co
mm
on f
or
so
il, its
a
pp
lica
tion in
su
baq
ue
ou
s
co
nditio
ns fo
r se
dim
ent
trea
tme
nt
is li
mite
d.
- N
o q
ua
ntita
tive
data
to
sup
po
rt in
-situ
ce
me
nt
S/S
cou
ld
eff
ect
ive
ly r
em
ove
o
do
ur.

A
gre
em
ent
No.
CE
35/2
006(C
E)
K
ai T
ak D
eve
lopm
ent
Engin
eeri
ng S
tud
y A
nne
x A
cum
Desig
n a
nd C
onstr
uctio
n o
f A
dva
nce W
ork
s
KT
AC
an
d K
TT
S S
tudie
s
– I
nve
stigation,
Desig
n a
nd C
on
str
uct
ion
6-1
4
Tre
atm
en
t O
pti
on
C
os
t (H
K$
)1
P
rog
ram
me
1
Tre
atm
en
t E
ffe
cti
ve
nes
s a
nd
L
imit
ati
on
s
En
vir
on
me
nta
l Im
pa
cts
Im
ple
me
nta
tio
n
Un
ce
rta
inty
In-s
itu
Ca
pp
ing
$4
00
mill
ion
(L
ow
) 3
to
5 y
ea
rs
- D
ifficu
ltie
s in
achie
vin
g a
n a
ir a
nd
w
ate
r tig
ht m
em
bra
ne
ove
r th
e
en
tire
tre
atm
en
t si
te.
- A
ntici
pa
ted
hig
h le
vel o
f re
sid
ua
l o
do
ur
du
e to
ha
rde
ne
d c
ha
nne
l b
ed
wh
ich
wo
uld
hin
de
r th
e
su
bse
que
nt d
e-s
iltin
g o
r tr
ea
tme
nt o
f th
e r
ecu
rren
t se
dim
ent
dep
osi
tion
arisin
g f
rom
th
e c
on
tinu
ou
s p
ollu
ted
flo
ws
fro
m u
pstr
ea
m.
- R
e-t
rea
tme
nt is
con
sid
ere
d n
ot
fea
sib
le d
ue t
o s
hallo
w w
ate
r d
ep
ths.
- P
ote
ntia
l ca
p d
istu
rba
nce
due
to
m
ari
ne
tra
ffic
/ c
ap
ma
inte
na
nce
in
the
fu
ture
at sha
llow
wa
ter
are
as.
- A
bili
ty to
re
-bu
ild a
cle
an
se
dim
ent
laye
r fo
r re
-co
lon
iza
tion
of b
enth
ic
org
an
ism
s.
- In
flue
nce
on
th
e
hyd
rod
yna
mic
co
nd
itio
ns
of
KT
AC
an
d K
TT
S,
lea
din
g
to r
est
rict
ed
flo
ws a
nd
ch
ang
es
in flu
sh
ing
an
d
se
dim
ent-
ca
rryi
ng
ca
paciti
es.
- F
ull
sca
le
op
era
tions h
ave
b
ee
n c
ond
uct
ed
in
the
US
A,
Ne
the
rlan
ds,
Jap
an
, N
orw
ay,
Sw
ed
en
a
nd
Ge
rma
ny.
- L
ittle
ava
ilab
le
info
rma
tion
on
odo
ur
rem
ova
l usi
ng
in
-situ
ca
ppin
g. T
he
sig
nific
an
t g
en
era
tion
of
me
tha
ne
/ h
ydro
ge
n
su
lph
ide
gas w
ith
in
the
ca
p w
ou
ld b
e t
he
m
ajo
r e
ngin
ee
ring
is
sue
s to
be
co
nsid
ere
d.
- F
urt
he
r stu
die
s,
inclu
din
g p
ilot te
sts
, w
ou
ld n
ee
d to
be
ca
rrie
d o
ut
to
su
ppo
rt t
he
fea
sib
ility
o
f th
is t
rea
tme
nt
op
tion
and
to
pro
vid
e
info
rma
tion
fo
r d
eta
iled
ca
p d
esig
n.
1 F
igure
s ext
racte
d f
rom
the S
ituatio
n R
eport
on R
evi
ew
of
Sedim
ent T
reatm
ent
Meth
ods
to T
ackle
Odour
at K
TA
C (
August
2006)
2.
Based o
n t
he P
ilot S
cale
Fie
ld T
est conducte
d u
nder
the S
tage 1
Pla
nnin
g R
evi
ew
(C
ity
Pla
nnin
g –
Maunsell
JV, O
cto
ber
2007)
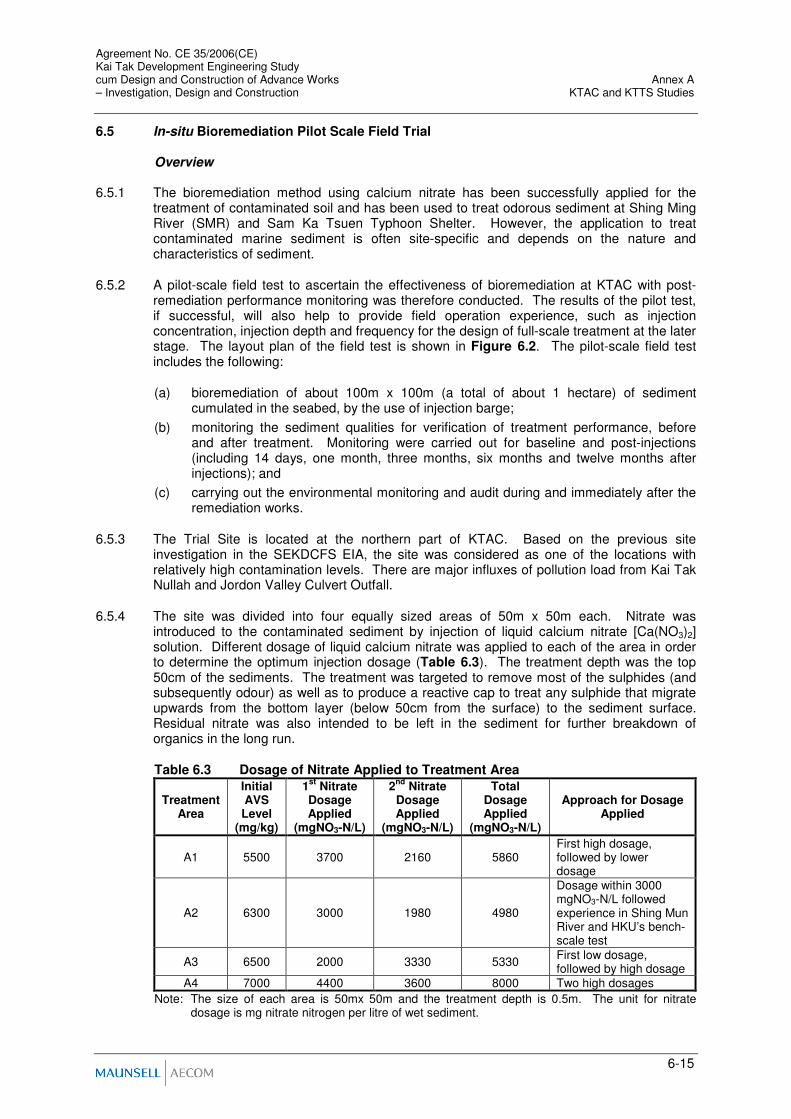
Agreement No. CE 35/2006(CE) Kai Tak Development Engineering Study cum Design and Construction of Advance Works Annex A – Investigation, Design and Construction KTAC and KTTS Studies
6-15
6.5 In-situ Bioremediation Pilot Scale Field Trial
Overview
6.5.1 The bioremediation method using calcium nitrate has been successfully applied for the treatment of contaminated soil and has been used to treat odorous sediment at Shing Ming River (SMR) and Sam Ka Tsuen Typhoon Shelter. However, the application to treat contaminated marine sediment is often site-specific and depends on the nature and characteristics of sediment.
6.5.2 A pilot-scale field test to ascertain the effectiveness of bioremediation at KTAC with post-remediation performance monitoring was therefore conducted. The results of the pilot test, if successful, will also help to provide field operation experience, such as injection concentration, injection depth and frequency for the design of full-scale treatment at the later stage. The layout plan of the field test is shown in Figure 6.2. The pilot-scale field test includes the following:
(a) bioremediation of about 100m x 100m (a total of about 1 hectare) of sediment cumulated in the seabed, by the use of injection barge;
(b) monitoring the sediment qualities for verification of treatment performance, before and after treatment. Monitoring were carried out for baseline and post-injections (including 14 days, one month, three months, six months and twelve months after injections); and
(c) carrying out the environmental monitoring and audit during and immediately after the remediation works.
6.5.3 The Trial Site is located at the northern part of KTAC. Based on the previous site investigation in the SEKDCFS EIA, the site was considered as one of the locations with relatively high contamination levels. There are major influxes of pollution load from Kai Tak Nullah and Jordon Valley Culvert Outfall.
6.5.4 The site was divided into four equally sized areas of 50m x 50m each. Nitrate was introduced to the contaminated sediment by injection of liquid calcium nitrate [Ca(NO3)2] solution. Different dosage of liquid calcium nitrate was applied to each of the area in order to determine the optimum injection dosage (Table 6.3). The treatment depth was the top 50cm of the sediments. The treatment was targeted to remove most of the sulphides (and subsequently odour) as well as to produce a reactive cap to treat any sulphide that migrate upwards from the bottom layer (below 50cm from the surface) to the sediment surface. Residual nitrate was also intended to be left in the sediment for further breakdown of organics in the long run.
Table 6.3 Dosage of Nitrate Applied to Treatment Area
Treatment Area
Initial AVS Level
(mg/kg)
1st
Nitrate Dosage Applied
(mgNO3-N/L)
2nd
Nitrate Dosage Applied
(mgNO3-N/L)
Total Dosage Applied
(mgNO3-N/L)
Approach for Dosage Applied
A1 5500 3700 2160 5860 First high dosage, followed by lower dosage
A2 6300 3000 1980 4980
Dosage within 3000 mgNO3-N/L followed experience in Shing Mun River and HKU’s bench-scale test
A3 6500 2000 3330 5330 First low dosage, followed by high dosage
A4 7000 4400 3600 8000 Two high dosages
Note: The size of each area is 50mx 50m and the treatment depth is 0.5m. The unit for nitrate dosage is mg nitrate nitrogen per litre of wet sediment.

Agreement No. CE 35/2006(CE) Kai Tak Development Engineering Study Annex A cum Design and Construction of Advance Works KTAC and KTTS Studies – Investigation, Design and Construction
6-16
6.5.5 In addition to the original pilot-scale field test, a bench-scale test was also conducted in August 2006 to study on the effects of micro-organisms on nitrate utilization in KTAC. The bench-scale test was carried out to demonstrate that the bioremediation technique for odour removal is biochemical in nature, rather than a simple chemical reaction and to observe other findings during the test which may facilitate better understanding of the bioremediation technology. The bench-scale test was conducted over a period of 21 days, from 9 to 30 June 2006.
Work Schedule
6.5.6 The work schedule for the pilot scale field test is presented in Table 6.4 below. The pilot scale field test was completed on 27 March 2007, after the post-injection (twelve months) sediment quality monitoring.
Table 6.4 Work Schedule of Bioremediation Pilot Scale Field Test Completion Date Event
Treatment Area A1 & A2
Treatment Area A3 & A4
Baseline Sediment Quality Monitoring 22 Sep 05 22 Sep 05 Baseline Water Quality Monitoring 27 Sep 05 -
1 Oct 05 27 Sep 05 -
1 Oct 05 First Injection 20 Feb 06 -
22 Feb 06 22 Feb 06 - 25 Feb 06
Work Phase EM&A 21 Feb 06 - 27 Mar 06 Post-Injection (14 days) Sediment Quality Monitoring (except denitrification parameters)
8 Mar 06 11 Mar 06
Post-Injection (14 days) Sediment Quality Monitoring (denitrification parameters)
9 Mar 06 9 Mar 06
Second Injection 22 Mar 06 - 24 Mar 06
24 Mar 06 - 27 Mar 06
Post-work Phase EM&A 27 Mar 06 - 26 Apr 06 Post-Injection (14 days) Sediment Quality Monitoring (all except denitrification parameters)
8 Apr 06 10 Apr 06
Post-Injection (14 days) Sediment Quality Monitoring (denitrification parameters)
10 Apr 06 10 Apr 06
Post-Injection (one month) Sediment Quality Monitoring (all parameters including denitrification)
22 Apr 06 26 Apr 06
Post- Injection (three months) Sediment Quality Monitoring (all parameters including denitrification)
27 Jun 06 27 Jun 06
Additional Sediment Quality Monitoring (Nitrate and TOC parameters) to verify Post-Injection (three months) results
9 Aug 06 9 Aug 06
Post- Injection (six months) Sediment Quality Monitoring (all parameters including denitrification)
25 Sept 06 25 Sept 06
Post- Injection (twelve months) Sediment Quality Monitoring (all parameters including denitrification)
27 Mar 07 27 Mar 07
Testing Parameters for Sediment Quality Monitoring
6.5.7 Sediment samples were collected at each of the four areas for chemical and biological characterisation to provide data to determine the effectiveness of the sediment treatment. The parameters tested on the collected sediment samples include redox potential, pH, acid volatile sulphides (AVS), total organic (TOC), residual nitrate, Microtox® and denitrification parameters.
6.5.8 Details of chemical and biological testing requirements and the appropriate matrix (sediment or porewater), and the analytical protocol for the tests are shown in the Final Report on Bioremediation Pilot Scale Field Test.

Agreement No. CE 35/2006(CE) Kai Tak Development Engineering Study cum Design and Construction of Advance Works Annex A – Investigation, Design and Construction KTAC and KTTS Studies
6-17
Performance Criteria
6.5.9 The following parameters in terms of sediment quality are developed as the performance criteria for the pilot test. The performance criteria make reference to Shing Mun River’s and Sam Ka Tsuen Typhoon Shelter’s application experience:
Performance Parameters for Sediment Acceptance Criteria
AVS Min. 95% removal
Redox ≥ -100 mV after treatment pH 6 – 8 after treatment
Residual Nitrate 25% of total dosed
Findings and Recommendation
6.5.10 This section discusses the findings of the Pilot Scale Field Test results. Full details of the results are presented in the Final Report on Bioremediation Pilot Scale Field Test (City Planning – Maunsell JV, October 2007).
Post-Treatment Monitoring
Treatment Performance
6.5.11 Based on the data obtained in the post-treatment monitoring, bioremediation as the treatment options for KTAC is considered successful in suppressing odour. The AVS reduction, which is an indication of odorous substance removal, showed a maximum reduction rate of up to 99.9% for all treatment areas and in the post-6-month monitoring, no AVS were detected in the collected samples. Despite the apparent revival of AVS at Areas A3 and A4, where nitrate has been exhausted, the recorded AVS concentration remained low (<2,000 mg/kg dry. wt.) and were far lower than the pre-treatment values. It is expected that it would take some time before sufficient AVS is presented in the sediments to cause odour nuisance problem. The reduction and oxidation potential had also increased considerably compared to pre-treatment monitoring results. The absolute increases from pre-treatment to post-12-month monitoring at areas A1, A2, A3 and A4 were 338 mV, 165 mV, 178mV and 195mV respectively, averaging 219 mV. A higher reduction and oxidation potential value would favour anoxic / aerobic conditions over the H2S generating (anaerobic) conditions within the sediment. Based on the post-monitoring results, it was clearly shown that the depletion of nitrate (in the case of areas A3 and A4) would cause the decrease of the reduction and oxidation potential and an increase in AVS levels. As long as residual nitrates are presence in the sediment (as shown in areas A1 and A2), low AVS levels and subsequently the ability to suppress odour would be maintained.
6.5.12 In terms of TOC, no general trends were observed in the post-3 and 6-monitoring results. However, some indications of TOC reductions at all of the treated areas were observed in the post-12-month monitoring. The percentage TOC reductions in comparison to pre-treatment results were 34%, 35%, 26% and 52% at Area A1, A2, A3 and A4 respectively, averaging 38%. The reductions might indicate the commencement of organics degradation in the sediments. It should be noted however that results of the TOC could vary due to (1) the low reproducibility as result of using small amount of sediment sample in the TOC Analyzer and (2) high degree of heterogeneity of the sediment samples.
6.5.13 Over the post-monitoring period, near constant pH levels were recorded which indicated that no adverse impacts are anticipated as a result of pH variations.
6.5.14 Evidence of PAHs and PCBs reductions were observed in the post-monitoring period. Greatest reductions, from pre-treatment to post-12-month monitoring, were recorded at areas A1 and A2 with percentage reduction of over 80% for PCBs and over 30% and 70% for HMW and LMW PAHs respectively. Some toxicity reductions, in particular in sediment bioassays, were also observed.

Agreement No. CE 35/2006(CE) Kai Tak Development Engineering Study Annex A cum Design and Construction of Advance Works KTAC and KTTS Studies – Investigation, Design and Construction
6-18
6.5.15 The facilitation of the biological process to utilize nitrate for odour removal was well demonstrated in the bench-scale testing. This is further supported by the more effective denitrification process in the post-treatment monitoring with increase in the denitrifier population and denitrification rates (comparing to pre-treatments) in almost all of the post-treatment results.
Injection Dosages
6.5.16 Although the bioremediation technology to treat odour problem in KTAC is considered a success, revival in AVS levels and decrease in redox potential, from post-6 to post-12-month monitoring, were recorded at areas A3 and A4. This observation is likely due to the corresponding nitrate depletion in the sediments at the two areas, resulting in a more reducing sediment conditions. It should be noted that nitrate depletion was partly attributed to the fact that out of the one metre depth of sediment to be treated, only half a metre had been treated. On the other hand, as shown in the post-12-month monitoring, relatively high AVS removal and redox potential were maintained at areas A1 and A2.
6.5.17 In regard to area A4, the total dosage applied was highest amongst the 4 treated area (8,400 mg NO3-N/L, in comparison to area A1: 5,860 mg NO3-N/L; A2: 4,980 mg NO3-N/L and A3: 5,330 mg NO3-N/L) but the treatment efficiency and residual nitrate, by the post-12-month monitoring, were considerably lower than areas A1 and A2. Based on the monitoring results, it is possible that high nitrate concentration might adversely affect the denitrification efficiency. This might be explained by the observation noted in the bench-scale study conducted by the University of Hong Kong in 2005. In the study, treated sediment samples were found to have nitrate accumulation near the end of the 42-day test. Since nitrite is in general toxic to many microorganisms, it is likely that high dosage of nitrate would increase the nitrate concentration in the sediment to the levels which are toxic to the denitrifying bacteria. However, further laboratory studies would need to be carried out to justify this observation.
6.5.18 One possible explanation for the low treatment efficiency at area A3 is the application of a low dosage (2,000 mg NO3-N/L) in the first injection. The results in the post-1
st injection
monitoring indicated that the AVS removal at area A3 were only 54%, which was comparatively lower than the removal rates of 69% at area A1 and 83% at area A2. Moreover, the residual nitrate in area A3 after the 1
st injection was 77 mg NO3-N/L, which
was 11 times lower than area A1 and over 3 times lower than area A2. The low treatment efficiency at area A3 is possibly due to the insufficient treatment dosage in the initial injection which may well have hindered the treatment performance in the subsequent high dose injection.
6.5.19 Relatively good treatment performances, with high AVS removal, redox potential and residual nitrate, were observed at areas A1 and A2. Based on the post-treatment results, there is no clear indication as to which of the two set of dosages would be more suitable for KTAC. However, some signs of AVS revival were noted at area A1 in the post-12-month monitoring results which raised the concern of the long term effect or longevity of the treatment at area A1. In addition, as discussed earlier, it was observed that immediate after treatments, the treatment efficiency at area A1, when compared with the other 3 areas, was relatively low. The lower treatment efficiency could possibly be explained by the high dosage in the 1
st injection.
6.5.20 Based on the above, it was concluded that the dosages applied to area A2 (1st injection:
3,000 mg NO3-N/L; 2nd
injection: 1,980 mg NO3-N/L) would be most appropriate of the four sets of injection arrangements for suppression odour in KTAC.

Agreement No. CE 35/2006(CE) Kai Tak Development Engineering Study cum Design and Construction of Advance Works Annex A – Investigation, Design and Construction KTAC and KTTS Studies
6-19
Summary of Key Findings and Way Forward
6.5.21 Based on the results collected from the pilot test, the following findings could be drawn:
Treatment Aspect
6.5.22 Nitrate treatment is effective to suppress odour. The full scale treatment is recommended to be carried out. Treatment should preferably be conducted during the dry season periods to avoid possible complication due to the sediment washout by rainstorms.
6.5.23 As demonstrated by the results of a bench-scale test, the nitrate treatment is found to be a bio-chemical process relying on the action of micro-organisms.
6.5.24 The treatment results seem to be affected by the arrangement of injection. It is observed that a moderate injection dose followed by a lower dosage as demonstrated in area A2 give better treatment results. When high dosage of nitrate (i.e. higher than 3000 mg/L NO3-N) was applied (for example at area A4 and 1
st injection of area A1), retardation of treatment
efficiency was observed. In area A3, where an initial low dose followed by a moderate dosage was applied, low residual nitrate and revival of AVS was observed in the post-12-month monitoring.
6.5.25 Based on the current equipment and method of injection, the best maximum dosage at one injection would be about 3000 mg/L in the sediment. For the KTAC sediment, it would require at least two injections to cope with the AVS and potential demand from the high TOC content. Due to the high content of AVS and TOC and the limitation of the 3000 mg/L dose, it cannot be precluded that at the most polluted areas of KTAC, three injections might be required.
6.5.26 There have been sediments accumulated in KTN and KTAC and it is likely that mobilization of sediment might occur, particularly during periods of rainstorms. Desilting at KTN, JVO and other culverts should be carried out prior to the full scale bioremediation of KTAC in order to prevent the movement of sediments to KTAC.
6.5.27 Notwithstanding the greater depth of the active polluted sediment, the field test only involved an injection depth of 0.5m. Treatment performs at greater depths should be investigated.
Environmental Impacts and EM&A
6.5.28 It should remain as the main objective of the injection to minimize the possible loss of nitrate to the marine environment. A series of optimization trial for the equipment is recommended right before the full scale injection. EM&A should be implemented during all injection process. Residual impacts to water quality, especially the exceedance of nitrate, are found to be transient. It would therefore be prudent to implement injection at times when there is strong tidal influence, so as to reduce any possible impact.
Bench-Scale Testing to Determine the Effect of Bactericide on Nitrate Utilization in Kai Tak Approach Channel Sediments
Experimental Setup
6.5.29 The experiment was designed and conducted by the CHEC-OWT JV and a report “Bench-Scale Testing to Determine the Effect of Bactericide on Nitrate Utilisation in Kai Tak Approach Channel Sediments” was prepared in August 2006.
6.5.30 Sediment samples were collected from KTAC and incubated in the laboratory of Lam Geotechnics Ltd under various treatment regimes for 21 days. The sediment treatment conditions for the bench-scale testing are tabulated in Table 6.5.

Agreement No. CE 35/2006(CE) Kai Tak Development Engineering Study Annex A cum Design and Construction of Advance Works KTAC and KTTS Studies – Investigation, Design and Construction
6-20
Table 6.5 Different Treatment Conditions Set in the Bench-Scale Testing
Groups Reactor Type Sterilized Nitrate Addition
1 Control Reactor N N 2A Sediment with Bactericide only and Autoclaved Y N 2B Sediment with Bactericide & Nitrate and
Autoclaved Y Y (2,000 mg/L)
3A Sediment with Nitrate N Y (2,000 mg/L) 3B Sediment with Nitrate N Y (4,000 mg/L)
6.5.31 Triplicate sediment samples were taken for the analysis of gas production rate, sediment nitrate concentrations, sediment acid volatile sulphide (AVS) concentrations, denitrifying bacteria population dynamics, redox potential and hydrogen sulphide production. A full description of procedures and test methods are given in the “Bench-Scale Testing to Determine the Effect of Bactericide on Nitrate Utilization in Kai Tak Approach Channel Sediments”.
Major Findings
6.5.32 As shown in the bench-scale testing results, higher gas production rate was observed in Groups 3A and 3B when compared with Groups 2A and 2B. A decreasing trend of sediment nitrate was also observed in Groups 3A and 3B but not in Group 2A, where the sediment was autoclaved. In addition, higher AVS reduction rate was recorded in Groups 3A and 3B and almost complete removal of AVS was reached at the end of the experiment (21 days). The results of higher gas production rate, decreasing trend of sediment nitrate and higher AVS removal rate found in Groups 3A and 3B when compared with Control and other treatments, indicated that nitrate utilization for odour removal was predominately facilitated by a biological process and was not a simple physio-chemical reaction. The presence of micro-organisms was essential for carrying out the treatment processes as demonstrated in this bench-scale testing.
6.6 Odour Removal by Bioremediation 6.6.1 Bioremediation Pilot Scale Field Test had completed the injection treatment in March 2006
and the post-monitoring of sediment quality had been carried for 12 months up to March 2007.
6.6.2 In the Kai Tak Planning Review Stage, special tests were derived to study the odour emission and odour potential of sediment samples collected from the treated and untreated areas. The estimated odour removal efficiency using the results of both tests and thus, the reduction of odour after treatment would be in the range of 80 – 96% (see Tables 6.6 and 6.7 below). The odour potential result gives the lower bound and the emission rate results gives the upper bound, with the 96% more representing the actual site conditions.
Table 6.6 Results of Odour Emission Rate Experiment for Treated and Untreated Sediments
Sample Sample ID Location OC
(ou/m3)
SOER (ou/m
2.h)
Mean (ou/m
2.h)
Reduction (%)
KTAC-5a-1 KTAC 814 5708
KTAC-5a-2 KTAC 954 5795 Untreated
KTAC-5a-3 KTAC 700 5117
5540.00
Cell-a2-1 KTAC 218 288
Cell-a2-2 KTAC 264 197 Treated
Cell-a2-3 KTAC 283 102
195.67
96.47

Agreement No. CE 35/2006(CE) Kai Tak Development Engineering Study cum Design and Construction of Advance Works Annex A – Investigation, Design and Construction KTAC and KTTS Studies
6-21
Table 6.7 Results of Odour Potential Experiment for Treated and Untreated Sediments
Sample Sample ID Location OC
(ou/m3)
OP-3h (ou/kg)
Mean (ou/kg) Reduction
(%)
KTAC-5a-1 KTAC 1507 542.67
KTAC-5a-2 KTAC 1530 636 Untreated
KTAC-5a-3 KTAC 1351 466.67
548.45
Cell-a2-1 KTAC 76 91.79
Cell-a2-2 KTAC 52 105.6 Treated
Cell-a2-3 KTAC 27 133.18
110.19
79.91
6.6.3 In this Engineering Review, a laboratory study was initiated to study the combined effects of
sediment and water column. In the laboratory study, sediments from the treated area within the Pilot Scale Field Test have been collected and setup to compare with other scenarios. The results are summarized in Tables 6.8 to 6.10 below.
Table 6.8 Odour Emissions Comparison Between Areas with and without Bioremediation
Experiment Setup Odour Unit Comparison
Temp Water Depth
KTAC 2 (with
Bioremediation)
KTAC1 (high source
strength)
KTAC3 (medium source
strength)
KTTS (low source
strength)
15°C 0.8m 138 ou/m3
260 ou/m3
(46.9%) 102 ou/m
3
(-35.3%) 164 ou/m
3
(15.9%)
25°C 0.4m 121 ou/m3
269 ou/m3
(55.0%) 484 ou/m
3
(75.0%) 164 ou/m
3
(26.2%)
25°C 0.8m 96 ou/m3
347 ou/m3
(72.3%) 288 ou/m
3
(66.7%) 163 ou/m
3
(41.5%)
25°C 1.2m 70 ou/m3
349 ou/m3
(79.9%) 260 ou/m
3
(73.1%) 153 ou/m
3
(54.2%)
35°C 0.8m 262 ou/m3
16400 ou/m3
(98.4%) 2920 ou/m
3
(91.0%) 1520 ou/m
3
(82.8%) Note: 1. Based on results with the sediment and water being collected in the same location. 2. (%) represent the percentage reduction as compared to KTAC2.
Table 6.9 Hydrogen Sulphide Emission Comparison Between Areas with and
without Bioremediation Experiment Setup Hydrogen Sulphide Emission Comparison
Temp Water Depth
KTAC 2 (with
Bioremediation)
KTAC1 (high source
strength)
KTAC3 (medium source
strength)
KTTS (low source
strength)
35°C 0.8m 1 ppb 2780ppb (>99.9%)
799ppb
(99.9%) 201ppb (99.5%)
Note: 1. Based on results with the sediment and water being collected in the same location. 2. Results from other experiment scenarios show low H2S concentration <5ppb, not meaning to
compare. H2S only generated in significant amount at 35°C. 3. (%) represent the percentage reduction as compared to KTAC2.

Agreement No. CE 35/2006(CE) Kai Tak Development Engineering Study Annex A cum Design and Construction of Advance Works KTAC and KTTS Studies – Investigation, Design and Construction
6-22
Table 6.10 Laboratory Analysis of AVS in Sediment Samples Experiment Setup AVS Content in Sediment Comparison
Temp Water Depth
KTAC 2 (with
Bioremediation)
KTAC1 (high source
strength)
KTAC3 (medium source
strength)
KTTS (low source
strength) All scenarios
All scenarios
< 10mg-S/kg > 2000mg-S/kg
(>99%) > 950mg-S/kg
(>99%) >470mg-S/kg
(>97.9%) Note: 1. Based on results with the sediment and water being collected in the same location. 2. (%) represent the percentage reduction as compared to KTAC2.
6.6.4 Summary of findings for bioremediation treatment and associated studies are:
(i) Bioremediation treatment is effective in the removal of odour generation. The treatment as demonstrated from the pilot scale field test is around minimum of 1 year. The process could be further improved by engaging injection treatment at higher depth of 0.75m such that deeper sediments can be treated at once. Both the odour generation and the longevity of the treatment could be enhanced.
(ii) Previous Planning Review indicated a range of 80% to 96% odour removal efficiency using sediment only odour emission and odour potential tests.
(iii) In the laboratory study, the odour emissions from KTAC 2 (with bioremediation) remained low throughout the tested temperature range and the depth. Suppression of odour was strong from 15°C to 35°C. The effect was even more pronounced at 35°C. It is observed that when odour is strong, the suppression is strong. On the other hand, it means the odour source has been removed to a high degree and becoming not causing odour impact. AVS is an important indicator of the amount of objectionable odour present in sediments. The bioremediated sediment in KTAC was able to achieve a very low level of AVS as compared to the other areas.
(iv) In the laboratory study, there is a clear trend of decreasing odour emission with increased water depth. The maximum depth studied was 1.2m. In reality, the KTAC water depth is by far deeper than 1.2m and could be up to 2-3m and to a maximum of 5-6m near the southern part of KTAC. The estimated odour removal rate was about 80% for 1.2m and it should be greater in field situation with greater water depths.
6.6.5 Taking into account the effectiveness of treatment and the possibility of improvement above, the odour removal efficiency using bioremediation could be in the range of 80% to 95%.
6.7 Treatment for Sediments on/within Seawalls
Existing Seawall
6.7.1 The existing eastern sloping seawall of the former Kai Tak Airport Runway is approximately 2500 m long and comprises two sections, north (1,643 m) and south (857 m). At the interface of the north and south seawall sections, there is a vertical blockwork seawall approximately 60 m long with landing steps.
North Section Seawall
6.7.2 The as-built record drawings for the north section of seawall are included in Appendix 6.1. According to the as-built record plan, the original length of the north section seawall is approx. 1970m. However, following the subsequent reclamation of Kowloon Bay in the north the remaining length of the north section of seawall is approx. 1,643 m. This section of former runway seawall was constructed in 1956.

Agreement No. CE 35/2006(CE) Kai Tak Development Engineering Study cum Design and Construction of Advance Works Annex A – Investigation, Design and Construction KTAC and KTTS Studies
6-23
6.7.3 According to the as-built record sections, the crest level of the north seawall section varies from +4.15 mPD to +4.66 mPD. A berm of approximately 3 m width is located at a level of approximately +1.2 mPD at the east side of the seawall. With mean sea level at +1.24 mPD, the berm will be exposed daily during low-tide. The 1 tonne bermstones are relatively tightly packed with only limited voids which tends to encourage the retention of sediments at the surface of the berm. The gradient of the rock amour slope and rock fill slope above and below the berm are both of 1:1.5. The toe level of the north section seawall is approximately -5.2 mPD with an overall height of seawall of over 9.3m (4.15m+5.2m). The primary armour above the 3 m wide berm of the north section seawall is divided into two types. The northern 300 m has primary armour exceeding 1 tonne while for the remaining 1343 m the primary armour is greater than 2 tonnes. The primary armour below the 3 m wide berm is ‘rock fill category A’ on the as-built section for the whole north section seawall. According to site observation, the nominal size of the rock fill category A is approximately 500 mm.
South Section Seawall
6.7.4 The as-built record drawings for the south seawall are included in Appendix 6.2. According to the as-built plan the crest level of the south section of seawall varies from +4.27 mPD to +5.31 mPD and the length of the southern seawall is approximately 857 m. The gradients of the upper rock armour slope and lower rock fill slope are both 1:1.5 separated by a berm approximately 3m wide at the level of approx. -1.5mPD. The berm will not be exposed even under extreme low-tide. The toe level of the south section seawall is approximately -10 mPD, giving an overall height of seawall of over 14 m. The primary armour above the 3 m wide berm of the south section seawall is ‘rock fill category 5’ and according to the site observation, the size of this rock fill is similar to the 2 tonne armour of the north section seawall. The primary armour below the berm was not exposed during the site inspection and so no size measurements were carried out. This section of former runway seawall was constructed in 1970.
Existing Seawall Condition North Section Seawall
6.7.5 A site inspection was conducted in October 2007 during the low-tide from 10:00 to 14:00hrs. At the time of inspection the tidal level varied from +0.75 mPD to +0.9 mPD and the berm at +1.2 mPD was exposed. A walking inspection was conducted along the berm. Marine growth was only observed on the ‘rock fill category A’ at the edge of the berm. There was no marine growth on the amour of the berm or upper slope. The surface of the discoloured rock armour was hard and could not be removed by scraping of the armour surface.
6.7.6 Several outfalls are located along the north section seawall. The outfalls were observed to be generally clear (ie no debris). The surface condition of the armour close to outfalls on the sloping seawall was similar to those away from the outfalls. The amour on the berm was not slippery except the section under the marine access bridge. Sedimentation was observed over the berms including within the gaps between armour rock within a distance of about 10 to 20m of the outfalls. The typical width of the gaps in armour of the berms varied from 10 cm to 20 cm.
6.7.7 The problem of odour was apparent at the north section of the eastern seawall beyond the marine access bridge and became more noticeable approaching the upstream end of the KTN.

Agreement No. CE 35/2006(CE) Kai Tak Development Engineering Study Annex A cum Design and Construction of Advance Works KTAC and KTTS Studies – Investigation, Design and Construction
6-24
South Section Seawall
6.7.8 The tidal level during the visit was about +0.75 mPD to +0.9 mPD and the berm at -1.5 mPD was not exposed. The armour surface was slippery and marine growth was found on the armour surface within the tidal zone. The surface of the discoloured rock armour was hard and could not be removed by scraping of the armour surface. As expected the exposed portion of the south section of the sloping seawall was found to be free of any apparent sediment.
6.7.9 Several outfalls are located along the south section seawall. The outfalls were observed to be free of debris. The surface condition of the armour close to outfalls on the sloping seawall was similar to those away from the outfalls.
6.7.10 An inspection was also carried out on the section of seawall at the end of the runway outside the KTTS facing the Victoria Harbour which was considered not affected by the nullah sedimentation. It was found that the condition of seawall revetment at the end of the runway was more or less the same as the south section within the KTTS.
6.7.11 An odour problem was not observed along the south section of the eastern seawall.
Sediment North Section Seawall
6.7.12 Sedimentation was observed principally at the upper slope side (inner 1m to 1.5m) of the berm at +1.2 mPD and was also found inside the gaps between armour. The width of gaps between armour varied from 10 cm to 20 cm. The thickness of the sediment was checked by removing the sediment until the armour rock surface of the berm was reached. The sediment thickness varied from 2 cm to 17 cm and the typical thickness was 8 cm. It was found that sediment tended to be thicker at positions close to outfall and it was noted that the sediment closer to the outfall was sandier indicating that the sediment was likely to have at least partly originated at each of the outfalls (discharge). The sandy sediment was brown in colour while the silty sediment was dark brown or black in colour.
6.7.13 Six samples nos. 1 - 6 of the sediment were taken from the north section seawall at interval of approx. 200m. The odour emitted from the sediment on site was not significant and it appeared that the odour may have been generated by fresh deposit brought by tidal water. The photos of the samples and location of samples are attached in Appendix 6.3.
South Section Seawall
6.7.14 The berm of the south section seawall was at approx. -1.5 mPD and was not exposed during low-tide. There was only marine growth on the armour surface and no sediment was observed on the armour or trapped inside the gap of armour. Six sample nos. 7 - 11 of the marine growth were taken from the south section seawall. The photos of the samples and location of samples are attached in Appendix 6.3.
Removal of Sediment and Marine Growth Sediment at North Section Seawall
6.7.15 The sedimentation found on the armour at the berm and inside the gaps between amour was loose and as advised by a local contractor such sedimentation could be removed by high pressure water jet.

Agreement No. CE 35/2006(CE) Kai Tak Development Engineering Study cum Design and Construction of Advance Works Annex A – Investigation, Design and Construction KTAC and KTTS Studies
6-25
Marine Growth along the Seawall
6.7.16 The removal of the marine growth from the armour would be similar to the removal of marine growth for piers and could be carried out by high pressure water jet.
Potential Solutions
6.7.17 The following options to removing the sediment trapped within the sloping seawall have been considered:
1a) High pressure water jet of armour to remove the trapped sediment 1b) High pressure water jet of armour to remove the trapped sediment + Sand /
cement mortar of the surface voids between armour stones to prevent further deposition of sediment
2a) Take-up the existing armour cleaning and reinstatement 2b) Take-up the existing armour cleaning and reinstatement + Sand / cement
mortar of the surface voids between armour stones to prevent further deposition of sediment
3) Reconstruction of existing seawall sloping wall with a lower berm 4) Reconstruction of existing seawall sloping wall to vertical seawall
Option 1a) - High pressure water jet armour
6.7.18 Option 1a) is the least expensive and fastest method to remove the sediment from the rock armour revetment surface and that trapped within the surface voids. The only concern with this option would be ensuring the effective removal of any sediment lying deeper within the revetment (from the underside of the armour). However according to the site inspection, most of the sediment appears to be overlying the amour or trapped within the voids between armour stones at the berm of the north section seawall, which ties in with the as built drawings which indicate the underlying layers are rockfill. It is expected therefore that the sediment could be substantially removed by high pressure water jet.
6.7.19 The other concern is the collection of sediment dislodged by the jetting process. The proposed method would be to enclose a section of seawall and adjacent water within a silt curtain, then to carry out the jetting of the revetment whilst preventing the suspended sediment from being released to the surrounding area of the nullah. Finally the seabed would need to be treated within the silt curtain area before progressing to an adjacent section of seawall.
Option 2a) - Take-up existing armour, cleaning and reinstatement
6.7.20 The take-up of existing armour for cleaning and reinstatement could potentially remove most of the sediment from the revetment. Compared to Option 1a), the advantage of this method is that any sediment trapped within the underlaying of the rock armour can also be removed. However, the removal and restatement of armour would involve either marine or land based lifting plant and a relatively higher cost. Given that the lower slope of the seawall is rockfill the extent of any sediment is expected to be confined to the seawall surface and the lower slope works could therefore be limited to removal of sediment from the surface. This option would also require a silt curtain to contain the sediment with a confined body of water (seabed area) and subsequent seabed treatment in tandem with the seawall works. The area cordoned off by silt curtain would be relatively significant to allow for the operation of the marine plant if used. This option will also require a longer time for construction. The removal of the amour will result in direct exposure of the underlying seawall rock fill material to wave action and therefore needs to be staged, even though the wave exposure within the upper portion of the Kwun Tong nullah is relatively mild.

Agreement No. CE 35/2006(CE) Kai Tak Development Engineering Study Annex A cum Design and Construction of Advance Works KTAC and KTTS Studies – Investigation, Design and Construction
6-26
Option 1b) and 2b) - Sand / cement mortar of the surface voids between armour stones
6.7.21 This option involves filling the surface voids between the rock armour with mortar following a cleaning operation (option 1a) or following a take up, cleaning and reinstatement operation (option 2a) to remove sediment from the voids near the berm level. This would help to prevent the ongoing entrapment of sediment in the seawall subject to daily exposure from tidal fluctuations. Grouting of voids is not considered feasible because the high loss rate of grout to the underlying layers of revetment and adjacent water would make the method cost prohibitive.
6.7.22 Whilst the rock armour is relatively tightly packed the placement of mortar within revetment voids may still require some care to prevent significant losses of mortar near the water line. In addition the mortar placement could only be carried out during low-tide level and the construction schedule would have to be arranged so that the mortar would set before it is washed away by tidal flow. The cement mortar will only be applied on the gaps between the armour on the berm at +1.2 mPD where the sediment was deposited. The sedimentation beyond the berm is not the major concern they are very close to the waterline and much less exposed. It also should be borne in mind that rock armour of revetment is designed to move under design hydraulic loads and this and any settlement will tend to expose the mortar to possible breakup in the long term. This option is likely to be only marginally effective.
Option 3) – Reconstruction of existing seawall sloping wall with a lower berm
6.7.23 The major advantage of reconstruction of the existing sloping seawall to lower the berm is to prevent the future accumulation of sediment in a portion of the seawall subject to daily exposure from tidal fluctuations. According to the site observation, the sedimentation only occurred or was apparent on the berm at +1.2 mPD. Thus, the reconstruction of the sloping seawall to adopt a berm level of -1.0 mPD (similar to the south section of seawall) can be expected to reduce the contribution to odour levels to similar levels as the south section of seawall. The excavation of existing armour and rock fill material would be necessary for the reconstruction of the seawall. This option would be relatively expensive and time consuming scheme to implement. The reconstruction of the seawall revetment could involve marine plant which will increase the complexity of the project.
Option 4) - Reconstruction of existing seawall sloping wall to a vertical seawall
6.7.24 The major advantage of reconstruction of the existing sloping seawall to vertical seawall is to facilitate the future removal of any sediment and to prevent the sediment accumulating in the tidal zone. Thus, the reconstruction of the seawall should include the removal or lowering of the berm below tidal range. The excavation of existing armour and rock fill material would be necessary for the reconstruction of the seawall. This option would be the most expensive and time consuming scheme to implement. Similar to Option 3) the reconstruction of seawall will involve marine plant for constructing the blockwork vertical seawall which will increase the complexity of the project.
6.7.25 A summary of the key pros and cons of the various options being considered are included in Tables 6.11 and 6.12.

Agre
em
ent
No.
CE
35/2
006(C
E)
Kai T
ak D
eve
lopm
ent
Engin
eeri
ng S
tud
y cum
Desig
n a
nd C
onstr
uctio
n o
f A
dva
nce W
ork
s A
nne
x A
– I
nve
stigation,
Desig
n a
nd C
on
str
uct
ion
KT
AC
an
d K
TT
S S
tudie
s
6-2
7
Tab
le 6
.11 -
Ad
van
tag
es
an
d D
isad
van
tag
es o
f D
iffe
ren
t O
pti
on
s f
or
Kai
Tak A
irp
ort
Ru
nw
ay S
eaw
all S
ed
imen
tati
on
Cle
an
ing
Op
tio
ns
Ad
van
tag
es
Dis
ad
van
tag
es
i)
Does n
ot
requ
ire hea
vy
constr
uctio
n p
lant
and
h
as
the least cost.
i)
The s
edim
ent
will
be w
ash
ed d
ow
n t
o t
he
seab
ed.
A
silt
curt
ain
w
ill
be
require
d
to
co
nfine
th
e
sedim
ent
plu
me.
The s
ed
iment
will
se
ttle
on t
he
seabed
of
Kai
Tak N
ulla
h a
nd b
e t
reate
d lo
cally
w
ith
the
exis
tin
g
sea
be
d
mate
rial
possib
ly
in
tand
em
with
the s
ectio
n o
f sea
wall.
ii)
Only
in
volv
es s
imple
cle
anin
g p
roced
ure
s a
nd s
o i
s
the f
aste
st m
eth
od.
ii)
The eff
ectiv
en
ess of
this
m
eth
od in
cle
an
ing
th
e
sedim
ent
ben
eath
th
e up
per
laye
r of
the arm
our
may
nee
d to
be ve
rified in
is
ola
ted lo
cations b
y lif
ting
out
the
‘cle
aned
’ arm
our
to
check
the
underl
yin
g c
ond
itio
n.
iii)
Eff
icie
nt
in
cle
an
ing
the
sedim
ent
deposited
on
surf
ace la
yer
of
rock a
rmour
surf
ace o
r tr
apped insid
e
the v
oid
s b
etw
ee
n s
urf
ace a
rmour
sto
nes.
1a)
Hig
h p
ressure
wate
r je
t arm
our
to
rem
ove
th
e
trap
ped
sedim
ent
iv)
Does
not
requir
e
the
rem
ova
l or
dis
turb
ance
of
exis
ting a
rmour
of
the s
lop
ing s
ea
wa
ll so t
here
is n
o
concern
on t
he
tem
pora
ry s
tabili
ty o
f th
e s
ea
wall.

A
gre
em
ent
No.
CE
35/2
006(C
E)
K
ai T
ak D
eve
lopm
ent
Engin
eeri
ng S
tud
y A
nne
x A
cum
Desig
n a
nd C
onstr
uctio
n o
f A
dva
nce W
ork
s
KT
AC
an
d K
TT
S S
tudie
s t
– I
nve
stigation,
Desig
n a
nd C
on
str
uct
ion
6-2
8
Op
tio
ns
Ad
van
tag
es
Dis
ad
van
tag
es
1b)
H
igh
pre
ssure
w
ate
r je
t arm
our
to r
em
ove
th
e t
rap
ped
sedim
ent
+ cem
ent
mort
ar
of
the
gaps
betw
ee
n
arm
our
sto
nes
to
pre
vent
furt
her
depositi
on o
f sed
iment
i)
Does n
ot
requir
e h
eavy
co
nstr
uctio
n p
lant
an
d i
s a
re
latively
lo
w c
ost
option.
i)
The s
edim
ent
will
be w
ash
ed d
ow
n t
o t
he s
eab
ed.
A
silt
curt
ain
w
ill
be
requ
ired
to
confin
e
the
sedim
ent
plu
me.
The s
edim
ent
will
sett
le o
n t
he
seabed
of
KT
N
and
be
treate
d
loca
lly
with
th
e
exis
ting seab
ed m
ate
ria
l possib
ly
in ta
nd
em
w
ith
the s
ection o
f seaw
all
ii)
Only
in
volv
es s
imple
cle
anin
g a
nd m
ort
ar
pla
cem
ent
pro
cedure
s a
nd s
o is th
e r
ela
tively
fast.
ii)
The eff
ectiv
en
ess of
this
m
eth
od in
cle
an
ing
th
e
sedim
ent
ben
eath
th
e up
per
laye
r of
the arm
our
may
ne
ed
to
be
verifie
d
in
isola
ted
lo
cations
by
liftin
g
ou
t th
e
‘cle
aned
’ arm
our
to
check
the
underl
yin
g c
ond
itio
n.
iii)
E
ffic
ient
in
cle
an
ing
the
sedim
ent
deposited
on
surf
ace
laye
r of
rock
arm
our
surf
ace
or
trapped
in
sid
e th
e v
oid
s b
etw
ee
n s
urf
ace a
rmour
sto
nes
iii )
Pla
cem
ent
of
mort
ar
in t
he v
oid
s b
etw
een t
he r
ock
arm
our
would
re
quire
care
to
e
nsure
th
e
mort
ar
losses w
ere
min
imiz
ed.
The w
ork
s w
ould
ne
ed t
o
be c
arr
ied o
ut
durin
g l
ow
-tid
e a
nd
th
e c
onstr
uctio
n
schedule
w
ou
ld h
ave to
b
e arr
ange
d so th
at
the
m
ort
ar
wou
ld s
et
befo
re i
t is
washed
aw
ay
by
the
risin
g t
ide.
iv)
D
oes
not
requ
ire
th
e
rem
ova
l or
dis
turb
ance
of
exis
ting a
rmour
of
the s
lopin
g s
ea
wall
so t
here
is n
o
concern
on t
he
tem
pora
ry s
tabili
ty o
f th
e s
ea
wall.

Agre
em
ent
No.
CE
35/2
006(C
E)
Kai T
ak D
eve
lopm
ent
Engin
eeri
ng S
tud
y cum
Desig
n a
nd C
onstr
uctio
n o
f A
dva
nce W
ork
s A
nne
x A
– I
nve
stigation,
Desig
n a
nd C
on
str
uct
ion
KT
AC
an
d K
TT
S S
tudie
s
6-2
9
Op
tio
ns
Ad
van
tag
es
Dis
ad
van
tag
es
2a)
Rem
ova
l of
the e
xis
ting a
rmour
cle
an
ing
an
d r
ein
sta
tem
ent
i)
This
is t
he
most
eff
ectiv
e m
eth
od i
n c
lea
nin
g u
p t
he
sedim
ent
sin
ce a
ll th
e s
edim
ent
is e
xposed
an
d c
an
be w
ash
ed a
wa
y.
i)
Will
re
quire
liftin
g
pla
nt
whic
h
will
in
cre
ase
th
e
cost. T
his
m
eth
od is
m
ore
expensiv
e th
an th
e
wate
r je
t o
ption.
ii)
The l
iftin
g a
nd r
ein
sta
tem
ent
of
exis
ting a
rmour
is
much m
ore
sophis
tica
ted t
han t
he w
ate
r je
t o
ption
and
requir
es
a
suitab
ly
experie
nced
marine
contr
acto
r.
T
his
o
ption
w
ill
take
more
tim
e
to
com
ple
te t
o e
nsure
th
e r
evetm
ent
is c
orr
ectly
and
safe
ly r
em
ove
d a
nd r
ein
sta
ted.
iii
) T
he r
em
ova
l of
the a
rmour
will
lea
d t
o e
xp
osure
of
the u
nd
erla
yer
of
the
sea
wall
to w
ave
action
an
d
the
tem
pora
ry
sta
bili
ty
of
the
seaw
all
in
the
excava
ted s
tate
wo
uld
nee
d to b
e v
erifie
d.
iv
) W
ill
require
larg
er
site
are
a
than
the
wa
ter
jet
option b
ecause of
the te
mpora
ry sto
rag
e of
the
arm
our
taken-u
p.
T
he
larg
er
site
are
a
ma
y im
pose s
om
e r
estr
ictio
ns o
n t
he l
an
duses o
n t
he
adja
cent
are
as a
lon
g th
e K
ai T
ak A
irport
Ru
nw
ay.

A
gre
em
ent
No.
CE
35/2
006(C
E)
K
ai T
ak D
eve
lopm
ent
Engin
eeri
ng S
tud
y A
nne
x A
cum
Desig
n a
nd C
onstr
uctio
n o
f A
dva
nce W
ork
s
KT
AC
an
d K
TT
S S
tudie
s t
– I
nve
stigation,
Desig
n a
nd C
on
str
uct
ion
6-3
0
Op
tio
ns
Ad
van
tag
es
Dis
ad
van
tag
es
i)
This
is t
he m
ost
eff
ectiv
e m
eth
od i
n c
lea
nin
g u
p t
he
sedim
ent
sin
ce a
ll th
e s
ed
iment
is e
xposed a
nd c
an
be w
ash
ed a
wa
y.
i)
Will
re
quire
lif
ting
pla
nt
whic
h
will
in
cre
ase
the
cost. T
his
m
eth
od is
m
ore
expensiv
e th
an th
e
wate
r je
t o
ption.
ii)
T
he l
iftin
g a
nd r
ein
sta
tem
ent
of
exis
ting a
rmour
is
much m
ore
sophis
ticate
d t
han t
he w
ate
r je
t optio
n
and
req
uires
a
su
itably
experie
nced
marine
contr
acto
r.
T
his
option
will
ta
ke
more
tim
e
to
com
ple
te t
o e
nsure
the r
evetm
ent
is c
orr
ectly
an
d
safe
ly r
em
ove
d a
nd r
ein
sta
ted.
iii
) T
he r
em
ova
l of
the a
rmour
will
le
ad t
o e
xposure
of
the
un
derl
aye
r of
the
sea
wall
to w
ave
action
an
d
the
tem
pora
ry
sta
bili
ty
of
the
seaw
all
in
the
excava
ted s
tate
wo
uld
nee
d to b
e v
erifie
d.
iv
) W
ill
require
larg
er
site
are
a
than
th
e
wate
r je
t option because of
the te
mpora
ry sto
rag
e of
the
ro
ck a
rmour
taken-u
p.
The l
arg
er
site
are
a m
ay
impose s
om
e r
estr
ictio
ns o
n t
he
la
nduses o
n t
he
adja
cent
are
as a
lon
g th
e K
ai T
ak A
irport
Ru
nw
ay.
2b)
Rem
ova
l of
the
exis
ting
arm
our
cle
anin
g
and
re
insta
tem
ent
+
cem
ent
mort
ar
of
the
ga
ps
be
tween
arm
our
sto
nes
to
pre
vent
furt
her
depositi
on o
f sed
iment
v)
Pla
cem
ent
of
mort
ar
in t
he v
oid
s b
etw
ee
n t
he r
ock
arm
our
wou
ld r
eq
uire
care
to
ensure
the m
ort
ar
losses w
ere
min
imiz
ed
. T
he w
ork
s w
ou
ld n
ee
d t
o
be c
arr
ied o
ut
durin
g lo
w-t
ide a
nd t
he c
onstr
uctio
n
schedule
wo
uld
ha
ve t
o b
e a
rrang
ed s
o t
hat
the
m
ort
ar
wou
ld s
et
befo
re i
t is
washed
aw
ay
by
the
risin
g t
ide.

Agre
em
ent
No.
CE
35/2
006(C
E)
Kai T
ak D
eve
lopm
ent
Engin
eeri
ng S
tud
y cum
Desig
n a
nd C
onstr
uctio
n o
f A
dva
nce W
ork
s A
nne
x A
– I
nve
stigation,
Desig
n a
nd C
on
str
uct
ion
KT
AC
an
d K
TT
S S
tudie
s
6-3
1
Op
tio
ns
Ad
van
tag
es
Dis
ad
van
tag
es
3)
R
econstr
uction
of
exis
ting
slo
pin
g
sea
wa
ll w
ith
a
low
er
berm
i)
The
reconstr
uctio
n
of
the
sea
wa
ll ca
n
low
er
the
exis
ting b
erm
wh
ich i
s t
he m
ajo
r are
a o
f sedim
ent
depositi
on f
rom
+1.2
mP
D t
o -
1.0
mP
D a
nd
so t
he
sedim
enta
tion p
roble
m w
ill n
ot
be e
xposed t
o o
pen
air
or
public
vie
w
as
with
the
south
sectio
n
of
sea
wall.
i)
Involv
es t
he
rem
ova
l of
the
up
per
port
ion
of
exis
ting
slo
pin
g s
ea
wa
ll re
vetm
ent
and s
om
e u
nderl
ying o
r adja
cent
rock
fill
an
d
constr
uctio
n
of
the
ne
w
slo
pin
g
sea
wall
reve
tment.
T
his
optio
n
will
be
re
latively
exp
ensiv
e a
mong
the o
ptions b
eca
use o
f th
e a
dde
d e
xca
vation a
nd p
lacem
ent of
rockfill.
ii)
Requ
ires a
suita
bly
experi
enced m
arine c
ontr
acto
r and w
ill t
ake a
re
lative
ly l
ong t
ime r
ela
tive
to t
he
oth
er
options t
o e
nsure
th
e r
eve
tment
is c
orr
ectly
and s
afe
ly r
em
ove
d a
nd r
ein
sta
ted
.
iii)
T
he r
em
ova
l of
the
arm
our
will
lea
d t
o e
xposure
of
the u
nderl
aye
r of
the s
ea
wall
to w
ave
actio
n a
nd
th
e
tem
pora
ry
sta
bili
ty
of
the
se
aw
all
in
the
excava
ted s
tate
wo
uld
nee
d to b
e v
erifie
d.
iv
)
Will
re
quire th
e m
ore
site
are
a th
an options 1a),
1b),
2a)
and
2b)
beca
use
of
the
additio
na
l excava
tion
of
rock
fill.
The
larg
er
site
are
a
ma
y im
pose som
e re
str
ictio
ns on th
e la
nduses on th
e
adja
cent
are
as a
lon
g th
e K
ai T
ak A
irport
Ru
nw
ay.
v)
This
optio
n cou
ld re
quire som
e im
port
ed ro
ck fill
and
the
dis
posal
of
som
e
surp
lus
fill
mate
ria
ls
subje
ct
to
slo
pe
sta
bili
ty
checkin
g.
T
his
w
ill
incre
ase
the
requir
ed
resourc
es
for
this
w
ork
re
lative to o
ptio
ns 1
a),
1b),
2a)
an
d 2
b).

A
gre
em
ent
No.
CE
35/2
006(C
E)
K
ai T
ak D
eve
lopm
ent
Engin
eeri
ng S
tud
y A
nne
x A
cum
Desig
n a
nd C
onstr
uctio
n o
f A
dva
nce W
ork
s
KT
AC
an
d K
TT
S S
tudie
s t
– I
nve
stigation,
Desig
n a
nd C
on
str
uct
ion
6-3
2
Op
tio
ns
Ad
van
tag
es
Dis
ad
van
tag
es
i)
The
reconstr
uctio
n
of
the
sea
wa
ll ca
n
low
er
the
exis
ting b
erm
wh
ich i
s t
he m
ajo
r are
a o
f sedim
ent
depositi
on
fr
om
+
1.2
m
PD
to
+
0 m
PD
and
so
th
e
sedim
enta
tion p
roble
m w
ill n
ot
be e
xpose
d t
o p
ublic
vi
ew
most of
the tim
e.
i)
Involv
es t
he d
em
olit
ion o
f exis
ting s
lopin
g s
ea
wall
and
co
nstr
uctio
n
of
the
ne
w
blo
ckw
ork
sea
wa
ll.
This
optio
n w
ill be th
e m
ost
expensiv
e of
all
the
options.
ii)
Will
als
o
take
the
longe
st
time
am
ong
all
the
options.
4)
Reconstr
uction
of
exis
ting
sea
wall
slo
pin
g w
all
to v
ert
ical
sea
wall
iii)
Will
le
ad to
dis
posal
of
surp
lus fill
mate
rials
a
nd
exis
ting a
mour
rock,
if s
uch m
ate
rial
can
not
be
re-
used i
n o
ther
pro
jects
. T
his
will
result
in w
aste
of
resourc
es
and
furt
her
incre
ase
the
pre
ssure
o
n
pub
lic d
um
p.
iv
) W
ill re
quire th
e la
rgest
site are
a because of
the
excava
tion
for
blo
ckw
ork
sea
wa
ll constr
uction.
The
larg
er
site
are
a m
ay
impo
se s
om
e r
estr
ictio
ns o
n
the l
an
duses o
n t
he a
dja
cent
are
as a
long t
he K
ai
Tak A
irport
Ru
nw
ay.
v)
The r
em
ova
l of
the a
rmour
will
le
ad
to
exposure
of
the u
nderl
aye
r of
the s
ea
wall
to w
ave a
ction a
nd
th
e
tem
pora
ry
sta
bili
ty
of
the
sea
wall
in
the
excava
ted s
tate
wo
uld
nee
d to b
e v
erifie
d.

Agre
em
ent
No.
CE
35/2
006(C
E)
Kai T
ak D
eve
lopm
ent
Engin
eeri
ng S
tud
y cum
Desig
n a
nd C
onstr
uctio
n o
f A
dva
nce W
ork
s A
nne
x A
– I
nve
stigation,
Desig
n a
nd C
on
str
uct
ion
KT
AC
an
d K
TT
S S
tudie
s
6-3
3
Tab
le 6
.12 -
Co
mp
ari
so
n o
f th
e P
ros a
nd
Co
ns o
f D
iffe
ren
t S
olu
tio
ns t
o S
eaw
all S
ed
imen
tati
on
P
rog
ram
me
Co
st
Co
mp
lexit
y
Eff
ecti
ven
ess
Optio
n
1a)
Hig
h
pre
ssure
w
ate
r je
t arm
our
to
rem
ove
th
e
trappe
d s
ed
iment
This
will
be t
he f
aste
st o
ption.
This
optio
n
has
least
cost
because
th
e
use
of
cle
anin
g
equ
ipm
ent, w
ate
r an
d u
nskill
ed
la
bour
is r
ela
tive
ly i
nexpen
siv
e.
T
he
cost
is
estim
ate
d
to
be
H
K$0
.78
M.
This
optio
n is
the s
imple
st.
E
xpecte
d t
o b
e a
ble
to
re
move
th
e s
ed
iment
from
the b
erm
and
void
s
in
rock
arm
our
surf
ace
laye
r ab
ove
lo
w w
ate
r le
vel.
Optio
n
1b)
Hig
h
pre
ssure
w
ate
r je
t arm
our
to
rem
ove
th
e
trappe
d s
ed
iment
+ cem
ent
mort
ar
of
the
gaps
betw
een
arm
our
sto
nes t
o p
revent
furt
her
depositi
on
of
sedim
ent
Rela
tive
ly f
ast
Rela
tive
ly l
ow
cost
option
. T
he
cost
is
estim
ate
d
to
be
H
K$1
.19
M.
Rela
tive
ly s
imple
E
ffectiv
eness of
this
m
eth
od in
cle
an
ing
th
e
sed
iment
be
neath
th
e
upp
er
laye
r of
the
arm
our
may
ne
ed
to
be
verifie
d.
The
mort
ar
infill
ma
y bre
ak
up
in
time.
This
optio
n w
ou
ld a
im to
m
inim
ize
the
accum
ula
tion
of
sedim
ent
within
th
e
se
aw
all
reve
tment in
futu
re.
Optio
n
2a)
Rem
ova
l of
the
exis
ting
arm
our
cle
an
ing
a
nd
re
insta
tem
ent
Will
take m
uch m
ore
tim
e t
han
options 1
a)
and 1
b)
becau
se o
f th
e ta
ke up a
nd
re
insta
tem
ent
of
the
rock
arm
our
reve
tment
require
d.
More
expe
nsiv
e
tha
n
op
tions
1a)
an
d 1
b)
beca
use i
t in
volv
es
liftin
g
and
re
insta
ting
th
e
arm
our
whic
h
requ
ires
heavy
constr
uctio
n p
lan
t. T
he co
st
is
estim
ate
d to b
e H
K$2.3
1M
More
com
ple
x t
han o
ption
s 1
a)
and
1b)
and
req
uires
an
experie
nced m
arine c
on
tra
cto
r.
Will
be e
ffectiv
e i
n r
em
ovi
ng t
he
sedim
ent
thro
ug
hou
t th
e
rock
arm
our
reve
tment.

A
gre
em
ent
No.
CE
35/2
006(C
E)
K
ai T
ak D
eve
lopm
ent
Engin
eeri
ng S
tud
y A
nne
x A
cum
Desig
n a
nd C
onstr
uctio
n o
f A
dva
nce W
ork
s
KT
AC
an
d K
TT
S S
tudie
s t
– I
nve
stigation,
Desig
n a
nd C
on
str
uct
ion
6-3
4
P
rog
ram
me
Co
st
Co
mp
lexit
y
Eff
ecti
ven
ess
Optio
n
2b)
Rem
ova
l of
the
exis
ting
arm
our
cle
an
ing
a
nd
re
insta
tem
ent
+
cem
ent
mort
ar
of
the
gaps
betw
een
arm
our
sto
nes t
o p
revent
furt
her
depositi
on
of
sedim
ent
Will
take m
ore
tim
e t
han o
ptio
n
2a)
because
of
the
m
ort
ar
app
lication
.
Rela
tive
ly h
igh c
ost. T
his
optio
n
will
be
more
expensiv
e
than
options
2a)
because
of
the
m
ort
ar
infill
op
era
tion.
The
cost
is e
stim
ate
d to b
e H
K$2
.72
M.
Requ
ires
an
experi
enced
marine c
ontr
acto
r fo
r re
vetm
ent
take u
p a
nd r
ein
sta
tem
ent.
This
option
is
m
ore
com
ple
x
than
options 2
a)
beca
use t
he
mort
ar
needs
to
set
with
in
the
tid
al
win
do
w
wh
ich
is
about
4
- 5
hours
.
Confin
em
ent
of
the
m
ort
ar
is
als
o
nece
ssary
oth
erw
ise
it w
ill
lead
to
excessiv
e
loss
of
go
ut
an
d
would
be p
roh
ibiti
ve f
rom
a c
ost
and e
nvi
ronm
enta
l sta
ndpo
int.
Will
be e
ffectiv
e i
n r
em
ovi
ng t
he
sedim
ent
thro
ug
hou
t th
e
rock
arm
our
reve
tment.
The
long
te
rm d
ura
bili
ty o
f th
e m
ort
ar
infill
is
in
qu
estion
du
e
to
post
constr
uctio
n
se
ttle
ment.
This
option
wou
ld a
im to m
inim
ize t
he
accum
ula
tion o
f sedim
ent
with
in
the s
ea
wall
reve
tment in
futu
re.
Optio
n
3)
Reconstr
uction o
f exis
ting
slo
pin
g
sea
wall
with
a
lo
wer
berm
Will
ta
ke
more
tim
e
than
options
1a),
1b),
2a)
and
2b)
because o
f th
e n
ee
d f
or
gre
ate
r excava
tion
, filli
ng an
d m
ate
ria
l sourc
ing
associa
ted
w
ith
th
e
reshapin
g o
f th
e s
ea
wall
rock
fill.
Will
be
more
expensiv
e
than
options
1a),
1b),
2a)
an
d
2b)
because
of
gre
ate
r exte
nt
of
work
s.
The c
ost
is e
stim
ate
d t
o
be H
K$3.0
8M
.
More
com
ple
x t
ha
n o
ptions 1
a),
1b),
2a)
and
2b)
because o
f th
e
reshapin
g o
f th
e s
ea
wall
pro
file
and u
nd
erl
yin
g r
ockfill.
In
ad
ditio
n
of
rem
ovi
ng
th
e
sedim
ent, t
his
option i
s i
nte
nde
d
to
pre
ven
t th
e
futu
re
accum
ula
tion
of
sig
nific
ant
sedim
ent
on t
he s
ea
wall
in t
he
tid
al zo
ne.
Optio
n
4)
Reconstr
uction o
f exis
ting
sea
wa
ll slo
pin
g
wall
to
vert
ica
l se
aw
all
Will
ta
ke
the
long
est
time
because
it
involv
es
the
dem
olit
ion
of
the
exis
ting
sea
wall
an
d
constr
uctio
n
of
blo
ckw
ork
seaw
all.
This
optio
n
is
the
most
expensiv
e.
The
cost
is
estim
ate
d to b
e H
K$13
.73
M.
This
option
is
th
e
most
com
ple
x.
In
ad
ditio
n
to
the
constr
uctio
n o
f ne
w s
ea
wall,
the
sta
bili
ty
of
the
se
aw
all
during
constr
uctio
n s
tage
ne
eds t
o b
e
checked.
This
optio
n
wou
ld
low
er
the
berm
to
+
0.0
m
PD
w
hic
h
is
low
er
than t
he M
LLW
whic
h is a
t +
0.4
5
mP
D.
This
w
ould
m
inim
ize
the
freque
ncy
of
exposure
of
sed
iment
in t
he t
ida
l zo
ne.
*Note
s:
1.
The e
stim
ate
d c
ost exclu
de
s p
relim
inari
es a
nd
conting
ency.
2.
The c
ost
estim
ate
is b
ase
d o
n t
he a
ssum
ptio
n t
hat
ap
pro
xim
ate
ly 6
00 m
exis
ting s
ea
wa
ll at
the n
ort
h e
nd o
f th
e r
un
wa
y w
ill b
e d
em
olis
hed t
o
cre
ate
th
e 6
00 m
wid
e o
pe
nin
g a
nd s
ed
iment re
mova
l is
not
requ
ired f
or
this
60
0m
length
of
exis
ting s
ea
wa
ll.

Agre
em
ent
No.
CE
35/2
006(C
E)
Kai T
ak D
eve
lopm
ent
Engin
eeri
ng S
tud
y cum
Desig
n a
nd C
onstr
uctio
n o
f A
dva
nce W
ork
s A
nne
x A
– I
nve
stigation,
Desig
n a
nd C
on
str
uct
ion
KT
AC
an
d K
TT
S S
tudie
s
6-3
5
Assum
ptio
ns:
1)
The a
vera
ge
sed
imenta
tion
thic
kness w
as e
stim
ate
d t
o b
e 0
.08
m a
nd s
ed
imenta
tion w
as o
bserv
ed o
n t
he
berm
adja
cent
to a
nd t
ypic
ally
within
1.5
m o
f th
e toe o
f th
e u
ppe
r slo
pe.
T
hus, th
e a
rea
of
arm
our
surf
ace r
equire
d f
or
cle
an
ing
the 6
40m
seaw
all
section =
640 x
3 =
192
0m
3 (
appro
x.)
2)
For
options 2
a)
an
d 2
b),
th
e v
olu
me o
f arm
our
nee
ded
to b
e taken-u
p, sto
red a
nd r
ein
sta
ted is a
ppro
x. =
640
x (
6+
3)
x 0
.9 =
51
84m
3 (
appro
x.)
3)
For
options 1
b)
an
d 2
b),
th
e g
aps b
etw
een
the r
ock a
rmour
need t
o b
e s
ea
led w
ith m
ort
ar,
the g
aps b
etw
een a
rmour
on t
he b
erm
varies f
rom
10 c
m t
o 2
0 c
m (
ave
rag
e 1
5cm
), t
he lo
ng
itud
inal sp
acin
g o
f th
e g
ap i
s a
ppro
x 0
.8 m
and e
very
tra
nsve
rse s
ectio
n o
f th
e b
erm
has 5
gaps.
The
depth
of
the g
ap
is a
ssum
ed to b
e 5
0 c
m.
T
hus, th
e v
olu
me o
f m
ort
ar
require
d =
(0.1
5 x
2 x
640 +
0.1
5 x
640 x
0.8
x 5
) x 0
.5 =
396m
3
Allo
win
g 2
5%
loss, th
e t
ota
l vo
lum
e =
39
6 x
1.2
5 =
495
m3
4)
For
option 3
, th
e f
ollo
win
g q
uan
titie
s (
ap
pro
x.)
of
work
s a
re r
equ
ired.
a)
Take-u
p, sto
re a
nd r
ein
sta
te a
rmour
= 6
40 x
(6+
3)
x 0
.9 =
518
4m
3 (a
ppro
x.)
b)
Cle
anin
g o
f sed
iment =
640
x 3
= 1
92
0m
3 (
appro
x.)
c)
Cle
anin
g o
f arm
our
surf
ace =
640 x
3 =
192
0m
3 (
appro
x.)
5)
For
option 4
th
e f
ollo
win
g o
f quantitie
s (
appro
x.)
of
work
s a
re r
equir
ed.
a)
Pre
cast an
d in-s
itu c
oncre
te =
(5
.4 x
1.3
5 +
3.2
5 x
2.4
+ 1
.2 x
2.1
+ 1
.5 x
0.5
) x 6
40=
1175
0m
3
b)
Excava
tio
n o
f ro
ck =
[(1
0+
2)
x 3
x 0
.5 +
(4.5
+3
+7)
x 0
.9] x 6
40 =
198
72m
3
c)
Levelli
ng s
tone =
0.0
75 x
5.4
x 6
40
= 2
59m
3
d)
Geote
xtile
= 1
7 x
640 =
10
880m
2
e)
Depositio
n o
f ro
ck fill
= 4
x 1
.7 x
640 =
4352m
3
f)
G
enera
l excavation =
4.6
x 4
.6 x
1.5
x 0
.5 x
64
0 +
(1.5
+ 6
) x 0
.5 x
2 x
640 =
1495
6.8
m3
g)
Depositio
n o
f filte
r =
(5 +
3 +
5)
x 1
x 6
40 =
832
0m
h)
Depositio
n o
f berm
sto
ne =
5 x
0.5
x 6
40 =
160
0m
3
i)
Depositio
n o
f ge
nera
l fill
mate
ria
l =
((1
1+
9)
/ 2 x
1.3
+ 5
x 2
x 0
.5)
x 6
40 =
115
20
m3

Agreement No. CE 35/2006(CE) Kai Tak Development Engineering Study Annex A cum Design and Construction of Advance Works KTAC and KTTS Studies – Investigation, Design and Construction
6-36
Recommended Solution
6.7.26 Based on this assessment it appears that Option 1a) would provide an effective means to removing the sediment from the seawall revetment in the tidal zone, which is understood to be of prime importance. This option will also minimize construction impact, time and cost and will allow the sediment mobilized within each area of work to be confined within that area for effective treatment at the seabed. This option will only involve the use of high pressure water jet, adverse odour impact during the cleaning operation is therefore not anticipated. Besides, with the future improvement of water circulation as discussed in Section 7 and the containment of pollution entering KTAC and KTTS as discussed in Section 8, the chance of re-deposition of sediment after the cleaning operation should be much reduced. Option 2a) allows for more comprehensive removal of sediment within the seawall revetment but is not considered cost effective compared to Option 1a). Option 1b) and 2b) are not considered appropriate as the mortar infill is not compatible with the function of the seawall and may break up in future. Option 3) would offer the same benefits as Option 2b) plus avoid exposure of accumulated sediments at low tide in future and is considered the second preference option. However the cost of this option is relatively high compared to Option 1a) and considering the limited future benefit and is not recommended. Option 4) is not recommended because the introduction of a vertical wall will require significant additional expenditure with only limited benefit of ease of future cleaning.
6.7.27 In view of the above, it is recommended that Option 1a) forms the basis of the seawall remedial / cleaning works. It is also suggested to include a trial water jet removal of sediment prior to tendering the works to investigate the effectiveness of Option 1a). In the event the trial indicates the method of cleansing the seawall revetment is ineffective than it is recommended the seawall remedial/cleansing works proceed on the basis of the 2
nd
preferred option, Option 3).
6.8 Recommendations 6.8.1 This section evaluates the methods in suppression odour from two key sources: (i)
emissions from odorous sediments at water surface covering areas of KTN, KTAC and KTTS and (ii) emissions from exposed sediment during low tide at the seawall of the former runway along KTAC. Based on the evaluation of the different sediment treatment options, in-situ bioremediation is recommended as the most appropriate technique for suppressing odour generated from the contaminated sediment along the channel bed because its effectiveness has been proven in pilot scale field trial. Further, in-situ bioremediation poses the lowest potential for adverse ecological impacts of the options considered and is the lease expensive option.
6.8.2 For the exposed sediment along the former Kai Tak runway, it is recommended that Option 1a) – High pressure water jet armour forms the basis of the seawall remedial / cleaning works. It is also suggested to include a trial water jet removal of sediment prior to tendering the works to investigate the effectiveness of Option 1a). In the event the trial indicates the method of cleansing the seawall revetment is ineffective than it is recommended the seawall remedial/cleansing works proceed on the basis of the 2
nd
preferred option, Option 3) – Reconstruction of existing seawall sloping wall with a lower berm.
6.9 References
City Planning – Maunsell Joint Venture, Agreement No. CE4/2004 (TP) South East Kowloon Development Comprehensive Planning and Engineering Review Stage 1: Planning Review – Situation Report on Review of Sediment Treatment Methods to Tackle Odour at KTAC, August 2006.

Agreement No. CE 35/2006(CE) Kai Tak Development Engineering Study cum Design and Construction of Advance Works Annex A – Investigation, Design and Construction KTAC and KTTS Studies
6-37
City Planning – Maunsell Joint Venture, Agreement No. CE4/2004 (TP) South East Kowloon Development Comprehensive Planning and Engineering Review Stage 1: Planning Review – Final Report on Bioremediation Pilot Scale-Field Test at KTAC, October 2007. CHEC-OWT JV, Bench-Scale Testing to Determine the Effect of Bactericide on Nitrate Utilisation in Kai Tak Approach Channel Sediments, August 2006. BMT Asia Pacific Limited, Contract No. CV/2004/05 Works Oder MD/55/04 Pilot Scale Field Test on Bioremediation for Kai Tak Approach Channel – Post-Work EM&A Report, May 2006 Arup-Scott Wilson JV, Agreement No. CE 43/2000 South East Kowloon Development Kai Tak Approach Channel Reclamation – Design and Construction – Working Paper on Review of Sediment Treatment Technologies, May 2003. Arup-Scott Wilson JV, Agreement No. CE 43/2000 South East Kowloon Development Kai Tak Approach Channel Reclamation – Design and Construction – Final Report on Review of Remediation Strategy, May 2003. USEPA, Contaminated Sediment Remediation Guidance for Hazardous Waste Sites, December 2005. Department of Civil and Structural Engineering, Hong Kong Polytechnic University, Agreement No. KDO 02/2004 – Independent Assessment on the Treatment of Contaminated Sediments in KTAC using Chemical S/S Process – Further Laboratory Trials and Performance Review of the Treated Sediments, November 2006.

Agreement No. CE 35/2006(CE) Kai Tak Development Engineering Study Annex A cum Design and Construction of Advance Works KTAC and KTTS Studies – Investigation, Design and Construction
6-38

Agreement No. CE 35/2006(CE) Kai Tak Development Engineering Study cum Design and Construction of Advance Works Annex A – Investigation, Design and Construction KTAC and KTTS Studies
7-1
7 IMPROVEMENT OF WATER CIRCULATION
7.1 Introduction Background
7.1.1 The Kai Tak Approach Channel (KTAC) and the Kwun Tong Typhoon Shelter (KTTS)
receive storm water from the Kwun Tong, Kowloon Bay, Jordan Valley, San Po Kong and Wong Tai Sin areas. Figure 7.1 shows the locations of storm outfalls in the Study Area and their respective catchments.
7.1.2 The KTAC is embayed by the existing Runway and the existing breakwaters of KTTS which results in poor water circulation. Therefore, the pollution loading discharged into the KTAC cannot be effectively dispersed which causes the pollution problem. The water pollution sources in KTAC and KTTS include:
• Secondary treated (un-disinfected) effluent of about 320,000 m3 each day
(1) from the
Tai Po and Sha Tin sewage treatment works (STW) under the Tolo Harbour Effluent Export Scheme (THEES) discharged into the KTAC via the Kai Tak Nullah (KTN);
• Polluted storm runoff or street washing to the drainage system;
• Expedient connections from trade and residential premises, and integrity problems of aged drainage and sewerage systems in the catchment areas in North and East Kowloon; and
• Discharges and contamination from the marine and mooring activities in the Public Cargo Working Area (PCWA) and KTTS.
7.1.3 The pollution loading discharged into KTAC, KTTS and Kowloon Bay has been
quantitatively assessed based on detailed field survey and desk-top calculations under the Kai Tak Planning Review (KTPR)
(2). It was found that the KTN and Jordan Valley Box
Culvert (JVBC) contributed the largest amount of total pollution loading discharged into KTAC, KTTS and Kowloon Bay. The contribution of dry weather pollution loading from different storm outfalls under the existing condition is given in Figure 7.1.
7.1.4 THEES is one of the key pollution sources in terms of the nutrient levels. Amongst the loading discharged from the KTN outfall, it was estimated that during the dry season when the DWFI installed in the catchment of KTN are more effective, about 30% of the BOD and about half of the nutrient and SS loading would be contributed by the THEES effluent under
the existing condition (3)
. In terms of E.coli, the THEES effluent contributed only about 1% of the total loading discharged at the KTN outfall during the dry season under the existing condition. The Drainage Services Department (DSD) proposes to increase the capacity of the Tai Po and Sha Tin STWs (more effluent flows) but also to provide disinfection to reduce the E.coli concentrations to meet the new (more stringent) effluent quality standard. With the plan to provide disinfection to the THEES effluent in the future, the E.coli loading contribution from THEES would be even smaller. The discharges from PCWA and KTTS would only contribute a very minor portion of the overall pollution loading discharged into the KTAC and are therefore not included in Figure 7.1.
7.1.5 Without reclamation at the KTAC and KTTS, the water quality of these water bodies needs to be addressed as they may impose constraints to the future Kai Tak Development (KTD) on the land side.
(1)
The flow rate was based on the current design flow of the two STWs. (2)
South East Kowloon Comprehensive Planning and Engineering Review Stage 1: Planning Review (3)
The total pollution flows and loads discharged at the KTN outfall were measured under the dry season field surveys conducted in 2005/2006 under the KTPR. As the existing THEES flows and loads are known from DSD records, the loading contribution from THEES can be estimated.

Agreement No. CE 35/2006(CE) Kai Tak Development Engineering Study Annex A cum Design and Construction of Advance Works KTAC and KTTS Studies – Investigation, Design and Construction
7-2
Study History
7.1.6 A preliminary technical analysis of the key environmental issues of KTAC was conducted under the KTPR based on information available from previous studies. The key issues of KTAC include poor water quality, contaminated sediment and odour impacts. As the previous development plan involves reclamation at KTAC, there was no detailed analysis of KTAC water quality available from the previous studies.
7.1.7 An assessment of the effectiveness of the possible mitigation measure to improve the water quality at KTAC is vital before it could be determined whether or not the “no reclamation” scenario would be a feasible solution to the observed environmental problems at KTAC.
7.1.8 To minimise the level of uncertainty and provide a solid ground for testing feasibility of different mitigation options, preliminary water quality modelling was conducted under the KTPR to assess the broad acceptability and technical feasibility of a number of possible and practical mitigation options.
7.1.9 Preliminary water quality modelling was conducted using an available model developed for the general Victoria Harbour area namely the VH model. The purpose of the preliminary water quality modelling was to determine the most preferred mitigation option for detailed analysis. The VH model has several limitations that may lead to some degrees of uncertainties on the effectiveness of mitigation scenarios assessed. The limitations are due to the fact that the purpose of the VH model was to assess the impacts on the overall water quality in Victoria Harbour. The model prediction by the VH model would still be sufficient for comparison of the effectiveness of different mitigation options so identified for improving water quality of KTAC.
7.1.10 The preferred mitigation scenario as identified by preliminary water quality modelling was then further confirmed by a detailed water quality modelling exercise carried out under the KTPR. The primarily objective of the detailed water quality modelling and assessment was to obtain reliable hydrodynamic and water quality data for the calibration of a new fine grid model, namely SEK model, to assess the impacts on water quality from the preferred mitigation measures and to confirm the findings of the preliminary water quality modelling.
Purpose of this Section 7.1.11 This section provides further assessment to confirm the findings of the KTPR on the
effectiveness of the proposed mitigation measures for improving the water circulation and water quality of KTAC and KTTS based on a detailed hydrodynamic and water quality modelling exercise.
7.2 Legislation, Policies, Plans, Standards and Criteria 7.2.1 The Water Pollution Control Ordinance (Cap. 358) provides the major statutory framework
for the protection and control of water quality in Hong Kong. According to the Ordinance and its subsidiary legislation, Hong Kong Waters are divided into 10 Water Control Zones (WCZ). Corresponding statements of Water Quality Objectives (WQO) are stipulated for different water regimes (marine waters, inland waters, bathing beaches subzones, secondary contact recreation subzones and fish culture subzones) in the WCZ based on their beneficial uses.

Agreement No. CE 35/2006(CE) Kai Tak Development Engineering Study cum Design and Construction of Advance Works Annex A – Investigation, Design and Construction KTAC and KTTS Studies
7-3
7.2.2 The KTAC and KTTS are located within the Victoria Harbour (Phase 2) WCZ. There are currently no bathing beaches, secondary contact recreation and fish culture zone designated within the Victoria Harbour WCZ. No water quality objective is currently available for the non-contact activities such as boating and general waterfront usage. The WQO for Victoria Harbour was established under the Water Pollution Control Ordinance for the purpose of control of discharges into the water body but not for the purpose of planning individual developments. For a planned development with no human contact with the water and no polluted discharges, the minimum to be achieved under the Environmental Impact Assessment Ordinance would be no deterioration in the water quality (Annex 1.4 of Annex 6 of the EIAO - TM).
7.2.3 EPD have advised a set of specific water quality “compliance requirements” at KTAC and
Kowloon Bay for the purpose of the water quality assessment of KTAC (which also applies to Kowloon Bay) which is shown in Table 7.1 covering the following beneficial uses:
• BU1 - Bathing;
• BU2 - Secondary Contact Recreation; and
• BU3 - General Amenity

A
gre
em
ent
No.
CE
35/2
006(C
E)
K
ai T
ak D
evelo
pm
ent
Engin
eeri
ng S
tud
y
Anne
x A
cum
Desig
n a
nd C
onstr
uction o
f A
dva
nce W
ork
s
KT
AC
an
d K
TT
S S
tudie
s
– I
nvestigation,
Desig
n a
nd C
on
str
uction
7-4
Tab
le 7
.1
Su
mm
ary
of
Wate
r Q
uality
Ob
jecti
ves f
or
Vic
tori
a H
arb
ou
r W
CZ
WQ
Os
ap
pli
ca
ble
to
wa
ter
bo
dy w
ith
as
sig
ne
d b
en
efi
cia
l u
se
WQ
O
De
sc
rip
tio
n
BU
1 :
Ba
thin
g
BU
2 :
S
ec
on
da
ry
Co
nta
ct
Re
cre
ati
on
BU
3 :
Ge
ne
ral
Am
en
ity
Ae
sth
etic
Ap
pe
ara
nce (a
) (i
) T
he
re s
hou
ld b
e n
o o
bje
ction
ab
le o
do
urs
or
dis
colo
ura
tion
of th
e w
ate
r.
(ii)
Ta
rry r
esid
ue
s,
flo
ating
wo
od
, a
rtic
les m
ade
of
gla
ss,
pla
stic,
rub
be
r o
r of
an
y o
the
r su
bsta
nce
sho
uld
be a
bse
nt.
(iii)
M
ine
ral
oil
sh
ould
not
be
vis
ible
on
th
e s
urf
ace
. S
urf
acta
nts
sho
uld
no
t g
ive
ris
e t
o a
la
stin
g fo
am
.
(iv)
Th
ere
sh
ou
ld b
e n
o r
eco
gniz
ab
le s
ew
ag
e-d
eri
ved
deb
ris.
(v)
Flo
atin
g,
su
bm
erg
ed
or
se
mi-su
bm
erg
ed o
bje
cts
of
a s
ize
lik
ely
to in
terf
ere
w
ith
th
e m
ove
me
nt
of
fre
e ve
sse
ls,
or
ca
use
dam
age
to
th
e
ve
sse
ls,
sh
ould
be
absen
t.
(vi)
T
he
w
ate
r sh
ould
n
ot
con
tain
su
bsta
nces
wh
ich
se
ttle
to
fo
rm
ob
jection
able
de
posits.
a
a
a
Dis
solv
ed
Oxy
ge
n (a
) T
he
le
ve
l o
f dis
so
lve
d o
xyg
en
sh
ou
ld n
ot
fall
be
low
4 m
g p
er
lite
r fo
r 90
% o
f th
e
sa
mp
ling
occa
sio
ns d
uri
ng th
e w
ho
le ye
ar;
va
lues s
ho
uld
b
e c
alc
ula
ted as th
e
an
nu
al
wa
ter
co
lum
n
ave
rage
(d
) .
In
add
itio
n,
the
co
nce
ntr
atio
n
of
dis
so
lve
d
oxyg
en
sho
uld
no
t b
e less t
han
2 m
g p
er
litre
with
in 2
m o
f th
e s
ea
be
d f
or
90
% o
f th
e s
am
plin
g o
ccasio
ns d
urin
g t
he
wh
ole
ye
ar.
a
a
a
Te
mp
era
ture
(a)
Hu
ma
n a
ctivity s
ho
uld
no
t cau
se
th
e d
aily
te
mpe
ratu
re r
ang
e t
o c
ha
ng
e b
y m
ore
tha
n 2
.0 °
C.
a
a
a
Sa
linity (a
) H
um
an
activity s
hou
ld n
ot ca
use
the
sa
linity le
ve
l to
ch
an
ge
by m
ore
th
an
10
%.
a
a
a
Su
sp
en
de
d S
olid
s (a
) H
um
an activity sh
ould
n
eith
er
cau
se th
e susp
end
ed so
lids co
nce
ntr
ation
to
b
e
rais
ed
mo
re t
ha
n 3
0%
no
r g
ive
ris
e t
o a
ccum
ula
tion
of
susp
end
ed
so
lids w
hic
h
ma
y a
dve
rse
ly a
ffe
ct a
qu
atic c
om
mu
nitie
s.
a
a
a
Am
mon
ia (a
) T
he
un
-ion
ize
d a
mm
on
ica
l n
itro
ge
n l
eve
l sh
ould
no
t b
e m
ore
tha
n 0
.021
mg
per
litre
, calc
ula
ted
as t
he
ann
ua
l ave
rag
e (
arith
me
tic m
ean
).
a
a
a
Nu
trie
nts
(a)
(i)
Nu
trie
nts
sh
ould
not
be
pre
sen
t in
qu
an
tities s
uff
icie
nt
to c
au
se
exc
essiv
e o
r n
uis
an
ce
gro
wth
of
alg
ae
or
oth
er
aqu
atic p
lan
ts.
(ii)
With
ou
t lim
itin
g t
he
gen
era
lity
of
ob
jective
(i)
ab
ove
, th
e l
eve
l o
f in
org
an
ic
nitro
ge
n s
hou
ld n
ot
exc
ee
d 0
.4 m
g pe
r lit
re,
exp
resse
d a
s an
nu
al
wa
ter
co
lum
n a
ve
rag
e (d
) .
a
a
a

Agre
em
ent
No.
CE
35/2
006(C
E)
Kai T
ak D
evelo
pm
ent
Engin
eeri
ng S
tud
y
cum
Desig
n a
nd C
onstr
uction o
f A
dva
nce W
ork
s
Anne
x A
– I
nvestigation,
Desig
n a
nd C
on
str
uction
KT
AC
and K
TT
S S
tudie
s
7-5
WQ
Os
ap
pli
ca
ble
to
wa
ter
bo
dy w
ith
as
sig
ne
d b
en
efi
cia
l u
se
WQ
O
De
sc
rip
tio
n
BU
1 :
Ba
thin
g
BU
2 :
S
ec
on
da
ry
Co
nta
ct
Re
cre
ati
on
BU
3 :
Ge
ne
ral
Am
en
ity
To
xic s
ubsta
nces (a
) (i
) T
oxi
c s
ub
sta
nce
s i
n t
he
wa
ter
sh
ould
no
t a
tta
in s
uch
le
ve
ls a
s t
o p
rod
uce
sig
nific
an
t to
xic,
ca
rcin
oge
nic
, m
uta
ge
nic
or
tera
tog
en
ic e
ffe
cts
in
hum
ans,
fish
or
an
y
oth
er
aq
ua
tic
org
an
ism
s,
with
d
ue
rega
rd
to
bio
log
ica
lly
cu
mu
lative
eff
ects
in
fo
od
ch
ain
s a
nd
to
in
tera
ctio
ns o
f to
xic s
ubsta
nces w
ith
e
ach o
the
r.
(ii)
Hu
ma
n a
ctivity s
ho
uld
no
t cau
se
a r
isk t
o a
ny b
ene
ficia
l u
se
of
the
aq
ua
tic
en
vir
onm
en
t.
a
a
a
Ba
cte
ria
l
(E.c
oli)
(I)
(b)
Th
e le
ve
l o
f E
sch
erich
ia c
oli
sh
ou
ld n
ot
exc
ee
d 1
80
pe
r 1
00m
L,
calc
ula
ted
as t
he
ge
om
etr
ic m
ea
n o
f a
ll sa
mple
s c
olle
cte
d f
rom
Ma
rch
to
Octo
be
r in
clu
siv
e i
n o
ne
ca
len
da
r ye
ar.
S
am
ple
s s
ho
uld
be
ta
ke
n a
t le
ast
3 t
ime
s i
n a
cale
nda
r m
on
th a
t in
terv
als
of b
etw
ee
n 3
an
d 1
4 d
ays.
a
Ba
cte
ria
l
(E.c
oli.
)
(II)
(c)
Th
e le
ve
l o
f E
sch
erich
ia c
oli
sh
ou
ld n
ot
exc
ee
d 6
10
pe
r 1
00m
L,
calc
ula
ted
as t
he
ge
om
etr
ic m
ea
n o
f all
sa
mp
les c
olle
cte
d in
on
e c
ale
nd
ar
ye
ar.
a
pH
(b)
Th
e p
H o
f th
e w
ate
r sh
ou
ld b
e w
ith
in t
he
ran
ge
of
6.0
– 9
.0 f
or
95
% o
f sa
mple
s.
In
ad
ditio
n,
wa
ste
dis
ch
arg
es s
ha
ll n
ot
cau
se
th
e n
atu
ral p
H r
an
ge
to
be e
xte
nd
ed
by m
ore
th
an
0.5
un
its.
a
Ph
en
ol
(b)
Ph
en
ols
sh
all
no
t b
e p
rese
nt
in s
uch
qu
an
titie
s a
s t
o p
rod
uce
a s
pecific
odo
ur,
or
in c
on
ce
ntr
atio
ns g
rea
ter
than
0.0
5m
g p
er
litre
as C
6H
5O
H.
a
Tu
rbid
ity (b
) N
o
ch
an
ge
s
in
turb
idity
or
oth
er
facto
rs
ari
sin
g
from
w
aste
d
isch
arg
es
sh
all
red
uce
lig
ht tr
ansm
issio
n s
ub
sta
ntia
lly f
rom
the
no
rmal le
vel.
a
(a)
WQ
Os a
ssig
ned for
genera
l uses o
f m
arine w
ate
r in
Vic
toria H
arb
our
WC
Z.
(b)
WQ
Os a
ssig
ned for
bath
ing u
se in o
ther
WC
Zs.
(c)
WQ
Os a
ssig
ned for
secondary
conta
ct re
cre
ation u
se in o
ther
WC
Zs.
(d)
Exp
ressed n
orm
ally
as t
he a
rith
metic m
ean o
f at
least
3 m
easure
ments
at
1m
belo
w s
urf
ace, m
id d
epth
and 1
m a
bove t
he s
eabed. H
ow
ever,
in w
ate
r of
a d
epth
of
5 m
or
less t
he m
ean
shall
be t
hat of 2 m
easure
ments
(1 m
belo
w s
urf
ace a
nd 1
m a
bove s
eabed),
and in w
ate
r of
less than 3
m the 1
m b
elo
w s
urf
ace s
am
ple
shall
apply
.

Agreement No. CE 35/2006(CE) Kai Tak Development Engineering Study Annex A cum Design and Construction of Advance Works KTAC and KTTS Studies – Investigation, Design and Construction
7-6
7.2.4 Major reviews received during the planning review from Stage 1 Public Participation were in favour of retaining KTAC with a view to preserving characteristics water body in the area and enhancing the contact between the people and the Victoria Harbour. There is also request for turning KTAC into a water sports area.
7.2.5 For beneficial uses such as bathing and secondary contact recreation, Table 7.1 sets out
the standard of the water quality requirements. The water quality in particular should meet the target level faecal pollution indicator (E.coli), 610 per 100mL for secondary contact activity (water recreation) and 180 per 100mL for primary contact activity (bathing).
7.2.6 The water quality of KTN, which discharges to KTAC, is monitored by EPD routinely. High
annual geometric mean levels of E.coli were recorded along the KTN, which receives both natural stormwater runoff and THEES effluent, ranging from 39,000 to 53,000 per 100 mL in the upper and middle section of the KTN in 2006. Very high geometric mean concentration was recorded at the outfall of KTN of 580,000 per 100 mL in 2006. High level of E.coli of over 9,000 per 100 mL for annual geometric mean was also recorded in KTTS in 2006.
7.2.7 In the long term, the capacity of the Shatin and Tai Po Sewage Treatment Works (STWs)
would be increased and there would be increase in effluent flow. EPD/DSD are planning to provide disinfection for both the Shatin and Tai Po STWs effluent (disinfection for Shatin STW scheduled for completion in 2008) and there is currently no plan to divert THEES away from KTAC.
7.2.8 Despite the plan for disinfection, the E.coli level of the THEES still cannot meet the standard
for both primary and secondary contact activities. Coupled with the pollution discharges during the low flow condition from various stormwater systems into KTAC, improvement of the water quality standards of KTAC which is suitable for secondary contact activities is a far reaching task unless total diversion/removal of both these pollutant sources can be considered.
7.2.9 In view of the above, the target improvement of water quality of KTAC is first to demonstrate
that there are practical mitigation measures that can improve the water quality standard to amenity use.
7.3 Baseline Conditions
Typhoon Shelters
7.3.1 A summary of the published EPD monitoring data (in 2006) collected from the monitoring stations in the Kwun Tong Typhoon Shelter (VT4) and To Kwa Wan Typhoon Shelter (VT11) is presented in Table 7.2. Marine water quality monitoring is conducted by EPD at the typhoon shelters on a monthly basis. Water samples are taken at three water depths, namely, 1 m below water surface, mid-depth and 1 m above sea bed, except where the water depth is less than 6 m, in which case the mid-depth station may be omitted. Locations of the monitoring stations are shown in Figure 7.2.
Table 7.2 Summary Statistics of Marine Water Quality in the Kwun Tong and To Kwa Wan Typhoon Shelters in 2006
Parameter Kwun Tong VT4
To Kwa Wan VT11
WPCO WQO (in marine waters)
Temperature (oC)
23.9 (17.5 – 28.8)
23.5 (17.2 – 28.6)
Not more than 2 oC in daily
temperature range
Salinity (ppt)
29.3 (23.2 – 31.4)
30.5 (21.8 – 32.7)
Not to cause more than 10% change
Depth average
68 (29 – 112)
83 (56 – 115)
Not available Dissolved Oxygen (DO) (% saturation) Bottom
66 (26 – 110)
84 (54 – 117)
Not available
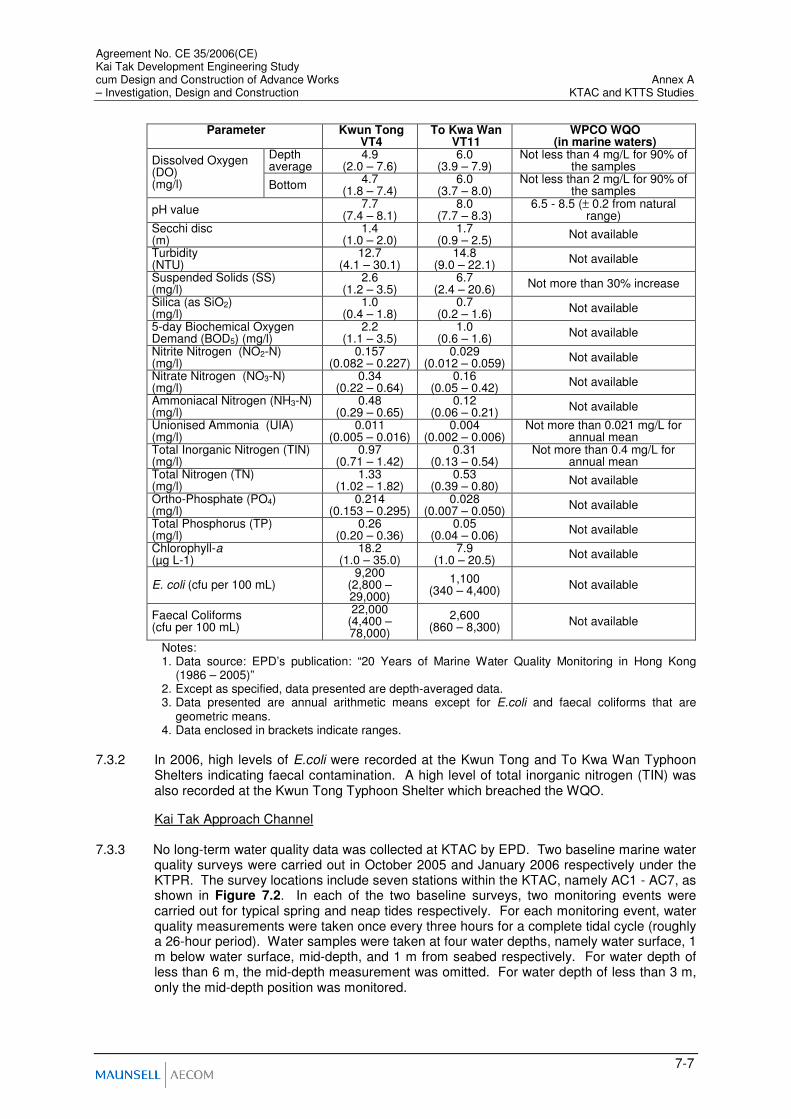
Agreement No. CE 35/2006(CE) Kai Tak Development Engineering Study cum Design and Construction of Advance Works Annex A – Investigation, Design and Construction KTAC and KTTS Studies
7-7
Parameter Kwun Tong VT4
To Kwa Wan VT11
WPCO WQO (in marine waters)
Depth average
4.9 (2.0 – 7.6)
6.0 (3.9 – 7.9)
Not less than 4 mg/L for 90% of the samples
Dissolved Oxygen (DO) (mg/l) Bottom
4.7 (1.8 – 7.4)
6.0 (3.7 – 8.0)
Not less than 2 mg/L for 90% of the samples
pH value 7.7
(7.4 – 8.1) 8.0
(7.7 – 8.3) 6.5 - 8.5 (± 0.2 from natural
range) Secchi disc (m)
1.4 (1.0 – 2.0)
1.7 (0.9 – 2.5)
Not available
Turbidity (NTU)
12.7 (4.1 – 30.1)
14.8 (9.0 – 22.1)
Not available
Suspended Solids (SS) (mg/l)
2.6 (1.2 – 3.5)
6.7 (2.4 – 20.6)
Not more than 30% increase
Silica (as SiO2) (mg/l)
1.0 (0.4 – 1.8)
0.7 (0.2 – 1.6)
Not available
5-day Biochemical Oxygen Demand (BOD5) (mg/l)
2.2 (1.1 – 3.5)
1.0 (0.6 – 1.6)
Not available
Nitrite Nitrogen (NO2-N) (mg/l)
0.157 (0.082 – 0.227)
0.029 (0.012 – 0.059)
Not available
Nitrate Nitrogen (NO3-N) (mg/l)
0.34 (0.22 – 0.64)
0.16 (0.05 – 0.42)
Not available
Ammoniacal Nitrogen (NH3-N) (mg/l)
0.48 (0.29 – 0.65)
0.12 (0.06 – 0.21)
Not available
Unionised Ammonia (UIA) (mg/l)
0.011 (0.005 – 0.016)
0.004 (0.002 – 0.006)
Not more than 0.021 mg/L for annual mean
Total Inorganic Nitrogen (TIN) (mg/l)
0.97 (0.71 – 1.42)
0.31 (0.13 – 0.54)
Not more than 0.4 mg/L for annual mean
Total Nitrogen (TN) (mg/l)
1.33 (1.02 – 1.82)
0.53 (0.39 – 0.80)
Not available
Ortho-Phosphate (PO4) (mg/l)
0.214 (0.153 – 0.295)
0.028 (0.007 – 0.050)
Not available
Total Phosphorus (TP) (mg/l)
0.26 (0.20 – 0.36)
0.05 (0.04 – 0.06)
Not available
Chlorophyll-a (µg L-1)
18.2 (1.0 – 35.0)
7.9 (1.0 – 20.5)
Not available
E. coli (cfu per 100 mL) 9,200
(2,800 – 29,000)
1,100 (340 – 4,400)
Not available
Faecal Coliforms (cfu per 100 mL)
22,000 (4,400 – 78,000)
2,600 (860 – 8,300)
Not available
Notes: 1. Data source: EPD’s publication: “20 Years of Marine Water Quality Monitoring in Hong Kong
(1986 – 2005)” 2. Except as specified, data presented are depth-averaged data. 3. Data presented are annual arithmetic means except for E.coli and faecal coliforms that are
geometric means. 4. Data enclosed in brackets indicate ranges.
7.3.2 In 2006, high levels of E.coli were recorded at the Kwun Tong and To Kwa Wan Typhoon
Shelters indicating faecal contamination. A high level of total inorganic nitrogen (TIN) was also recorded at the Kwun Tong Typhoon Shelter which breached the WQO.
Kai Tak Approach Channel
7.3.3 No long-term water quality data was collected at KTAC by EPD. Two baseline marine water quality surveys were carried out in October 2005 and January 2006 respectively under the KTPR. The survey locations include seven stations within the KTAC, namely AC1 - AC7, as shown in Figure 7.2. In each of the two baseline surveys, two monitoring events were carried out for typical spring and neap tides respectively. For each monitoring event, water quality measurements were taken once every three hours for a complete tidal cycle (roughly a 26-hour period). Water samples were taken at four water depths, namely water surface, 1 m below water surface, mid-depth, and 1 m from seabed respectively. For water depth of less than 6 m, the mid-depth measurement was omitted. For water depth of less than 3 m, only the mid-depth position was monitored.

Agreement No. CE 35/2006(CE) Kai Tak Development Engineering Study Annex A cum Design and Construction of Advance Works KTAC and KTTS Studies – Investigation, Design and Construction
7-8
7.3.4 The field survey results are tabulated in Table 7.3 and Table 7.4 for the two monitoring events respectively. The survey results are presented as averaged concentrations for suspended solids (SS), ammonia nitrogen (NH3-N), total inorganic nitrogen (TIN) and biochemical oxygen demand (BOD) and 10
th percentile values for bottom and depth-
averaged dissolved oxygen (DO). The field data showed a gradient of water quality from the inner KTAC to the outer KTAC. The levels of nitrogen nutrients, ammonia and E.coli were found to be very high in the KTAC. The DO levels breached the WQO in October 2005 but complied well with the WQO in January 2006. The TIN levels exceeded the WQO in KTAC for both dry and wet seasons.
Table 7.3 Pollution Levels Measured at KTAC in October 2005
Mean Depth-
averaged SS
Mean Depth-
averaged NH3-N
Geometric Mean
Depth-averaged
E.coli
Mean Depth-
averaged TIN
Mean Depth-
averaged BOD
10th
Percentile Bottom DO
10th
Percentile Depth-
averaged DO
mg/L mg/L cfu/100mL mg/L mg/L mg/L mg/L
WQO
NA NA NA 0.4 NA 2 4
AC1 25 0.9 115519 3.11 11 0.99 1.48
AC2 28 1.0 17960 3.21 10 0.74 1.18
AC3 19 0.9 60517 3.53 9 1.14 1.47
AC4 20 1.2 37857 3.15 10 0.93 1.33
AC5 21 1.2 28832 3.28 8 1.19 1.54
AC6 26 1.4 34375 2.76 9 0.86 1.41
AC7 27 0.8 15863 2.60 7 2.06 2.20
Bolded and shaded – Exceedance of WQO NA – WQO is not available
Table 7.4 Pollution Levels Measured at KTAC in January 2006
Mean Depth-
averaged SS
Mean Depth-
averaged NH3-N
Geometric Mean
Depth-averaged
E.coli
Mean Depth-
averaged TIN
Mean Depth-
averaged BOD
10th
Percentile Bottom DO
10th
Percentile Depth-
averaged DO
mg/L mg/L cfu/100mL mg/L mg/L mg/L mg/L
WQO
NA NA NA 0.4 NA 2 4
AC1 6 1.6 126945 4.7 10 3.0 5.4
AC2 4 1.5 72689 4.1 7 2.6 3.8
AC3 20 1.6 111217 4.6 11 3.1 5.1
AC4 4 1.3 81229 3.7 7 3.4 5.0
AC5 4 1.7 129380 3.9 10 4.4 6.6
AC6 4 2.2 132126 3.4 9 3.8 4.7
AC7 5 0.9 11833 1.9 5 6.2 5.5
Bolded and shaded – Exceedance of WQO NA – WQO is not available
7.4 Key Findings of the KTPR
Preliminary Assessment
7.4.1 Under the KTPR, various mitigation options were examined for improving the water quality and water circulation of KTAC including:
(1) Diversion of KTN flow into Kowloon Bay which involves construction of pumping station, pipe system and seawall outfall;
(2) Diversion at KTN flow into Victoria Harbour by discharging at the end of Runway which also involves construction of pumping station, pipe system and seawall outfall;

Agreement No. CE 35/2006(CE) Kai Tak Development Engineering Study cum Design and Construction of Advance Works Annex A – Investigation, Design and Construction KTAC and KTTS Studies
7-9
(3) Removal of breakwater of KTTS which necessitates the decommissioning of KTTS;
(4) Introduction of canal(s) or opening(s) in the runway; and
(5) Interception of Dry Weather Flow which involves provision of Dry Weather Flow Interceptors (DWFI) at the stormwater system to divert the low flows to the sewerage system.
7.4.2 Pumping proposal has not been accepted due to large storm flow from a significantly large catchment received by KTN and pump system failure would be detrimental to the surrounding districts and KTD. It is normal practice to provide stormwater pumping scheme for low lying areas which is prone to flooding. Nevertheless, the pollution discharge from various box culverts outfalls into KTAC is also a major source. The pumping scheme can only alleviate the problem partially. Moreover, large piece of land would be required for provision of the pumping system in view of the large volume of flow discharged via the KTN. Also, Method (1) would likely cause deterioration of the water quality of Kowloon Bay. In addition, Method (1) and Method (2) would still leave the KTAC with poor water circulation leading to long term sediment problem.
7.4.3 Removal of breakwater of KTTS would decommission the KTTS. Marine Department has
expressed reservation to the proposal. 7.4.4 Introduction of opening would require careful consideration of the location at runway.
Different location and width of the opening would have different effects. Optimum width and location would be preferable to be demonstrated by water quality modelling to determine the effectiveness of the scheme.
7.4.5 DWFI have already been installed at strategic location of the stormwater system to intercept
pollution sources during low flow condition and divert to the sewerage system. Most drainage catchments, including the catchments of KTN and Jordan Valley Box Culvert (JVBC), already have provision of DWFI at critical locations in the upstream areas. Given the size of the catchments of KTN and JVBC are large as compared with other catchments, the pollutant discharge from KTN and JVBC during low flow condition would be quite significant. Moreover, the outfalls of KTN and JVBC are in submerged condition at all time. Therefore, provision of DWFI at the outfalls of these drainage systems for total removal of pollution loading during dry weather conditions would be difficult. Thus, DWFI facility was not further considered under the KTPR. Nevertheless, additional assessment was conducted under the present Study to examine the engineering feasibility of interception and diversion of the pollution from KTN and JVBC in the tidal downstream sections of the Kai Tak Development area, the potential impacts on the existing sewerage and drainage systems and sewage treatment works, and the need for on-site sewage treatment. Details of the assessment results are presented in Section 8 of this Report.
7.4.6 Five different combinations of the mitigation measures as shown in Table 7.5 were
considered under the KTPR.
Table 7.5 Mitigation Proposals Considered Mitigation Measures Scenario
3 Scenario
4 Scenario
5 Scenario
6 Scenario
7
Partial Diversion of KTN √
Opening a 200 m Gap at the runway immediately south of the taxiway bridge
√
Opening a Large Gap (600m) at the northern end of the runway (north of taxiway bridge)
√ √
Opening two 200 m Gaps at the runway near the mouth of KTN and to the south of the taxiway bridge respectively
√ √
Removal Breakwaters of To Kwa Wan Typhoon Shelter (TKWTS)
√ √

Agreement No. CE 35/2006(CE) Kai Tak Development Engineering Study Annex A cum Design and Construction of Advance Works KTAC and KTTS Studies – Investigation, Design and Construction
7-10
7.4.7 Based on the results of the initial preliminary modelling exercise as mentioned in Section 7.1.9 above, Scenario 7 (opening a 600 m gap at the runway) was considered to be the most practicable and effective option for improving the water quality and circulation at KTAC. Detailed Assessment
7.4.8 As previously mentioned, the initial preliminary water quality modelling was conducted using
an available model developed for the general Victoria Harbour area namely the VH model. The purpose of the preliminary water quality modelling was to determine the most preferred mitigation option for detailed analysis.
7.4.9 The preferred mitigation scenario (opening a 600 m gap at northern end of the runway) as
identified by preliminary water quality modelling was then further tested by a detailed water quality modelling exercise. A detailed fine grid model, namely SEK model, with high resolution at KTAC and Kowloon Bay was developed under the KTPR. The fine grid SEK model was extensively calibrated by field measurements collected within the Study Area under the KTPR and has been confirmed to be able to provide reliable water quality predictions within the Study Area.
7.4.10 The detailed water quality assessment was conducted under the KTPR using the calibrated
fine grid SEK model and an updated pollution loading inventory compiled for the Study Area from actual field measurements. The water quality assessment focused on the KTAC, KTTS, inner Kowloon Bay and To Kwa Wan Typhoon Shelter (TKWTS).
7.4.11 Detailed modelling was carried out for 2 scenarios, namely Scenario I and Scenario II
respectively. Scenario I represents the 2016 baseline situation without implementation of any mitigation measure. Scenario II represents the mitigated scenario in 2016 with a large gap (about 600m) at the northern end of the runway (north of taxiway bridge). The 600 m gap of the runway will be covered by a piled deck structure. The preliminary arrangement of the piled deck structure has been modelled under Scenario II. The results are compared between the two scenarios to assess the effectiveness of the proposed mitigation measures.
7.4.12 The SEK model predicted that the water circulation (in terms of flow velocity and flushing
capacity) would be significantly improved due to the 600 m opening at the runway. The sedimentation rates were also found to be significantly reduced in the KTAC and KTTS due to the increase of the water circulation.
7.4.13 The model results showed that the 600 m opening would improve the water quality at KTAC
and KTTS for all the selected parameters and reduce the overall extent of WQO exceedances within the Study Area. However, the water quality would still breach the water quality objective for water recreation use. The model results also indicated that the water quality at the WSD’s Tai Wan flushing water intake in the outer Kowloon Bay would fully comply with the WSD’s water standards with the 600 m opening at the runway.
7.5 Assessment Methodology
Introduction 7.5.1 Introduction of opening would require careful consideration of the location at runway.
Different locations and width of the opening have been considered under the KTPR as follows:
• Opening a 200 m gap at the runway immediately south of the taxiway bridge
• Opening a large gap (600m) at the northern end of the runway (north of taxiway bridge)
• Opening two 200 m gaps at the runway near the mouth of KTN and to the south of the taxiway bridge respectively

Agreement No. CE 35/2006(CE) Kai Tak Development Engineering Study cum Design and Construction of Advance Works Annex A – Investigation, Design and Construction KTAC and KTTS Studies
7-11
7.5.2 Opening of a large gap (600m) at the runway has been demonstrated by water quality modelling conducted under the KTPR to be the preferred option to improve the water circulation of the KTAC.
7.5.3 Under the KTPR, water quality model simulations were performed for 15 days (excluding the
spin-up time) each under typical wet and dry seasons for each assessment scenario. The EIA Study Brief for the Schedule 3 EIA for the feasibility study of Kai Tak Development requires that the water quality model simulations shall be performed for at least one complete calendar year under operational phase. As such, the water quality effects from the 600 m runway opening have been re-examined under this Study based on a series of 1-year model simulations incorporating monthly variations in Pearl River discharges, solar radiation, water temperature and wind velocity to confirm the findings of the KTPR. Additional sensitivity modelling was also conducted under this Study to examine the feasibility of refining the size of the opening at the northern runway to 400 m.
7.5.4 In addition, the modelling conducted under the KTPR did not take account of the new manoeuvring basin of the proposed cruise terminal at Kai Tak. The hydrodynamic effects of the new manoeuvring basin together with the piled deck structure at the runway opening have been modelled under this Study for cumulative assessment. Assessment Scenarios
7.5.5 Major factors that would affect the water quality simulated would be (i) the change in background pollution loading discharged from storm and sewage outfalls; and (ii) the change in coastline configurations in different time horizons.
7.5.6 Sewage effluent discharged from the Harbour Area Treatment Scheme (HATS) would be the key background pollution source affecting the water quality in Victoria Harbour. Stage 1 of HATS, comprising the Stonecutters Island Sewage Treatment Works (SCISTW) and the deep tunnels, was commissioned in late 2001, which collects sewage from Kwai Chung, Tsing Yi, Tseung Kwan O, parts of eastern Hong Kong Island and all of Kowloon and deliver it to SCISTW for chemically enhanced primary treatment (CEPT). Stage 2 of HATS would be implemented in two phases, namely Stage 2A and Stage 2B. Under Stage 2A, deep tunnels would be built to bring sewage from the northern and western areas of Hong Kong Island to SCISTW and the design capacity of the SCISTW would be expanded to meet the future demands. Stage 2A is currently scheduled for implementation by 2014. Stage 2B of HATS involves the provision of biological treatment at the SCISTW to improve the effluent quality. Stage 2B is tentatively scheduled for implementation by 2021. It should however be highlighted that the way forward of the HATS is still being studied and the timing for implementation of Stage 2B is still subject to review.
7.5.7 Year 2013 scenario is selected as the time horizon for assessment as it represents the late phase of HATS Stage 1 condition before commissioning of HATS Stage 2A. This is a worst-case in terms of the Harbour water quality because the Harbour water would still be impacted by sewage discharged from North Point PTW outfall (close to our Study Area), Wan Chai East PTW outfall, Wan Chai West PTW outfall and Central PTW outfall under Stage 1. Stage 2A would involve decommissioning of these sewage outfalls and diversion of the sewage effluents to the Stonecutters Island STW for CEPT treatment.
7.5.8 With regard to the storm pollution within the KTD area, the loading inventory for 2013 was compiled with reference to the actual measurements conducted in 2005/2006 assuming that there would be no further load reduction in the future. In actuality, the EPD and DSD will continue to remove the pollution sources based on the expedient connection survey results. Thus, it is expected that the storm pollution situations in 2013 would not be worse than the existing conditions. Adopting the 2005/2006 loading survey data for model input under the 2013 scenario would be a conservative approach.

Agreement No. CE 35/2006(CE) Kai Tak Development Engineering Study Annex A cum Design and Construction of Advance Works KTAC and KTTS Studies – Investigation, Design and Construction
7-12
7.5.9 Based on the information on the planned developments from the EIA Reports registered under the EIAO, there would not be any major change in the coastline configuration within Victoria Harbour. The WDII reclamation is currently scheduled to commence in 2009 for completion by 2016. Based on the latest information available from the WDII Planning and Engineering Review, seawall construction for most of the WDII reclamation stages will be completed in 2013. Although there would be some changes at the coastlines of Wan Chai, and North Point as the WDII reclamation proceeds, the change is relatively small and is unlikely to have a major effect on the flow regime at the Kai Tak Development (KTD) area.
7.5.10 Based on the above considerations, year 2013, with the WDII reclamation, represents a worst case in terms of both background pollution discharges and impact on tidal flushing within Victoria Harbour. Year 2013 is therefore selected as the time horizon for operational phase hydrodynamic and water quality modelling for worst-case assessment. Three scenarios were simulated to evaluate the change in hydrodynamic and water quality due to the proposed runway opening:
• Scenario 1A - 2013 Baseline Scenario without any opening at the runway
• Scenario 1B - 2013 Development Scenario with a 400 m opening at the northern end of the runway
• Scenario 1C - 2013 Development Scenario with a 600 m opening at the northern end of the runway
Modelling Tools
7.5.11 The hydrodynamic and water quality modelling platforms were developed by Delft Hydraulics, namely the Delft3D-FLOW and Delft3D-WAQ respectively.
7.5.12 Delft3D-FLOW is a 3-dimensional hydrodynamic simulation programme with applications for coastal, river and estuarine areas. This model calculates non-steady flow and transport phenomena that result from tidal and meteorological forcing on a curvilinear, boundary fitted grid.
7.5.13 Delft3D-WAQ is a water quality model framework for numerical simulation of various physical, biological and chemical processes in 3 dimensions. It solves the advection-diffusion-reaction equation for a predefined computational grid and for a wide range of model substances.
7.5.14 The detailed SEK model developed using Delft3D-FLOW and Delft3D-WAQ has been employed for this modelling exercise. The SEK model was developed under the KTPR and is a cut out from the Update Model. The Update Model is a regional model covering the whole HKSAR waters and the adjacent Mainland waters, which was constructed, calibrated and verified under the EPD Cumulative Effect Study
(4). The SEK Model was refined in KTD
area to give a better representation of the hydrodynamic and water quality conditions. The grid layout of the SEK model has a high resolution of less than 75m by 75m at the KTAC and Kowloon Bay area. There are a total 4 grid cells across the KTAC to resolve transverse variations of the KTAC.
7.5.15 The performance of SEK model has been checked against that of the Update Model. The
model was also extensively calibrated by comparing computational results with the field measurements collected in the KTAC, Kowloon Bay and Victoria Harbour Channel as part of the KTPR. Details of the model setup and verification are described in the “Water Quality Model Calibration and Assessment Final Model Calibration Report” prepared under the KTPR.
(4)
Agreement No. CE 42/97, Update on Cumulative Water Quality and Hydrological Effect of Coastal Developments and Upgrading of Assessment Tool.

Agreement No. CE 35/2006(CE) Kai Tak Development Engineering Study cum Design and Construction of Advance Works Annex A – Investigation, Design and Construction KTAC and KTTS Studies
7-13
7.5.16 The detailed SEK Model is linked to the regional Update Model. Computations were first carried out using the Update Model to provide open boundary conditions to the SEK Model. The Update Model covers the whole Hong Kong and the adjacent Mainland waters including the discharges from Pearl River. The influence on hydrodynamics and water quality in these outer regions would be fully incorporated into the SEK Model.
Pollution Loading 7.5.17 The pollution loading inventory was compiled for Year 2013 for model input. The water
pollution sources within the KTD areas (including KTAC, KTTS and Kowloon Bay) such as urban runoff, expedient connections / cross connections were quantified based on the actual field measurements collected under the KTPR. The methodology for compiling the pollution loading for the KTD areas follows that adopted under the KTPR and is presented in the separate report “Final Water Quality Impact Assessment Report” prepared under the KTPR. It is expected that adequate sewerage will be provided for the planned developments at Kai Tak and the wastewater generated from the new developments at Kai Tak will be diverted to the HATS for treatment and disposal in the western Harbour via a submarine outfall to the south of Tsing Yi Island. It should be noted that the pollution loading inventory represents a worse-case which has not included the effect of any additional interception facilities being considered for KTN and JVBC in Section 8 of this Report.
7.5.18 The estimated 2013 effluent flow for THEES is based on the information provided in the approved EIA report for “Tai Po Sewage Treatment Works Stage 5”. The THEES loading was compiled based on the projected effluent flow and the effluent quality standards at 95 percentile value, which is a conservative assumption. The assumed flow and effluent quality of THEES is provided in Table 7.6.
Table 7.6 Assumed Effluent Flow and Concentrations for THEES
Flow (m
3/day)
BOD5 (mg/L)
TSS (mg/L)
Org-N (mg/L)
NH3-N (mg/L)
Ortho-P (mg/L)
TP (mg/L)
TON (mg/L)
E.coli (no/100mL)
Silicate (mg/L)
426,397(1)
20 (2)
30 (2)
8.85 (2)
7.66 (2)
1.70 (3)
1.93 (3)
11.48 (2)
15,000 (2)
9 (4)
(1) Based on the approved EIA report for Tai Po Sewage Treatment Works Stage 5. (2) Based on discharge license of Sha Tin STW (secondary treatment) at 95 percentile. (3) Average concentration from actual measurement of effluent at STSTW. (4) Average concentration from actual measurements of raw sewage at Sha Tin STW.
7.5.19 The background pollution loading outside the KTD area was estimated for the whole
HKSAR waters by desk-top method and was input to the water quality model for cumulative impact assessment. The inventory incorporates all possible pollution sources within the HKSAR waters including those from landfill sites, marine culture zones, beach facilities and typhoon shelters, non-point source surface run-off and sewage from cross connections etc. The inventory has taken into account the removal of pollutants due to wastewater treatment facilities and the possible redistribution of pollution loads due to different sewage disposal plans and sewage export schemes. The methodologies for compiling the pollution loading are given in Appendix 7.1.
7.5.20 To take account of the key background pollution loading for cumulative assessment, pollution loading from the HATS was considered separately. Chemically enhanced primary treatment (CEPT) with disinfection is assumed as the treatment process of HATS in this Study for water quality modelling which involves a discharge of effluent at the existing Stonecutters Island Sewage Treatment Works (SCISTW). The HATS loading assumed in this EIA is given in Table 7.7.

Agreement No. CE 35/2006(CE) Kai Tak Development Engineering Study Annex A cum Design and Construction of Advance Works KTAC and KTTS Studies – Investigation, Design and Construction
7-14
Table 7.7 Pollution Loading from Stonecutters Sewage Treatment Works under HATS
2013 Scenario (HATS Stage 1) Parameters
Assumed Concentration Assumed Flow and Loads
Flow rate - 1,540,000m3/day
(1)
BOD5 68mg/l (2)
190400000 g/day
SS 42mg/l (2)
117600000 g/day
Organic Nitrogen 9.93mg/l (2)
2780400 g/day
NH3-N 17.43mg/l (2)
48804000 g/day
E. coli 200,000no./100ml (2)
5.6E+14no./day
Total Phosphorus 3mg/l (2)
8400000 g/day
Ortho-Phosphate 1.8mg/l (2)
5040000 g/day
Silicate 8.6mg/l (2)
24080000 g/day
Total nitrite and nitrate 0mg/l (2)
0 g/day Notes: (1) The projected flow rate for 2013 was estimated using the latest planning and employment
statistics as detailed in Appendix 7.1. (2) Based on the “Environmental and Engineering Feasibility Assessment Studies in Relation
to the Way Forward of the Harbour Area Treatment Scheme (HATS EEFS) Final Study Report”.
Pile Frictions
7.5.21 Marine piles would be installed at the opening under the 2013 mitigated scenarios. The preliminary arrangement of the piled deck structure adopted under the KTPR is also assumed in this modelling exercise.
7.5.22 The presence of the marine piles may reduce the flushing of the water channel and thus
impact upon the water quality. As the dimensions of the marine piles are much smaller than the grid size, the exact pier configurations cannot be adopted in the model simulation. Instead, only the overall influence of the piles on the flow was taken account. This overall influence was modelled by a special feature of the Delft3D-FLOW model, namely porous plate. Porous plates represent transparent structures in the model and are placed along the model gridline where momentum can still be exchanged across the plates. The porosity of the plates is controlled by a quadratic friction term in the momentum to simulate the energy losses due to the presence of the piles. The forces on the flow due to a vertical pile or series of piles are used to determine the magnitude of the energy loss terms. The mathematical expressions for representation of piles friction were based on the Cross Border Link Study
(5) and the Delft 3D-FLOW module developed by Delft Hydraulics.
Simulation Periods
7.5.23 For each assessment scenario, the simulation period of the hydrodynamic model covers two 15-day full spring-neap cycles (excluding the spin-up period) for dry and wet seasons respectively. The hydrodynamic results are used repeatedly to drive the water quality simulations for one complete calendar year (excluding the spin-up period). A spin-up period of 23 days and 45 days is provided for hydrodynamic simulation and water quality simulation respectively. These spin-up periods were tested under the KTPR to be sufficient.
(5)
Planning Department Agreement No. CE48/97 Feasibility Study for Additional Cross-border Links Stage 2: Investigations on Environment, Ecology, Land Use Planning, Land Acquisition, Economic/Financial Viability and Preliminary Project Feasibility/Preliminary Design Final Water Quality Impact Assessment Working Paper WP2 Volume 1 1999.

Agreement No. CE 35/2006(CE) Kai Tak Development Engineering Study cum Design and Construction of Advance Works Annex A – Investigation, Design and Construction KTAC and KTTS Studies
7-15
7.6 Prediction and Evaluation Hydrodynamics
7.6.1 The hydrodynamic modelling results are presented in Appendix 7.2 as vector plots for flood and ebb tides for both dry season and wet season. The time-series plots for current magnitudes are presented in Appendix 7.3 for KTAC (Stations AC2, AC4, AC6 and AC7), KTTS (Station VT4) and TKWTS (Station VT11). The model plots show that opening a large gap at the runway would cause an increase in the flow velocity in the approach channel and KTTS. The flow pattern at the approach channel and KTTS is similar between Scenario 1B (with 400 m opening at the runway) and Scenario 1C (with 600 m opening at the runway). There are no assessment criteria available for current velocity and hydrodynamic impact.
Water Quality 7.6.2 The model results are also presented in Appendix 7.4 as contour plots for DO, TIN, UIA,
NH3-N, E.coli, BOD, SS and sedimentation rate. The contour plots are presented as annual arithmetic averages for TIN, NH3-N, SS and BOD and annual geometric means for E.coli. The contour plots for DO are presented as 10
th percentile depth-averaged values, 10
th
percentile bottom values, annual mean depth-averaged values and annual mean bottom values. The results for sedimentation rate are presented as both maximum and mean values over the simulation period. Each figure attached in Appendix 7.4 contains three plots. The upper plot shows the model output for 2013 baseline scenario without any opening at the runway whereas the middle and the lower plots show the model output for 2013 mitigated scenarios with 400m opening and 600m opening at the runway respectively. Table 7.8 tabulates the predicted water quality at selected indicator points in KTAC, KTTS and TKWTS.

A
gre
em
ent
No.
CE
35/2
006(C
E)
K
ai T
ak D
evelo
pm
ent
Engin
eeri
ng S
tud
y
Anne
x A
cum
Desig
n a
nd C
onstr
uction o
f A
dva
nce W
ork
s
KT
AC
an
d K
TT
S S
tudie
s
– I
nvestigation,
Desig
n a
nd C
on
str
uction
7-1
6
Tab
le 7
.8
Pre
dic
ted
Wate
r Q
uality
at
Ind
icato
r P
oin
ts
Up
pe
r K
TA
C
Mid
dle
KT
AC
L
ow
er
KT
AC
K
TT
S
TK
WT
S
Parameters S
ce
na
rio
A
C2
A
C4
A
C6
A
C7
K
T1
IB
2
WP
CO
W
QO
1A
– B
ase
line
Con
ditio
n
<0
.01
<
0.0
1
0.3
5
0.6
2
2.9
8
5.9
5
1B
- W
ith 4
00
m O
pe
nin
g a
t th
e r
un
wa
y
4.3
4
4.6
6
4.6
7
4.6
7
5.0
2
5.2
7
Me
an
Bo
tto
m D
O (
mg
/L)
1C
- W
ith 6
00m
Op
en
ing
at
the
ru
nw
ay
4.3
8
4.8
3
4.9
6
4.9
8
5.2
8
5.2
4
N/A
1A
– B
ase
line
Con
ditio
n
<0
.01
<
0.0
1
<0
.01
<
0.0
1
0.8
9
4.6
8
1B
- W
ith 4
00
m O
pe
nin
g a
t th
e r
un
wa
y
2.3
8
2.6
4
2.4
5
2.3
5
2.6
1
4.1
5
10
%ile
Bo
tto
m D
O (
mg
/L)
1C
- W
ith 6
00m
Op
en
ing
at
the
ru
nw
ay
2.2
8
2.7
3
2.8
0
2.7
8
3.0
8
4.0
6
2
1A
– B
ase
line
Con
ditio
n
0.1
3
0.1
7
0.3
3
0.5
7
3.1
1
6.0
1
1B
- W
ith 4
00
m O
pe
nin
g a
t th
e r
un
wa
y
4.6
6
4.8
0
4.7
7
4.7
8
5.1
1
5.3
8
Me
an
De
pth
-ave
rag
ed
DO
(m
g/L
)
1C
- W
ith 6
00m
Op
en
ing
at
the
ru
nw
ay
4.7
3
4.9
7
5.0
5
5.0
7
5.3
5
5.3
5
N/A
1A
– B
ase
line
Con
ditio
n
<0
.01
<
0.0
1
<0
.01
<
0.0
1
0.7
6
4.8
4
1B
- W
ith 4
00
m O
pe
nin
g a
t th
e r
un
wa
y
2.6
3
2.6
5
2.5
0
2.4
6
2.7
3
4.0
3
10
%ile
De
pth
-ave
rag
ed
DO
(m
g/L
)
1C
- W
ith 6
00m
Op
en
ing
at
the
ru
nw
ay
2.6
3
2.8
4
2.8
7
2.8
8
3.1
5
4.1
1
4
1A
– B
ase
line
Con
ditio
n
58
90
21
3
71
147
2
45
688
1
76
498
1
51
41
10
05
1
B -
With
400
m O
pe
nin
g a
t th
e r
un
wa
y
22
43
26
7
81
71
31
05
3
21
22
5
53
95
1
60
67
De
pth
-ave
rag
ed
E.c
oli
(no
pe
r 1
00
mL
)
1C
- W
ith 6
00m
Op
en
ing
at
the
ru
nw
ay
22
81
07
7
63
15
23
03
9
14
99
4
45
87
1
69
11
N/A
1A
– B
ase
line
Con
ditio
n
0.0
64
0
.06
8
0.0
70
0
.06
9
0.0
45
0
.00
6
1B
- W
ith 4
00
m O
pe
nin
g a
t th
e r
un
wa
y
0.0
32
0
.02
7
0.0
25
0
.02
4
0.0
16
0
.01
4
De
pth
-ave
rag
ed
UIA
(m
g/L
)
1C
- W
ith 6
00m
Op
en
ing
at
the
ru
nw
ay
0.0
31
0
.02
4
0.0
20
0
.01
9
0.0
13
0
.01
4
0.0
21
1A
– B
ase
line
Con
ditio
n
8.6
91
7
.88
3
7.0
33
6
.52
8
3.0
96
0
.43
2
1B
- W
ith 4
00
m O
pe
nin
g a
t th
e r
un
wa
y
2.8
39
2
.00
3
1.7
57
1
.67
9
1.0
68
1
.11
7
De
pth
-ave
rag
ed
TIN
(mg
/L)
1C
- W
ith 6
00m
Op
en
ing
at
the
ru
nw
ay
2.8
13
1
.82
6
1.4
23
1
.35
7
0.8
96
1
.12
8
0.4
1A
– B
ase
line
Con
ditio
n
86
7
1
59
5
2
21
6
1B
- W
ith 4
00
m O
pe
nin
g a
t th
e r
un
wa
y
24
1
8
16
1
5
10
1
0
De
pth
-ave
rag
ed
SS
(m
g/L
)
1C
- W
ith 6
00m
Op
en
ing
at
the
ru
nw
ay
25
1
7
14
1
3
9
10
N/A
1A
– B
ase
line
Con
ditio
n
0.4
00
0
.06
9
1.5
30
6
0.3
24
4
.10
7
1.2
98
1
B -
With
400
m O
pe
nin
g a
t th
e r
un
wa
y
0.0
45
0
.01
1
0.3
36
0
.06
6
2.2
06
2
.33
1
Me
an
Se
dim
en
tatio
n F
lux
(g/m
2/d
ay)
1C
- W
ith 6
00m
Op
en
ing
at
the
ru
nw
ay
0.0
49
0
.01
3
0.2
29
0
.05
0
1.8
22
2
.49
5
N/A
1A
– B
ase
line
Con
ditio
n
32
.642
1
6.7
96
3
6.5
44
1
8.3
70
4
6.0
90
5
.49
2
1B
- W
ith 4
00m
Openin
g a
t th
e r
unw
ay
6.8
56
4.1
41
14.0
33
7.1
57
23.3
47
14.7
47
Ma
xim
um
Se
dim
en
tation
Flu
x (g
/m2/d
ay)
1C
- W
ith 6
00m
Openin
g a
t th
e r
unw
ay
6.3
30
3.0
37
10.0
28
5.6
12
17.3
17
18.4
76
N/A
No
te:
Bo
lde
d a
nd S
ha
de
d -
Exc
ee
da
nce
of W
QO
.
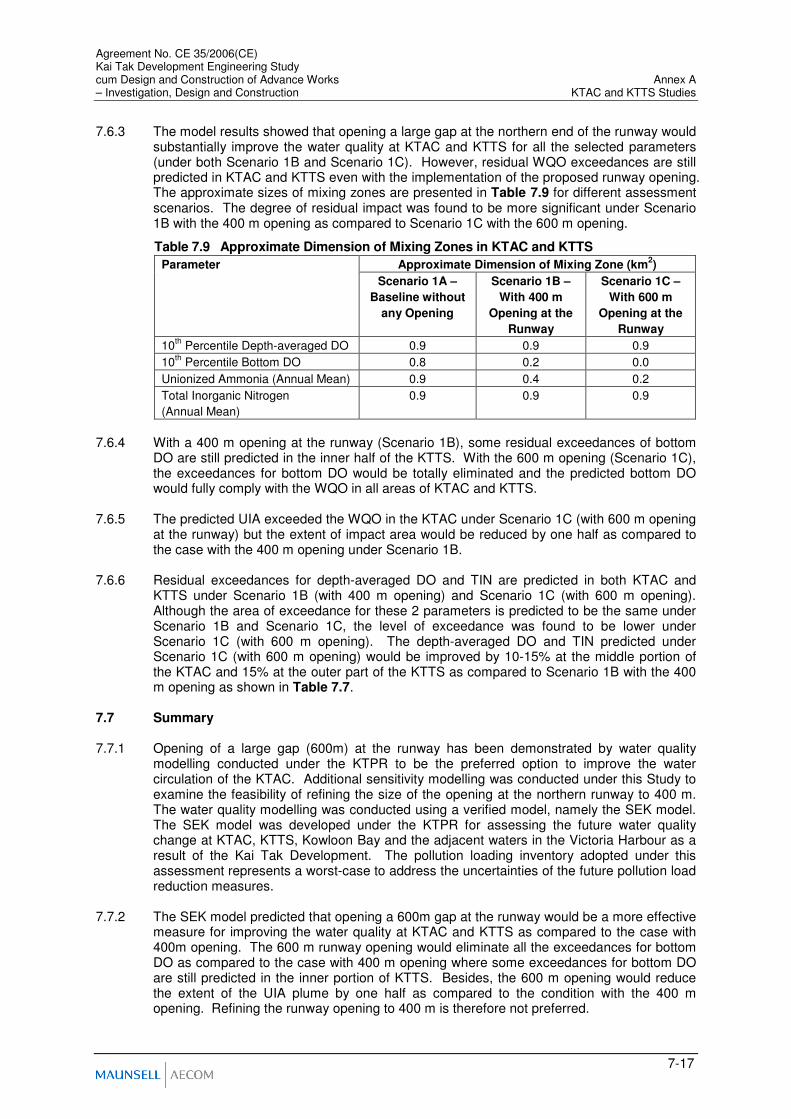
Agreement No. CE 35/2006(CE) Kai Tak Development Engineering Study cum Design and Construction of Advance Works Annex A – Investigation, Design and Construction KTAC and KTTS Studies
7-17
7.6.3 The model results showed that opening a large gap at the northern end of the runway would substantially improve the water quality at KTAC and KTTS for all the selected parameters (under both Scenario 1B and Scenario 1C). However, residual WQO exceedances are still predicted in KTAC and KTTS even with the implementation of the proposed runway opening. The approximate sizes of mixing zones are presented in Table 7.9 for different assessment scenarios. The degree of residual impact was found to be more significant under Scenario 1B with the 400 m opening as compared to Scenario 1C with the 600 m opening.
Table 7.9 Approximate Dimension of Mixing Zones in KTAC and KTTS
Approximate Dimension of Mixing Zone (km2) Parameter
Scenario 1A –
Baseline without
any Opening
Scenario 1B –
With 400 m
Opening at the
Runway
Scenario 1C –
With 600 m
Opening at the
Runway
10th
Percentile Depth-averaged DO 0.9 0.9 0.9
10th
Percentile Bottom DO 0.8 0.2 0.0
Unionized Ammonia (Annual Mean) 0.9 0.4 0.2
Total Inorganic Nitrogen
(Annual Mean)
0.9 0.9 0.9
7.6.4 With a 400 m opening at the runway (Scenario 1B), some residual exceedances of bottom
DO are still predicted in the inner half of the KTTS. With the 600 m opening (Scenario 1C), the exceedances for bottom DO would be totally eliminated and the predicted bottom DO would fully comply with the WQO in all areas of KTAC and KTTS.
7.6.5 The predicted UIA exceeded the WQO in the KTAC under Scenario 1C (with 600 m opening
at the runway) but the extent of impact area would be reduced by one half as compared to the case with the 400 m opening under Scenario 1B.
7.6.6 Residual exceedances for depth-averaged DO and TIN are predicted in both KTAC and
KTTS under Scenario 1B (with 400 m opening) and Scenario 1C (with 600 m opening). Although the area of exceedance for these 2 parameters is predicted to be the same under Scenario 1B and Scenario 1C, the level of exceedance was found to be lower under Scenario 1C (with 600 m opening). The depth-averaged DO and TIN predicted under Scenario 1C (with 600 m opening) would be improved by 10-15% at the middle portion of the KTAC and 15% at the outer part of the KTTS as compared to Scenario 1B with the 400 m opening as shown in Table 7.7.
7.7 Summary 7.7.1 Opening of a large gap (600m) at the runway has been demonstrated by water quality
modelling conducted under the KTPR to be the preferred option to improve the water circulation of the KTAC. Additional sensitivity modelling was conducted under this Study to examine the feasibility of refining the size of the opening at the northern runway to 400 m. The water quality modelling was conducted using a verified model, namely the SEK model. The SEK model was developed under the KTPR for assessing the future water quality change at KTAC, KTTS, Kowloon Bay and the adjacent waters in the Victoria Harbour as a result of the Kai Tak Development. The pollution loading inventory adopted under this assessment represents a worst-case to address the uncertainties of the future pollution load reduction measures.
7.7.2 The SEK model predicted that opening a 600m gap at the runway would be a more effective
measure for improving the water quality at KTAC and KTTS as compared to the case with 400m opening. The 600 m runway opening would eliminate all the exceedances for bottom DO as compared to the case with 400 m opening where some exceedances for bottom DO are still predicted in the inner portion of KTTS. Besides, the 600 m opening would reduce the extent of the UIA plume by one half as compared to the condition with the 400 m opening. Refining the runway opening to 400 m is therefore not preferred.

Agreement No. CE 35/2006(CE) Kai Tak Development Engineering Study Annex A cum Design and Construction of Advance Works KTAC and KTTS Studies – Investigation, Design and Construction
7-18

Agreement No. CE 35/2006(CE) Kai Tak Development Engineering Study cum Design and Construction of Advance Works – Annex A Investigation, Design and Construction KTAC and KTTS Studies
8-1
8 CONTAINMENT OF POLLUTION ENTERING KTAC AND KTTS
8.1 Introduction
Background
8.1.1 Kai Tak Approach Channel (KTAC) is a semi-enclosed water body bounded by the ex-airport runway in the west and the breakwaters of the Kwun Tong Typhoon Shelter (KTTS) in the south. The relatively long and narrow shape of KTAC, together with the presence of a pair of breakwaters for KTTS at its outlet has severely constrained the water circulation in this marine channel.
8.1.2 In addition, KTAC receives stormwater runoff from several large drainage sub-catchments of East Kowloon including Wong Tai Sin, San Po Kong, Kowloon Bay, Jordan Valley and Kwun Tong. It is believed that sewage from the expedient connections and other polluted flows such as the street-washing water in the sub-catchment areas have found their way to enter the stormwater systems, thereby leading to environmental problem of KTAC and KTTS. The main pollution contributors are Kai Tak Nullah (KTN) and Jordan Valley Box Culvert (JVBC) based on the findings of “SEKD Comprehensive Planning and Engineering Review – Stage 1: Planning Review”.
8.1.3 EPD is currently carrying out investigations to identify the expedient connections and misconnections in this area in order to provide information for planning and implementation of the rectification works.
8.1.4 Containment of pollution in drainage systems entering the KTAC and KTTS by interception facilities is one of the mitigation proposals to address the environmental problem of KTAC and KTTS until the ultimate removal of the pollution sources. The required interception would be in the form of a dry weather flow interceptor (DWFI) of permanent nature adopting the latest technology and also effective in solving the problems encountered in the existing DWFIs.
8.1.5 Desilting operations carried out by DSD in the box culverts would control the grits from stormwater runoffs and the sediments from seawater accumulating in KTN and JVBC.
8.2 Review of Previous and On-Going Relevant Project
Introduction
8.2.1 Following the recommendations of Review of Central and East Kowloon Sewerage Master Plans (RCEKSMP) and SEKD Comprehensive Planning and Engineering Review – Stage 1: Planning Review (SEKDPR), a series of studies have been or are being conducted to improve the environmental problems of KTAC and KTTS. The relevant studies as listed in Table 8.1 are reviewed in order to identify the assessment basis for this section.
Table 8.1 Relevant Projects Reviewed Item Title Year Prepared by
1 Agreement No. CE 25/98
Review of Central and East Kowloon Sewerage Master Plans
• Final Report
2003 Hyder Consulting Ltd.
2 Agreement No. CE 61/2006 (DS) – Upgrading of Central and East Kowloon Sewerage – Investigation, Design and Construction
On-going Atkins China Ltd.
3 Agreement No. CE 4/2004 (TP)
South East Kowloon Development (SEKD) Comprehensive Planning and Engineering Review – Stage 1: Planning Review
2006 City Planning – Maunsell Joint Venture

Agreement No. CE 35/2006(CE) Kai Tak Development Engineering Study
Annex A cum Design and Construction of Advance Works – KTAC and KTTS Studies Investigation, Design and Construction
8-2
Item Title Year Prepared by
• Technical Report No. TR4E - Preliminary Drainage and Sewerage Assessments
• Pollution Loading Inventory Survey Report
• Water Quality Impact Assessment
4 File Ref. LDC 7/4/14
Report on Preliminary Feasibility Study on Engineering Solutions to Intercept Dry Weather Flow in Jordan Valley Box Culvert
2007 Drainage Services Department
5 Tender Ref. IP 07-001
Study on the Control of Water Pollution at Jordan Valley Box Culvert
On-going Scott Wilson Ltd.
6 Tender Ref. IP 06-074
Kai Tak Approach Channel – Expedient Connection Survey
On-going Pypun Engineering Consultants Ltd.
Review of Central and East Kowloon Sewerage Master Plans (RCEKSMP)
8.2.2 The main objective of the RCEKSMP was to review and update the Central and East Kowloon Sewerage Master Plan for the control of water pollution in the Central and East Kowloon area, with the provision of adequate sewerage, sewage treatment and disposal facilities for planning horizon up to Year 2016 and ultimate scenario. The RCEKSMP also investigated and identified the expedient connections to the stormwater drains and watercourses and recommended mitigation measures to these expedient connections.
8.2.3 It was reported that the DWFIs in the Study Area were capable to intercept 13.5 t/d of BOD5, to protect the KTAC against pollution. The RCEKSMP hence concluded that the DWFIs would need to be retained until the pollution in the stormwater systems reducing to acceptable levels. Two of the DWFIs, namely Kowloon Bay Pumping Station DWFI and Ngau Tau Kok DWFI, were installed to intercept the upstream dry weather flow in the JVBC. Four DWFIs were installed to intercept the polluted flow at the upstream area of Kai Tak Nullah, including Kai Tak Pumping Stations No. 1 and 2, Tai Hum Chuen Pumping Chamber and San Po Kong Pumping Station.
8.2.4 To reduce the amount of stormwater being intercepted and diverted into the foul sewer, the Review proposed to introduce controls to restrict the flow at certain DWFIs. Additional level controls are proposed at the pumped DWFIs to limit or shut-off the stations during times of high flow.
8.2.5 Kwun Tong and To Kwa Wan Preliminary Treatment Works (KTPTW and TKWPTW) were two PTWs in the Central and East Kowloon area, and their design capacities were 10.93m
3/s and 9.32m
3/s respectively. The RCEKSMP concluded that the capacity of
KTPTW would be exceeded in Year 2016 and beyond, and identified an area of approximately 15ha in the south-east of existing KTPTW for future expansion. The RCEKSMP also concluded that the capacities of TKWPTW would be marginally inadequate, and an area of 0.4ha adjacent to the PTW was reserved for future extension.
Upgrading of Central and East Kowloon Sewerage (UCEKS)
8.2.6 This UCEKS project is to implement the recommended sewerage upgrading works within the Central and East Kowloon areas to cater for the planned and forecast developments and population changes as recommended in RCEKSMP.

Agreement No. CE 35/2006(CE) Kai Tak Development Engineering Study cum Design and Construction of Advance Works – Annex A Investigation, Design and Construction KTAC and KTTS Studies
8-3
8.2.7 Besides upgrading and construction of about 17km long sewers and associated sewerage works, the proposed works also include upgrading of 8 nos. of existing DWFIs and review of the need for upgrading other DWFIs in Central and East Kowloon. The construction works for the project is tentatively scheduled for commencement in or before December 2008 and for completion before September 2014. The existing DWFIs, which are covered under the above proposed upgrading works, are listed in Table 8.2.
Table 8.2 List of Existing DWFIs Under Proposed Upgrading Works
DWFI No. Name
(Location) Drainage Catchment
DWFI 1 Kai Tak Pumping Station No. 1 DWFI
(Concorde Road and Prince Edward Road East)
KTN
DWFI 2 Kai Tak Pumping Station No. 2 DWFI
(Yuk Kwan Street)
KTN
DWFI 3 Haiphong Road DWFI
(Tsim Sha Tsui)
-
DWFI 6 Ma Tau Kok Screening Plant DWFI
(To Kwa Wan)
-
DWFI 10 Tai Hum Chuen Pumping Chamber
(San Po Kong)
KTN
DWFI 11 Ngau Tau Kok Pumping Chamber
(Lower Ngau Tau Kok Estate)
JVBC
DWFI 16 Hoi Bun Road Control Structure 4A
(Kwun Tong)
-
DWFI 17 Kowloon Bay DWFI
(Kowloon Bay)
JVBC
8.2.8 Under the UCKES project, in addition to 8 nos. existing DWFIs, the remaining existing
DWFIs in the Central and East Kowloon area will be reviewed to investigate and recommend any necessary measures or modification works for the existing DWFIs and the associated dry weather flow pumping stations with a view to improve their operations on interception of the sewage flow and limit the amount of stormwater inflow intercepted to the foul sewerage system during storm events. It is expected that the existing DWFIs at the upstream of KTN and JVBC can effectively control the polluted flows after upgrading.
SEKD Comprehensive Planning and Engineering Review – Stage 1: Planning Review (SEKDPR)
8.2.9 One of the main objectives of this SEKDPR was to assess the drainage and sewerage impacts on the existing and planned drainage and sewerage infrastructures due to the Kai Tak Development (KTD) according to the draft Preliminary Outline Development Plan (PODP). Furthermore, it reviewed the capacity of KTPTW and TKWPTW and recommended the preliminary drainage and sewerage schemes to serve KTD.
8.2.10 For drainage impact, since no reclamation is adopted in the PODP, no additional catchment area would contribute to the KTD area. In the SEKDPR, an independent drainage system is proposed for KTD with no additional contribution to existing drainage system except for KTN. Hence, no adverse drainage impact to the hinterland due to KTD was identified except for KTN. The proposed solution to the above impact to KTN would involve construction of new outfalls as well as decking of the KTN within KTD. The relevant upgrading works will upgrade open nullah in the KTD area to a 14-cell box culvert, each cell of 5m wide and 4.5m high connecting to KTAC. The KTN is designed to carry 1 in 200 year rainstorm.
8.2.11 JVBC is an existing 7-cell box culvert of 4.12m wide and 3.8m high in Kowloon Bay area. Based on the assessment, no upgrading works were proposed under East Kowloon Drainage Improvement.

Agreement No. CE 35/2006(CE) Kai Tak Development Engineering Study
Annex A cum Design and Construction of Advance Works – KTAC and KTTS Studies Investigation, Design and Construction
8-4
8.2.12 Sewerage impact due to the proposed KTD should be insignificant. In view of the proposed development in KTD area, the projected sewage flow generated from the study area is approximate 66,403m
3/day. The sewerage impact assessment conducted under SEKDPR
showed that KTPTW and HATS Tunnel would not have sufficient capacity to handle the flow from KTD. It is important to check with EPD and DSD for any planned upgrading works to TKWPTW and KTPTW in the near future.
8.2.13 The existing DWFIs were also reviewed in the above assignment, and it indicated that existing DWFIs were effective to control the polluted storm flows to be discharged to the KTAC and the Victoria Harbour. They were required to be retained until the pollution could be removed or at least reduced to an acceptable level. It is recommended that regular maintenance of these DWFIs was required to avoid siltation, and the design of these DWFIs should be reviewed for exploring the feasibility to increase the quantity of interception.
8.2.14 In order to assess the water quality condition of KTAC, a comprehensive water quality sampling was carried out at the drainage outlets of KTAC and Kowloon Bay to provide reliable hydrodynamic and water quality data for the water quality modeling analysis. The water quality survey results are shown in the following Table 8.3.
Table 8.3(a) Distribution of Pollution Loads in KTAC and Kowloon Bay
SS NH3-N TKN BOD Location
g/day % g/day % g/day % g/day %
JVBC 1,508,027 6.7% 545,758 29.7% 1,002,504 23.9% 2,354,622 16.5%
KTN(1)
14,841,584 65.9% 587,024 32.0% 1,775,031 42.2% 7,636,903 53.4%
THEES(1)
2,714,009 12.0% 376,749 20.5% 745,543 17.7% 1,561,813 10.9%
SWTBC 407,158 1.8% 4,186 0.2% 8,886 0.2% 95,340 0.7%
Other Outfalls
3,057,203 13.6% 320,926 17.5% 670,414 16.0% 2
,651,493 18.5%
Total 22,527,981 100% 1,834,643 100% 4,202,378 100% 14,300,171 100%
Table 8.3(b) Distribution of Pollution Loads in KTAC and Kowloon Bay
E.coli TP Ortho-P Silicate Location
counts/day % g/day % g/day % g/day %
JVBC 1.61E+15 10.2% 88,883 9.0% 55,145 7.4% 538,562 10.5%
KTN(1)
1.22E+16 77.6% 329,882 33.3% 325,252 43.7% 1,435,938 28.0%
THEES(1)
9.30E+13 0.6% 489,022 49.4% 313,942 42.2% 2,738,283 53.4%
SWTBC 1.43E+13 0.1% 1266 0.1% 459 0.1% 8,781 0.2%
Other Outfalls
1.78E+15 11.5% 80,534 8.1% 49,470 6.6% 410,375 8.0%
Total 1.57E+16 100% 989,587 100% 744,268 100% 5,131,939 100%
Notes: (1) Source: Pollution Loading Inventory Report under SEKDPR. (2) Contribution percentage of dry weather flow from KTN and THEES discharge is based on
the survey flow and load data obtained in SEKDPR, and the lowest monthly average effluent value measured at Shatin and Tai Po STWs between November 2004 and October 2005.
8.2.15 The above pollution loading distribution in KTAC and Kowloon Bay indicates that KTN and
JVBC contributed the largest amount of total pollution loading discharged into the marine water of the above area. Although there are existing DWFIs intercepting the dry weather flow along KTN and JVBC, it is considered inadequate as a large amount of pollution loadings still running into KTAC and continuously deteriorating water quality.

Agreement No. CE 35/2006(CE) Kai Tak Development Engineering Study cum Design and Construction of Advance Works – Annex A Investigation, Design and Construction KTAC and KTTS Studies
8-5
8.2.16 Based on the flow and loads surveys, various mitigation options were reviewed in the Water Quality Impact Assessment to assess their effectiveness for improving the water quality and water circulation of KTAC, which included:-
1. Diversion of KTN flow into Kowloon Bay which involves construction of pumping station, piping system and seawall outfall;
2. Diversion at KTN flow into Victoria Harbour by discharging at the end of ex-runway which also involves construction of pumping station, piping system and seawall outfall;
3. Removal of breakwater of KTTS which necessitates the decommissioning of KTTS;
4. Introduction of canal(s) or opening(s) in the runway;
5. Interception of Dry Weather Flow which involves provision of Dry Weather Flow Interceptors (DWFI) at the stormwater system to divert the low flows to the sewerage system.
8.2.17 Water quality model assessments were conducted to evaluate the effectiveness of alternative mitigation measures on improving the water quality in KTAC and KTTS. Based on the water quality model results, the provision of a “600m opening at the runway” was identified as the optimum option. It was predicted that the water circulation (in terms of flow velocity and flushing capacity) of the KTAC and KTTS would be significantly improved. The sedimentation rates were also found to be significantly reduced. However, it is found that the 600m opening of the ex-runway would deteriorate the water quality in Kowloon Bay, and the water quality in the Study Area would still breach the water quality objective for water recreation use.
Preliminary Feasibility Study on Engineering Solutions to Intercept Dry Weather Flow in JVBC
8.2.18 The purpose of this Study is to investigate and identify alternative feasible engineering solutions to intercept the polluted dry weather flow in JVBC, aiming to reduce pollutant discharge to KTAC. The proposed interception scheme was an interim measure before the upstream expedient connections could be completely identified and rectified.
8.2.19 It is noted that two existing DWFIs, namely Ngau Tau Kok DWFI (DWFI 11) and Kowloon Bay DWFI (DWFI 17), were installed at the upstream to intercept the pollution flow discharging into JVBC. The pollution was coming from the Kowloon Bay Industrial Area and discharges at the downstream of existing DWFIs. It is also considered that the duties of existing DWFIs could be taken up by a single DWFI at JVBC downstream if its construction was feasible.
8.2.20 Conventional weir was found not suitable for intercepting dry weather flow from JVBC because of tidal influence. Otherwise, JVBC would face unacceptable adverse drainage impact.
8.2.21 It apparently showed that removing the pollution at source would be a more appropriate and economical solution, which however, could not be achieved at JVCB at this stage. The study then recommended removing the pollution discharge from JVBC by two key processes: interception and disposal of wastewater. Interception is to collect the polluted dry weather flow which enters the JVBC and re-divert it back to the sewerage system or away from the KTAC during non-rainy days for disposal. In this way water pollution and odour problems in KTAC contributed by the polluted flow in JVBC could be mitigated. Prior to giving measures for reducing pollutants to the KTAC, the following engineering constraints were identified in view of the site conditions at JVBC:-
1. Tidal Submersion – large amount of seawater would be intercepted with polluted water;
2. Limited capacity of sewerage systems – bottle-neck at the conveyance pipelines and downstream treatment facilities, thus system upgrading is required;

Agreement No. CE 35/2006(CE) Kai Tak Development Engineering Study
Annex A cum Design and Construction of Advance Works – KTAC and KTTS Studies Investigation, Design and Construction
8-6
3. Level Mis-match – the stormwater drainage system is often deeper that the sewerage system, and pumping may be required for conveyance of dry weather flow to sewerage system; and
4. Flood Prevention – risk of flooding may be increased in view of installation of tidal barrier/weir for interception of dry weather flow.
8.2.22 In view of the above, 6 options for interception and 4 options for disposal were identified and evaluated under the study. The options and relevant evaluation were summarised as shown in Tables 8.4 and 8.5 respectively.
8.2.23 Option 1C, provision of a centralised DWFI compound at the downstream site of JVBC and divergence the intercepted dry weather flow to KTPTW then Stonecutters Island Sewage Treatment Works (SCISTW) for centralized treatment, is recommended. The critical component of the above option is the tidal barrier to prevent seawater intercepted by the proposed DWFI. Electric penstock was recommended in the study as a promising technology, but frequent maintenance works would be required to secure proper operation of the tidal barrier.
8.2.24 It is noted that the above option would not be a full solution for pollution control, and the scheme would only operate during non-rainy days, which was estimated to be about 280 days in a year. During the rainy days, the tidal barrier must be opened and the polluted flow in JVBC, although much diluted, would still enter the KTAC. Upgrading of KTIPS and KTPTW would also be required in advance of implementation of the above scheme. A major concern of this scheme is the serious flooding risks associated with the failure in operation of the tidal barrier, which could be minimized by dedicated maintenance effort and full drainage mitigation measures.
Table 8.4 Comparison of 6 Interception Options
Interception Options Option 1 Option 2 Option 3 Option 4 Option 5 Option 6
Principle Single DWFI compound at downstream of JVBC
Single DWFI Compound and Containment of dry weather flow to 4 cells of JVBC
Single DWFI Compound and Containment of dry weather flow by new dry weather flow troughs
De-Centralized DWFI Compounds along JVBC
Local DWFIs to nearby Existing Sewers
Local DWFIs to New Deep Intercepting Drains along JVBC
Details Intercept all dry weather flow by a single DWFI
Intercept 4 cells of dry weather flow by a smaller single DWFI
Intercept 4 cells of dry weather flow passing via troughs by a smaller single DWFI
Intercept portion of DWFI by 3 nos. of DWFIs at strategic locations and have multiple disposal points
Intercept dry weather flow at each major branch drain by 43 nos. DWFI (dia. > 450mm) with numerous pumping stations
Intercept dry weather flow at each major branch drain by 43 nos. of DWFI (dia. > 450mm) with deep intercepting drains for centralized pumping
Proposed Intercepting Location
Government land located downstream of JVBC (either CITA training centre or works area by DSD’s Project DC/2004/03
Same as Option 1
Same as Option 1
a. 2 smaller DWFI at Kowloon Bay Sports Ground and Wai Yip Street, and
b. 1 downstream single DWFI same as Option 1
At each major branch drain of dia. > 450mm entering to JVBC
Same as Option 5

Agreement No. CE 35/2006(CE) Kai Tak Development Engineering Study cum Design and Construction of Advance Works – Annex A Investigation, Design and Construction KTAC and KTTS Studies
8-7
Interception Options Option 1 Option 2 Option 3 Option 4 Option 5 Option 6
Construction / Modification
a. 1 flow interceptor;
b. 1 pumping station;
c. 1 main tidal barrier;
d. secondary tidal barriers for maintenance;
e. Culvert widening and emergency by-pass channels; and
f. Debris collectors.
a. Closure of ~200 nos. existing vertical aligned balancing holes along ~2km upstream of the proposed DWFI;
b. Reprovision of horizontal balancing holes at high level;
c. Culvert widening to compensate additional headloss due to the changes in balancing holes; and
d. Same as (a) to (d) of Option 1.
a. Modification of existing 7 cells to 4 dry weather flow troughs by additional partition walls/L-shape reinforce concrete structure; and
b. Same as (c) to (d) of Option 2.
For each smaller DWFI:-
a.1 weir across JVBC
b.1 intercepting chamber outside JVBC
c. 1 pumping station
For DWFI located at downstream:-
a.Same as Option 1 but with smaller design flow
For each DWFI:-
a. 1 flow interceptor
b. 1 smaller tidal barrier such as non-return valve;
c. 1 screening facility; and
d. 1 pumping station
a. 2 deep intercepting drains (one each at side along JVBC) for each branch;
b. Same as (a) to (c) of Option 5; and
c. 1 centralized pumping station
Advantages a. Confine majority of construction works within a piece of Government Land;
b. Intercept most of the polluted dry weather flow; and
c. No resumption of private land.
a. Smaller works scale of DWFI than Option 1; and
b. Lower risk for flooding (as tidal barriers at 4 cells only).
a. Smaller works scale of DWFI than Options 1 and 2; and
b. Lower risk for flooding (as only 1 tidal barrier required for DWFI).
a.Reduce adverse consequences by failure of a centralized DWFI;
b.More flexible to redivert the collected dry weather flow to different sewers; and
c. Loading to conveyance pipeline and downstream treatment works would be spread around.
a. No tidal barrier required within the JVBC; and
b. Lower risk of flooding.
a. No tidal barrier required within JVBC;
b. Lower risk of flooding; and
c. Individual pumping station and screening facility not required;
d. No-dig method for additional intercepting drains;
e. Tidal barrier and bypass channel not required for the centralized pumping station; and
f. Smaller scale of works of DWFI compounds.

Agreement No. CE 35/2006(CE) Kai Tak Development Engineering Study
Annex A cum Design and Construction of Advance Works – KTAC and KTTS Studies Investigation, Design and Construction
8-8
Interception Options Option 1 Option 2 Option 3 Option 4 Option 5 Option 6
Disadvantages a. Land rezoning required;
b. Provision of bypass culvert for emergency flooding situation;
c. Larger O&M input required;
d. Risk of failure of tidal barrier; and
e. Huge loading to the conveyance pipeline and downstream treatment works.
a. Further works to modify the balance holes and reconstruction of the culvert;
b. Serious traffic and public disruption for balance holes modification;
c. Modification works dependent on tidal and seasonal aspects; and
d. Adverse drainage impact during construction and operation phases.
a. Extensive works on construction of new troughs and reconstruction of the culvert;
b. Serious traffic and public disruption;
c. Construction works depend on tidal and seasonal aspects; and
d. Greater risk of flooding.
a. Serious traffic and public disruption for the construction of 2 additional smaller DWFIs;
b. Resumption of private land required;
c. High capital cost and O&M cost; and
d. High extent of works.
a. Serious traffic and public disruption for the construction of numerous DWFIs, as well as for inspection and maintenance;
b. Frequent maintenance for the tidal barriers at DWFIs;
c. Only portion of polluted dry weather flow will be collected as only intercept dry weather flow from pipes with dia. > 450mm;
d. High capital cost and O&M cost; and
e. High extent of works.
a. Local tidal barrier required for each DWFI;
b. High maintenance input for frequent inspection;
c. Serious traffic and public disruption for inspection and maintenance;
d. High extent of works for the jacking pits for laying of intercepting drains; and
e. Limited space of the construction of jacking pits.
Recommendation Recommended in terms of constructability and land availability
Not recommended due to substantial works in urbanized area
Not recommended due to substantial works in urbanized area
Not recommended in view of private land resumption to accommodate additional DWFI
Not recommended in view of lack of space for numerous pumping stations and high extent of construction works in fully built-up area
Not recommended due to limited space for construction of jacking pits for laying of intercepting drains

Agreement No. CE 35/2006(CE) Kai Tak Development Engineering Study cum Design and Construction of Advance Works – Annex A Investigation, Design and Construction KTAC and KTTS Studies
8-9
Table 8.5 Comparison of 4 Disposal Options
Disposal Options Option A Option B Option C Option D
Principles On-site treatment for discharge to KTAC
Diversion to outside the runway (for dilution and assimilation)
Diversion to Kwun Tong Preliminary Treatment Works (KTPTW)
Diversion to To Kwa Wan Preliminary Treatment Works (TKWPTW)
Location of Receiving STW
Government land located downstream of JVBC (either currently CITA training centre or works area by DSD’s Project DC/2004/03)
N/A Wai Yip Street, Kwun Tong
Sung Ping Street, To Kwa Wan
Advantages a. Avoid downstream sewerage network (including pipeline and STW) from overloading; and
b. Polluted dry weather flow treated before discharge.
a. Less complicated;
b. Less land resumption comparing to Option A; and
c. Roof area of the compound could be released for other uses upon completion of construction works.
a. Roof area of the compound could be released upon completion of construction works;
b. Conveyance of polluted dry weather flow to HATS system for centralized treatment is in line with the Government policy; and
c. Polluted dry weather flow treated before discharge.
a. Conveyance of polluted dry weather flow to HATS system for centralized treatment is in line with the Government policy;
b. Prevent overloading of Kwun Tong Intermediate Pumping Station (KTIPS) and KTPTW;
c. Roof area of the compound could be released upon completion of construction works; and
d. Polluted dry weather flow treated before discharge.
Disadvantages a. Additional STW required and great capital investment required;
b. Limited time for application and construction of additional STW;
c. Possible objection from general public;
d. EIAO procedures required;
e. Possible objections from general public; and
f. Large land resumption.
a. Still nuisance to the environment adjacent to Kai Tak Development;
b. Public’s reservation on the proposed relocation of pollution discharge; and
c. Pumping station required.
a. Upgrading of KTPTW AND KTIPS required;
b. Reduce space capacity of the existing box sewer and its downstream sewerage system including the HATS tunnel.
a. Upgrading of TKWPTW required;
b. Major construction works for sewerage including pumping station required; and
c. Serious traffic and public disruption for construction of additional sewerage.
Recommendation Not recommended due to time constraint and public concerns
Not recommended as discharging untreated polluted dry weather flow to the Victoria Harbour
Recommended due to less construction and lower capital cost required
Feasible but not preferred due to larger construction works required

Agreement No. CE 35/2006(CE) Kai Tak Development Engineering Study
Annex A cum Design and Construction of Advance Works – KTAC and KTTS Studies Investigation, Design and Construction
8-10
Study on the Control of Water Pollution at Jordan Valley Box Culvert
8.2.25 The purposes of the Study are to identify the water quality problems of JVBC and to propose feasible solutions to mitigate the pollution problems. It aims to improve the water quality of KTAC.
1. Assess the flow and water quality problems, and to identify and quantify all major water pollutant sources of the JVBC;
2. Review and assess the effectiveness of existing DWFIs in the JVBC catchment, and recommend appropriate improvement measures;
3. Identify and evaluate feasible options for the reduction of water pollution at the JVBC, including complete interception of dry weather flow, and to evaluate feasible options for the reduction of water pollution at JVBC.
8.2.26 The Study is in progress and the Consultant has issued a Draft Information Review Report
demonstrating their review on previous studies and identifying the key issues of the Study. The Consultant also conducted site visit to Jordan Valley Nullah, DWFI pumping stations, the JVBC in Kowloon Bay and its outfall. It was found that water flow in the upstream of JVBC (i.e. Jordan Valley Nullah) was clean with no noticeable polluted discharges from the branch connection despite of accumulation of leaves and silt at the weir locations. However, polluted discharge from the outfall of JVBC was observed and a large amount of rubbish with strong odour was found during the site visit. It was concluded that there was a likelihood of expedient connection of pollutants discharging into the JVBC in urban area and the relevant DWFIs might not be functioning effectively.
8.2.27 It is noted that extensive surveys would be conducted under this Study to collect more information on the water pollution at JVBC, including sources of pollution discharging to JVBC, internal condition of the box culvert, water quality along JVBC, etc. The survey works would include walkover survey, non man-entry survey by CCTV, flow survey, and water pollution survey in order to locate the major source of water pollution at JVBC and to evaluate the effectiveness of the existing DWFIs.
Kai Tak Approach Channel Expedient Connections Survey Study
8.2.28 The objective of the Survey is to identify expedient connections in the KTAC drainage catchment area, which covering about 1,700ha over a substantial part of Central and East Kowloon including Kowloon City, San Po Kong, Wong Tai Sin, Diamond Hill, Ngau Chi Wan, Jordan Valley and Kowloon Bay. The data would be analysed to provide information to enable fast track planning and implementation of the expedient connections rectification works in order to reduce the pollution in KTAC.
8.2.29 The Survey is in progress and the Consultant has issued a Final Information Review Report to select the priority areas for surveys. Comprehensive surveys, including man entry, non-man entry, CCTV, manhole connectivity surveys, etc., will be carried out in the priority areas. Five no. priority areas have been identified:
1. Kowloon City District – The Kai Tak Pumping Station No. 1 (DWFI 1), the 1,200 mm
diameter pipeline cross connection referred to as the Tak Ku Ling Road Garden
overflow and the stormwater drainage system upstream of this overflow facility
contributing flow to the 3 cell 2,745mm x 2,745mm box culvert.
2. Kowloon Bay/Choi Hung District – The Kai Tak Pumping Station No. 4 (DWFI 9) and the
upstream stormwater drainage system in the Kowloon Bay and Choi Hung District
contributing flow to the 4 cell 4,000mm x 3,350mm box culvert.

Agreement No. CE 35/2006(CE) Kai Tak Development Engineering Study cum Design and Construction of Advance Works – Annex A Investigation, Design and Construction KTAC and KTTS Studies
8-11
3. Wong Tai Sin District – The single cell 3,048mm x 3,048mm box culvert running
adjacent to the Wong Tai Sin Police District Headquarters and the 1,800mm diameter
stormdrain at the Shatin Pass Road bridge both of which discharge flow into the closed
conduit dry weather flow pipe positioned along the western side of the Kai Tak Nullah
together with the upstream drainage systems.
4. Uncharted Pipe Discharge Source – The old Ma Tau Kok Screening Plant compound
(DWFI 6), the Interim Wet Weather Overflow Chamber and the associated manholes
within the old Kai Tak airport boundary adjacent to the Sung Wong Toi Road / To Kwa
Wan Road junction and the stormwater drainage system in both Sung Wong Toi Road
and To Kwa Wan Road.
5. Ngau Tau Kok District – The Kowloon Bay Pumping Station (DWFI 17) and the
upstream stormwater drainage system leading to the 3 cell 4,120mm x 3,800mm box
culvert together with the Ngau Tau Kok Pumping Station (DWFI 11) and the upstream
stormwater drainage system leading to the 4 cell 3,965mm x 3,400mm box culvert both
of which contribute to the 7 cell 4,120mm x 3,800mm JVBC.
Interfacing Projects and Works
8.2.30 Several interfacing projects and works are identified and listed in Table 8.6.
Table 8.6 Interfacing Projects / Works
Interfacing Projects / Works Conducted by
Tender Ref. IP 06-074
Kai Tak Approach Channel – Expedient Connection Survey
Pypun Engineering Consultants Ltd.
Tender Ref. IP 07-001
Study on the Control of Water Pollution at Jordan Valley Box Culvert
Scott Wilson Ltd.
Agreement No. CE 61/2006 (DS)
Upgrading of Central and East Kowloon Sewerage – Investigation, Design and Construction
Atkins China Ltd.
PWP No. 4134CD and DC/2004/03
Drainage Improvement in East Kowloon – Package A
Black & Veatch Hong Kong Ltd. and Leader Civil Engineering Corporation Ltd.
8.2.31 In addition, it is understood that the project of Investigation for the Upgrading of Kwun Tong
Sewage Preliminary Treatment Works by EPD will commence in June or July 2008 and will last for 17 months.
8.2.32 The project of Study on the Control of Water Pollution at Jordan Valley Box Culvert will be finalized in 2008 and the consultancy of Control of Water Pollution at Jordan Valley Box Culvert – Investigation, Design and Construction (IDC) was anticipated to be commenced in September 2008. This IDC project includes the construction of the dry weather flow intercepting facilities and sewage pumping station and the associated discharge pipe at JVBC to alleviate the pollution problem at the Kai Tak Approach Channel. These proposed works would be constructed in the proposed DSD Desilting Compound Site within KTD.
8.2.33 We will keep inform the relevant government departments on our findings and recommendations on the interception, diversion and treatment of the dry weather flow from KTN and JVBC in order for latest information exchange and to prevent any conflict from happening.
8.2.34 It should be noted that the identified mitigation proposals for containment of pollution entering KTAC and KTTS in this section are for the purpose of the odour impact assessment. Detailed feasibility of any proposed mitigation options should be assessed under a separate study.

Agreement No. CE 35/2006(CE) Kai Tak Development Engineering Study
Annex A cum Design and Construction of Advance Works – KTAC and KTTS Studies Investigation, Design and Construction
8-12
8.3 Dry Weather Flow Interception Scheme
Introduction
8.3.1 In order to alleviate the environmental problem of KTAC and KTTS, the following measures in terms of interception are required:
• Collect polluted dry weather flow from KTN and JVBC to sewage treatment works for treatment; and
• Control grits from stormwater runoff and sediments from seawater accumulating in KTN and JVBC
Dry Weather Flow in JVBC
8.3.2 The dry weather flows facilities in JVBC will be designed under the project of “IP07-001 – Study on the Control of Water Pollution at Jordan Valley Box Culvert” (the JVBC Study). The proposed works include a sewage pumping station, the discharge pipe and the associated facilities including automatic penstocks, stoplogs, mechanical screens, desilting facilities and bypass box culvert. The proposed works for DWFI and the sewage pumping station will be implemented by DSD under the project for “Control of Water Pollution at Jordan Valley Box Culvert – Investigation, Design and Construction”.
8.3.3 According to the proposal developed by the JVBC Study, the DWFI compound will intercept the dry weather flow from JVBC. Then the intercepted flow will be handled by the pumping station with a pump rate of 0.5m
3/s and finally discharged to the existing sewer box culvert
at Kai Fuk Road and conveyed to Kwun Tong Preliminary Treatment Works for treatment and disposal.
8.3.4 The dry weather flow intercepting compound is located at the reserved land designated as DSD Desilting Compound at downstream of JVBC in KTD area. The desilting and operation chamber will be provided in the desilting compound site of JVBC under the JVBC Study.
Dry Weather Flow in KTN
8.3.5 The dry weather flows will be mitigated by the proposed works at hinterland before entering the KTN in KTD area. The flows from DWFI sewage pumping stations including KT Pumping Station No. 1 DWFI, KT Pumping Station No. 2 DWFI and Kowloon East DWFI pumping station are proposed to divert to the proposed interception works under the DSD project of “Agreement No. CE4/2007 – Sewage Interception Scheme in Kowloon City – Investigation”.
8.3.6 Under the Agreement No. CE4/2007 project, a deep new sewer will be laid along Yuk Kwun Street adjacent to the existing Kai Tak Nullah. It is possible to divert the incoming pipes of the Kai Tak Pumping Station No.2 DWFI to the proposed trunk sewer. In this regard, the Kai Tak Pumping Station No.2 can be decommissioned upon completion of the diversion works. The diverted DWF will be discharged into the proposed pumping station PS1 located in KTD. Then, the flows will be pumped by the rising mains system and discharged to the gravity sewerage system at To Kwa Wan Road and eventually conveyed to To Kwa Wan Preliminary Treatment Works for treatment and disposal.
8.3.7 In addition, the Agreement No. CE4/2007 project recommends some modifications of the existing works.
8.3.8 The above proposal will be implemented by DSD under the project of “Sewage Interception Scheme in Kowloon City – Investigation”.

Agreement No. CE 35/2006(CE) Kai Tak Development Engineering Study cum Design and Construction of Advance Works – Annex A Investigation, Design and Construction KTAC and KTTS Studies
8-13
Summary
8.3.9 The above DWF interception schemes were proposed by the above mentioned DSD projects. The water quality of the KTAC will be improved as the intercepted dry weather flows are conveyed to the existing sewage system and treatment works for disposal.
8.3.10 For Kai Tak Nullah, no provision of dry weather interception is required in KTD project as the hinterland sewage interception works proposed by DSD project.
8.3.11 For Jordan Valley Box Culvert, a proposal has been developed by the JVBC Study to alleviate the pollution problems in KTAC due to dry weather flows in JVBC.
8.4 Description of Drainage Culvert System in KTN
Overall View
8.4.1 The catchment area of South East Kowloon covers over 26 km2 of land comprising some
densely populated districts including Kwun Tong, Kowloon City and To Kwa Wan. The downstream urban areas are mainly characterized by a mix of residential and industrial uses which include some old developed residential areas such as Kowloon City and Ma Tau Wai.
8.4.2 Within the Study Area of the KTD, there are two mains drainage systems in South East Kowloon. They are Kai Tak Nullah (KTN) and Jordon Valley Box Culvert (JVBC).
8.4.3 KTN will be upgraded from an open nullah to multi-cells box culvert (14 cells 5m(W) x 4.5m(H) at downstream section). Most of the major drains including box culverts are connected to KTN.
8.4.4 JVBC is an existing 7 cells 4.12m(W) x 3.8m(H) box culvert. Among the 7-cell, 4 of them running from Sheung Yuet Road which collects runoffs from Ngau Tau Kok area whereas the other three culvert cells running along Wang Chiu Road collecting runoffs from Kowloon Bay area. No upgrading work is proposed by the KTD study
8.4.5 For the North Apron area, a separate box culvert near Sung Wong Toi with size of 3m(W) x 3m(H) is proposed.
8.4.6 Apart from the KTN and the box culvert near Sung Wong Toi, other proposed drainage outfalls at the South Apron and ex-runway areas within KTD are pipeline systems.
8.4.7 In addition to the surface runoff generated from the catchment area of South East Kowloon, other discharges from the Tolo Harbour Effluent Export Scheme (THESS) and the Kai Tak Transfer Scheme (KTTS) will be discharged to upstream of the existing Kai Tak Nullah.
8.4.8 For THESS, the existing discharges are approximately 6m3/s but the discharges will be
increased to 10.6m3/s at year 2016 or later. For KTTS, the peak flows are approximately
40m3/s and 33m
3/s for 1 in 200 year rainstorm and 1 in 10 year rainstorm respectively..
Major Box Culverts
8.4.9 There are two types of box culverts located inside the KTD, namely proposed box culverts and the existing box culverts.

Agreement No. CE 35/2006(CE) Kai Tak Development Engineering Study
Annex A cum Design and Construction of Advance Works – KTAC and KTTS Studies Investigation, Design and Construction
8-14
8.4.10 The major box culverts which have been proposed in the KTD are outlined as follows:
• Kai Tak Nullah Main Box Culvert starts from Prince Edward Road East to Kai Tak Approach Channel. Its upstream is connected to the open nullah adjacent to Choi Hoi Road. The culvert sizes ranges from 7 cells 5m(W) x 4.5m(H) to 9 cells 5m(W) x 4.5m(H) to 14 cells 5m(W) x 4.5m(H). This culvert is denoted as KTN.
• Kai Tak Nullah Branch Box Culverts Group No. 1 (North-east of KTN) comprises of 2 branches of 2x5m(W) x 2.5m(H) and 2.5m(W) x 2.5m(H) and is then combined into 2 cells 5m(W) x3m(H). This culvert is denoted as BC1.
• Kai Tak Nullah Branch Box Culverts Group No. 2 (South-west of KTN) comprises of 2 branches of 4m(W) x 3m(H)/5m(W) x 3m(H)/5m(W) x 4m(H) and 2.5m(W) x 2.5m(H) and is then combined into 2 cells 5m(W) x 4m(H). This culvert group is denoted as BC2.
• Kai Tak Nullah Branch Box Culverts Group No. 3 (North-east of KTN) include a 3m(W) x 2.8m(H) culvert. This culvert group is denoted as BC3.
• A box culvert near Sung Wong Toi with size of 3m(W)x3m(H). This culvert is denoted as BC4.
• Realigned section of 2 cells 3m(W) x 2.8m(H) Box Culvert along Prince Edward Road East. This culvert is denoted as V4.
8.4.11 For the existing major box culverts, several box culverts will be retained in the KTD.
These are listed as follows:
• Jordan Valley Box Culvert between Kai Fuk Road and the seafront. The size of the culvert is 7 cells 4.12m(W) x 3.8m(H).
• 4 cells 4m(W) x 3.35m(H) Box Culvert along Eastern Road and cargo Circuit.
• 2 cells 3m(W) x 2.8m(H) Box Culvert along Prince Edward Road East.
• A box culvert with size of 3.35m(W) x 2.9m(H) along Sung Wong Toi Road.
• A box culvert near Chikiang Street with size of 3.6m(W) x 1.8m(H) or 4.8m(W) x 1.8m(H).
8.4.12 The layout plan of the above box culverts is shown on Figure 8.1.
8.4.13 The detailed layout plans of the proposed drainage system in the KTD are presented on Figures 8.2 to 8.13.
Desilting Compound
8.4.14 Desilting compounds are the permanent facilities to be used for dewatering the removed grits collected from box culverts.
8.4.15 Two pieces of land have been reserved for DSD desilting compounds at the downstream of the Kai Tak Nullah (KTN) and Jordan Valley Box Culvert and additional land has been reserved at the upstream of KTN for KTD. Under the latest Recommended Outline Development Plan in this Study, the locations of the proposed desilting compounds are indicated on Figure 8.14.

Agreement No. CE 35/2006(CE) Kai Tak Development Engineering Study cum Design and Construction of Advance Works – Annex A Investigation, Design and Construction KTAC and KTTS Studies
8-15
8.4.16 The site areas of DSD Desilting Compounds are summarized in the following table:-
Table 8.7 – Details of DSD Desilting Compounds in KTD
Item Location Function Site Area (m2)
1. Upstream of Kai Tak Nullah Secondary 2,800
2. Downstream of Kai Tak Nullah Primary 17,700
3. Downstream of Jordon Valley Box Culvert Primary 7,200
Note: The information of the site area is extracted from the Development Schedule of Preliminary
Recommended Outline Development Plan. Their Sub-Planning references are 1D-6, 1P-1 and 3A-3.
8.4.17 For the Kai Tak Nullah, the area of the land for the desilting compound at upstream of Kai
Tak Nullah (i.e Item 1 of Table 8.6) is 2,800 m2 only and this land is inadequate for
provision of dewatering facilities. Hence, this desilting compound acts as a secondary or subsidiary purpose.
8.4.18 The layouts and sections of the desilting compounds at KTN are presented in Figures 8.15, 8.16 and 8.20. The operation of the desilting compound will be discussed in the later part of the Report.
8.4.19 The desilting and operation chamber and silt drying area will be provided in the desilting compound site of JVBC under the JVBC Study.
8.5 Desilting Procedures and Preliminary Maintenance Plan
General Information
8.5.1 The objective of this Section is to present the proposed methods and procedures for maintenance of the boxes culverts in KTD. It covers regular routine desilting and long-term maintenance work for box culverts and also the associated desilting compound at KTN in particular.
8.5.2 The desilting procedures and maintenance plan have been developed to ensure that the works be carried out in a safe and efficient manner.
8.5.3 The desilting will be undertaken at low tide or after dewatering of the culvert cells. The dewatering of the culverts will make it easier to remove the sediment as one of the main difficulties in maintaining tidal culverts is carrying out effective desilting under water.
8.5.4 Operation and maintenance activities would take place during the dry season. In general, stop logs would be installed and the culverts dewatered by pumping into the sea (or downstream culvert, if maintenance is to be carried out at upstream sections) using submersible pumps to pump out the retained water. However, permanent tidal barriers such as penstocks would be adopted for the designated area for desilting and silt handling (i.e. desilting compounds).
8.5.5 As desilting compounds are proposed for the KTN Main Box culvert, the desilting operational procedure is different for the KTN and the other culverts without desilting compounds

Agreement No. CE 35/2006(CE) Kai Tak Development Engineering Study
Annex A cum Design and Construction of Advance Works – KTAC and KTTS Studies Investigation, Design and Construction
8-16
Routine Desilting 8.5.6 Desilting will be carried out at the desilting openings with provision of silt traps. Routine
maintenance can be carried out manually using light weight equipment and hand tools. The culverts should be inspected yearly to check the build up of sediment and to establish the need to carry out desilting. The work will be carried out in the dry seasons. Tidal barriers will be placed at appropriate locations and the culverts dewatered by pumping out the retained water.
8.5.7 Man entry to the culvert may be required and all safety precautionary measures must be taken. A minimum of five persons will be required to comply with the standard safety requirements. Standard safety and ventilation equipment should be provided. The inspection manhole shall provide additional ventilation.
8.5.8 A jetter may be required to jet from the desilting opening to force the silt towards the silt trap.
8.5.9 Covered skips and lorries are required for removal of sediments to the area for collectively handling of silts. It is proposed to designate the area for desilting and handling the materials removed from the culverts. The area should be shelted from other area as a compound and it would avoid any convenience and nuisance to the nearby area.
Long Term Maintenance 8.5.10 Periodic major desilting may be required at approximately 5 year intervals in conjunction
with the routine maintenance. This will be dependent on the exact volume of silts. Maintenance will be carried out in the dry seasons. Stop logs will be placed at appropriate locations and the culverts dewatered by pumping out the retained water.
8.5.11 The desilting and cleaning will be carried out on a cell by cell basis by isolation of individual cell. Near each desilting opening a hole will be provided in the culvert dividing wall to allow for temporary flow diversion enabling the work area to be completely isolated from the flow. The flow diversion will remain in place throughout the desilting and cleaning operation.
8.5.12 Due to the risk of gas being released from the culvert during cleaning and desilting operations, forced ventilation would be provided. During the desilting process, there is a potential fro release of odorous gas due to disturbance of the sediments. The odour impacts could be reduced by extracting the air through an odour control equipment. Two numbers of jet flow type air movers should be sufficient. A large capacity air compressor would be needed.
8.5.13 The desilting will be mainly carried out by several methods such as winching method, slurry pumping, vactor units, land based equipment, etc. Winching method is adopted for box culverts without desilting compounds and slurry pumping method is recommended for box culverts in KTN.
Sediment Removal in Box Culverts without Desilting Compound 8.5.14 For box culverts BC1, BC2, BC3, BC4 and V4, no desilting compound would be proposed
to facilitate the desilting operations. As such, a winching method is used for this situation.

Agreement No. CE 35/2006(CE) Kai Tak Development Engineering Study cum Design and Construction of Advance Works – Annex A Investigation, Design and Construction KTAC and KTTS Studies
8-17
8.5.15 The winching method incorporates the use of a winch and pulley system to drag a heavy duty metal plough within the box culvert, scraping along the sediments within the plough as the winch pulls it. The collected sediments are drawn to the area beneath the desilting opening and are subsequently removed by a sliding-arm excavator to the surface. The excavated materials are then transported to temporary silt handling area and the desilting compounds for handling to maximize to draining of the wet sediments before final disposal to public dump or landfill.
8.5.16 The use of winches for box culvert desilting is a safe working method because it avoids the deployment of the workers into the box culvert system. Special requirements and procedures are necessary to ensure that the winch and plough arrangement can be established and operated without man-entry. Some diving activities are anticipated to be required for the assembly and disassembly of the winching equipment in the box culverts, i.e. pulley blocks, winching cables, etc.
8.5.17 The procedure for the winching method is outlined as follows:
• By means of an insitu stainless steel sheathed cable, draw the winch cables through the culvert, downstream up, connect to the plough above ground level and then lower into position in the culvert;
• The plough is winched along the culvert to the downstream desilting opening. The winch cable will pass through temporary transverse beam mounted pulleys to provide guidance of the cable onto the winch and to prevent cable on culvert concrete contact. Installation of the pulleys can occur during the site establishment phase of the desilting operation utilizing a portable man-cage lowered into the top of the opening;
• The plough will move the sediments in the box culvert along the bottom of the culvert. Once at the downstream desilting opening, accumulated sediments are removed from the culvert by excavator mounted or lorry mounted sliding arm mechanical grab;
• Once removed from the box culvert the sediment is placed in fully sealed tipping tray type trucks. Trucks would be covered and the material delivered to the desilting compound;
• Within the desilting compound, trucks will unload into receipt hoppers from which the sediment slurry is pumped to the Silt Handling Building for deatering. The dewatered sediment is transferred to skips for transport and disposal at a landfill site.
8.5.18 It is considered that complete odour control for the above operation of the mechanical grabs and trucks during sediment removal from the culverts is difficult. If the site is allowable, it is considered feasible to enclose the desilting operation in a temporary shed. The potential for odour nuisance can be further minimized by good operating practices including keeping vehicles covered at all possible times and by minimizing the total time for loading of vehicles.
8.5.19 For the desilting operation for the culverts without desilting compound, the full enclosure as a temporary shed will be provided and the potable odour control equipment will be required in conjunction with ventilation exhaust from the culvert. The odour impacts due to the desilting operation will be minimized if the odour control measures are taken.
8.5.20 A schematic layout of the operations is presented in Figure 8.18.

Agreement No. CE 35/2006(CE) Kai Tak Development Engineering Study
Annex A cum Design and Construction of Advance Works – KTAC and KTTS Studies Investigation, Design and Construction
8-18
8.5.21 It should avoid providing the desilting openings at road junctions. However, some of the desilting openings of the box culverts are close to road junctions, adequate working area for the setting up and operation of the winching equipment may not be available. Hence, some closure of traffic lanes would be required, and the necessary permits would be required beforehand from Transport department, Hong Kong Police Force and Highways Department.
Sediment Removal and Drying Procedures of Box Culverts with Desilting Compound at KTN 8.5.22 Three basic options are suggested for sediment removal and drying procedures for KTN
Box Culvert. They are described herein but are not meant to limit the DSD’s maintenance team’s development of their own method statement.
Method 1: Slurry Pumping
8.5.23 Penstock is installed at the box culverts within the desilting compound at KTN. A slurry pump draws suction from the culvert barrel behind the penstock. Jetting equipment is used to flush sediments from the upstream sections of the culvert barrel to the slurry pump. The jetting equipment would work from upstream manholes along the length of the box culvert. Forced ventilation would be required at the manholes where the jetting unit would be operating.
8.5.24 The flow from the slurry pump is discharged to separation facilities that remove the silt from the water. The separation facilities would be located in the Silt Handling Building and could include the following elements:
• Settlement tanks
• Screens for coarse materials
• Hydroclones and centrifuges
• Dewatering screens
• Filter presses
8.5.25 These processes can be used singly or in combination depending on the material that has to be separated, the size of the space provided, the regulations on disposal, and the required processing rates.
8.5.26 Settlement tanks offer a simple and cheap solution to the separation process. A typical setup would consist of a prefabricated steel tank or several in a connected series where longer settlement times are needed. Settlement tanks are effective for separating gravels and sands, but only particles about 1-mm sink in water quickly enough to make it practical to use simple settlement tanks only. The addition of flocculants can speed up the sedimentation process where the density of the slurry is not high. While settling tanks are the most economical separation alternative, they have been sized to accommodate the use of settlement tanks assuming that the entire box culvert would be desilted during a single dry season.
8.5.27 Screens to separate coarse materials are often used as the first stage of a multi-stage plant. A range of screens types is available in a variety of materials with different surface areas and screening openings.
8.5.28 Both hydroclones and centrifuges use centrifugal separation principles and allow for higher production rates in smaller areas. Hydroclones can separate material down to 100 microns in a single-stage plant and down to 5 microns and smaller with the addition of flocculants. They are cheaper to purchase and operate than centrifugals. Centrifugals with a helical conveyor can extract fine particles down to 5 microns and smaller with the addition of flocculants. The output from these devices has relatively high water content and may have to be transported off site for further processing before being disposed.

Agreement No. CE 35/2006(CE) Kai Tak Development Engineering Study cum Design and Construction of Advance Works – Annex A Investigation, Design and Construction KTAC and KTTS Studies
8-19
8.5.29 Vibratory dewatering screens are used for reducing water content. Dewatering belts and filter presses reduce the water content of finer soils by about 20% allowing for the highest solids concentration. The disadvantages of these processes are their high cost.
8.5.30 There are several manufacturers who provide proprietary separation plants of modular design that include combinations of the above mechanical processes that can be used for separating silty material and water. They are usually used for moving large volumes of materials over short periods.
8.5.31 The advantage of pumping the silt from the culvert is that it minimizes the necessity of man entry into the culvert. This is advantageous as confine space entry is limited to the Silt Handling Building where safety equipment, ventilation equipment, and gas monitoring equipment can be installed under controlled conditions prior to desilting.
Method 2: Vactor Units
8.5.32 In this method, tanker mounted air lift/ vacuum suction equipment would be used to remove silt.
8.5.33 Desilting would be conducted using the access openings along the length of the culvert and from the desilting compound.
8.5.34 Typically, a jetting hose is passed from the access opening through the length of the culvert barrel to be desilted. The jetting hose is then pulled back to the access opening while the water jet drives sediment to the opening. At the opening a suction pipe lifts sediments into the receiving vessel of the vactor unit. The receiving vessel separates air, water and sediments. The collected water is then drained back to the culvert. Typical equipment can reach about 150 meters along the length of the culvert.
8.5.35 This type of operation has the advantage of limiting the requirement for man-entry. Intermediate site is required to reduce the water content of the high fluidity sediments collected. Trunks are required to transport the thickened sediment to appropriate site for disposal.
Method 3: Land Based Equipment
8.5.36 Mini excavators can also be used within the culvert. Equipment, including “Bob Cat” type mini excavators and wheeled skips can enter the box culvert from the large access openings along the box culvert and from the desilting compound. Depending on the location of the work, the silt would be moved towards the desilting openings or the desilting compound where it would be removed. Materials removed at the desilting compound would be moved to the Silt Handling Building for intermediate storage. Here the excavated material can be stockpiled, drained of free water, and then loaded onto large transportation vehicles for disposal.
8.5.37 This operation method is the least desirable as it requires workers to be working inside a confined space for extended periods
Recommended Option
8.5.38 A combination of the above methods is suggested. High fluidity of sediment is expected at the part of box culvert near the penstock. As a result, slurry pumping along box culverts at the desilting compound is recommended. (i.e. Pumping the slurry into the sedimentation tanks inside the Silt Handling Building to undergo gravity draining).
8.5.39 For other box culverts or more upstream part of KTN, drier sediment will be expected and so vactor unit and or land based equipment methods or winching method described in Para. 8.5.14 above can be utilized.

Agreement No. CE 35/2006(CE) Kai Tak Development Engineering Study
Annex A cum Design and Construction of Advance Works – KTAC and KTTS Studies Investigation, Design and Construction
8-20
8.5.40 Removal and drying procedures of the recommended method is outlined as follows:
• The removable air plenums shall be moved using suitable tools or equipments (e.g. lifting aids) without causing any damage to the louver plenum. The desilting personnel shall keep the louver plenums at a suitable location until the desilting operation or any maintenance work has been done;
• Install the deodorizer with adequate piping to the sedimentation tanks or to the whole building;
• Block the upstream box culvert by barrier in order to stop base flow from flowing into the barrels that desilting operation is undergoing;
• Install the slurry equipment and flush water in from desilting opening. The slurry resulted will be pumped to sedimentation tanks inside the Silt Handling Building;
• Remove the extraction fans and the associated air duct works and fit the air plenums onto the roof recess openings after desilting operation. Desilting personnel shall ensure the louver plenums and the recess openings are tightly sealed in order to maintain water-tightness;
• Install the access ramp stoplogs, remove the pumps in wet well and open the penstocks after desilting operation.
Disposal of Silt and Sediment 8.5.41 The sediment removed from the culverts will be tested for signs of contamination. It is,
however, not expected the materials to be contaminated as the silt will be mainly originated from natural catchments. If the materials are not contaminated, they can be disposed of at a landfill site provided they meet the 30% solid content criterion.
8.5.42 The materials will be transported to a desilting compound site inside the KTD for central handling. After the materials are dried out, they can be transported to the landfill site by properly covered lorries.
Operation and Maintenance Programme 8.5.43 The operations for desiliting are proposed to be conducted within dry season. 5 months
from November to March are defined as the dry season and hence all desilting activities will be scheduled for completion within this period each year as a cycle.
8.5.44 The total amount of silts of the Kai Tak Nullah Main Box Culvert will be considerable. The total time for desilting operations is about 12 weeks starting from January to March.
8.5.45 The desilting operations for the new box culverts BC1, BC3 and V4 are proposed to be carried out in November. Similarly, the desilting operations for the remaining new box culverts are proposed to be carried out in December.
8.5.46 Based on the timeframe and the duration of the desilting operations, a programme has been prepared for new box culverts and it is presented in Appendix 8.1.
Maintenance Equipment 8.5.47 The maintenance equipment proposed for routine and long term maintenance depends on
the method of desilting and inspection. The details of the maintenance equipment shall be determined and included in the Operation and Maintenance Manual.

Agreement No. CE 35/2006(CE) Kai Tak Development Engineering Study cum Design and Construction of Advance Works – Annex A Investigation, Design and Construction KTAC and KTTS Studies
8-21
8.5.48 In general, the equipment required for maintenance includes the following:
• Penstock;
• Stoplogs;
• Portable submersible pump;
• Slurry pump;
• Deodorizers;
• Power generators;
• Ventilation devices;
• Lighting; etc. 8.5.49 The suggested manufacturer’s catalogue for the major maintenance equipment is
presented in Appendix 8.2.
THEES Discharges during Maintenance of KTN Box Culvert 8.5.50 As described in Para. 8.4.8, the maximum discharges from Tolo Harbour Effluent Export
Scheme (THEES) are about 6.6m3/s and 10.6m
3/s for the existing situation and year 2016
or later scenario respectively. According to the draft drainage impact assessment report, the capacity of a single cell culvert (5m(W) x 4m(H)) in KTN Box Culvert is about 34 m
3/s.
Therefore, the single cell of the culvert would be capable of conveying the discharges from THEES.
8.5.51 In addition, the desilting operations shall be scheduled to be conducted in dry seasons. Hence, the risk of flooding in the culvert due to the maintenance activities would be minimized. No maintenance activities are recommended during inclement weather or heavy rainstorms. Therefore, it is expected that there are only flows from THEES to be handled during maintenance.
8.5.52 As discussed in Para. 8.5.11, the maintenance activities for the culvert will be carried out on a cell by cell basis by isolation of individual cell. The flows will be temporarily diverted upstream to enable the work area to be completely isolated. The flow diversion will remain in place throughout the desilting and cleaning operation.
8.5.53 In conclusion, the discharges from THEES are not required to be shut down during the maintenance of KTN Box Culvert.
8.6 Maintenance Operations during Rainstorms, Tropical Cyclones or inclement Weather
8.6.1 The maintenance activities for the trunk stormwater drains are usually conducted in dry season with a lower risk of heavy rainfall and possibility of flooding, particularly for the activities requiring man-entry into the drains. The dry season is normally the five months from November to March
8.6.2 When no maintenance activities are required, the tidal barrier (penstocks) in KTN shall be opened to ensure the drainage capacity of the culverts is achieved. The tidal barrier (penstocks) will be closed at low tide when the maintenance activities are conduced. The desilting operations shall be carried out on a cell by cell basis by isolation of the individual cell. The flows will be temporarily diverted.
8.6.3 Although the maintenance operations are normally carried out during dry season, the staff may inevitably encounter inclement weather during their work.
8.6.4 If Tropical Cyclone Warning Signal, Rainstorm Signal or Thunderstorm Warning is announced by Hong Kong Observatory (HKO), the outdoor maintenance operations are not recommended to carry out.

Agreement No. CE 35/2006(CE) Kai Tak Development Engineering Study
Annex A cum Design and Construction of Advance Works – KTAC and KTTS Studies Investigation, Design and Construction
8-22
8.6.5 In case the above mentioned weather warning is issued after the maintenance works have commenced, the maintenance staff should stop their works and retrieve from the drainage facilities immediately as heavy rains will be developed rapidly.
8.7 Summary
8.7.1 This section focused on the containment of pollution in drainage systems entering the KTAC and KTTS by interception facilities and the removal of grits or sediments under normal operations in the box culverts.
8.7.2 In case the above mentioned weather warning is issued after the maintenance works have commenced, the maintenance staff should stop their works and retrieve from the drainage facilities immediately as heavy rains will be developed rapidly
8.7.3 For Kai Tak Nullah, no provision of dry weather interception is required in KTD project.
8.7.4 For Jordan Valley Box Culvert, a proposal has been developed by the JVBC Study to alleviate the pollution problems in KTAC due to dry weather flows in JVBC
8.7.5 Three desilting compounds are suggested in KTD to be used for dewatering the removed grits and sediments collected from the box culverts. Two of them are located at KTN (the desilting compound at downstream of KTN contains Silt Handling Building) and the remaining one is located at JVBC.
8.7.6 Desilting procedures and maintenance plans have been discussed in Section 8.5. Winching method and slurry pumping method are suggested for box culverts other than KTN Box Culvert and KTN Box Culvert respectively. The sediments will be transported to a desilting compound site inside the KTD for central handling. After the materials are dried out, they can be transported to the landfill site by properly covered lorries.

Agreement No. CE 35/2006(CE) Kai Tak Development Engineering Study cum Design and Construction of Advance Works Annex A – Investigation, Design and Construction KTAC and KTTS Studies
9-1
9 ODOUR IMPACT ASSESSMENT
9.1 Introduction
9.1.1 This Section presents the odour emission inventory and the assessment methodology and predictions of potential odour impact arising from KTN, KTAC and KTTS on the air sensitive receivers (ASRs) at Kai Tak Development under the existing odour strength scenario and a number of scenarios assuming the implementation of mitigation measures.
9.2 Odour Assessment Criteria 9.2.1 In accordance with the EIAO-TM, odour level at an ASR should meet 5 odour units based
on an averaging time of 5 seconds for odour prediction assessment. 9.3 Air Sensitive Receivers 9.3.1 ASRs are identified according to the criteria set out in the EIAO-TM Annex 12 and through
review of land use plans, including the Preliminary Outline Development Plan of Kai Tak Development. Domestic premises, hotels, hostels, hospitals, clinics, nurseries, temporary housing accommodations, schools, educational institutions, offices, factories, shops, shopping centres, homes for the aged and active recreational activity areas are classified as ASRs.
9.3.2 A number of representative planned and existing ASRs located in close proximity to the KTN, KTAC and KTTS were selected for the purpose of this assessment. The selected ASRs are listed in Table 9.1 below and shown in Figure 9.1. The major odour emission sources of concern in this assessment are KTN, KTAC and KTTS, which are area sources near ground level. Therefore, worst-case odour impacts would also be expected near ground level. The assessment heights at the ASRs were taken as 1.5m above local ground level to represent the height of normal breathing zone of human. In addition, the odour impacts at assessment heights of 10m, 20m and 30m above local ground level at the ASRs were also examined in the odour impact assessment.
Table 9.1 Representative ASRs selected for Odour Impact Assessment
ASR ID Description Region
OA1 Planned stadium, site2D
OA2 Planned residential site 1L3
OA3 Existing EMSD Headquarters, site 1N
North apron area of Kai Tak Development
OA4 Planned government site 3B1
OA5 Planned government site 3B2
OA6 Planned government site 3B3
OA7 Planned government site 3B4
OA8 Planned hospital site
OA9 Planned hospital site
OA10 Planned district open space, site 3E2
OA11 Planned commercial site 3D4
South apron area of Kai Tak Development
OA12 Existing World Trade Square
OA13 Existing Kwong Sang Hong Building
OA14 Existing Seapower Industrial Centre
Existing Kwun Tong area
OA15 Planned Runway Park, site 4D1
OA16 Planned Runway Park, site 4D1
OA17 Planned Runway Park, site 4D1
OA18 Planned tourism node, site 4D1
OA19 Planned cruise terminal building, site 4D3
OA20 Planned cruise terminal building, site 4D3
OA21 Planned cruise terminal building, site4D3
Runway area of Kai Tak Development

Agreement No. CE 35/2006(CE) Kai Tak Development Engineering Study Annex A cum Design and Construction of Advance Works KTAC and KTTS Studies – Investigation, Design and Construction
9-2
ASR ID Description Region
OA22 Planned local open space, site 4B5
OA23 Planned residential site 4B5
OA24 Planned residential site 4B4
OA25 Planned residential site 4B3
OA26 Planned residential site 4B2
OA27 Planned residential site 4B1
OA28 Planned residential site 4A1
OA29 Planned commercial site 4A3
OA30 Planned regional open space, site 4A
OA31 Planned regional open space, site 4A OA32 Planned regional open space, site 4A
Runway area of Kai Tak Development
OA33 Planned Site 1L4
OA34 Planned government site 1J3
OA35 Planned Site 1L1
OA36 Planned Site 1I3
OA37 Planned Site 1K1
OA38 Planned Site 1H3
OA39 Planned Site 1M1
OA40 Planned Site 1M2
North apron area of Kai Tak Development
OA41 Existing Lee Kau Yan Memorial School
OA42 Existing Sir Robert Black Health Centre Existing Kowloon City Area
9.4 Odour Emission Inventory 9.4.1 A detailed odour survey was conducted in the summer of 2007 to estimate the worst case
existing odour emission strength of KTN, KTAC and KTTS. During the odour survey, odour source samples were collected from KTAC, KTTS, and the section of KTN within the north apron of the former Kai Tak Airport. Details of the odour survey are presented in Section 3 of this Annex.
9.4.2 Odour source samples were collected from a total of 91 sampling locations including 7
locations at KTN, 58 locations at KTAC, and 26 locations at KTTS. The existing specific odour emission rates (SOER) derived from the odour concentration of collected samples for each source area are listed in Table 9.2. The water depth and bottom dissolved oxygen level measured at the sampling locations during the odour survey are also listed in the table. The odour survey was carried out during the hottest days and under with low tide periods in the summer. Because these conditions are conducive to release of trapped gases, the estimated odour emission rates are considered to represent a reasonable worst-case condition for the existing situation. Figure 9.2 shows the distribution and ID of the sampling locations and Figure 9.3 shows a contour plot of the existing odour strength of KTN, KTAC and KTTS based on the findings of odour survey.
Table 9.2 Existing Odour Emission Rates of KTN, KTAC, and KTTS
Location ID Water Depth (m) Bottom DO
(mg/l) SOER (ou/m
2/s)
KTN
A section of the KTN further to the north within 500m away from the project boundary of KTD
0.22 (taken as the SOER of KTN7,
see discussion in S.9.5.5)
KTN7 0.60 6.66 0.22
KTN6 0.50 5.55 3.79
KTN5 0.50 5.50 0.90
KTN4 0.80 6.04 0.21
KTN3 0.86 5.79 1.21
KTN2 1.08 3.46 44.58
KTN1 1.04 2.63 9.45

Agreement No. CE 35/2006(CE) Kai Tak Development Engineering Study cum Design and Construction of Advance Works Annex A – Investigation, Design and Construction KTAC and KTTS Studies
9-3
Location ID Water Depth (m) Bottom DO
(mg/l) SOER (ou/m
2/s)
KTAC
NKTAC93 2.4 0.36 1.83
NKTAC92 1.7 13.15 23.30
NKTAC91 0.8 1.59 18.19
NKTAC85 4.3 0.39 0.61
NKTAC84 3.9 0.46 1.16
NKTAC83 2.2 0.56 2.89
NKTAC82 1.8 5.04 10.25
NKTAC81 0.8 2.30 3.50
NKTAC75 3.7 0.23 0.20
NKTAC74 5.0 0.25 0.36
NKTAC73 3.8 0.47 0.61
NKTAC72 1.9 4.55 9.56
NKTAC71 1.9 0.83 2.46
NKTAC65 4.1 0.39 0.36
NKTAC64 4.2 0.41 0.63
NKTAC63 3.7 0.41 1.35
NKTAC62 2.2 0.41 19.74
NKTAC61 1.3 8.75 24.83
NKTAC55 4.2 0.43 0.44
NKTAC54 4.5 2.48 0.93
NKTAC53 4.0 0.47 1.16
NKTAC52 4.2 0.55 7.41
NKTAC51 1.2 3.02 13.51
NKTAC45 4.4 0.39 1.16
NKTAC44 4.2 0.37 0.98
NKTAC43 4.2 0.52 2.30
NKTAC42 4.0 0.34 1.97
NKTAC41 1.9 1.96 1.16
NKTAC35 1.1 3.95 17.10
NKTAC34 3.3 3.49 0.19
NKTAC33 4.0 3.22 0.19
NKTAC32 3.5 4.23 0.20
NKTAC31 1.5 5.77 2.13
NKTAC25 4.3 2.30 2.90
NKTAC24 4.2 2.76 0.86
NKTAC23 3.5 3.04 0.13
NKTAC22 3.1 2.22 0.13
NKTAC21 1.9 2.85 0.83
NKTAC15 4.3 4.20 0.31
NKTAC14 4.9 2.87 1.07
NKTAC13 4.4 2.71 0.30
NKTAC12 3.5 2.06 1.44
NKTAC11 1.9 6.73 1.90
SKTAC35 4.2 8.43 0.33
SKTAC34 4.8 13.20 0.22
SKTAC33 5.1 8.41 0.16
SKTAC32 4.8 7.85 0.19
SKTAC31 3.2 1.70 8.76
SKTAC25 3.9 0.60 2.20
SKTAC24 5.3 0.11 4.87
SKTAC23 5.2 0.12 2.05
SKTAC22 5.5 0.12 4.86
SKTAC21 4.1 5.00 0.15

Agreement No. CE 35/2006(CE) Kai Tak Development Engineering Study Annex A cum Design and Construction of Advance Works KTAC and KTTS Studies – Investigation, Design and Construction
9-4
Location ID Water Depth (m) Bottom DO
(mg/l) SOER (ou/m
2/s)
SKTAC15 3.4 2.34 3.64
SKTAC14 6.2 0.09 3.37
SKTAC13 5.7 0.10 2.05
SKTAC12 5.5 0.13 2.13
SKTAC11 3.5 2.79 2.05 KTTS
KTTS74 6.8 0.52 0.13
KTTS73 5.8 1.26 0.38
KTTS72 5.7 0.07 1.90
KTTS71 5.2 0.11 1.11
KTTS61 6.1 0.42 0.54
KTTS54 6.1 1.43 0.11
KTTS53 6.0 1.83 0.15
KTTS52 6.2 0.46 1.02
KTTS51 6.0 0.40 0.47
KTTS45 7.3 1.93 0.19
KTTS44 6.2 2.01 0.48
KTTS43 6.2 1.00 0.51
KTTS42 5.1 2.54 0.10
KTTS41 5.6 1.02 0.17
KTTS34 6.2 0.46 0.13
KTTS33 6.2 1.57 0.61
KTTS32 6.3 1.30 0.19
KTTS31 5.6 1.50 0.21
KTTS25 6.2 5.29 0.12
KTTS24 6.0 5.23 0.08
KTTS23 7.1 6.51 0.08
KTTS22 6.7 7.22 0.10
KTTS21 7.2 8.00 0.11
KTTS13 7.1 6.40 0.12
KTTS12 6.8 8.30 0.08
KTTS11 6.2 8.17 0.08
9.4.3 As discussed in Section 5 of this Annex and shown in Figure 9.3, high odour emission
areas include the southernmost portion of KTN, the area near the northern edge of KTAC, the area near the western bank of KTAC, and the area near the discharge point of the Jordan Valley Culvert (JVC).
9.4.4 In order to determine if there exists any strong relationships between odour emission rate
and other measured parameters in KTAC and KTTS specifically, the SOER were plotted against the corresponding water depth and DO level at the 84 sampling locations in KTAC and KTTS. The charts for SOER against water depth, and DO level are shown in Figures 9.4 and 9.5 respectively.
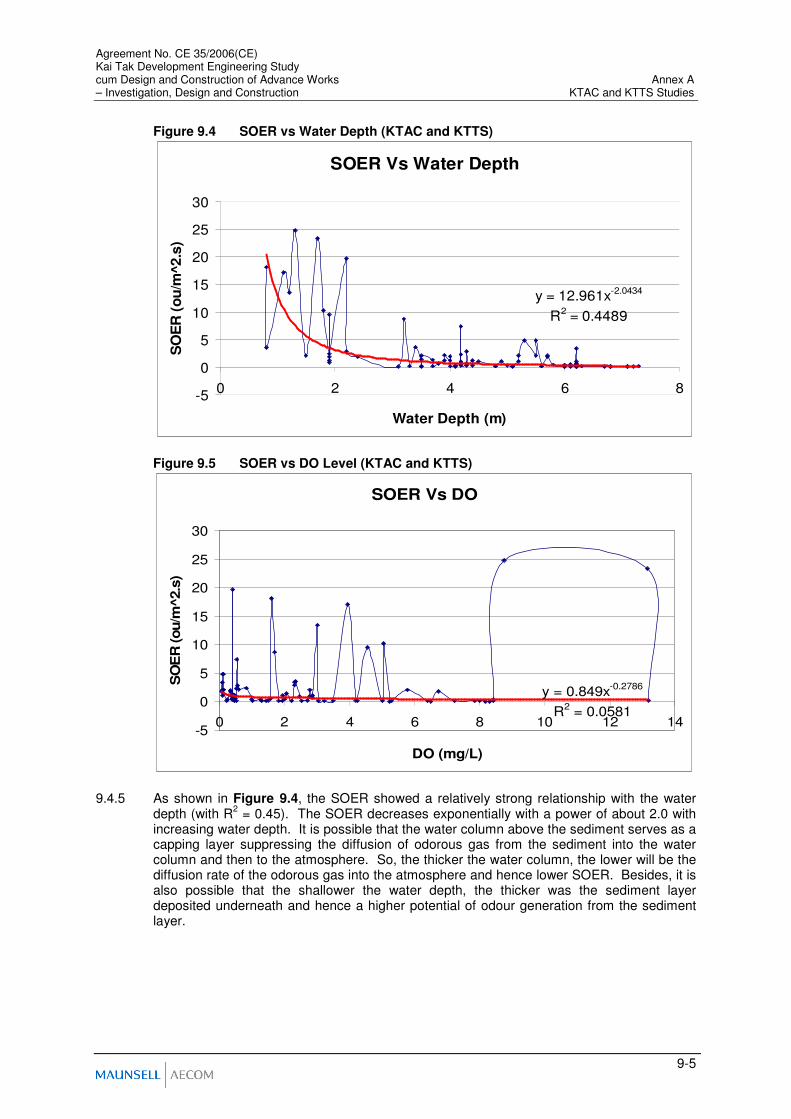
Agreement No. CE 35/2006(CE) Kai Tak Development Engineering Study cum Design and Construction of Advance Works Annex A – Investigation, Design and Construction KTAC and KTTS Studies
9-5
Figure 9.4 SOER vs Water Depth (KTAC and KTTS)
SOER Vs Water Depth
y = 12.961x-2.0434
R2 = 0.4489
-5
0
5
10
15
20
25
30
0 2 4 6 8
Water Depth (m)
SO
ER
(o
u/m
^2.s
)
Figure 9.5 SOER vs DO Level (KTAC and KTTS)
SOER Vs DO
y = 0.849x-0.2786
R2 = 0.0581
-5
0
5
10
15
20
25
30
0 2 4 6 8 10 12 14
DO (mg/L)
SO
ER
(ou/m
^2.s
)
9.4.5 As shown in Figure 9.4, the SOER showed a relatively strong relationship with the water
depth (with R2 = 0.45). The SOER decreases exponentially with a power of about 2.0 with
increasing water depth. It is possible that the water column above the sediment serves as a capping layer suppressing the diffusion of odorous gas from the sediment into the water column and then to the atmosphere. So, the thicker the water column, the lower will be the diffusion rate of the odorous gas into the atmosphere and hence lower SOER. Besides, it is also possible that the shallower the water depth, the thicker was the sediment layer deposited underneath and hence a higher potential of odour generation from the sediment layer.

Agreement No. CE 35/2006(CE) Kai Tak Development Engineering Study Annex A cum Design and Construction of Advance Works KTAC and KTTS Studies – Investigation, Design and Construction
9-6
9.4.6 Generally speaking, aerobic bacteria in the presence of dissolved oxygen convert organic matter to a stable form such as carbon dioxide, water, sulphates, and nitrates, etc., which are not odorous. On the other hand, lack of sufficient oxygen would result in anaerobic conditions and hence generation of reduced compounds, of which the most odoriferous are the reduced sulphur compounds (including hydrogen sulphide, dimethyl sulphide). However, as shown in Figure 9.5, there appears to be only a very weak relationship between SOER and DO level with R
2 of only about 0.06.
9.4.7 After further review of the field measurement results, an hypothesis that might explain the
low correlation between DO and SOER is that the DO level in northern KTAC might be subject to other influencing factors, such as the direct discharge of odoriferous compounds from KTN and JVC. To test this hypothesis, SOER was plotted against DO excluded data from northern KTAC. Figure 9.6 below confirms that with this exclusion there is a relatively strong relationship between SOER and DO level (with R
2 = 0.47). The SOER decreases
exponentially with a power of about 0.6 with increasing DO level.
Figure 9.6 SOER vs DO Level (Southern KTAC and KTTS)
SOER Vs DO
y = 0.4855x-0.6138
R2 = 0.4735
-2
0
2
4
6
8
10
0 2 4 6 8 10 12 14
DO (mg/L)
SO
ER
(o
u/m
^2.s
)
9.4.8 With reference to the survey results tabulated in Table 9.2 above for sampling locations in
KTAC and KTTS, the highest SOER of 24.83 ou/m2/s was recorded near the western bank
of KTAC (location ID: NKTAC61). Consistent with the above relationships between SOER and water depth and DO level as observed from the odour survey results of KTAC and KTTS, it is noted that SOER values are generally lower at locations with deep water and high DO level. At all locations within KTAC and KTTS with water depth of 3.5m or more, the highest SOER was only 7.41 ou/m
2/s. Among these locations with water depth of 3.5m or
more, if the bottom DO level met or higher than the Water Quality Objectives of 2mg/l, the highest SOER was even lower and was 2.90 ou/m
2/s only.
9.5 Odour Modelling Methodology
Air Dispersion Model 9.5.1 Odour impacts were assessed using the Industrial Source Complex Short Term 3 Model
(ISCST3), an air dispersion model acceptable to the Environmental Protection Department (EPD). Hourly meteorological data for year 2006 (including wind speed, wind direction, air temperature, Pasquill stability class and mixing height) recorded at the Hong Kong Observatory King’s Park Meteorological Station was employed for the model run. Because the study area is in an urban area, the “Urban” dispersion model option was selected.

Agreement No. CE 35/2006(CE) Kai Tak Development Engineering Study cum Design and Construction of Advance Works Annex A – Investigation, Design and Construction KTAC and KTTS Studies
9-7
9.5.2 The modelled hourly odour concentrations at the ASRs were converted into peak 5-second odour concentrations so as to compare with the EIAO-TM odour criteria. EPD’s “Guidelines on Choice of Models and Model Parameters”, recommends the methodologies proposed by Duffee et al.
1 and Keddie
2 in performing the conversion from hourly to 5-second average
concentration. However, it is noted that these methodologies are based on findings of earlier researchers on dispersion of odour emissions from point sources. More recent researchers have indicated that the peak-to-mean ratio used for odour dispersion assessments would depend upon the type of source, atmospheric stability and distance downwind. For example, depending on the physical size of source in relation to the distance to the ASR, the peak-to-mean ratio of odour dispersion from area source could be far smaller than that from point source. In this assessment, the major odour sources to be studied, namely the water surfaces of KTN, KTAC and KTTS, are in the form of large area sources. Therefore, for the purpose of this assessment, to produce more realistic predictions for odour dispersion from area sources, reference was made to the peak-to-mean ratio for area sources stipulated in “Approved Methods for Modelling and Assessment of Air Pollutants in New South Wales” published by the Department of Environment and Conservation, New South Wales, Australia (NSW Approved Method).
9.5.3 The dispersion modelling techniques employed for this assessment followed those described in EPD’s “Guidelines on Choice of Models and Model Parameters” using ISCST3 model except the use of alternative peak-to-mean ratios discussed above. However, it should be noted that the peak-to-mean ratios stated in the NSW Approved Method are derived based on experimental and theoretical analyses and assuming a 0.1% exceedance level (Ref.: Statistical Elements of Predicting the Impact of a Variety of Odour Sources, Peter R. Best, Karen E. Lunney and Christine A. Killip, Water Science and Technology, Australia, 44: 9 pp 157-164 2001). In other words, there would be a 0.1% probability that the actual peak concentration would be higher than those derived with the peak-to-mean ratios stated in the NSW Approved Method.
9.5.4 In accordance with the NSW Approved Method, the conversion factors are used for converting the maximum modelled 1-hour average concentrations to corresponding maximum 1-second average concentrations that could occur during that hour. As a conservative approach, these conversion factors were directly adopted for converting the 1-hour average concentrations predicted by the ISCST3 model to 5-second average concentrations for compliance checking with the odour criteria. In this case, the odour sources are located in the vicinity of the ASRs, therefore, the ASRs are considered to be located in the near field region with regards to the odour sources as per the NSW Approved Method. The conversion factors adopted in this assessment for different stability classes are shown in Table 9.3.
Table 9.3 Conversion Factors for Hourly to 5-second Average Concentration
Pasquill Stability Class Conversion Factor (1-hour to 5-second average)
A 2.5
B 2.5
C 2.5
D 2.5
E 2.3
F 2.3
1 Richard A. Duffee, Martha A. O”Brien and Ned Ostojic (1991). Odour Modelling – Why and How, Recent Developments and
Current Practices in Odour Regulation, Controls and Technology, Air & Waste Management Association. 2 Keddie, A. W, C(1980). Dispersion of Odours, Odour Control – A concise Guide, Warren Spring Laboratory.

Agreement No. CE 35/2006(CE) Kai Tak Development Engineering Study Annex A cum Design and Construction of Advance Works KTAC and KTTS Studies – Investigation, Design and Construction
9-8
Assessment Scenarios
9.5.5 Odour modelling was undertaken for both the existing (unmitigated) scenario and a number of mitigated scenarios. In the existing (unmitigated) scenario, all the odour source areas listed in Table 9.2 above were included in the dispersion model for assessing the existing odour impact. In addition, a section of the KTN further to the north within 500m away from the project boundary of KTD was also included in the odour impact assessment as existing odour source under both the existing (unmitigated) scenario and the mitigated scenarios. The location of KTN7 is the northernmost section of KTN with odour survey data and it well represents the potential odour emissions from the section of KTN immediate further north of the apron area. Thus the SOER measured at this location is taken to represent the existing section of KTN further north of the apron area.
9.5.6 The potential odour emissions from the headspace of KTN and JVC and from the accumulated sediment on the northern seawall of former Kai Tak Runway would have transient effect to the cumulative odour impacts at ASRs. However, these potential odour emissions are difficult to quantify and are not included in the odour modelling for the unmitigated scenario. Therefore, there would be certain degree of underestimation in the predicted odour impacts at ASRs under the unmitigated scenario. Having said that, these potential odour emissions would be mitigated under the mitigated scenarios (see Sections 9.5.12 and 13 below) and thus the underestimation described above does not apply to the results of the mitigated scenarios predicted in this study.
9.5.7 For the existing sewage treatment works (STW) at To Kwa Wan and Kwun Tong, proper odour mitigation measures have been implemented to prevent any adverse odour impacts at their existing adjacent ASRs. With reference to the odour complaint record maintained by EPD, there was no and only one odour related complaint for the Kwun Tong STW and To Kwa Wan STW respectively in the past 5 years. Besides, both the existing Kwun Tong STW and the proposed upgrading of Kwun Tong STW (in Site 6B1) are located at more than 500m from the nearest planned ASRs in KTD, cumulative odour impacts at the planned ASRs in KTD due to Kwun Tong STW and its proposed upgrading is not expected. The proposed upgrading of Kwun Tong STW is classified as a Designated Project under EIAO, the associated environmental impacts will be addressed in a further detailed EIA study to be prepared by the future project proponent. For the existing To Kwa Wan STW, a new deodorisation system has recently been commissioned in year 2006 to mitigate the potential odour emissions from the STW and no odour complaint was received thereafter. Therefore, unacceptable odour impacts associated with the existing To Kwa Wan STW at the surrounding existing and planned ASRs shall not be expected. Cumulative odour impacts at the planned ASRs in KTD are thus also not expected.
9.5.8 For the proposed sewage pumping stations within KTD, all the major odour sources including wet well and distribution chambers would be located within enclosed building structures. With proper enclosure and ventilation system to divert the odour emissions to deodorizers for treatment before discharge to the atmosphere, the residual odour impacts associated with the sewage pumping stations should be minimal and localized if any, and cumulative odour impacts with odour emissions from KTAC and KTTS are not expected.
9.5.9 In the mitigated scenarios, the potential odour emissions from KTAC and KTTS would be mitigated by a series of odour reduction measures including in-situ sediment treatment by bioremediation, maintenance dredging to provide a sufficient water depth as capping layer for the sediment, improvement of water circulation to increase the DO level in KTAC and KTTS, and containment of pollution entering KTAC and KTTS.

Agreement No. CE 35/2006(CE) Kai Tak Development Engineering Study cum Design and Construction of Advance Works Annex A – Investigation, Design and Construction KTAC and KTTS Studies
9-9
9.5.10 The following assumptions were made in estimating the SOER for the source areas in KTAC and KTTS with the implementation of the proposed mitigation measures:
1. Localised maintenance dredging: It is assumed that localised maintenance dredging will provide water depth of not less than 3.5m over the whole of KTAC and KTTS. With reference to the water depth data recorded during the odour survey, only some areas along the edge of KTAC, in particular the area near the northern edge and the area near the JVC discharge have water depths shallower than 3.5m. The area involved would be about one-third of the KTAC and the dredging depth required would be from about 2.7m to less than 1m. Figure 9.7 shows the sampling grids with water depth smaller than 3.5m during the odour survey. The dredging volume involved is estimated to be about 120,000 m
3. With the use of one closed grab dredger of 8m
3 capacity and
a daily dredging rate of about 1,000 m3, the localized maintenance dredging would be
finished within a total dredging period of about 120 days. The dredged sediment will be disposed of in accordance with the ETWB TCW No. 34/2002 Management of Dredged / Excavated Sediment. The proposed localized maintenance dredging will be implemented prior to the occupation of the future development in the immediate vicinity of the concerned section of KTAC. With regards to the handling of dredged materials during localized maintenance dredging, mitigation measures will be proposed to minimize the potential impacts, these include: (i) careful control of dredging rate; (ii) covering of the dredged materials; and (iii) dredging during non-summer season. With the implementation of these measures, the potential odour nuisance could be minimized and adverse odour impact at nearby ASRs is not expected.
2. Improvement of water circulation in KTAC and KTTS: As discussed in Section 7, with the proposed 600m gap opening at the northern part of the former Kai Tak runway, the water circulation in KTAC and KTTS would be substantially improved. Together with the improvement in water circulation, the DO level in KTAC and KTTS would also be increased. As shown in the second figure in Appendix 7.4, under the existing situation, the 10 percentile bottom DO level in almost the entire KTAC and KTTS would be below the Water Quality Objectives of 2 mg/l. With the proposed 600m gap opening at the former Kai Tak runway, the bottom DO level in the entire KTAC and KTTS would be increased to 2 – 4 mg/l and fully complied with the Water Quality Objectives.
3. Combined effect of increased water depth and increased DO level: With reference to the odour survey results collected from KTAC and KTTS, at sampling locations with water depth not less than 3.5m and the bottom DO level not less than 2 mg/l, the highest recorded SOER was 2.90 ou/m
2/s. Therefore, for the purpose of this
assessment, it was assumed that the combined effect of increased water depth and increased DO level (by implementing item 1 and item 2 above) would bring down the SOER of high odour emission areas to 2.90 ou/m
2/s. This residual SOER is a key
assumption estimated based on the limited survey data collected under this study.

Agreement No. CE 35/2006(CE) Kai Tak Development Engineering Study Annex A cum Design and Construction of Advance Works KTAC and KTTS Studies – Investigation, Design and Construction
9-10
4. In-situ sediment treatment by bioremediation: Bioremediation would be applied to the entire KTAC and KTTS. The areas proposed for in-situ bioremediation are shown in Figure 9.8. With reference to results of the laboratory testing presented in Section 4, the odour removal efficiency of bioremediation improves with greater water depth and higher temperature. Taking into account the proposed measure to increase the water depth to not less than 3.5m under Item 1 above, the laboratory testing results with water column of 1.2m are considered more relevant. Based on the laboratory testing results with water column of 1.2m and under testing temperature of 25
oC, the odour
removal efficiency of bioremediation was measured to be about 80-94%. At higher testing temperature of 35
oC (but with water column of 0.8m), the odour removal
efficiency of bioremediation was even higher and measured to be about 97-98%. The odour removal efficiency of bioremediation would depend on a number of factors including by not limited to dosage, depth of injection, frequency of injection, etc (also see Section 6 of this Annex for more discussion). For the purpose of this assessment, two levels of odour removal efficiency by bioremediation, 80% and 90%, were examined. For the bioremediation operation, as discussed in Section 6 of this Annex, the final products of the bioremediation process will mainly be odourless gases namely nitrogen and carbon dioxide. Besides, based on the experience of previous field trial on bioremediation, the vessel injecting the liquid calcium nitrate solution would be travelling at a very slow speed of about 0.2m/sec. With this slow speed, any physical disturbance to the sediment and hence bubbling of H2S gas would be instantaneous reacted with the calcium nitrate solution and odour emission during the bioremediation process is not expected. Odour emissions during the bioremediation process are therefore not anticipated, and this also agreed with the site observations during the previous field trials.
5. Containment of pollution entering KTAC and KTTS: Two desilting compounds are
proposed for KTN (at Site 1D6 and Site 1P1) and a dry weather flow interceptor (DWFI) compound is proposed for JVC (at Site 3A3) to contain pollution in drainage systems entering the KTAC and KTTS by interception facilities until the ultimate removal of the pollution sources. Tidal barriers and desiliting facilities will form part of the compounds to prevent any accumulation of sediment within the downstream section of KTN and JVC and hence fully mitigate the potential odour emissions from the headspace of KTN and JVC near the existing discharge locations. The odour generating operations within the proposed desilting compounds and DWFI compound will be fully enclosed and the odorous air will be collected and treated by high efficiency deodorizers before discharge to the atmosphere.
9.5.11 In this assessment, four mitigated scenarios for KTAC and KTTS were examined. The four
mitigated scenarios are:
Mitigated Scenario A1: Decking of KTN within apron area + full mitigation of KTN and JVC headspace + desilting enhancement + localised maintenance dredging + 600m gap opening + in-situ bioremediation to achieve further 80% odour removal efficiency
Mitigated Scenario A2: Decking of KTN within apron area + full mitigation of KTN and JVC headspace + desilting enhancement + localised maintenance dredging + 600m gap opening + in-situ bioremediation to achieve further 90% odour removal efficiency
Mitigated Scenario B1: Reconstruct KTN into Kai Tak River within apron area + full mitigation of KTN and JVC headspace + desilting enhancement + localised maintenance dredging + 600m gap opening + in-situ bioremediation to achieve further 80% odour removal efficiency

Agreement No. CE 35/2006(CE) Kai Tak Development Engineering Study cum Design and Construction of Advance Works Annex A – Investigation, Design and Construction KTAC and KTTS Studies
9-11
Mitigated Scenario B2: Reconstruct KTN into Kai Tak River within apron area + full mitigation of KTN and JVC headspace + desilting enhancement + localised maintenance dredging + 600m gap opening + in-situ bioremediation to achieve further 90% odour removal efficiency
9.5.12 Under all the mitigated scenarios, two desilting compounds are proposed for KTN (at Site 1D6 and Site 1P1) and a dry weather flow interceptor (DWFI) compound is proposed for JVC (at Site 3A3) to contain pollution in drainage systems entering the KTAC and KTTS by interception facilities until the ultimate removal of the pollution sources. Tidal barriers and desiliting facilities will form part of the compounds to prevent any accumulation of sediment within the downstream section of KTN and JVC and hence fully mitigate the potential odour emissions from the headspace of KTN and JVC near the existing discharge locations. The odour generating operations within the proposed desilting compounds and DWFI compound will be fully enclosed and the odorous air will be collected and treated by high efficiency deodorizers before discharge to the atmosphere. Besides, all the three proposed desilting compounds and DWFI compound are separated from the immediate adjacent existing and/or planned ASRs with roads and/or amenity area. The compounds mainly serve to remove, dry and dispose of the sediment deposited at the box culvert of KTN and JVC. The detailed processes will be subjected to the detailed design of the compounds. With regards to the desilting operation, it is anticipated that the operation will be conducted within dry season. Five months from November to March are defined as the dry season and hence all desilting activities shall be scheduled to complete within this period each year as a cycle. Since the dry season is also the period with lower ambient temperature, odour nuisance associated with the operation of the desilting or DWFI compound during this period should also be lower. Therefore, it is anticipated that the residual odour impacts associated with the desilting compounds and the DWFI compound should be minimal and localized if any, and cumulative odour impacts with odour emissions from KTAC and KTTS are not expected.
9.5.13 Besides, a large section of the northern seawall of the former Kai Tak Runway with deposition of sediment will be removed due to the construction of 600m gap opening under the mitigated scenarios. Any residual sediment deposited on the remaining section of northern seawall will also be cleaned up with the measures discussed in Section 6.7 of this Annex. Significant residual odour emissions from the seawall of the former Kai Tak Runway are therefore not expected.
9.5.14 Under Mitigated Scenarios B1 and B2, the existing Kai Tak Nullah within the former Apron area will be re-constructed into Kai Tak River from the south of Road D1 to the north of Road D2 along the existing alignment of KTN. The Kai Tak River will compose of a number of channels flowing with non-odorous fresh water and THEES effluent. The channel flowing with THEES effluent will be designed with the width of water surface of not more than 16m. For the purpose of the odour impact assessment, the SOER of the 16m wide THEES effluent flowing in the Kai Tak River will be taken as the SOER estimated for location KTN7 (the northern-most section of KTN within the former apron area). The location of KTN7 is now predominately flowing with THEES effluent without much influence from other runoff or expedient connections. Thus the SOER measured at this location is taken to conservatively represent the future THEES effluent-only flow in Kai Tak River.
9.5.15 The SOER assumed for the odour emitting areas in KTN, KTAC and KTTS under the unmitigated scenario and the four mitigated scenarios are tabulated in Table 9.4.

Agreement No. CE 35/2006(CE) Kai Tak Development Engineering Study Annex A cum Design and Construction of Advance Works KTAC and KTTS Studies – Investigation, Design and Construction
9-12
Table 9.4 Odour Emission Rates (SOER (ou/m2/s) of KTN, KTAC, and KTTS under
Different Modelling Scenarios
Location ID Existing
(Unmitigated Scenario)
Mitigated Scenarios A1 & B1
Mitigated Scenario A2 & B2
KTN
A section of the KTN
further to the north within 500m away
from the project
boundary of KTD
0.22 0.22 0.22 0.22 0.22
KTN7 0.22 KTN6 3.79
KTN5 0.90 KTN4 0.21 KTN3 1.21 KTN2 44.58 KTN1 9.45
Scenario A1
0.00 (for the whole
length of KTN within
KTD)
Scenario B1
0.22 (for the whole
length of Kai Tak River)
Scenario A2
0.00 (for the whole
length of KTN within
KTD)
Scenario B2
0.22 (for the whole
length of Kai Tak River)
KTAC
NKTAC93 1.83 0.366 0.183 NKTAC92 23.30 0.580 * 0.290 * NKTAC91 18.19 0.580 * 0.290 * NKTAC85 0.61 0.122 0.061
NKTAC84 1.16 0.232 0.116 NKTAC83 2.89 0.578 0.289 NKTAC82 10.25 0.580 * 0.290 * NKTAC81 3.50 0.580 * 0.290 * NKTAC75 0.20 0.040 0.020 NKTAC74 0.36 0.072 0.036
NKTAC73 0.61 0.122 0.061 NKTAC72 9.56 0.580 * 0.290 * NKTAC71 2.46 0.492 0.246 NKTAC65 0.36 0.072 0.036 NKTAC64 0.63 0.126 0.063
NKTAC63 1.35 0.270 0.135 NKTAC62 19.74 0.580 * 0.290 * NKTAC61 24.83 0.580 * 0.290 * NKTAC55 0.44 0.088 0.044 NKTAC54 0.93 0.186 0.093
NKTAC53 1.16 0.232 0.116 NKTAC52 7.41 0.580 * 0.290 * NKTAC51 13.51 0.580 * 0.290 * NKTAC45 1.16 0.232 0.116 NKTAC44 0.98 0.196 0.098
NKTAC43 2.30 0.460 0.230 NKTAC42 1.97 0.394 0.197 NKTAC41 1.16 0.232 0.116 NKTAC35 17.10 0.580 * 0.290 * NKTAC34 0.19 0.038 0.019
NKTAC33 0.19 0.038 0.019 NKTAC32 0.20 0.040 0.020 NKTAC31 2.13 0.426 0.213 NKTAC25 2.90 0.580 0.290

Agreement No. CE 35/2006(CE) Kai Tak Development Engineering Study cum Design and Construction of Advance Works Annex A – Investigation, Design and Construction KTAC and KTTS Studies
9-13
Location ID Existing
(Unmitigated Scenario)
Mitigated Scenarios A1 & B1
Mitigated Scenario A2 & B2
NKTAC24 0.86 0.172 0.086 NKTAC23 0.13 0.026 0.013 NKTAC22 0.13 0.026 0.013 NKTAC21 0.83 0.166 0.083
NKTAC15 0.31 0.062 0.031 NKTAC14 1.07 0.214 0.107 NKTAC13 0.30 0.060 0.030 NKTAC12 1.44 0.288 0.144 NKTAC11 1.90 0.380 0.190
SKTAC35 0.33 0.066 0.033 SKTAC34 0.22 0.044 0.022 SKTAC33 0.16 0.032 0.016 SKTAC32 0.19 0.038 0.019 SKTAC31 8.76 0.580 * 0.290 *
SKTAC25 2.20 0.440 0.220 SKTAC24 4.87 0.580 * 0.290 * SKTAC23 2.05 0.410 0.205 SKTAC22 4.86 0.580 * 0.290 * SKTAC21 0.15 0.030 0.015
SKTAC15 3.64 0.580 * 0.290 * SKTAC14 3.37 0.580 * 0.290 * SKTAC13 2.05 0.410 0.205 SKTAC12 2.13 0.426 0.213 SKTAC11 2.05 0.410 0.205
KTTS
KTTS74 0.13 0.026 0.013 KTTS73 0.38 0.076 0.038 KTTS72 1.90 0.380 0.190 KTTS71 1.11 0.222 0.111 KTTS61 0.54 0.108 0.054
KTTS54 0.11 0.022 0.011 KTTS53 0.15 0.030 0.015 KTTS52 1.02 0.204 0.102 KTTS51 0.47 0.094 0.047 KTTS45 0.19 0.038 0.019
KTTS44 0.48 0.096 0.048 KTTS43 0.51 0.102 0.051 KTTS42 0.10 0.020 0.010 KTTS41 0.17 0.034 0.017 KTTS34 0.13 0.026 0.013
KTTS33 0.61 0.122 0.061 KTTS32 0.19 0.038 0.019 KTTS31 0.21 0.042 0.021 KTTS25 0.12 0.024 0.012 KTTS24 0.08 0.016 0.008
KTTS23 0.08 0.016 0.008 KTTS22 0.10 0.020 0.010 KTTS21 0.11 0.022 0.011 KTTS13 0.12 0.024 0.012 KTTS12 0.08 0.016 0.008
KTTS11 0.08 0.016 0.008

Agreement No. CE 35/2006(CE) Kai Tak Development Engineering Study Annex A cum Design and Construction of Advance Works KTAC and KTTS Studies – Investigation, Design and Construction
9-14
Note: * As discussed in S9.5.10 item 3 above, for the purpose of this assessment, it was assumed that the combined effect of increased water depth and increased DO level (by implementing item 1 and item 2 of S9.5.10) would bring down the SOER of these high odour emission areas to 2.90 ou/m
2/s. The mitigated SOER is therefore
calculated as 20% x 2.90 = 0.580 ou/m2/s under Mitigated Scenarios A1 & B1 and
10% x 2.90 = 0.290 ou/m2/s under Mitigated Scenarios A2 & B2.
Presentation of Assessment Results
9.5.16 The odour concentrations within the study area under existing (unmitigated) scenario and the four mitigated scenarios are presented in the form of contour plots.
9.6 Evaluation and Prediction of Potential Odour Impacts Existing (Unmitigated) Scenario
9.6.1 The predicted odour concentrations in the vicinity of the Kai Tak Development under the existing scenario due to odour impacts arising from KTN, KTAC and KTTS are presented in Figures 9.9a to 9.9d in the form of contour plots for assessment heights of 1.5m, 10m, 20m, and 30m above ground respectively.
9.6.2 The predicted odour concentrations at the representative ASRs are listed in Table 9.5. Under the existing (unmitigated) scenario, the predicted odour concentrations at 1.5m level of the representative ASRs in the runway area would be in the range of 66.8 – 675.0 ou/m
3.
Whereas the predicted odour concentrations at 1.5m level of the representative ASRs in the north apron area and the south apron area would be in the range of 86.3 – 550.6 ou/m
3 and
79.6 – 447.0 ou/m3 respectively. The predicted odour concentrations at 1.5m level of the
representative existing ASRs in the Kwun Tong and Kowloon City areas would be in the range of 56.2 – 71.9 ou/m
3. The dominant odour sources are the southern section of KTN
and the northern portion of KTAC.
Mitigated Scenario A1 9.6.3 Figure 9.10a to 9.10d are the odour contour plots for the predicted odour concentrations in
the vicinity of the Kai Tak Development at assessment height of 1.5m, 10m, 20m, and 30m above ground respectively, based on the implementation of the proposed mitigation measures including in-situ treatment of the most contaminated sediment by bioremediation to achieve further 80% odour removal efficiency together with decking of KTN within apron area.
9.6.4 The odour contour plots show that the predicted odour concentrations in the vicinity of the
Kai Tak Development have been reduced significantly. Besides, as shown in Table 9.5, the predicted odour concentrations at 1.5m level of the representative ASRs in the runway area would be reduced from 66.8 – 675.0 ou/m
3 to 6.9 – 25.1 ou/m
3. Whereas the predicted
odour concentrations at 1.5m level of the representative ASRs in the north apron area and the south apron area would be reduced from 86.3 – 550.6 ou/m
3 and 79.6 – 447.0 ou/m
3 to
4.1 – 20.5 ou/m3 and 8.0 – 32.2 ou/m
3 respectively. The predicted odour concentrations at
1.5m level of the representative existing ASRs in the Kwun Tong and Kowloon City areas would be in the range of 4.2 – 11.2 ou/m
3. Exceedances of the odour criteria of 5 ou/m
3 are
predicted at all the selected planned ASRs in the runway and south apron areas and some ASRs in the north apron area and the existing Kwun Tong and Kowloon City areas under the worst-case conditions.
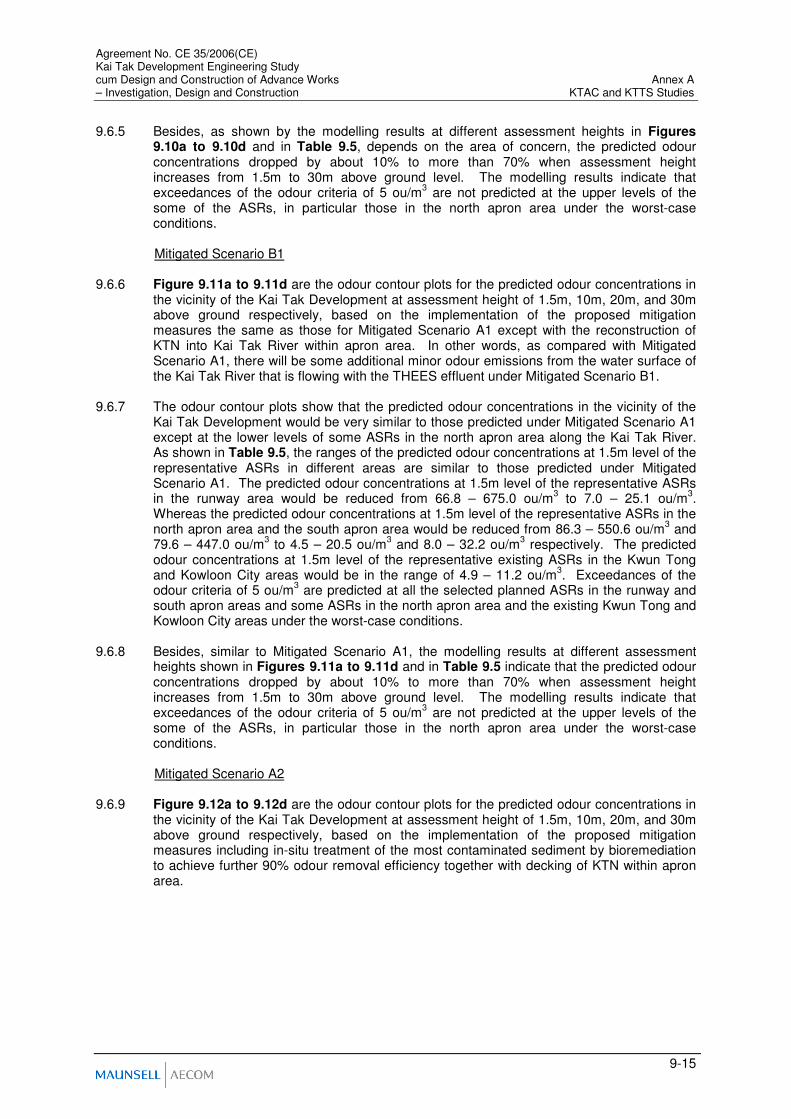
Agreement No. CE 35/2006(CE) Kai Tak Development Engineering Study cum Design and Construction of Advance Works Annex A – Investigation, Design and Construction KTAC and KTTS Studies
9-15
9.6.5 Besides, as shown by the modelling results at different assessment heights in Figures 9.10a to 9.10d and in Table 9.5, depends on the area of concern, the predicted odour concentrations dropped by about 10% to more than 70% when assessment height increases from 1.5m to 30m above ground level. The modelling results indicate that exceedances of the odour criteria of 5 ou/m
3 are not predicted at the upper levels of the
some of the ASRs, in particular those in the north apron area under the worst-case conditions.
Mitigated Scenario B1
9.6.6 Figure 9.11a to 9.11d are the odour contour plots for the predicted odour concentrations in
the vicinity of the Kai Tak Development at assessment height of 1.5m, 10m, 20m, and 30m above ground respectively, based on the implementation of the proposed mitigation measures the same as those for Mitigated Scenario A1 except with the reconstruction of KTN into Kai Tak River within apron area. In other words, as compared with Mitigated Scenario A1, there will be some additional minor odour emissions from the water surface of the Kai Tak River that is flowing with the THEES effluent under Mitigated Scenario B1.
9.6.7 The odour contour plots show that the predicted odour concentrations in the vicinity of the
Kai Tak Development would be very similar to those predicted under Mitigated Scenario A1 except at the lower levels of some ASRs in the north apron area along the Kai Tak River. As shown in Table 9.5, the ranges of the predicted odour concentrations at 1.5m level of the representative ASRs in different areas are similar to those predicted under Mitigated Scenario A1. The predicted odour concentrations at 1.5m level of the representative ASRs in the runway area would be reduced from 66.8 – 675.0 ou/m
3 to 7.0 – 25.1 ou/m
3.
Whereas the predicted odour concentrations at 1.5m level of the representative ASRs in the north apron area and the south apron area would be reduced from 86.3 – 550.6 ou/m
3 and
79.6 – 447.0 ou/m3 to 4.5 – 20.5 ou/m
3 and 8.0 – 32.2 ou/m
3 respectively. The predicted
odour concentrations at 1.5m level of the representative existing ASRs in the Kwun Tong and Kowloon City areas would be in the range of 4.9 – 11.2 ou/m
3. Exceedances of the
odour criteria of 5 ou/m3 are predicted at all the selected planned ASRs in the runway and
south apron areas and some ASRs in the north apron area and the existing Kwun Tong and Kowloon City areas under the worst-case conditions.
9.6.8 Besides, similar to Mitigated Scenario A1, the modelling results at different assessment
heights shown in Figures 9.11a to 9.11d and in Table 9.5 indicate that the predicted odour concentrations dropped by about 10% to more than 70% when assessment height increases from 1.5m to 30m above ground level. The modelling results indicate that exceedances of the odour criteria of 5 ou/m
3 are not predicted at the upper levels of the
some of the ASRs, in particular those in the north apron area under the worst-case conditions.
Mitigated Scenario A2
9.6.9 Figure 9.12a to 9.12d are the odour contour plots for the predicted odour concentrations in
the vicinity of the Kai Tak Development at assessment height of 1.5m, 10m, 20m, and 30m above ground respectively, based on the implementation of the proposed mitigation measures including in-situ treatment of the most contaminated sediment by bioremediation to achieve further 90% odour removal efficiency together with decking of KTN within apron area.

Agreement No. CE 35/2006(CE) Kai Tak Development Engineering Study Annex A cum Design and Construction of Advance Works KTAC and KTTS Studies – Investigation, Design and Construction
9-16
9.6.10 The odour contour plots show that the predicted odour concentrations in the vicinity of the Kai Tak Development have been reduced significantly. Besides, as shown in Table 9.5, the predicted odour concentrations at 1.5m level of the representative ASRs in the runway area would be reduced from 66.8 – 675.0 ou/m
3 to 3.5 – 12.6 ou/m
3. Whereas the predicted
odour concentrations at 1.5m level of the representative ASRs in the north apron area and the south apron area would be reduced from 86.3 – 550.6 ou/m
3 and 79.6 – 447.0 ou/m
3 to
2.1 – 10.3 ou/m3 and 4.0 – 16.1 ou/m
3 respectively. The predicted odour concentrations at
1.5m level of the representative existing ASRs in the Kwun Tong and Kowloon City areas would be in the range of 3.7 – 11.2 ou/m
3. Exceedances of the odour criteria of 5 ou/m
3 are
predicted at some of the selected planned ASRs in the runway, south apron, and north apron areas under worst-case conditions. Exceedance is also predicted at 1.5m level of ASR OA41 in the existing Kowloon City area. The same odour concentrations were predicted at the 1.5m level of ASR OA41 under both Mitigation Scenario A1 and Mitigated Scenario A2, this indicates that the predicted exceedance at ASR OA41 is due to the odour emission from the existing KTN to the north of Prince Edward Road East rather than the residual odour emission from KTAC or Kai Tak River.
9.6.11 Besides, as shown by the modelling results at different assessment heights in Figures
9.12a to 9.12d and in Table 9.5, depends on the area of concern, the predicted odour concentrations dropped by about 10% to more than 70% when assessment height increases from 1.5m to 30m above ground level. The modelling results indicate that exceedances of the odour criteria of 5 ou/m
3 are not predicted at 30m level of most of the
ASRs under the worst-case conditions.
Mitigated Scenario B2 9.6.12 Figure 9.13a to 9.13d are the odour contour plots for the predicted odour concentrations in
the vicinity of the Kai Tak Development at assessment height of 1.5m, 10m, 20m, and 30m above ground respectively, based on the implementation of the proposed mitigation measures the same as those for Mitigated Scenario A2 except with the reconstruction of KTN into Kai Tak River within apron area. In other words, as compared with Mitigated Scenario A2, there will be some additional minor odour emissions from the water surface of the Kai Tak River that is flowing with the THEES effluent under Mitigated Scenario B2.
9.6.13 The odour contour plots show that the predicted odour concentrations in the vicinity of the
Kai Tak Development would be very similar to those predicted under Mitigated Scenario A2 except at the lower levels of some ASRs in the north apron area along the Kai Tak River. As shown in Table 9.5, the ranges of the predicted odour concentrations at 1.5m level of the representative ASRs in different areas are similar to those predicted under Mitigated Scenario A2. The predicted odour concentrations at 1.5m level of the representative ASRs in the runway area would be reduced from 66.8 – 675.0 ou/m
3 to 3.5 – 12.6 ou/m
3.
Whereas the predicted odour concentrations at 1.5m level of the representative ASRs in the north apron area and the south apron area would be reduced from 86.3 – 550.6 ou/m
3 and
79.6 – 447.0 ou/m3 to 2.5 – 10.3 ou/m
3 and 4.0 – 16.1 ou/m
3 respectively. The predicted
odour concentrations at 1.5m level of the representative existing ASRs in the Kwun Tong and Kowloon City areas would be in the range of 3.7 – 11.2 ou/m
3. Exceedances of the
odour criteria of 5 ou/m3 are predicted at some of the selected planned ASRs in the runway,
south apron, and north apron areas under worst-case conditions. Exceedance is also predicted at 1.5m level of ASR OA41 in the existing Kowloon City area. As discussed above, the predicted exceedance at ASR OA41 is due to the odour emission from the existing KTN to the north of Prince Edward Road East rather than the residual odour emission from KTAC or Kai Tak River.

Agreement No. CE 35/2006(CE) Kai Tak Development Engineering Study cum Design and Construction of Advance Works Annex A – Investigation, Design and Construction KTAC and KTTS Studies
9-17
9.6.14 Besides, similar to Mitigated Scenario A2, the modelling results at different assessment heights shown in Figures 9.13a to 9.13d and in Table 9.5 indicate that the predicted odour concentrations dropped by about 10% to more than 70% when assessment height increases from 1.5m to 30m above ground level. The modelling results indicate that exceedances of the odour criteria of 5 ou/m
3 are not predicted at 30m level of most of the
ASRs under the worst-case conditions.
Residual Odour Impacts
9.6.15 In order to investigate the frequency of exceedance of the odour criterion at the representative ASRs under the four mitigated scenarios, odour modelling was conducted for every hour of a year based on year 2006 hourly meteorological data. However, as discussed above in Section 9.5.3, the peak-to-mean ratios stated in the NSW Approved Method employed in this odour assessment has assumed a 0.1% exceedance level. Therefore, there is a 0.1% probability that the actual peak concentration would be higher than those derived with the peak-to-mean ratios stated in the NSW Approved Method. Conservatively, if we assume all of this 0.1% actual peak concentration (which are higher than the predicted peak concentration) exceeded the odour criterion, then there would be 0.1% more of time exceedance in year at the ASRs. The predicted frequency of exceedance at the representative ASRs under the mitigated scenarios, including the additional 0.1% due to intrinsic uncertainty of the modelling approach, are shown in Tables 9.6 and 9.7.
9.6.16 The odour modelling results indicate that with the implementation of the proposed mitigation
measures, the existing odour problems in the vicinity of Kai Tak Development would be alleviated to a large extent. However, exceedances of the odour criterion are still predicted at some ASRs under the worst case condition. The following points should be noted with reference to Section 4.4.3 of the EIAO-TM regarding the predicted residual odour impacts at these ASRs:
(i) Effects on public health and health of biota or risk to life:
In terms of human health effects of hydrogen sulphide3, respiratory, neurological, and
ocular effects are the most sensitive end-points in humans following inhalation exposures. There are no adequate data on carcinogenicity. Exposure of H2S at 2.0 ppm would cause bronchial constriction in asthmatic individuals; while exposure of 3.6 ppm H2S would cause increase eye complaints for general population; and exposure of 20 ppm H2S would cause fatigue, loss of appetite, headache, irritability, poor memory, and dizziness. Besides, with reference to the Integrated Risk Information System (IRIS) of USEPA, the reference concentration of H2S for chronic inhalation exposure to human population without an appreciable risk of deleterious effects during a lifetime is 2 x 10
-3 mg/m
3 (or 0.00142 ppm).
As shown in Table 9.5, the predicted maximum odour concentrations at the representative ASRs among the four mitigated scenarios would be 32.2 ou/m
3 over 5
second average. With reference to the detailed laboratory testing results for sediments collected from bioremediation test area as presented in Table 4.2, the ratio of H2S concentration (in ppb) to odour concentration (ou/m
3) ranges from 0.38% to
2.00%. If we take the highest ratio of 2.00%, 32.2 ou/m3 is equivalent to H2S
concentration of about 0.000644 ppm which is more than 3000 times below the H2S concentration of 2.0 ppm with adverse health symptom on asthmatic individuals. This level of H2S concentration is also less than 50% of the reference chronic inhalation exposure concentration stipulated in the USEPA IRIS.
3 Concise International Chemical Assessment Document 53, Hydrogen Sulfide: Human Health Aspects, World Health
Organization, 2003

Agreement No. CE 35/2006(CE) Kai Tak Development Engineering Study Annex A cum Design and Construction of Advance Works KTAC and KTTS Studies – Investigation, Design and Construction
9-18
To conclude, it is expected that no adverse health impact to human for exposure under such a low concentration of H2S.
(ii) The magnitude of adverse environmental impacts:
The predicted worst-case odour concentrations at the representative ASRs under the four mitigated scenarios are tabulated in Table 9.5.
(iii) The geographic extent of the adverse environmental impacts:
The extent of exceedance of the odour criterion are shown in Figures 9.10 to 9.13 for the four mitigated scenarios.
(iv) The duration and frequency of the adverse environmental impacts:
The duration and frequency of exceedance of odour criterion at the representative ASRs under the four mitigated scenarios are tabulated in Tables 9.6 and 9.7. Exceedances of one time and two times of the odour criterion at some ASRs in close proximity to KTAC and KTTS would still occur for 46.9% and 32.7% of time respectively in a year under Mitigated Scenarios A1 and B1. Whereas under Mitigated Scenarios A2 and B2, exceedances of one time and two times of the odour criterion at some ASRs in close proximity to KTAC and KTTS would occur for 32.7% and 10.2% of time respectively in a year. However, it should be noted that these frequencies of exceedances only take into account the variation of wind direction and wind speed over the year but assuming worst-case odour emission conditions (i.e. the highest odour emissions captured under this study during low tides in the hottest days in summer season) prevail over the entire year. With reference to the findings of the laboratory testing presented in Section 4, substantial increase in H2S and odour emissions were observed when the temperature increase from 25
oC to 35
oC under
the laboratory conditions. Based on the year 2006 hourly meteorological data, the percentage of time over a year with ambient temperature at or exceeding 25
oC is
about 45%. By assuming that the worst case odour emissions would occur during period with ambient temperature at or exceeding 25
oC and during low tides (say 50%
of time in a day), under Mitigated Scenarios A1 and B1, exceedances of one time and two times of the odour criterion at some ASRs in close proximity to KTAC and KTTS would be roughly estimated to occur for about 10.6% and 7.4% of time respectively in a year, whereas under Mitigated Scenarios A2 and B2, exceedances of one time and two times of the odour criterion at some ASRs in close proximity to KTAC and KTTS would be roughly estimated to occur for about 7.4% and 2.3% of time respectively in a year.
(v) The likely size of the community or the environment that may be affected by the
adverse impacts:
As indicated in Figures 9.10 to 9.13, with the implementation of proposed odour mitigation measures, the odour concentrations in the vicinity of the Kai Tak Development would be reduced substantially as compared with the existing (unmitigated) scenario. However, exceedances of the odour criterion are still predicted at some ASRs under the four mitigated scenarios. Yet the modelling results indicate that the worst-case odour impacts would only occur near the ground level of the ASRs. Under Mitigated Scenarios A2 and B2, at 30m above ground, the modelling results only indicate localised exceedances around a southern part of the runway area and around the stadium complex. In other words, the affected population would be limited to those stay in close proximity to KTAC and KTTS and at or close to ground levels.

Agreement No. CE 35/2006(CE) Kai Tak Development Engineering Study cum Design and Construction of Advance Works Annex A – Investigation, Design and Construction KTAC and KTTS Studies
9-19
(vi) The degree to which adverse environmental impacts are reversible or irreversible:
The existing odour nuisance at the ASRs will be alleviated with the implementation of the odour mitigation measures proposed under this study. Besides, with the continuous improvement in controlling pollution entering KTAC and KTTS, the odour impact at the affected ASRs would be further minimized in the longer term.
(vii) The ecological context:
The predicted exceedance would not involve any ecological context.
(viii) The degree of disruption to sites of cultural heritage:
The predicted exceedance would not involve any cultural heritage context.
(ix) International and regional importance:
The predicted exceedance would not involve any international and regional importance.
(x) Both the likelihood and degree of uncertainty of adverse environmental impacts:
The degree of certainty of the predicted odour impacts depends on the accuracy of the estimated odour emission rates and the air dispersion modelling. The number of air samples collected as well as the intrinsic limitations of the air sampling technique and the olfactometry analysis would also affect the accuracy of odour emission rate estimation. Given that the odour surveys were carried out in a limited number of days, the measured odour concentrations are basically snapshot values. However, the odour emission rates obtained from the survey were under worst case conditions with the sampling exercise carried out during the hottest days in the summer season of 2007 with low tide and extremely high ambient air temperature (28
oC – 35
oC and with about
75% of the samples collected at or above 32oC). It is believed that the estimated
odour emission rates are representing reasonable worst case conditions. Air sampling is an important step in the process of measuring the odour concentrations of the sources, it would affect the quality and reliability of the results. All the odour sampling was carried out by the odour sampling team of Hong Kong Polytechnic University (HKPU) which has the most extensive local experience in odour sampling. The potential error associated with odour sampling process is considered to be on the low side. It should be noted that all the odour concentrations (in ou/m
3) and hence area source
emission rates (in ou/m2/s) were measured by olfactometry analysis carried out at the
Odour Research Laboratory of HKPU in accordance with the European Standard Method (EN13725). This European Standard Method specifies a method for the objective determination of the odour concentration of a gaseous sample using dynamic olfactometry with human assessors. The detection limit for this European Standard Method is 10 ou/m
3. Yet the detection limit of this European Standard
Method could vary between laboratories. Therefore, in reviewing the odour concentration results (in ou/m
3), it should be noted that a measured low odour
concentration value would normally has a higher degree of error due to the inherent properties of the olfactometry analysis method.

Agreement No. CE 35/2006(CE) Kai Tak Development Engineering Study Annex A cum Design and Construction of Advance Works KTAC and KTTS Studies – Investigation, Design and Construction
9-20
Besides, the degree of certainty of the predicted odour impacts under mitigated scenarios would depend on the accuracy of the estimated mitigated odour emission rates. For the purpose of this assessment, it was assumed that the combined effect of increased water depth and increased DO level (by localised maintenance dredging and improvement of water circulation in KTAC and KTTS with the 600m gap opening) would bring down the SOER of high odour emission areas to 2.90 ou/m
2/s. This
residual SOER is a key assumption estimated based on the survey data collected under this study. In addition, the odour removal efficiency of bioremediation would depend on a number of factors including by not limited to dosage, depth of injection, frequency of injection, etc. For the purpose of this assessment, two levels of odour removal efficiency by bioremediation, 80% and 90%, were therefore examined to address any uncertainty of the residual odour impact after mitigation. Based on the limited findings of the laboratory tests and pilot field trials, 80% odour removal efficiency is considered to be on the conservative side whereas 90% odour removal efficiency is considered to be more realistic in view of the fact that in-situ bioremediation had been successful applied in tackling the odour problem generated from contaminated sediments in Hong Kong namely in Shing Mun River and Sam Ka Tsuen Typhoon Shelter. Having said that, since the pilot field trial at KTAC had only been conducted for a year, the long term effectiveness of the bioremediation at KTAC and KTTS would need to be verified by the odour patrol specified in the EM&A programme of this study after the proposed full-scale bioremediation. There is also uncertainty on the effectiveness of the proposed desilting at KTN and JVC to fully mitigate the potential odour emissions from the headspace of KTN and JVC near the existing discharge locations. The actual performance would need to be verified by the odour patrol specified in the EM&A programme of this study.
9.6.17 Referring to the points discussed in Section 9.6.16 above, no adverse health or risk impact
is expected at the ASRs in the vicinity of the Kai Tak Development though their odour levels exceeded the EIAO-TM criteria in accordance with the air modelling results under the worst case condition. The highest odour levels predicted at the ASRs among the four mitigated scenarios would be 32.2 ou/m
3, which is more than 3000 times below the H2S concentration
of 2.0 ppm with adverse health symptom on asthmatic individuals. Hence, with the implementation of the proposed odour mitigation measures, no adverse odour impact is expected at the existing and planned ASRs in the vicinity of the Kai Tak Development.
9.6.18 Based on the current implementation programme, most of the proposed odour mitigation
measures under the above four mitigated scenarios, except the 600m runway gap opening, will be substantially completed by mid 2012 before the first population intake of the public housing development in Area 1 and the commissioning of the proposed cruise terminal in late 2012. The odour nuisance associated with the KTN, KTAC, and KTTS would be largely improved by then. Yet the reduction of the odour levels at the ASRs as predicted under the four mitigated scenarios could not be fully achieved prior to the completion of the 600m runway gap opening in 2014 to improve the water circulation in KTAC and KTTS. During the interim period after the first occupation of KTD and before the completion of the 600m gap opening, residual odour impacts slightly worse than those predicted for the four mitigated scenarios would be expected at the ASRs in Area 1 and the cruise terminal. However, given that the proposed in-situ bioremediation works would be substantially completed before the first population intake, with the assumed odour removal efficiency of bioremediation of 80% to 90%, the odour levels at the ASRs in Area 1 would likely be reduced from about 50 – 150 ou/m
3 under the unmitigated scenario (see Figure 9.9a) to
about 5 – 30 ou/m3 during the interim period. For the proposed cruise terminal, the odour
levels at the ASRs would likely be reduced from 50 – 100 ou/m3 under the unmitigated
scenario (also see Figure 9.9a) to about 5 – 20 ou/m3 during the interim period. The level
of residual odour impacts at these ASRs during the interim period would be similar or lower than the residual odour impacts at the worst-affected ASRs in KTD under the ultimate scenario.

Agre
em
ent
No.
CE
35/2
006(C
E)
Kai T
ak D
evelo
pm
ent
Engin
eeri
ng S
tud
y
cum
Desig
n a
nd C
onstr
uction o
f A
dva
nce W
ork
s
Anne
x A
– I
nvestigation,
Desig
n a
nd C
on
str
uction
KT
AC
an
d K
TT
S S
tudie
s
9-2
1
Tab
le 9
.5
Pre
dic
ted
Od
ou
r C
on
cen
trati
on
s a
t R
ep
resen
tati
ve A
SR
s u
nd
er
Dif
fere
nt
As
sessm
en
t S
cen
ari
os
Pre
dic
ted
Od
ou
r C
on
ce
ntr
ati
on
(o
u/m
3 i
n 5
-s a
ve
rag
e)
AS
R
ID
As
se
ss
me
nt
He
igh
t (m
) R
eg
ion
D
es
cri
pti
on
E
xis
tin
g
(un
mit
iga
ted
) S
ce
na
rio
Mit
iga
ted
S
ce
na
rio
A1
M
itig
ate
d
Sc
en
ari
o B
1
Mit
iga
ted
S
ce
na
rio
A2
M
itig
ate
d
Sc
en
ari
o B
2
1.5
2
90
.9
20
.5
20
.5
10
.3
10
.3
10
2
69
.7
19
.3
19
.3
9.7
9
.7
20
2
17
.0
16
.3
16
.3
8.2
8
.2
OA
1
30
Pla
nn
ed
sta
diu
m, site
2D
15
7.5
1
2.8
1
2.8
6
.4
6.4
1.5
1
92
.0
8.4
8
.4
4.2
4
.2
10
1
63
.1
8.0
8
.0
4.0
4
.0
20
1
29
.4
7.0
7
.0
3.5
3
.5
OA
2
30
Pla
nn
ed
resid
en
tia
l site 1
L3
10
1.2
5
.7
5.7
2
.8
2.8
1.5
3
30
.1
6.5
6
.5
3.2
3
.2
10
2
18
.2
6.1
6
.1
3.0
3
.0
20
1
10
.8
5.0
5
.0
2.5
2
.5
OA
3
30
No
rth
ap
ron
a
rea
of K
ai
Ta
k
De
ve
lop
me
nt
Exis
tin
g E
MS
D H
ea
dq
ua
rte
rs, site
1N
67
.2
4.2
4
.2
2.1
2
.1
1.5
2
77
.6
15
.5
15
.5
7.7
7
.7
10
1
97
.1
11
.0
11
.0
5.5
5
.5
20
1
38
.2
9.6
9
.6
4.8
4
.8
OA
4
30
Pla
nn
ed
go
ve
rnm
en
t site
3B
1
80
.0
8.0
8
.0
4.0
4
.0
1.5
2
58
.5
13
.4
13
.4
6.7
6
.7
10
1
94
.3
12
.5
12
.5
6.2
6
.2
20
1
03
.7
10
.4
10
.4
5.2
5
.2
OA
5
30
Pla
nn
ed
go
ve
rnm
en
t site
3B
2
73
.5
8.3
8
.3
4.2
4
.2
1.5
2
58
.4
16
.3
16
.3
8.2
8
.2
10
1
96
.5
14
.4
14
.4
7.2
7
.2
20
1
06
.1
11
.1
11
.1
5.6
5
.6
OA
6
30
Pla
nn
ed
go
ve
rnm
en
t site
3B
3
71
.8
8.2
8
.2
4.1
4
.1
1.5
3
35
.5
17
.7
17
.7
8.9
8
.9
10
1
88
.1
14
.5
14
.5
7.2
7
.2
20
1
15
.9
10
.4
10
.4
5.2
5
.2
OA
7
30
Pla
nn
ed
go
ve
rnm
en
t site
3B
4
71
.8
7.8
7
.8
3.9
3
.9
1.5
4
47
.0
23
.2
23
.2
11
.6
11
.6
10
3
02
.8
15
.9
15
.9
8.0
8
.0
20
1
55
.7
10
.8
10
.8
5.4
5
.4
OA
8
30
So
uth
ap
ron
a
rea
of K
ai
Ta
k
De
ve
lop
me
nt
Pla
nn
ed
hospita
l site
94
.1
7.9
7
.9
4.0
4
.0

A
gre
em
ent
No.
CE
35/2
006(C
E)
K
ai T
ak D
evelo
pm
ent
Engin
eeri
ng S
tud
y
Anne
x A
cum
Desig
n a
nd C
onstr
uction o
f A
dva
nce W
ork
s
KT
AC
an
d K
TT
S S
tudie
s
– I
nvestigation,
Desig
n a
nd C
on
str
uction
9-2
2
Pre
dic
ted
Od
ou
r C
on
ce
ntr
ati
on
(o
u/m
3 i
n 5
-s a
ve
rag
e)
AS
R
ID
As
se
ss
me
nt
He
igh
t (m
) R
eg
ion
D
es
cri
pti
on
E
xis
tin
g
(un
mit
iga
ted
) S
ce
na
rio
Mit
iga
ted
S
ce
na
rio
A1
M
itig
ate
d
Sc
en
ari
o B
1
Mit
iga
ted
S
ce
na
rio
A2
M
itig
ate
d
Sc
en
ari
o B
2
1.5
1
77
.4
27
.8
27
.8
13
.9
13
.9
10
1
42
.9
16
.4
16
.4
8.2
8
.2
20
1
24
.6
9.3
9
.3
4.7
4
.7
OA
9
30
Pla
nn
ed
hospita
l site
10
2.5
7
.3
7.3
3
.6
3.6
OA
10
1
.5
Pla
nn
ed
dis
tric
t o
pe
n s
pa
ce
, site
3E
2
22
0.8
3
2.2
3
2.2
1
6.1
1
6.1
1.5
7
9.6
8
.0
8.0
4
.0
4.0
10
7
8.2
7
.3
7.3
3
.7
3.7
20
7
4.1
5
.6
5.6
2
.8
2.8
OA
11
30
So
uth
ap
ron
a
rea
of K
ai
Ta
k
De
ve
lop
me
nt
Pla
nn
ed
co
mm
erc
ial site
3D
4
67
.7
4.6
4
.6
2.3
2
.3
1.5
5
7.1
7
.5
7.5
3
.7
3.7
10
5
6.0
7
.0
7.0
3
.5
3.5
20
5
3.3
6
.0
6.0
3
.0
3.0
O
A1
2
30
Exis
tin
g W
orld
Tra
de
Squ
are
49
.7
4.9
4
.9
2.5
2
.5
1.5
5
6.2
8
.5
8.5
4
.3
4.3
10
5
5.0
8
.1
8.1
4
.1
4.1
20
5
2.1
7
.1
7.1
3
.6
3.6
O
A1
3
30
Exis
tin
g K
wo
ng
Sa
ng
Hon
g B
uild
ing
48
.2
6.0
6
.0
3.0
3
.0
1.5
6
6.9
9
.7
9.7
4
.9
4.9
10
6
5.0
9
.3
9.3
4
.6
4.6
20
6
0.8
8
.3
8.3
4
.2
4.2
O
A1
4
30
Exis
tin
g K
wu
n
To
ng
are
a
Exis
tin
g S
ea
po
we
r In
du
str
ial C
en
tre
55
.7
7.2
7
.2
3.6
3
.6
OA
15
1
.5
Pla
nn
ed
Ru
nw
ay P
ark
, site 4
D1
7
0.2
7
.6
7.6
3
.8
3.9
OA
16
1
.5
Pla
nn
ed
Ru
nw
ay P
ark
, site 4
D1
1
03
.3
12
.4
12
.4
6.2
6
.2
OA
17
1
.5
Pla
nn
ed
Ru
nw
ay P
ark
, site 4
D1
1
36
.5
17
.6
17
.6
8.8
8
.8
1.5
1
29
.5
16
.4
16
.4
8.2
8
.2
10
1
21
.6
14
.9
14
.9
7.5
7
.5
20
1
09
.0
12
.7
12
.8
6.4
6
.4
OA
18
30
Pla
nn
ed
tou
rism
no
de
, site
4D
1
94
.8
10
.4
10
.5
5.2
5
.3
1.5
6
6.8
6
.9
7.0
3
.5
3.5
10
6
6.2
6
.8
6.9
3
.4
3.5
20
6
4.2
6
.5
6.6
3
.3
3.4
O
A1
9
30
Ru
nw
ay a
rea
o
f K
ai T
ak
De
ve
lop
me
nt
Pla
nn
ed
cru
ise
te
rmin
al b
uild
ing
, site
4D
3
61
.0
6.1
6
.2
3.1
3
.1

Agre
em
ent
No.
CE
35/2
006(C
E)
Kai T
ak D
evelo
pm
ent
Engin
eeri
ng S
tud
y
cum
Desig
n a
nd C
onstr
uction o
f A
dva
nce W
ork
s
Anne
x A
– I
nvestigation,
Desig
n a
nd C
on
str
uction
KT
AC
an
d K
TT
S S
tudie
s
9-2
3
Pre
dic
ted
Od
ou
r C
on
ce
ntr
ati
on
(o
u/m
3 i
n 5
-s a
ve
rag
e)
AS
R
ID
As
se
ss
me
nt
He
igh
t (m
) R
eg
ion
D
es
cri
pti
on
E
xis
tin
g
(un
mit
iga
ted
) S
ce
na
rio
Mit
iga
ted
S
ce
na
rio
A1
M
itig
ate
d
Sc
en
ari
o B
1
Mit
iga
ted
S
ce
na
rio
A2
M
itig
ate
d
Sc
en
ari
o B
2
1.5
7
4.4
7
.8
7.9
3
.9
4.0
10
7
3.4
7
.6
7.7
3
.9
3.9
20
7
0.5
7
.2
7.3
3
.6
3.7
O
A2
0
30
Pla
nn
ed
cru
ise
te
rmin
al b
uild
ing
, site
4D
3
66
.2
6.5
6
.6
3.3
3
.4
1.5
8
2.0
9
.0
9.1
4
.5
4.6
10
8
0.5
8
.7
8.8
4
.4
4.4
20
7
6.5
7
.8
7.8
3
.9
4.0
O
A2
1
30
Pla
nn
ed
cru
ise
te
rmin
al b
uild
ing
, site
4D
3
70
.5
6.5
6
.6
3.3
3
.4
OA
22
1
.5
Pla
nn
ed
lo
cal o
pe
n s
pace
, site 4
B5
1
17
.8
14
.2
14
.3
7.2
7
.3
1.5
1
28
.5
16
.1
16
.2
8.1
8
.2
10
1
22
.1
14
.5
14
.7
7.3
7
.4
20
1
07
.1
11
.3
11
.4
5.7
5
.8
OA
23
30
Pla
nn
ed
resid
en
tia
l site 4
B5
90
.5
8.4
8
.5
4.2
4
.3
1.5
1
34
.1
21
.0
21
.0
10
.5
10
.5
10
1
20
.7
14
.9
14
.9
7.4
7
.5
20
1
05
.6
8.9
9
.0
4.5
4
.6
OA
24
30
Pla
nn
ed
resid
en
tia
l site 4
B4
90
.2
7.0
7
.0
3.5
3
.5
1.5
1
45
.2
22
.2
22
.2
11
.1
11
.1
10
1
37
.5
12
.6
12
.6
6.3
6
.3
20
1
18
.5
9.1
9
.1
4.6
4
.6
OA
25
30
Pla
nn
ed
resid
en
tia
l site 4
B3
97
.2
7.2
7
.2
3.6
3
.6
1.5
1
90
.2
18
.2
18
.2
9.1
9
.1
10
1
50
.1
14
.8
14
.8
7.4
7
.4
20
1
21
.6
9.4
9
.4
4.7
4
.7
OA
26
30
Pla
nn
ed
resid
en
tia
l site 4
B2
10
0.4
7
.1
7.1
3
.6
3.6
1.5
2
32
.7
22
.9
22
.9
11
.4
11
.4
10
1
60
.9
15
.9
15
.9
7.9
7
.9
20
1
40
.3
11
.1
11
.1
5.6
5
.6
OA
27
30
Pla
nn
ed
resid
en
tia
l site 4
B1
11
5.2
7
.3
7.3
3
.7
3.7
1.5
2
35
.4
25
.1
25
.1
12
.6
12
.6
10
2
01
.1
20
.1
20
.1
10
.1
10
.0
20
1
70
.0
13
.2
13
.2
6.6
6
.6
OA
28
30
Pla
nn
ed
resid
en
tia
l site 4
A1
13
1.8
8
.7
8.7
4
.3
4.3
1.5
2
64
.5
20
.9
20
.9
10
.4
10
.4
OA
29
1
0
Ru
nw
ay
are
a
of
Ka
i T
ak
De
ve
lop
me
nt
Pla
nn
ed
co
mm
erc
ial site
4A
3
24
4.7
1
8.2
1
8.2
9
.1
9.1

A
gre
em
ent
No.
CE
35/2
006(C
E)
K
ai T
ak D
evelo
pm
ent
Engin
eeri
ng S
tud
y
Anne
x A
cum
Desig
n a
nd C
onstr
uction o
f A
dva
nce W
ork
s
KT
AC
an
d K
TT
S S
tudie
s
– I
nvestigation,
Desig
n a
nd C
on
str
uction
9-2
4
Pre
dic
ted
Od
ou
r C
on
ce
ntr
ati
on
(o
u/m
3 i
n 5
-s a
ve
rag
e)
AS
R
ID
As
se
ss
me
nt
He
igh
t (m
) R
eg
ion
D
es
cri
pti
on
E
xis
tin
g
(un
mit
iga
ted
) S
ce
na
rio
Mit
iga
ted
S
ce
na
rio
A1
M
itig
ate
d
Sc
en
ari
o B
1
Mit
iga
ted
S
ce
na
rio
A2
M
itig
ate
d
Sc
en
ari
o B
2
20
1
97
.2
13
.5
13
.5
6.7
6
.7
OA
29
3
0
Pla
nn
ed
co
mm
erc
ial site
4A
3
14
2.5
9
.5
9.5
4
.7
4.7
OA
30
1
.5
Pla
nn
ed
re
gio
na
l op
en
spa
ce
, site
4A
3
34
.5
18
.7
18
.7
9.3
9
.3
OA
31
1
.5
Pla
nn
ed
re
gio
na
l op
en
spa
ce
, site
4A
5
47
.1
18
.8
19
.0
9.4
9
.6
OA
32
1
.5
Ru
nw
ay
are
a
of
Ka
i T
ak
De
ve
lop
me
nt
Pla
nn
ed
re
gio
na
l op
en
spa
ce
, site
4A
6
75
.0
21
.1
21
.1
10
.5
10
.5
1.5
4
40
.4
6.5
6
.5
3.2
3
.2
10
3
42
.7
6.2
6
.2
3.1
3
.1
20
2
02
.6
5.5
5
.5
2.7
2
.7
OA
33
30
Pla
nn
ed
Site
1L4
12
3.2
4
.4
4.4
2
.2
2.2
1.5
5
50
.6
5.4
5
.4
2.7
3
.2
10
4
56
.8
5.2
5
.2
2.6
2
.6
20
2
77
.6
4.7
4
.7
2.3
2
.3
OA
34
30
Pla
nn
ed
go
ve
rnm
en
t site
1J3
14
6.9
3
.9
3.9
1
.9
1.9
1.5
2
52
.6
5.7
5
.7
2.8
2
.8
10
2
27
.2
5.5
5
.5
2.8
2
.8
20
1
69
.0
5.0
5
.0
2.5
2
.5
OA
35
30
Pla
nn
ed
Site
1L1
11
4.5
4
.3
4.3
2
.2
2.2
1.5
2
89
.2
4.9
7
.1
2.4
4
.7
10
2
65
.6
4.8
5
.7
2.4
3
.3
20
2
09
.6
4.4
4
.5
2.2
2
.3
OA
36
30
Pla
nn
ed
Site
1I3
14
7.4
3
.8
3.8
1
.9
1.9
1.5
1
41
.5
4.9
4
.9
2.5
2
.5
10
1
35
.5
4.8
4
.8
2.4
2
.4
20
1
18
.9
4.6
4
.6
2.3
2
.3
OA
37
30
Pla
nn
ed
Site
1K
1
96
.5
4.1
4
.1
2.1
2
.1
1.5
1
57
.8
4.5
6
.7
2.2
4
.4
10
1
45
.1
4.4
5
.4
2.2
3
.4
20
1
26
.5
4.2
4
.4
2.1
2
.5
OA
38
30
Pla
nn
ed
Site
1H
3
10
4.8
3
.8
3.8
1
.9
2.0
1.5
8
6.3
4
.5
4.5
2
.2
3.7
O
A3
9
10
No
rth
ap
ron
are
a
of
Ka
i T
ak
De
ve
lop
me
nt
Pla
nn
ed
Site
1M
1
84
.7
4.4
4
.4
2.2
2
.2

Agre
em
ent
No.
CE
35/2
006(C
E)
Kai T
ak D
evelo
pm
ent
Engin
eeri
ng S
tud
y
cum
Desig
n a
nd C
onstr
uction o
f A
dva
nce W
ork
s
Anne
x A
– I
nvestigation,
Desig
n a
nd C
on
str
uction
KT
AC
an
d K
TT
S S
tudie
s
9-2
5
Pre
dic
ted
Od
ou
r C
on
ce
ntr
ati
on
(o
u/m
3 i
n 5
-s a
ve
rag
e)
AS
R
ID
As
se
ss
me
nt
He
igh
t (m
) R
eg
ion
D
es
cri
pti
on
E
xis
tin
g
(un
mit
iga
ted
) S
ce
na
rio
Mit
iga
ted
S
ce
na
rio
A1
M
itig
ate
d
Sc
en
ari
o B
1
Mit
iga
ted
S
ce
na
rio
A2
M
itig
ate
d
Sc
en
ari
o B
2
20
8
0.1
4
.3
4.3
2
.1
2.2
O
A3
9
30
P
lan
ned
Site
1M
1
73
.1
4.1
4
.1
2.0
2
.0
1.5
9
5.1
4
.1
6.6
2
.1
4.5
10
9
1.8
4
.1
5.4
2
.0
3.5
20
8
4.5
3
.9
4.3
2
.0
2.5
O
A4
0
30
No
rth
ap
ron
are
a
of
Ka
i T
ak
De
ve
lop
me
nt
Pla
nn
ed
Site
1M
2
75
.5
3.7
3
.9
1.9
2
.0
1.5
7
1.6
1
1.2
1
1.2
1
1.2
1
1.2
10
7
0.7
4
.3
4.3
2
.7
2.7
20
6
8.1
4
.2
4.2
2
.1
2.1
O
A4
1
30
Exis
tin
g L
ee K
au
Ya
n M
em
oria
l S
ch
oo
l
64
.1
4.0
4
.0
2.0
2
.0
1.5
7
1.9
4
.2
4.9
3
.8
3.8
10
7
1.0
4
.1
4.7
2
.1
2.8
20
6
8.5
4
.0
4.3
2
.0
2.3
O
A4
2
30
Exis
tin
g
Ko
wlo
on
C
ity
Are
a
Exis
tin
g S
ir R
obe
rt B
lack H
ealth
Ce
ntr
e
64
.4
3.8
3
.9
1.9
2
.0

A
gre
em
ent
No.
CE
35/2
006(C
E)
K
ai T
ak D
evelo
pm
ent
Engin
eeri
ng S
tud
y
Anne
x A
cum
Desig
n a
nd C
onstr
uction o
f A
dva
nce W
ork
s
KT
AC
an
d K
TT
S S
tudie
s
– I
nvestigation,
Desig
n a
nd C
on
str
uction
9-2
6
Tab
le 9
.6
Pre
dic
ted
Fre
qu
en
cy o
f E
xceed
an
ce o
f O
do
ur
Cri
teri
on
at
Rep
res
en
tati
ve A
SR
s u
nd
er
Mit
igate
d S
cen
ari
os A
1 a
nd
B1
Pre
dic
ted
Fre
qu
en
cy o
f E
xc
ee
da
nc
e
(in
% o
f ti
me
in
a y
ea
r)
Mit
iga
ted
Sce
na
rio
A1
M
itig
ate
d S
ce
na
rio
B1
A
SR
ID
A
ss
es
sm
en
t H
eig
ht
(m)
Re
gio
n
De
sc
rip
tio
n
Ex
ce
ed
ing
5
ou
/m3
Ex
ce
ed
ing
10
o
u/m
3
Ex
ce
ed
ing
5
ou
/m3
Ex
ce
ed
ing
10
o
u/m
3
1.5
3
.5%
1
.5%
3
.5%
1
.5%
10
2
.7%
1
.0%
2
.7%
1
.0%
20
2
.4%
0
.7%
2
.4%
0
.7%
O
A1
30
Pla
nn
ed
sta
diu
m, site
2D
1.9
%
0.6
%
1.9
%
0.6
%
1.5
1
.0%
0
.1%
1
.0%
0
.1%
10
1
.0%
0
.1%
1
.0%
0
.1%
20
1
.0%
0
.1%
1
.0%
0
.1%
O
A2
30
Pla
nn
ed
resid
en
tia
l site 1
L3
0.5
%
0.1
%
0.5
%
0.1
%
1.5
0
.5%
0
.1%
0
.5%
0
.1%
10
0
.5%
0
.1%
0
.5%
0
.1%
20
0
.1%
0
.1%
0
.1%
0
.1%
O
A3
30
No
rth
ap
ron
are
a
of
Ka
i T
ak
De
ve
lop
me
nt
Exis
tin
g E
MS
D H
ea
dq
ua
rte
rs, site
1N
0.1
%
0.1
%
0.1
%
0.1
%
1.5
1
0.9
%
4.5
%
10
.9%
4
.5%
10
9
.2%
0
.4%
9
.2%
0
.4%
20
1
.1%
0
.1%
1
.1%
0
.1%
O
A4
30
Pla
nn
ed
go
ve
rnm
en
t site
3B
1
0.5
%
0.1
%
0.5
%
0.1
%
1.5
1
0.9
%
4.3
%
10
.9%
4
.3%
10
9
.3%
0
.5%
9
.3%
0
.5%
20
0
.8%
0
.3%
0
.8%
0
.3%
O
A5
30
Pla
nn
ed
go
ve
rnm
en
t site
3B
2
0.8
%
0.1
%
0.8
%
0.1
%
1.5
1
1.1
%
6.8
%
11
.1%
6
.8%
10
9
.7%
0
.7%
9
.7%
0
.7%
20
1
.2%
0
.3%
1
.2%
0
.3%
O
A6
30
Pla
nn
ed
go
ve
rnm
en
t site
3B
3
0.8
%
0.1
%
0.8
%
0.1
%
1.5
1
1.5
%
7.7
%
11
.5%
7
.7%
10
9
.5%
0
.9%
9
.5%
0
.9%
20
2
.4%
0
.1%
2
.4%
0
.1%
O
A7
30
Pla
nn
ed
go
ve
rnm
en
t site
3B
4
0.7
%
0.1
%
0.7
%
0.1
%
1.5
1
4.7
%
8.8
%
14
.7%
8
.8%
10
5
.5%
2
.2%
5
.5%
2
.2%
O
A8
20
So
uth
ap
ron
are
a
of
Ka
i T
ak
De
ve
lop
me
nt
Pla
nn
ed
hospita
l site
2.9
%
0.3
%
2.9
%
0.3
%

Agre
em
ent
No.
CE
35/2
006(C
E)
Kai T
ak D
evelo
pm
ent
Engin
eeri
ng S
tud
y
cum
Desig
n a
nd C
onstr
uction o
f A
dva
nce W
ork
s
Anne
x A
– I
nvestigation,
Desig
n a
nd C
on
str
uction
KT
AC
an
d K
TT
S S
tudie
s
9-2
7
Pre
dic
ted
Fre
qu
en
cy o
f E
xc
ee
da
nc
e
(in
% o
f ti
me
in
a y
ea
r)
Mit
iga
ted
Sce
na
rio
A1
M
itig
ate
d S
ce
na
rio
B1
A
SR
ID
A
ss
es
sm
en
t H
eig
ht
(m)
Re
gio
n
De
sc
rip
tio
n
Ex
ce
ed
ing
5
ou
/m3
Ex
ce
ed
ing
10
o
u/m
3
Ex
ce
ed
ing
5
ou
/m3
Ex
ce
ed
ing
10
o
u/m
3
OA
8
30
P
lan
ned
hospita
l site
1
.1%
0
.1%
1
.1%
0
.1%
1.5
1
8.3
%
10
.4%
1
8.3
%
10
.4%
10
8
.2%
2
.0%
8
.2%
2
.0%
20
2
.3%
0
.1%
2
.3%
0
.1%
O
A9
30
Pla
nn
ed
hospita
l site
0.5
%
0.1
%
0.5
%
0.1
%
OA
10
1
.5
Pla
nn
ed
dis
tric
t o
pe
n s
pa
ce
, site
3E
2
23
.7%
1
3.9
%
23
.7%
1
3.9
%
1.5
6
.2%
0
.1%
6
.2%
0
.1%
10
4
.9%
0
.1%
4
.9%
0
.1%
20
2
.6%
0
.1%
2
.6%
0
.1%
O
A1
1
30
So
uth
ap
ron
are
a
of
Ka
i T
ak
De
ve
lop
me
nt
Pla
nn
ed
co
mm
erc
ial site
3D
4
0.1
%
0.1
%
0.1
%
0.1
%
1.5
4
.1%
0
.1%
4
.1%
0
.1%
10
2
.9%
0
.1%
2
.9%
0
.1%
20
2
.8%
0
.1%
2
.8%
0
.1%
O
A1
2
30
Exis
tin
g W
orld
Tra
de
Squ
are
0.1
%
0.1
%
0.1
%
0.1
%
1.5
3
.3%
0
.1%
3
.3%
0
.1%
10
3
.2%
0
.1%
3
.2%
0
.1%
20
1
.5%
0
.1%
1
.5%
0
.1%
O
A1
3
30
Exis
tin
g K
wo
ng
Sa
ng
Hon
g B
uild
ing
1.3
%
0.1
%
1.3
%
0.1
%
1.5
0
.7%
0
.1%
0
.7%
0
.1%
10
0
.7%
0
.1%
0
.7%
0
.1%
20
0
.6%
0
.1%
0
.6%
0
.1%
O
A1
4
30
Exis
tin
g K
wu
n
To
ng
are
a
Exis
tin
g S
ea
po
we
r In
du
str
ial C
en
tre
0.6
%
0.1
%
0.6
%
0.1
%
OA
15
1
.5
Pla
nn
ed
Ru
nw
ay P
ark
, site 4
D1
0
.6%
0
.1%
0
.6%
0
.1%
OA
16
1
.5
Pla
nn
ed
Ru
nw
ay P
ark
, site 4
D1
0
.8%
0
.4%
0
.8%
0
.4%
OA
17
1
.5
Pla
nn
ed
Ru
nw
ay P
ark
, site 4
D1
1
.9%
0
.8%
1
.9%
0
.8%
1.5
2
.5%
0
.9%
2
.5%
0
.9%
10
1
.6%
0
.8%
1
.6%
0
.8%
20
1
.2%
0
.6%
1
.2%
0
.6%
O
A1
8
30
Pla
nn
ed
tou
rism
no
de
, site
4D
1
1.0
%
0.3
%
1.0
%
0.3
%
1.5
0
.7%
0
.1%
0
.7%
0
.1%
10
0
.6%
0
.1%
0
.7%
0
.1%
20
0
.6%
0
.1%
0
.6%
0
.1%
O
A1
9
30
Ru
nw
ay
are
a
of
Ka
i T
ak
De
ve
lop
me
nt
Pla
nn
ed
cru
ise
te
rmin
al b
uild
ing
, site
4D
3
0.5
%
0.1
%
0.5
%
0.1
%

A
gre
em
ent
No.
CE
35/2
006(C
E)
K
ai T
ak D
evelo
pm
ent
Engin
eeri
ng S
tud
y
Anne
x A
cum
Desig
n a
nd C
onstr
uction o
f A
dva
nce W
ork
s
KT
AC
an
d K
TT
S S
tudie
s
– I
nvestigation,
Desig
n a
nd C
on
str
uction
9-2
8
Pre
dic
ted
Fre
qu
en
cy o
f E
xc
ee
da
nc
e
(in
% o
f ti
me
in
a y
ea
r)
Mit
iga
ted
Sce
na
rio
A1
M
itig
ate
d S
ce
na
rio
B1
A
SR
ID
A
ss
es
sm
en
t H
eig
ht
(m)
Re
gio
n
De
sc
rip
tio
n
Ex
ce
ed
ing
5
ou
/m3
Ex
ce
ed
ing
10
o
u/m
3
Ex
ce
ed
ing
5
ou
/m3
Ex
ce
ed
ing
10
o
u/m
3
1.5
0
.9%
0
.1%
0
.9%
0
.1%
10
0
.9%
0
.1%
0
.9%
0
.1%
20
0
.8%
0
.1%
0
.8%
0
.1%
O
A2
0
30
Pla
nn
ed
cru
ise
te
rmin
al b
uild
ing
, site
4D
3
0.7
%
0.1
%
0.7
%
0.1
%
1.5
2
.1%
0
.1%
2
.1%
0
.1%
10
2
.1%
0
.1%
2
.1%
0
.1%
20
1
.6%
0
.1%
1
.6%
0
.1%
O
A2
1
30
Pla
nn
ed
cru
ise
te
rmin
al b
uild
ing
, site
4D
3
1.3
%
0.1
%
1.3
%
0.1
%
OA
22
1
.5
Pla
nn
ed
lo
cal o
pe
n s
pace
, site 4
B5
1
3.3
%
1.4
%
13
.3%
1
.4%
1.5
1
8.4
%
2.5
%
18
.4%
2
.5%
10
1
1.4
%
1.7
%
11
.4%
1
.7%
20
2
.5%
0
.7%
2
.5%
0
.7%
O
A2
3
30
Pla
nn
ed
resid
en
tia
l site 4
B5
1.4
%
0.1
%
1.4
%
0.1
%
1.5
3
3.2
%
18
.4%
3
3.2
%
18
.4%
10
2
6.4
%
11
.1%
2
6.4
%
11
.1%
20
1
0.5
%
0.1
%
10
.5%
0
.1%
O
A2
4
30
Pla
nn
ed
resid
en
tia
l site 4
B4
1.0
%
0.1
%
1.0
%
0.1
%
1.5
4
6.9
%
32
.1%
4
6.9
%
32
.1%
10
4
1.5
%
18
.1%
4
1.5
%
18
.1%
20
9
.8%
0
.1%
9
.8%
0
.1%
O
A2
5
30
Pla
nn
ed
resid
en
tia
l site 4
B3
0.6
%
0.1
%
0.6
%
0.1
%
1.5
4
3.7
%
22
.8%
4
3.7
%
22
.8%
10
3
0.5
%
12
.0%
3
0.5
%
12
.0%
20
1
5.2
%
0.1
%
15
.2%
0
.1%
O
A2
6
30
Pla
nn
ed
resid
en
tia
l site 4
B2
2.1
%
0.1
%
2.1
%
0.1
%
1.5
4
6.4
%
32
.7%
4
6.4
%
32
.7%
10
3
4.2
%
11
.7%
3
4.2
%
11
.8%
20
1
5.2
%
3.1
%
15
.2%
3
.1%
O
A2
7
30
Pla
nn
ed
resid
en
tia
l site 4
B1
6.4
%
0.1
%
6.4
%
0.1
%
1.5
4
3.1
%
28
.1%
4
3.1
%
28
.1%
10
3
0.2
%
9.8
%
30
.2%
9
.8%
20
1
4.3
%
3.7
%
14
.3%
3
.7%
O
A2
8
30
Pla
nn
ed
resid
en
tia
l site 4
A1
6.5
%
0.1
%
6.5
%
0.1
%
OA
29
1
.5
Ru
nw
ay
are
a
of
Ka
i T
ak
De
ve
lop
me
nt
Pla
nn
ed
co
mm
erc
ial site
4A
3
37
.1%
1
5.6
%
37
.1%
1
5.6
%

Agre
em
ent
No.
CE
35/2
006(C
E)
Kai T
ak D
evelo
pm
ent
Engin
eeri
ng S
tud
y
cum
Desig
n a
nd C
onstr
uction o
f A
dva
nce W
ork
s
Anne
x A
– I
nvestigation,
Desig
n a
nd C
on
str
uction
KT
AC
an
d K
TT
S S
tudie
s
9-2
9
Pre
dic
ted
Fre
qu
en
cy o
f E
xc
ee
da
nc
e
(in
% o
f ti
me
in
a y
ea
r)
Mit
iga
ted
Sce
na
rio
A1
M
itig
ate
d S
ce
na
rio
B1
A
SR
ID
A
ss
es
sm
en
t H
eig
ht
(m)
Re
gio
n
De
sc
rip
tio
n
Ex
ce
ed
ing
5
ou
/m3
Ex
ce
ed
ing
10
o
u/m
3
Ex
ce
ed
ing
5
ou
/m3
Ex
ce
ed
ing
10
o
u/m
3
10
1
8.1
%
6.4
%
18
.1%
6
.5%
20
9
.1%
4
.2%
9
.2%
4
.2%
O
A2
9
30
Pla
nn
ed
co
mm
erc
ial site
4A
3
6.7
%
0.1
%
6.7
%
0.1
%
OA
30
1
.5
Pla
nn
ed
re
gio
na
l op
en
spa
ce
, site
4A
3
4.2
%
16
.4%
3
4.2
%
16
.4%
OA
31
1
.5
Pla
nn
ed
re
gio
na
l op
en
spa
ce
, site
4A
4
1.3
%
24
.6%
4
1.4
%
24
.6%
OA
32
1
.5
Ru
nw
ay
are
a
of
Ka
i T
ak
De
ve
lop
me
nt
Pla
nn
ed
re
gio
na
l op
en
spa
ce
, site
4A
3
3.9
%
21
.1%
3
3.9
%
21
.1%
1.5
0
.8%
0
.1%
0
.8%
0
.1%
10
0
.8%
0
.1%
0
.8%
0
.1%
20
0
.4%
0
.1%
0
.4%
0
.1%
O
A3
3
30
Pla
nn
ed
Site
1L4
0.1
%
0.1
%
0.1
%
0.1
%
1.5
0
.2%
0
.1%
0
.2%
0
.1%
10
0
.1%
0
.1%
0
.1%
0
.1%
20
0
.1%
0
.1%
0
.1%
0
.1%
O
A3
4
30
Pla
nn
ed
go
ve
rnm
en
t site
1J3
0.1
%
0.1
%
0.1
%
0.1
%
1.5
0
.5%
0
.1%
0
.5%
0
.1%
10
0
.5%
0
.1%
0
.5%
0
.1%
20
0
.1%
0
.1%
0
.1%
0
.1%
O
A3
5
30
Pla
nn
ed
Site
1L1
0.1
%
0.1
%
0.1
%
0.1
%
1.5
0
.1%
0
.1%
0
.8%
0
.1%
10
0
.1%
0
.1%
0
.5%
0
.1%
20
0
.1%
0
.1%
0
.1%
0
.1%
O
A3
6
30
Pla
nn
ed
Site
1I3
0.1
%
0.1
%
0.1
%
0.1
%
1.5
0
.1%
0
.1%
0
.1%
0
.1%
10
0
.1%
0
.1%
0
.1%
0
.1%
20
0
.1%
0
.1%
0
.1%
0
.1%
O
A3
7
30
Pla
nn
ed
Site
1K
1
0.1
%
0.1
%
0.1
%
0.1
%
1.5
0
.1%
0
.1%
1
.0%
0
.1%
10
0
.1%
0
.1%
0
.4%
0
.1%
20
0
.1%
0
.1%
0
.1%
0
.1%
O
A3
8
30
No
rth
ap
ron
are
a
of
Ka
i T
ak
De
ve
lop
me
nt
Pla
nn
ed
Site
1H
3
0.1
%
0.1
%
0.1
%
0.1
%

A
gre
em
ent
No.
CE
35/2
006(C
E)
K
ai T
ak D
evelo
pm
ent
Engin
eeri
ng S
tud
y
Anne
x A
cum
Desig
n a
nd C
onstr
uction o
f A
dva
nce W
ork
s
KT
AC
an
d K
TT
S S
tudie
s
– I
nvestigation,
Desig
n a
nd C
on
str
uction
9-3
0
Pre
dic
ted
Fre
qu
en
cy o
f E
xc
ee
da
nc
e
(in
% o
f ti
me
in
a y
ea
r)
Mit
iga
ted
Sce
na
rio
A1
M
itig
ate
d S
ce
na
rio
B1
A
SR
ID
A
ss
es
sm
en
t H
eig
ht
(m)
Re
gio
n
De
sc
rip
tio
n
Ex
ce
ed
ing
5
ou
/m3
Ex
ce
ed
ing
10
o
u/m
3
Ex
ce
ed
ing
5
ou
/m3
Ex
ce
ed
ing
10
o
u/m
3
1.5
0
.1%
0
.1%
0
.1%
0
.1%
10
0
.1%
0
.1%
0
.1%
0
.1%
20
0
.1%
0
.1%
0
.1%
0
.1%
O
A3
9
30
Pla
nn
ed
Site
1M
1
0.1
%
0.1
%
0.1
%
0.1
%
1.5
0
.1%
0
.1%
0
.6%
0
.1%
10
0
.1%
0
.1%
0
.4%
0
.1%
20
0
.1%
0
.1%
0
.1%
0
.1%
O
A4
0
30
No
rth
ap
ron
are
a
of
Ka
i T
ak
De
ve
lop
me
nt
Pla
nn
ed
Site
1M
2
0.1
%
0.1
%
0.1
%
0.1
%
1.5
1
.7%
0
.5%
1
.7%
0
.5%
10
0
.1%
0
.1%
0
.1%
0
.1%
20
0
.1%
0
.1%
0
.1%
0
.1%
O
A4
1
30
Exis
tin
g L
ee K
au
Ya
n M
em
oria
l S
ch
oo
l
0.1
%
0.1
%
0.1
%
0.1
%
1.5
0
.1%
0
.1%
0
.1%
0
.1%
10
0
.1%
0
.1%
0
.1%
0
.1%
20
0
.1%
0
.1%
0
.1%
0
.1%
O
A4
2
30
Exis
tin
g K
ow
loo
n
City A
rea
Exis
tin
g S
ir R
obe
rt B
lack H
ealth
Ce
ntr
e
0.1
%
0.1
%
0.1
%
0.1
%

Agre
em
ent
No.
CE
35/2
006(C
E)
Kai T
ak D
evelo
pm
ent
Engin
eeri
ng S
tud
y
cum
Desig
n a
nd C
onstr
uction o
f A
dva
nce W
ork
s
Anne
x A
– I
nvestigation,
Desig
n a
nd C
on
str
uction
KT
AC
an
d K
TT
S S
tudie
s
9-3
1
Tab
le 9
.7
Pre
dic
ted
Fre
qu
en
cy o
f E
xceed
an
ce o
f O
do
ur
Cri
teri
on
at
Rep
res
en
tati
ve A
SR
s u
nd
er
Mit
igate
d S
cen
ari
os A
2 a
nd
B2
Pre
dic
ted
Fre
qu
en
cy o
f E
xc
ee
da
nc
e
(in
% o
f ti
me
in
a y
ea
r)
Mit
iga
ted
Sce
na
rio
A2
M
itig
ate
d S
ce
na
rio
B2
A
SR
ID
A
ss
es
sm
en
t H
eig
ht
(m)
Re
gio
n
De
sc
rip
tio
n
Ex
ce
ed
ing
5
ou
/m3
Ex
ce
ed
ing
10
o
u/m
3
Ex
ce
ed
ing
5
ou
/m3
Ex
ce
ed
ing
10
o
u/m
3
1.5
1
.5%
0
.3%
1
.5%
0
.3%
10
1
.0%
0
.1%
1
.0%
0
.1%
20
0
.7%
0
.1%
0
.7%
0
.1%
O
A1
30
Pla
nn
ed
sta
diu
m, site
2D
0.6
%
0.1
%
0.6
%
0.1
%
Nil
0.1
%
0.1
%
0.1
%
0.1
%
10
0
.1%
0
.1%
0
.1%
0
.1%
20
0
.1%
0
.1%
0
.1%
0
.1%
N
il
30
Pla
nn
ed
resid
en
tia
l site 1
L3
0.1
%
0.1
%
0.1
%
0.1
%
1.5
0
.1%
0
.1%
0
.1%
0
.1%
10
0
.1%
0
.1%
0
.1%
0
.1%
20
0
.1%
0
.1%
0
.1%
0
.1%
O
A3
30
No
rth
ap
ron
are
a
of
Ka
i T
ak
De
ve
lop
me
nt
Exis
tin
g E
MS
D H
ea
dq
ua
rte
rs, site
1N
0.1
%
0.1
%
0.1
%
0.1
%
1.5
4
.5%
0
.1%
4
.5%
0
.1%
10
0
.4%
0
.1%
0
.4%
0
.1%
20
0
.1%
0
.1%
0
.1%
0
.1%
O
A4
30
Pla
nn
ed
go
ve
rnm
en
t site
3B
1
0.1
%
0.1
%
0.1
%
0.1
%
1.5
4
.3%
0
.1%
4
.3%
0
.1%
10
0
.5%
0
.1%
0
.5%
0
.1%
20
0
.3%
0
.1%
0
.3%
0
.1%
O
A5
30
Pla
nn
ed
go
ve
rnm
en
t site
3B
2
0.1
%
0.1
%
0.1
%
0.1
%
1.5
6
.8%
0
.1%
6
.8%
0
.1%
10
0
.7%
0
.1%
0
.7%
0
.1%
20
0
.3%
0
.1%
0
.3%
0
.1%
O
A6
30
Pla
nn
ed
go
ve
rnm
en
t site
3B
3
0.1
%
0.1
%
0.1
%
0.1
%
1.5
7
.7%
0
.1%
7
.7%
0
.1%
10
0
.9%
0
.1%
0
.9%
0
.1%
20
0
.1%
0
.1%
0
.1%
0
.1%
O
A7
30
Pla
nn
ed
go
ve
rnm
en
t site
3B
4
0.1
%
0.1
%
0.1
%
0.1
%
1.5
8
.8%
1
.4%
8
.8%
1
.4%
10
2
.2%
0
.1%
2
.2%
0
.1%
O
A8
20
So
uth
ap
ron
are
a
of
Ka
i T
ak
De
ve
lop
me
nt
Pla
nn
ed
hospita
l site
0.3
%
0.1
%
0.3
%
0.1
%

A
gre
em
ent
No.
CE
35/2
006(C
E)
K
ai T
ak D
evelo
pm
ent
Engin
eeri
ng S
tud
y
Anne
x A
cum
Desig
n a
nd C
onstr
uction o
f A
dva
nce W
ork
s
KT
AC
an
d K
TT
S S
tudie
s
– I
nvestigation,
Desig
n a
nd C
on
str
uction
9-3
2
Pre
dic
ted
Fre
qu
en
cy o
f E
xc
ee
da
nc
e
(in
% o
f ti
me
in
a y
ea
r)
Mit
iga
ted
Sce
na
rio
A2
M
itig
ate
d S
ce
na
rio
B2
A
SR
ID
A
ss
es
sm
en
t H
eig
ht
(m)
Re
gio
n
De
sc
rip
tio
n
Ex
ce
ed
ing
5
ou
/m3
Ex
ce
ed
ing
10
o
u/m
3
Ex
ce
ed
ing
5
ou
/m3
Ex
ce
ed
ing
10
o
u/m
3
OA
8
30
P
lan
ned
hospita
l site
0
.1%
0
.1%
0
.1%
0
.1%
1.5
1
0.4
%
4.3
%
10
.4%
4
.3%
10
2
.0%
0
.1%
2
.0%
0
.1%
20
0
.1%
0
.1%
0
.1%
0
.1%
O
A9
30
Pla
nn
ed
hospita
l site
0.1
%
0.1
%
0.1
%
0.1
%
OA
10
1
.5
Pla
nn
ed
dis
tric
t o
pe
n s
pa
ce
, site
3E
2
13
.9%
8
.3%
1
3.9
%
8.3
%
1.5
0
.1%
0
.1%
0
.1%
0
.1%
10
0
.1%
0
.1%
0
.1%
0
.1%
20
0
.1%
0
.1%
0
.1%
0
.1%
O
A1
1
30
So
uth
ap
ron
are
a
of
Ka
i T
ak
De
ve
lop
me
nt
Pla
nn
ed
co
mm
erc
ial site
3D
4
0.1
%
0.1
%
0.1
%
0.1
%
1.5
0
.1%
0
.1%
0
.1%
0
.1%
10
0
.1%
0
.1%
0
.1%
0
.1%
20
0
.1%
0
.1%
0
.1%
0
.1%
O
A1
2
30
Exis
tin
g W
orld
Tra
de
Squ
are
0.1
%
0.1
%
0.1
%
0.1
%
1.5
0
.1%
0
.1%
0
.1%
0
.1%
10
0
.1%
0
.1%
0
.1%
0
.1%
20
0
.1%
0
.1%
0
.1%
0
.1%
O
A1
3
30
Exis
tin
g K
wo
ng
Sa
ng
Hon
g B
uild
ing
0.1
%
0.1
%
0.1
%
0.1
%
1.5
0
.1%
0
.1%
0
.1%
0
.1%
10
0
.1%
0
.1%
0
.1%
0
.1%
20
0
.1%
0
.1%
0
.1%
0
.1%
O
A1
4
30
Exis
tin
g K
wu
n
To
ng
are
a
Exis
tin
g S
ea
po
we
r In
du
str
ial C
en
tre
0.1
%
0.1
%
0.1
%
0.1
%
OA
15
1
.5
Pla
nn
ed
Ru
nw
ay P
ark
, site 4
D1
0
.1%
0
.1%
0
.1%
0
.1%
OA
16
1
.5
Pla
nn
ed
Ru
nw
ay P
ark
, site 4
D1
0
.4%
0
.1%
0
.4%
0
.1%
OA
17
1
.5
Pla
nn
ed
Ru
nw
ay P
ark
, site 4
D1
0
.8%
0
.1%
0
.8%
0
.1%
1.5
0
.9%
0
.1%
0
.9%
0
.1%
10
0
.8%
0
.1%
0
.8%
0
.1%
20
0
.6%
0
.1%
0
.6%
0
.1%
O
A1
8
30
Pla
nn
ed
tou
rism
no
de
, site
4D
1
0.3
%
0.1
%
0.3
%
0.1
%
1.5
0
.1%
0
.1%
0
.1%
0
.1%
10
0
.1%
0
.1%
0
.1%
0
.1%
20
0
.1%
0
.1%
0
.1%
0
.1%
O
A1
9
30
Ru
nw
ay
are
a
of
Ka
i T
ak
De
ve
lop
me
nt
Pla
nn
ed
cru
ise
te
rmin
al b
uild
ing
, site
4D
3
0.1
%
0.1
%
0.1
%
0.1
%

Agre
em
ent
No.
CE
35/2
006(C
E)
Kai T
ak D
evelo
pm
ent
Engin
eeri
ng S
tud
y
cum
Desig
n a
nd C
onstr
uction o
f A
dva
nce W
ork
s
Anne
x A
– I
nvestigation,
Desig
n a
nd C
on
str
uction
KT
AC
an
d K
TT
S S
tudie
s
9-3
3
Pre
dic
ted
Fre
qu
en
cy o
f E
xc
ee
da
nc
e
(in
% o
f ti
me
in
a y
ea
r)
Mit
iga
ted
Sce
na
rio
A2
M
itig
ate
d S
ce
na
rio
B2
A
SR
ID
A
ss
es
sm
en
t H
eig
ht
(m)
Re
gio
n
De
sc
rip
tio
n
Ex
ce
ed
ing
5
ou
/m3
Ex
ce
ed
ing
10
o
u/m
3
Ex
ce
ed
ing
5
ou
/m3
Ex
ce
ed
ing
10
o
u/m
3
1.5
0
.1%
0
.1%
0
.1%
0
.1%
10
0
.1%
0
.1%
0
.1%
0
.1%
20
0
.1%
0
.1%
0
.1%
0
.1%
O
A2
0
30
Pla
nn
ed
cru
ise
te
rmin
al b
uild
ing
, site
4D
3
0.1
%
0.1
%
0.1
%
0.1
%
1.5
0
.1%
0
.1%
0
.1%
0
.1%
10
0
.1%
0
.1%
0
.1%
0
.1%
20
0
.1%
0
.1%
0
.1%
0
.1%
O
A2
1
30
Pla
nn
ed
cru
ise
te
rmin
al b
uild
ing
, site
4D
3
0.1
%
0.1
%
0.1
%
0.1
%
OA
22
1
.5
Pla
nn
ed
lo
cal o
pe
n s
pace
, site 4
B5
1
.4%
0
.1%
1
.4%
0
.1%
1.5
2
.5%
0
.1%
2
.5%
0
.1%
10
1
.7%
0
.1%
1
.7%
0
.1%
20
0
.7%
0
.1%
0
.8%
0
.1%
O
A2
3
30
Pla
nn
ed
resid
en
tia
l site 4
B5
0.1
%
0.1
%
0.1
%
0.1
%
1.5
1
8.4
%
8.3
%
18
.4%
8
.3%
10
1
1.1
%
0.1
%
11
.1%
0
.1%
20
0
.1%
0
.1%
0
.1%
0
.1%
O
A2
4
30
Pla
nn
ed
resid
en
tia
l site 4
B4
0.1
%
0.1
%
0.1
%
0.1
%
1.5
3
2.1
%
10
.2%
3
2.2
%
10
.2%
10
1
8.1
%
0.1
%
18
.2%
0
.1%
20
0
.1%
0
.1%
0
.1%
0
.1%
O
A2
5
30
Pla
nn
ed
resid
en
tia
l site 4
B3
0.1
%
0.1
%
0.1
%
0.1
%
1.5
2
2.8
%
0.1
%
22
.8%
0
.1%
10
1
2.0
%
0.1
%
12
.0%
0
.1%
20
0
.1%
0
.1%
0
.1%
0
.1%
O
A2
6
30
Pla
nn
ed
resid
en
tia
l site 4
B2
0.1
%
0.1
%
0.1
%
0.1
%
1.5
3
2.7
%
3.2
%
32
.7%
3
.2%
10
1
1.8
%
0.1
%
11
.8%
0
.1%
20
3
.1%
0
.1%
3
.1%
0
.1%
O
A2
7
30
Pla
nn
ed
resid
en
tia
l site 4
B1
0.1
%
0.1
%
0.1
%
0.1
%
1.5
2
8.1
%
3.2
%
28
.1%
3
.2%
10
9
.8%
0
.8%
9
.8%
0
.8%
20
3
.8%
0
.1%
3
.8%
0
.1%
O
A2
8
30
Pla
nn
ed
resid
en
tia
l site 4
A1
0.1
%
0.1
%
0.1
%
0.1
%
OA
29
1
.5
Ru
nw
ay
are
a
of
Ka
i T
ak
De
ve
lop
me
nt
Pla
nn
ed
co
mm
erc
ial site
4A
3
15
.6%
0
.4%
1
5.6
%
0.4
%

A
gre
em
ent
No.
CE
35/2
006(C
E)
K
ai T
ak D
evelo
pm
ent
Engin
eeri
ng S
tud
y
Anne
x A
cum
Desig
n a
nd C
onstr
uction o
f A
dva
nce W
ork
s
KT
AC
an
d K
TT
S S
tudie
s
– I
nvestigation,
Desig
n a
nd C
on
str
uction
9-3
4
Pre
dic
ted
Fre
qu
en
cy o
f E
xc
ee
da
nc
e
(in
% o
f ti
me
in
a y
ea
r)
Mit
iga
ted
Sce
na
rio
A2
M
itig
ate
d S
ce
na
rio
B2
A
SR
ID
A
ss
es
sm
en
t H
eig
ht
(m)
Re
gio
n
De
sc
rip
tio
n
Ex
ce
ed
ing
5
ou
/m3
Ex
ce
ed
ing
10
o
u/m
3
Ex
ce
ed
ing
5
ou
/m3
Ex
ce
ed
ing
10
o
u/m
3
10
6
.4%
0
.1%
6
.5%
0
.1%
20
4
.2%
0
.1%
4
.2%
0
.1%
O
A2
9
30
Pla
nn
ed
co
mm
erc
ial site
4A
3
0.1
%
0.1
%
0.1
%
0.1
%
OA
30
1
.5
Pla
nn
ed
re
gio
na
l op
en
spa
ce
, site
4A
1
6.4
%
0.1
%
16
.4%
0
.1%
OA
31
1
.5
Pla
nn
ed
re
gio
na
l op
en
spa
ce
, site
4A
2
4.6
%
0.1
%
24
.6%
0
.1%
OA
32
1
.5
Ru
nw
ay
are
a
of
Ka
i T
ak
De
ve
lop
me
nt
Pla
nn
ed
re
gio
na
l op
en
spa
ce
, site
4A
2
1.1
%
0.9
%
21
.1%
0
.9%
1.5
0
.1%
0
.1%
0
.1%
0
.1%
10
0
.1%
0
.1%
0
.1%
0
.1%
20
0
.1%
0
.1%
0
.1%
0
.1%
O
A3
3
30
Pla
nn
ed
Site
1L4
0.1
%
0.1
%
0.1
%
0.1
%
1.5
0
.1%
0
.1%
0
.1%
0
.1%
10
0
.1%
0
.1%
0
.1%
0
.1%
20
0
.1%
0
.1%
0
.1%
0
.1%
O
A3
4
30
Pla
nn
ed
go
ve
rnm
en
t site
1J3
0.1
%
0.1
%
0.1
%
0.1
%
1.5
0
.1%
0
.1%
0
.1%
0
.1%
10
0
.1%
0
.1%
0
.1%
0
.1%
20
0
.1%
0
.1%
0
.1%
0
.1%
O
A3
5
30
Pla
nn
ed
Site
1L1
0.1
%
0.1
%
0.1
%
0.1
%
1.5
0
.1%
0
.1%
0
.1%
0
.1%
10
0
.1%
0
.1%
0
.1%
0
.1%
20
0
.1%
0
.1%
0
.1%
0
.1%
O
A3
6
30
Pla
nn
ed
Site
1I3
0.1
%
0.1
%
0.1
%
0.1
%
1.5
0
.1%
0
.1%
0
.1%
0
.1%
10
0
.1%
0
.1%
0
.1%
0
.1%
20
0
.1%
0
.1%
0
.1%
0
.1%
O
A3
7
30
Pla
nn
ed
Site
1K
1
0.1
%
0.1
%
0.1
%
0.1
%
1.5
0
.1%
0
.1%
0
.1%
0
.1%
10
0
.1%
0
.1%
0
.1%
0
.1%
20
0
.1%
0
.1%
0
.1%
0
.1%
O
A3
8
30
No
rth
a
pro
n
are
a
of
Ka
i T
ak
De
ve
lop
me
nt
Pla
nn
ed
Site
1H
3
0.1
%
0.1
%
0.1
%
0.1
%

Agre
em
ent
No.
CE
35/2
006(C
E)
Kai T
ak D
evelo
pm
ent
Engin
eeri
ng S
tud
y
cum
Desig
n a
nd C
onstr
uction o
f A
dva
nce W
ork
s
Anne
x A
– I
nvestigation,
Desig
n a
nd C
on
str
uction
KT
AC
an
d K
TT
S S
tudie
s
9-3
5
Pre
dic
ted
Fre
qu
en
cy o
f E
xc
ee
da
nc
e
(in
% o
f ti
me
in
a y
ea
r)
Mit
iga
ted
Sce
na
rio
A2
M
itig
ate
d S
ce
na
rio
B2
A
SR
ID
A
ss
es
sm
en
t H
eig
ht
(m)
Re
gio
n
De
sc
rip
tio
n
Ex
ce
ed
ing
5
ou
/m3
Ex
ce
ed
ing
10
o
u/m
3
Ex
ce
ed
ing
5
ou
/m3
Ex
ce
ed
ing
10
o
u/m
3
1.5
0
.1%
0
.1%
0
.1%
0
.1%
10
0
.1%
0
.1%
0
.1%
0
.1%
20
0
.1%
0
.1%
0
.1%
0
.1%
O
A3
9
30
Pla
nn
ed
Site
1M
1
0.1
%
0.1
%
0.1
%
0.1
%
1.5
0
.1%
0
.1%
0
.1%
0
.1%
10
0
.1%
0
.1%
0
.1%
0
.1%
20
0
.1%
0
.1%
0
.1%
0
.1%
O
A4
0
30
No
rth
a
pro
n
are
a
of
Ka
i T
ak
De
ve
lop
me
nt
Pla
nn
ed
Site
1M
2
0.1
%
0.1
%
0.1
%
0.1
%
1.5
1
.7%
0
.5%
1
.7%
0
.5%
10
0
.1%
0
.1%
0
.1%
0
.1%
20
0
.1%
0
.1%
0
.1%
0
.1%
O
A4
1
30
Exis
tin
g L
ee K
au
Ya
n M
em
oria
l S
ch
oo
l
0.1
%
0.1
%
0.1
%
0.1
%
1.5
0
.1%
0
.1%
0
.1%
0
.1%
10
0
.1%
0
.1%
0
.1%
0
.1%
20
0
.1%
0
.1%
0
.1%
0
.1%
O
A4
2
30
Exis
tin
g
Ko
wlo
on
City A
rea
Exis
tin
g S
ir R
obe
rt B
lack H
ealth
Ce
ntr
e
0.1
%
0.1
%
0.1
%
0.1
%