agile suppy chain
DESCRIPTION
agileTRANSCRIPT

www.sciedu.ca/bmr Business and Management Research Vol. 3, No. 2; 2014
Published by Sciedu Press 81 ISSN 1927-6001 E-ISSN 1927-601X
LEAGILITY and PARETO: Increasing Services Level through a Combination of LEAGILITY and ABC Curve
Vinicius Zomkowski Salvi1 & Sergio Fernando Mayerle2 1 UFSC, Santa Catarina Federal University, Florianópolis, Santa Catarina, Mastering Degree student of Production Engineering, Specialist in Logistics, 3 years of experience in food companies’ distribution 2 UFSC, Santa Catarina Federal University, Florianópolis, Santa Catarina, Professor of Operational Research, Doctor in Production Engineering
Correspondence: Vinicius Zomkowski Salvi, UFSC, Santa Catarina Federal University, Florianópolis, Santa Catarina. E-mail: [email protected]
Received: May 18, 2014 Accepted: June 3, 2014 Online Published: June 11, 2014
doi:10.5430/bmr.v3n2p81 URL: http://dx.doi.org/10.5430/bmr.v3n2p81
Abstract
The first decade of that century started to discuss Agile and Leagility more intensively. This paper follows the flow and wants to demonstrate how to use Pareto and Leagility concepts to create supply chain models. Analysing data from a multinational food company, it was able to show measures that can be taken by the firm for minimizing waste, being more responsive or both. After a literature review about Lean, Agile and manly Leagility, utilizing manly medium and high impact factor articles (ISI), this paper collected data from more than 700 skus of a huge company of chicken production, classified those in general ABC classification and also in ABC for each category.This article gave examples of waste for the A curve of the studied company. With same proposal, it appeared to be reasonable to offer a methodology for that B items, specially that one whose demand is more volatile than A curves items, but its productions need to keep being done by forecast and demand planning. At least, original C curve was divided into two: Items with huge gross margin sales and items with small gross margin.
Keywords: Agile production, Lean production, Channel management, Case studies
1. Introduction
Lean, agile or leagile were implemented by less than 30% of companies, Eaton (2003/2004). However, those there themes are presented in hundreds of studies about supply chain. Mason-Jones, Naylor etTowill (2000) wrote, for example, about designer through leagile techniques. Companies that apply those concepts usually create a model based or on lean supply chain (more common), agile supply chain or leagile supply chain with that last one being characteristics of agile and lean and a different strategy of conducing the whole chain. It is rare to combine agile and lean in a unique supply chain of an enterprise where some products are lean and other are agile. Companies with hundreds of skus (stock keep units), however, can have products with lean, agile and even leagile (agile + lean) characteristics and it can be necessary to use all those three types in a unique supply chain.
Pareto is used mainly in companies for determining different strategies of materials control or for applying 6 sigma concepts. Goldsby, GriffisetRoath (2006) shows another use for it. These authors affirm that Pareto distribution can be used for classifying items A into lean supply chain while items B and C are items characterized by agile supply chain aspects. Some companies will need another classification such as lean A, agile C and leagile B.
Lean is known as a philosophy that wants to eliminate all forms of waste in a supply chain. Lean is also a process of delivery value to an end costumer through a flow. Value can also be interpreted as cost reduction (Hines, Holwegand Rich, 2004). Products in lean process have predictable demand low variety, long life cycle, cost as the main driver, use algorithmic for defining demand and can be commodities. In a company with many skus, the A products of a volume’s Pareto definition are products with similarities with lean concept and can be treated as lean supply chain.
Agile aims at giving quickly response to changes in demand pattern. It is aggressive in changing and focuses on growth. There are products with less volume in a company that have a high gross margin and can growth because it has a small market share participation. Agile supply chains need partner integration for dealing with uncertainties and create a virtual chain together (Baramichai, Zimmers and Marangos (2007). Demands are uncertainty, high variety of products, short cycle life and the demand is defined in a consulted way with partners and they can be fashion goods.
www.sciedu.ca/bmr Business and Management Research Vol. 3, No. 2; 2014
Published by Sciedu Press 82 ISSN 1927-6001 E-ISSN 1927-601X
They are, during a transition moment, the items C with huge gross margin, and then they will be characterized by items B and C with huge gross margin.
Leagile is a mix, a heterogeneity supply chain with Lean and Agile characteristics. Its demand is unpredictable and volatile, it has medium product variety and it has as the main driver the service level. It is common to install VMI (vendor management inventory) and a postponement system, beyond a decoupling point. In volumes’ Pareto distribution it can be the B items. This article shows how to apply leagility in a supply chain with more than 6 hundred skus. It shows the definition of Lean, Agile and Leagile, it draws the nowadays supply chain and makes a diagnosis showing opportunities of improvement. The article is based on a case study about a food multinational company that acts in different types of markets with the same strategy of supply chain and it.
2. Lean Supply Chain
Supply chain can be considered one of the main factors for a company success. The entire flow, from raw material to final consumer use must be properly understood (Simons and Gimenez, 2010). A Lean supply chain is based on the
Identification of customer value, firm organization around customer value streams rather than production functions, elimination of waste to allow production to flow, synchronization of production with the pull of customer demand, and finally the philosophical culture that there is always room for improvement in any process through the pursuit of perfection (Simons and Gimenez, 2010, pp. 56).
Although the term Lean was created by professors of MIT that were studying the Japanese way of production that was opposite to mass production, Lean represents ideas generated by TPS (Toyota Production System). Toyota is today the biggest car make in the world and it has created the system of optimizing VA (value added) and minimizing NVA (non-value added). Many authors define lean as elimination of waste. Wee and Wu (2009, pp.336)) affirms that there are 8 types of waste “overproduction, waiting, conveyance, over processing, excess inventory, movement, defects and unused employee creativity”.
3. Agile Supply Chain
Agility supply chain is usually understood as a means to respond quickly to customer needs or means to respond to changes in customer demand or market and yet as “a whole to rapidly align the network and its operations to dynamic and turbulent customer requirements” (Gligor and Holcomb, 2012, pp.443) For Yusuf et al (2012) it is necessary to implement Lean before implementing Agile, being agile, in their conception, a complementation of Lean. It is not a unanimous vision. Yusuf et al (2012, pp.2) brought another concept of agile defined “as the successful adoption of competitive bases (speed, flexibility, innovation, proactivity, quality and profitability)”.
4. Leagility
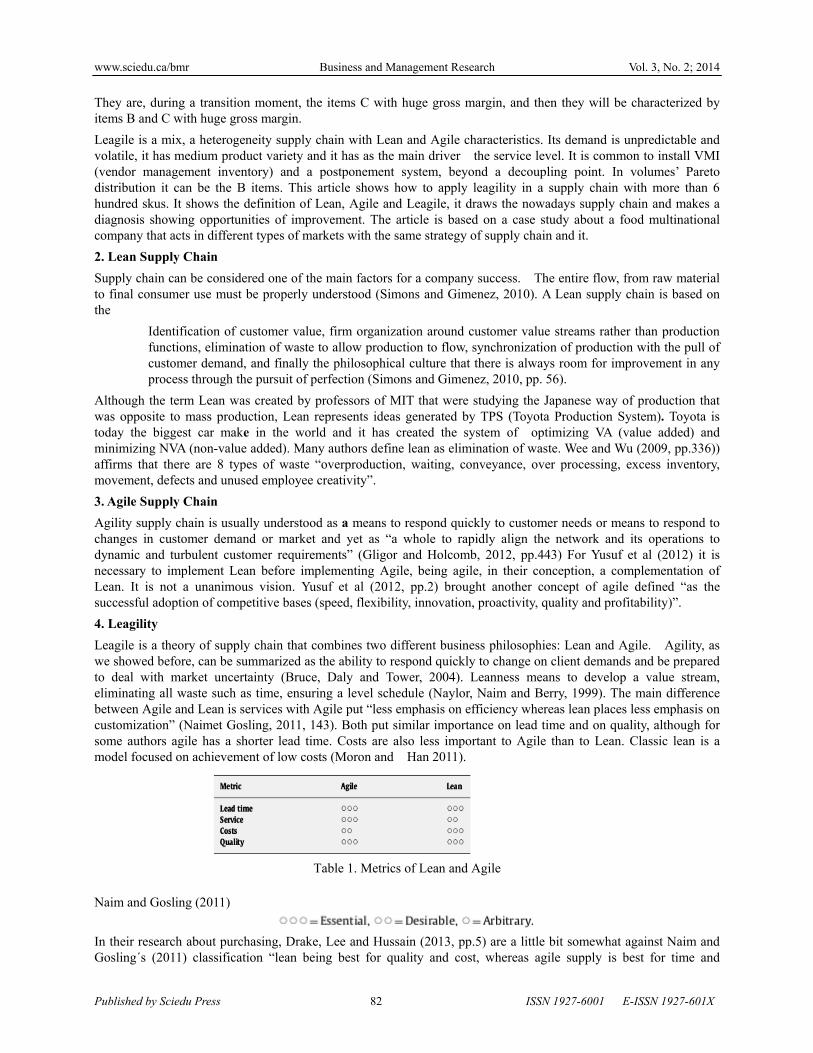
Leagile is a theory of supply chain that combines two different business philosophies: Lean and Agile. Agility, as we showed before, can be summarized as the ability to respond quickly to change on client demands and be prepared to deal with market uncertainty (Bruce, Daly and Tower, 2004). Leanness means to develop a value stream, eliminating all waste such as time, ensuring a level schedule (Naylor, Naim and Berry, 1999). The main difference between Agile and Lean is services with Agile put “less emphasis on efficiency whereas lean places less emphasis on customization” (Naimet Gosling, 2011, 143). Both put similar importance on lead time and on quality, although for some authors agile has a shorter lead time. Costs are also less important to Agile than to Lean. Classic lean is a model focused on achievement of low costs (Moron and Han 2011).
Table 1. Metrics of Lean and Agile
Naim and Gosling (2011)
In their research about purchasing, Drake, Lee and Hussain (2013, pp.5) are a little bit somewhat against Naim and Gosling´s (2011) classification “lean being best for quality and cost, whereas agile supply is best for time and
www.sciedu.ca/bmr Business and Management Research Vol. 3, No. 2; 2014
Published by Sciedu Press 83 ISSN 1927-6001 E-ISSN 1927-601X
flexibility, so if a component has a high impact on all four factors “leagility” is needed”. They are assuming that cost and quality are given more weight on Lean while Naim and Gosling (2011) affirms that it is just costs, when they wrote about agile being also different. For those last authors service (such as flexibility) and lead time represents Agile.
Christopher and Towill (2000) goes with Naim and Gosling (2011) and defends the idea that Lead time is important when comparing both methods because Lean does not accept any kind of waste and a bad lead time is considered a loss of time. For Christopher and Towill (2000) there are market qualifiers and a market winner. The Market winner in Lean is costs and in Agile is a services level. Market qualifiers are 1) quality; 2) Cost and 3) Lead Time in Agile while in Lean are 1) Quality, 2) Lead Time and 3) Services.
Bruce, Daly and Tower (2004) studied four companies of clothes in the UK. They concluded that almost all of them used a combination of Lean and Agile. Lean because they need to lead with low margin and Agile when they respond quickly to change with as short as possible lead time. Those authors also affirmed “The tradeoff between cost of production, lead-time of supply and volatility of demand within the sector continues to act as a focus for improved responsiveness and developed relationships” (pp.166).
Stratton and Warburton (2003, pp.197), studying Lean, Agile and Leagile, said “lean supply chain paradigm has taught us the importance of reducing variation and enabling flow, so reducing the need for protective inventory and capacity”. However, nowadays it is a market exigency to also have a strategically locate inventory and capacity to enable flow – those are agile concepts (Stratton and Warburton, 2003).
There are at least three ways for of combining lean and agile into leagile (Goldsby, GriffisetRoath, 2006). First approach embraces the Pareto (80/20) rule. It considers that 80% of a company’s revenue is generated from 20% of its products. Those 20% fast-moving products should be produced in lean, make to stock manner, employing make to order production. The other 80% should be produced in an agile. The Second approach is about peaks of demand. Some products have normal demand but with incalculable peak, the normal demand can be in lean and the peak quantity in agile. Finally, leagile can also be based on postponement strategies.
“Leagility is the combination of leanness and agility within a total supply chain strategy using a decoupling point so as to best suit the need for responding to the downstream volatile demand while providing level scheduling upstream from the market place.” (Rahimnia and Moghadasian, 2010, pp. 81). It means that the method provides the upstream to decoupling point with Lean techniques and the downstream with agile techniques.
According to Eaton (2003/04, pp.14) “less than 30% of companies implementing any form of lean or agile (“leagility”) related improvement programme manage to achieve worthwhile results”. Finally, in Agarwal Shankar and Tiwari (2004, pp.223)
Leanness in a supply chain maximizes profits through cost reduction while agility maximizes profit
through providing exactly what the customer requires. The leagile supply chain enables the upstream part
of the chain to be cost-effective and the downstream part to achieve high service levels in a volatile
marketplace.
5. The Case Study Methodology
After a rigorous review in literature about Lean, Agile and manly Leagility, utilizing only medium and high impact factor articles (ISI), it was investigated a possibility to improve companies’ additional profitability through serving costumer in a valuable way.
This paper collected data from more than 700 skus of a huge company of chicken production, classified those in general ABC classification and also in ABC for each category. At the end, this paper was able to proportionate a strategic way for increasing logistics decisions not only deciding the biggest revenue and the smallest cost and best service necessity, but also defining three main alternatives for delivering products (lean, agile and leagile).
These three options corroborate with the theory of Lean. It was created in an environment of transition between Fordism and value chain determination, eliminating waste. This article gave examples of waste for the A curve of the studied company. With same proposal, it appeared to be reasonable to offer a methodology for that B items, specially that one whose demand is more volatile than A curves items, but its productions need to keep being done by forecast and demand planning.
At least, original curve C was divided into two: Items with huge gross margin sales and small volumes and articles with small gross margin sales and small volumes, according to averages. So items C with huge gross margin was

www.sciedu.ca/bmr Business and Management Research Vol. 3, No. 2; 2014
Published by Sciedu Press 84 ISSN 1927-6001 E-ISSN 1927-601X
applied theory of agile distribution.
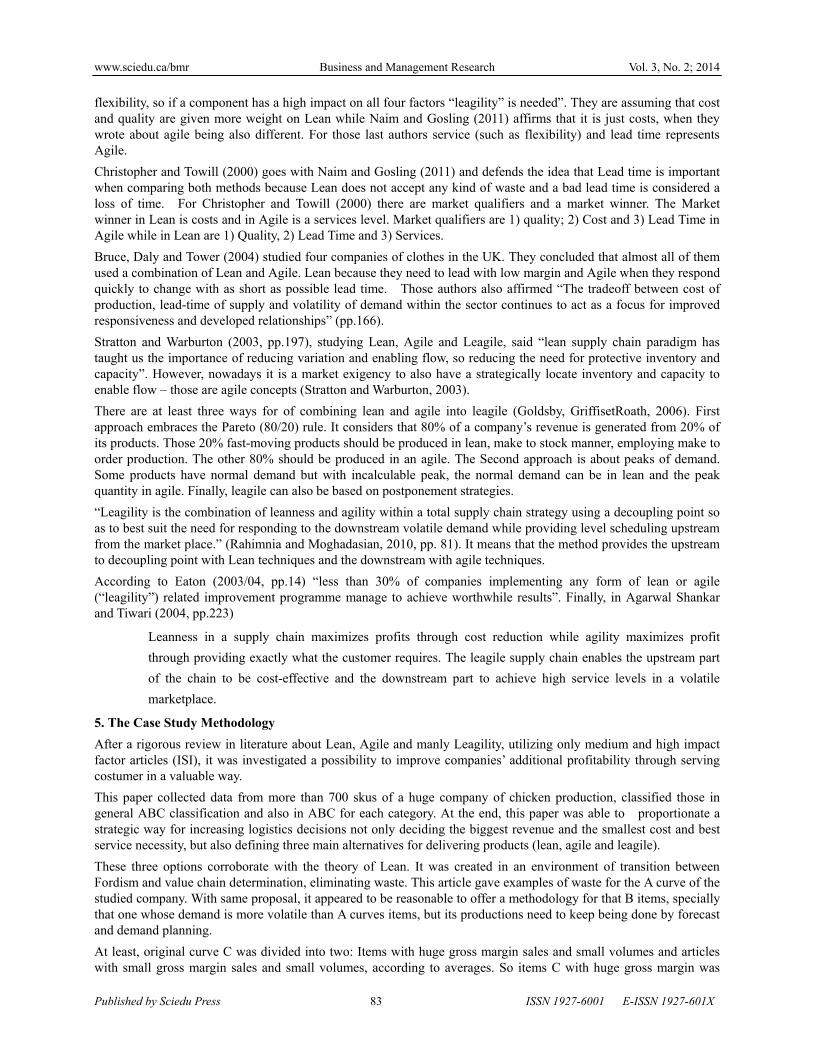
6. The Case Study Diagnosis
The researched entrepreneur has three market divisions: Food Service and Retail – both in Brazil, and External Market. This case studied only the Brazilian retail sector. It has 641 skus and it is divided into 10 categories. The graphic below show how those categories are positioned, being the size of ball the volume, horizontal axis gross margin and vertical axis net revenue.
Authors’ case study (2014)
Graphic 1. Categories in Net Renue per Gross Margin
Category 1 sells more volume than any other; however, its gross margin is below average of 32%. Category 2 and 3 also sells a good quantity of products, but they are below average too and the company intends to increase those margins. Categories 7 and 6 are well positioned about margin and the company wishes to put demand higher to next year, stimulating sales. Categories 8, 9 and 10 will be gradually eliminated and the remaining volume will be incorporated by other categories with different strategy of sales.
There is no differentiation in supply chains in the company studied according to characteristics of products and there is an inevitable differentiation such products such as frozen, dries, dairy products, but that is all. There are also some preferences and segmentations according to clients’ style - which one will be delivered first or which one will have the product if it is scarce. The company has many opportunities for improving distribution. Pareto’s distribution shows how the company is according to the case’s analysis.
Gross Margin
Graphic 2. Pareto’s Classification
Authors’ case study (2014)
Items A have average gross margin of 18% and it can improve the average because the company presents many wastes and the most part of the production is in a push process. Product is produced, transferred to a consolidator and only after it will arrive in a distribution center and is available to sales force to sell it. Not only lead time is lost but capacity to deliver value to final consumer is impacted when the product suffer with stock-outs.
Category 7
Category 3
Category 10
Category 1
Category 4
Category 2 Category 5
Category 8
Category 9
Category 6
‐500,000,000.00
0.00
500,000,000.00
1,000,000,000.00
1,500,000,000.00
2,000,000,000.00
2,500,000,000.00
3,000,000,000.00
‐10.00 0.00 10.00 20.00 30.00 40.00 50.00 60.00
‐500,000.00
0.00
500,000.00
1,000,000.00
1,500,000.00
0.00 10.00 20.00 30.00 40.00 50.00
A
B
C
D
Net
Rev
enue
Gross Margin
Net
Rev
enue
www.sciedu
Published by
Authors’ ca
One of thetheir distriblosing saleothers for production
However, tvolume (cospecial attestock-out –shelf. Belofill is a methan 60%. I
Authors’ ca
7. The Pro
The case stand gross mOur numbenjoyable tperformancchains with
Authors’ ca
u.ca/bmr
y Sciedu Press
ase study (2014
e difficulties ofbution is condees for not getti
responding qu system.
the most injureompany has a ention in deliv– clients ask foow, there are twasure that diviIt means that 4
Fa
Fa
ase study
oposed New Su
tudy has mademargin to C, aers suggest thto new producces better untilh high concentr
ase study (2014
NR
F
4)
f nowadays disemning producing mechanismuickly to patte
ed in this procsmall market
veries and saleor them and it wo graphics exdes the volume
40% of what is
She
amily 1
amily 2
Table 2
upply Chain
e a proposal ofand dedicating hat, opposite tcts or productsl 52% of the toration of skus,
Graphi
4)
Net
Rev
enue
Business and
85
Figure 1. Nowa
stribution is hocts that can havms of flexibiliterns of chang
cess is the C pshare of thoses and they endstill is not ava
xemplifying caue requested byrequested is n
lf Life Stock
53%
30%
2. C Curve Cate
f a new ABC ca better systemto Mason-Jons that are not otal volume. Wis a guarantee
ic 3. New Posit
d Management R
5
adays distribut
ow to deal witve much highety in productioging in deman
products with he). Because thd in a consolidilable in dc or uses of not cas
y clients by volnot sold.
k Out Comer
27%
35%
egories: reason
classification, mm for productses, Naylor etTthe company’
We did simulatof delivering p
Gross Margin
tioning in Pare
Research
IS
ion system
th products B. er margin, samon such as posnd and, at sam
high margin anhey are not thedator center fothey are avail
se fill in famililume sold. In C
rcial Logistic
13% 4
18% 7
ns for not case
migrating D ths B, elevating iTowill (2000)’s mainframe.tions and it becproducts with m
n
eto’s Distributi
SSN 1927-6001
Although theyme margin of ot
stponement, deme time, prom
nd grand oppoe mainframe thor a long time lable in dc, buties, subdivisionC types the cas
cs Others
4% 3%
7% 10%
fill
hat are productits margin to a, Agile techniThose authors
came clear to umore profitabil
on
Vol. 3, No. 2
E-ISSN 1927
y have good vother competitorecoupling poin
mote less cost
ortunity of incrhey do not hav
and / or they t it is in an advn of categoriesse fill rather is
ts with small van average of iques will be s affirmed thaus that agile, ility and less vo
2; 2014
7-601X
olume, rs, and nt, and to the
reasing ve any suffer
vanced s. Case bigger
volume 39%. better
at agile n food
olume.
www.sciedu
Published by
Items A arincrease mthey will inthrough a p
Category 1
Authors’ ca
Authors’ ca
Category 1average, 23until compthe compancompensate
In categoryvolume andbecome an
Authors’ ca
u.ca/bmr
y Sciedu Press
re items with amargin from 32%
ncrease volumprocess of agile
has a nowada
ase study (2014
ase study (2014
1 has less gros3%. Item B wiany’s B items ny’s average aed to increase v
y 2 items A had items C needitem C.
ase study (2014
an average of % to 39% with
me, absorbing me administratio
ys Pareto of vo
4)
4)
ss margin thanith 30% and itaverage propo
and below catevolumes of item
ave there is lesd to sell more f
4)
Business and
86
32% of gross h the use of le
mainly ex itemon.
olumes diagram
Graphic 4. AB
Graphic 5. C
n the companytem C with 51%osed of 39%.Iteegory 1 averagms C.
ss gross margifor occupying t
Graphic 6
d Management R
6
margin and theagile techniqu
ms D that grew
m illustrated be
BC Curve for C
Category 1 dist
y average, 32%% are positionems B indeed nge. Volumes o
in than the avethe lack let by
6. Category 2 A
Research
IS
here is still rooues. Finally, ite
gross margin
ellow.
Category 1
tribution
% against 25%ned well. Itemsneed to grow uof items D mo
erage. Items B items D that
ABC
SSN 1927-6001
om for improvens C will keepor sold more q
%. Its item A s B could increup its net revenostly disappear
should increat will be discon
Vol. 3, No. 2
E-ISSN 1927
vement. Items p the same 49quantities of it
is below categease its gross mnue, since it is r and migrate
ase gross margntinued or for
2; 2014
7-601X
B will %, but tems C
gory 1 margin below or are
gin and rced to

www.sciedu
Published by
Authors’ ca
Other categvolume in goal this st
7.1 Lean Se
These Leamargarineseach producosts of op(supermarkintegration optimized s
The implemvalue flowdeterminedproduction of routes bdistribution
The compapositive sidabattoirs. Tcentral planbe transform
Authors’ ca
u.ca/bmr
y Sciedu Press
ase study (2014
gories (3, 4, 5level B, elimi
tudy has develo
ervice Model
an products has, whole frozenuct is really higperation are alskets) as horrib
with logistics,secondary logi
mentation of Lw with the elid by demand a
is another chaetween distribun are also impo
any’s supply cdes as well, theThe animals benning of sales med into risen
ase study (2014
G
4)
5, 6, 7, 8, 9, 1inating volumeoped three serv
ave a good shn chicken, sausgh; together thso enormous a
ble. The servic, it has high levistic – from dis
Lean principles imination of nand the whole aracteristic of aution centers aortant.
chain model he company haselong to the comand productionand fattened b
4)
Business and
87
Graphic 7. Categ
10) have the sae in level D anvices models: L
helf life with sage, whole ha
hat classificatioand recently ince is expensivevel of kept sto
stribution cente
is essential to non-added actisystem will bea Lean supply
and industries i
has some huges partnership wmpany and farn, S&OP, whicbirds. The figur
Figure 2. Wa
d Management R
7
gory 2 ABC cl
ame goal: to ind transferringLean, Leagile a
more than 6 am and whole on A sold 1.10n a survey, come for the comcks and it is a
er to clients.
the company. ivities. It is ne a pull demanchain model.
is another poin
e wastes and with farmers formers are paid ch, indeed, canre 2 shows the
astes on Suppl
Research
IS
lassification
increase margig that volume tand Agile.
months in avebacon. The qu5.000 tons and
mpany’s logistimpany and for
push system p
The first step necessary to gnd system and Reduction of s
nt. Synchroniza
opportunities or providing pofor rising and
n decide to reduwastes of now
y Chain
SSN 1927-6001
in in level A pto level C prod
erage. They auantity of tons d they are just ic service was its clients, it
production and
is the implemeguarantee that
not a push destock levels, ination between p
of improvemeork, turkey andfattening thos
uce the numberwadays distribu
Vol. 3, No. 2
E-ISSN 1927
products, to inducts. To atten
are products susold in 9 mon69 skus. Howclassified by
has bad commdistribution w
entation of conproduction w
emand. Flexibincreasing the nproduction, sal
ent. However,d chicken for ite animals. Ther of eggs availa
ution.
2; 2014
7-601X
ncrease nd this
uch as nths for wever, clients
mercial with not
nsumer will be ility of
number les and
it has ts own ere is a able to

www.sciedu.ca/bmr Business and Management Research Vol. 3, No. 2; 2014
Published by Sciedu Press 88 ISSN 1927-6001 E-ISSN 1927-601X
It is in a push system (W1), products are produced and transported according to sale goals and the reposition is not based on real time sales, but mainly on having stock to force buys from clients until the goals are accomplished. There is no order of production directly from clients and the factories follow a schedule of production centralized in the central production plan according to sales goals, which does not allow companies to change plans to meet demand in real time. It means that factories are not working to attend order from clients (pull demand); they are working to produce products that will be goals to sales force, pushing production through that already mentioned goals and to the replenishment of stocks to the next cycles of pushing. The system of production and replenishment is characterized by a water box model. Once the regional distribution centers (examples of Recife, Porto Alegre, Rio de Janeiro e São Paulo) are gone with low level of stocks, the national concentrator will send more products for repositioning stocks.This replenishment is not based on consumed of the sales branch, it is based only on historical levels of stocks, point of replenishment, economy order quantity and again the sales goals, characterizing a push system.
Conveyance and excess of stock (W2 and W3) are other considerable points. Some trucks are quite old, roads are not good, it is not so difficult to lose time in traffic jams and lose cargo with accidents. Some trucks travel more than 3.000 km in a couple of days. Although it is important to do optimization, the optimization of trucks is not following principles of serving customers first. Sometimes the level of service needs to be higher once the product provides gross margins over average. The size of truck that operations need to use (trailer truck, truck or others) is considering minimum cost in each transportation, but it is not considering the possibility of more travels, a smaller truck capacity, but the reduction of stocks in the final DC and, mainly, the considerable reduction of stock outs. Inventory is definitely a problem in the company. Because it is a push system and it also has compulsory products - items with no pre-demand stabilized, and the company needs to create demand, forcing sales. Examples are feet of chicken and nose of pork – the enterprise is spending lots of money not only for keeping and operationalizing stocks in its own distribution centers but also because it needs to rent temporary warehouses when those own warehouses are gone full.
The company does not have enough service level of supply chain. If a supermarket asks for one hundred tons of a product, in general, it delivers 85 tons (85% of case fill), which can be considered a good level; however, it is achieved with a great space for improvement. Most part of losing sales is due to a not good operationalization of sales, especially during the interface between sales force and logistics (W5). Stock out is another common situation (W4). Today the vendors can sell only what is positioned one of the regional distribution centers. If the product is in transfer or in the consolidator national warehouse, it is a stock out. Sometimes products are not replenished in a correct time. Onerous items are another problem. This company has to concede discounts for advanced shelf, in some products sales with onerous are more than 30% of the totals sales (W8). Cutting order during picking process is another common waste (W9), 13.000 (t) in nine months that could be sold if it cuts hadn`t happened cuts during picking processes.
Unnecessary movement (W6) is common in the logistic process. Trucks delivering products to clients have to return to the company’s regional distribution center with devolutions or it is obligated to postpone the delivery because the clients have many suppliers delivering at the same time. Finally, waiting is causing the company many negative points (W7). First, it has to increase the number of trucks and people to do the delivery because time lost with waiting to be attended by clients consume some considerable time. Figure 3 describes the lean supply chain model designed for improving supply chain services, once we had pointed out the 8 main wastes in company’s service. It is possible to see that the main process is the mindset: it is necessary to work with a pull demand and to have a continuous improvement.
To minimize those wastes, it is necessary to serve the customer in another way and, as we defend in this articles, it is necessary to implement a lean thinking environment to these most sold products (they account for 80% of Brazil’s market division). They are products mature in their market, their brands are leaders in almost all segments they are competing and the company’s market share is huge.
The Company has a good demand forecast with those products that is used to determine the vendor’s goals. However, as it was commented before, the whole process is a push system. It is necessary to trust on the already used demand forecast and install a pull demand process based on demand forecast and real time sales for determining all the replenishment process, a kind of Kanban. Some products destined to some clients do not need to pass to the concentrator distributor. It can be serviced through direct deliveries from factories to distribution centers of main clients. It is already done by company, but in a not enough volume.

www.sciedu.ca/bmr Business and Management Research Vol. 3, No. 2; 2014
Published by Sciedu Press 89 ISSN 1927-6001 E-ISSN 1927-601X
Figure 3. Options of Lean Supply Chain
Authors’ case study (2014)
Companies are optimizing by using software logistic trades of stocking and replenishment from concentrators to regional distributions centers and cross docking installations. Although it sounds to be reducing costs, techniques of Lean show opportunities of increasing service level and even reducing costs.
Figure 4. Trucks Options
Authors’ case study (2014)
What is important for Lean is to stabilize a flow from consolidator or even from industry that allows adding value to end customer. Sometimes transportation costs can increase when someone choses a regular truck in place of a trailer truck, but the total cost can be reduced by reducing time of stocking and providing faster products to end customer. Another important point is that some final markets are far away from company’s industries. They are attended by ship, however, time of delivering is really high with, in a specific situation spending more than 15 days traveling. In this case Lean can help to plan better replenishment proposing another distribution center construction or even deciding to invest on local production or 3PL production.
The last mile of company’s distribution needs to reduce waiting time, devolution and cancel purchasing from clients. For this objective Lean teaches to do partnership and better communication with clients. A common goal with multiple win-win negotiations can stimulate group of work from customers and company looking for solutions,

www.sciedu.ca/bmr Business and Management Research Vol. 3, No. 2; 2014
Published by Sciedu Press 90 ISSN 1927-6001 E-ISSN 1927-601X
reducing wastes at the last mile. Some companies in Brazil, only with partnership, reduced more than R$100.000.000,00 ($50.000.000,00) in last mile through sharing of information and mutual goals.
7.3 Leagile Service Model
Leagile service model will be applied to B products or for products that need to have an exact differentiation between processes of production and delivery. Postponement, decoupling point and VMI are the techniques that those products use. Company’s products classified by volume as B, from 80% to 95% of total company’s volume, are products with medium volume of sales, the future actions will leave them with higher gross margin than A products and their level of service is worse than A products (77%). The two main reasons for not selling are stock out (33%) and divergences with the EDI system and shelf life.
Some products have short shelf life and this company intends to enter in cold food production and distribution. Different from European countries such as England, where more than 70% of chicken is sold cold and only 30% is frozen, Brazil has much more frozen than cold chicken. Only small companies or regional companies produce cold chicken to local markets. Company intends to get into this market and it has developed a leagile technique of distribution shown by Figure 5.
“Postponement refers to the process by which the commitment of a product to its final form or location is delayed for as long as possible”, (Christopher, 2005, pp.134). It means that a final product differentiation is delayed as far as possible until close to when demand for the product is known (Graman, 2010). For the delayed differentiation, as postponement is also known, it “has been conceived as an effective way in both academia and industry to deal with the conflicts between product diversity and inventory cost savings” (Tang, 2011, pp. 481). The CODP – customer order decoupling point - represents the moment when the product is differentiated for meeting the final demand. It is a point in the value chain for a product where it is linked to a specific customer demand Olhager (2010). This point divides what is forecast-driven (upstream of CODP) from what is customer order-driven (downstream CODP).
Figure 5. Leagile Distribution Example
Authors’ case study (2014)
The model proposed to put a decoupling point between primary processing and further processing. Primary processing in a chicken production is to kill the animal, clean and prepare the carcass to sell the whole chicken or, passing to further processing to sell chicken in cuts. A decoupling point between primary processing and further processing allows company to attend the variation of customers’ needs. Through VMI techniques, replenishment orders will go direct to industry and chickens will have the final processing and be delivered to client in a lead time inferior to three days.
7.4 Agile Service Model
Agility is important for products with short life cycle, with variation in demand and high value added. The future curve C will have those attributes. With a considerable gross margin, with introduction of new products and elimination of others, many items involved in this curve ABC (444) are low volume, have elevated stock out, many wastes caused by advanced shelf life and others will have better performance and will grow sales quicker. Nowadays distribution is not satisfying conditions for serving customers. Products with not so long shelf life stay longer than

www.sciedu.ca/bmr Business and Management Research Vol. 3, No. 2; 2014
Published by Sciedu Press 91 ISSN 1927-6001 E-ISSN 1927-601X
the necessary stocked in consolidators waiting for a complete cargo to be delivered to regional distribution centers.
Another important point, those products are not well forecasted. WMape, kpi for planning, is less than 50% of acuracity. Oscillation in sales forces a necessity to answer quickly to the variations in demand and supply. Lines can be closed while others are opened, turns can be opened or closed according to real demand. The base of agile distribution is a collaborative planning with clients and sharing information about POS (point of sales), and clients stocks.
Figure 6. Agile Components to company’s agile supply chain
Authors’ case study (2014)
8. Conclusion
To classify using Pareto curve items of a company with hundreds of skus is a good practice utilized mainly for material administration. However, this article showed that it can be combined with leagile technique and improve the company’s service model. The products that are the accumulated sum of 80% of total volume can be treated as Lean Service Model, paying attention to waste elimination and generating value to the end costumer.
Items that are from 80% to 95% to the accumulated sum of volume have higher margins, less service level, a high stock out level, shelf problems and EDI poor communication. Techniques such as VMI, postponement and decoupling point will help the studied company to reduce stock out, increase service level and have a better integration with customers.
Finally, the last 5% of the accumulated sum of volumes must have a huge gross margin, and the oscillations of demand, the highest level of stock out and shelf problems can obligate the company to be more focused on eliminating stock out, serving costumer in a way that is prepared to give answers to oscillations in demand and supplier.
References
AshishAgarwal, Ravi Shankar, M.K. Tiwari. (2006). “Modeling the metrics of lean, agile and leagile supply chain: An ANP-based approach”, European Journal of Operational Research, Vol. 173, Iss. 1, pp. 211-225. http://www.sciencedirect.com/science/article/pii/S0377221705000135
Catalina Perez, Rodolfo de Castro, David Simons, GerusaGimenez. (2010). "Development of lean supply chains: a case study of the Catalan pork sector", Supply Chain Management: An International Journal, Vol. 15 Iss: 1, pp.55 –68. http://www.emeraldinsight.com/journals.htm?articleid=1837642
DanutaKisperska-Moron, Job de Haan. (2011). “Improving supply chain performance to satisfy final customers: “Leagile” experiences of a polish distributor”, International Journal of Production Economics, Volume 133, Issue 1, Pages 127-134. http://www.sciencedirect.com/science/article/pii/S092552731000040X
David M. Gligor, Mary C. Holcomb. (2012). "Understanding the role of logistics capabilities in achieving supply chain agility: a systematic literature review", Supply Chain Management: An International Journal, Vol. 17 Iss: 4, pp.438 – 453. http://www.emeraldinsight.com/journals.htm?articleid=17031485

www.sciedu.ca/bmr Business and Management Research Vol. 3, No. 2; 2014
Published by Sciedu Press 92 ISSN 1927-6001 E-ISSN 1927-601X
Eaton, M. (2003). "Running the leagile marathon [lean/agile improvement programmes]," Manufacturing Engineer , vol.82, no.6, pp.14-17. http://ieeexplore.ieee.org/xpl/login.jsp?tp=&arnumber=1267740&url=http%3A%2F%2Fieeexplore.ieee.org%2Fxpls%2Fabs_all.jsp%3Farnumber%3D1267740
FariborzRahimnia, Mahdi Moghadasian. (2010). "Supply chain leagility in professional services: how to apply decoupling point concept in healthcare delivery system", Supply Chain Management: An International Journal, Vol. 15 Iss: 1, pp.80 – 91. http://www.emeraldinsight.com/journals.htm?articleid=1837644
Goldsby, Thomas J., Griffis, Stanley E, Roath, Anthony S. (2006). “Modeling Lean, Agile, and Leagile Supply Chain Strategies”, Journal of Business Logistics, Vol. 27 Iss: 1, pp. 57 – 80. http://dx.doi.org/10.1002/j.2158-1592.2006.tb00241.x
H.M. Wee, Simon Wu. (2009). "Lean supply chain and its effect on product cost and quality: a case study on Ford Motor Company", Supply Chain Management: An International Journal, Vol. 14 Iss: 5, pp.335 – 341. http://www.emeraldinsight.com/journals.htm?articleid=1810704
J Ben Naylor, Mohamed M Naim, Danny Berry. (1999). “Leagility: Integrating the lean and agile manufacturing paradigms in the total supply chain”, International Journal of Production Economics, Vol. 62, Iss. 1–2, pp. 107-118. http://www.sciencedirect.com/science/article/pii/S0925527398002230
Margaret Bruce, Lucy Daly, Neil Towers. (2004). "Lean or agile: A solution for supply chain management in the textiles and clothing industry?", International Journal of Operations & Production Management, Vol. 24 Iss: 2, pp.151 – 170. http://dx.doi.org/10.1108/01443570410514867
Martin Christopher. (2005). Logistics & Supply Chain Management, KING’S LYNN, London, Great Britain.
Martin Christopher, Denis R. Towill. (2000). "Supply chain migration from lean and functional to agile and customised", Supply Chain Management: An International Journal, Vol. 5 Iss: 4, pp.206 – 213. Supply chain migration from lean and functional to agile and customized. http://dx.doi.org/10.1108/13598540010347334
Mohamed M. Naim, Jonathan Gosling. (2011). “On leanness, agility and leagile supply chains”, International Journal of Production Economics, Vol. 131, Iss. 1, pp. 342-354. http://dx.doi.org/10.1016/j.ijpe.2010.04.045
Paul R. Drake, Dong Myung Lee, MatloubHussain. (2013). "The lean and agile purchasing portfolio model", Supply Chain Management: An International Journal, Vol. 18 Iss: 1, pp.3 – 20. http://www.emeraldinsight.com/journals.htm?articleid=17076644
Peter Hines, Matthias Holweg, Nick Rich. (2004). "Learning to evolve: A review of contemporary lean thinking", International Journal of Operations & Production Management, Vol. 24 Iss: 10, pp.994 – 1011. http://dx.doi.org/10.1108/01443570410558049
Rachel Mason-Jones, Ben Naylor, Denis R. Towill. (2010). “Lean, agile or leagile? Matching your supply chain to the marketplace”, International Journal of Production Research Vol. 38, Iss. 17, 2000. http://www.tandfonline.com/doi/abs/10.1080/00207540050204920?journalCode=tprs20#.U4XdJ1RdU8o
R Stratton, R.D.H Warburton. (2003). “The strategic integration of agile and lean supply”, International Journal of Production Economics, Vol. 85, Issue 2, pp. 183-198. http://dx.doi.org/10.1016/S0925-5273(03)00109-9
Yahaya Y. Yusuf, AngappaGunasekaran, Ahmed Musa, Mohammed Dauda, Nagham M. El-Berishy, ShuangCang. (2012). “A relational study of supply chain agility, competitiveness and business performance in the oil and gas industry”, International Journal of Production Economics, Available online 23 October 2012. http://www.sciencedirect.com/science/article/pii/S0925527312004288