agent based modelling and energy planning...
TRANSCRIPT

Agent based modelling and energy planning –
Utilization of MATSim for transport energy demand
modelling
T. Novosel1, L. Perković 1, M. Ban1, H. Keko2, T. Pukšec1, G. Krajač ić 1, N. Duić 1 1University of Zagreb; Faculty of Mechanical Engineering and Naval Architecture,
Department of Energy, Power Engineering and Environment
Ivana Luč ić a 5; 10002 Zagreb; Croatia 2Energy Institute Hrvoje Pož ar, Department for Energy Generation and Transformation
Savska 163, 10001 Zagreb, Croatia
The transportation sector is one of the major energy consumers in most energy systems and a
large portion of the energy demand is linked to road transport and personal vehicles. It
accounted for 32.8% of the final energy consumption of Croatia in 2011 making it the second
most energy demanding sector. Because of their higher efficiency, a modal switch from
conventional internal combustion engines (ICE) to electric vehicles (EVs) has the potential to
greatly reduce the overall energy demand of the transport sector. Our previous work has
shown that a transition to EVs in a combination with a modal split from air and road to rail
transport can reduce the energy consumption in Croatia by 99 PJ, which is approximately
59%, by the year 2050 when compared to the business as usual scenario. The goal of this
paper is to model the hourly distribution of the energy consumption of EVs and use the
calculated load curves to test their impact on the Croatian energy system. The hourly demand
for the transport sector has been calculated using the agent-based modelling tool MATSim on
a simplified geographic layout. The impact EVs have on the energy system has been modelled
using EnergyPLAN.
Key words: Electric vehicles, Demand side modelling, Agent-based modelling, Electrification
of transport, EnergyPLAN, MATSim
1. Introduction The transport sector represents a serious energy consumer in most energy systems across the
EU and wider. In Croatia for example, the transport sector accounted for 32.8% of the final
energy consumption in 2011 making it the second most energy demanding sector right after
buildings with 43% [1]. In the last decade, the final energy demand of the transport sector has
increased by approximately 70% due to a verity of reasons including economic growth and
large investments into a modern highway infrastructure [2]. These numbers demonstrate a
large potential for energy savings related to it especially if we consider the increase in
transport demand and low efficiency of standard internal combustion engines (ICE).
As it has already been demonstrated in our previous work [2], a widespread electrification of
the personal vehicle fleet could reduce the total final energy demand of the transport sector in
Croatia by roughly 53% by the year 2050 when compared with a business as usual scenario.
This represents a saving of 89 PJ of energy. If a modal split from road and air to rail transport
is taken into account as well, this savings could be increased to 59% or 99 PJ. Other authors
have already demonstrated the benefits that electrification can have on an energy system when
it comes to greenhouse gas emissions [3], [4] and [5] but in order to properly asses their
impact on a system as a whole an hourly analysis has to be implemented. This is necessary to
accommodate for the increase of peak demand of electricity and the potential for the
utilization of batteries of parked electric vehicles (EVs) as energy storage mediums that can
increase the possibility for the penetration of intermittent renewable energy sources (RES).
The importance of the implementation of energy storage technologies on the penetration of
intermittent RES has already been discussed by several authors [6], [7] and [8].
There are a variety of approaches already available for the forecast of the annual energy
demand of the transportation sector such as the ones described in [9], [10] and [11] but, as it
has been already stated earlier, an hourly distribution is needed here. To accommodate for
this, agent based modelling (ABM) has been utilized in the case of this work. The ABM is a
relatively young area of research applied widely so there are several definitions on basic
concepts. Commonly, in ABM a system is modelled as a collection of autonomous decision-
making entities called agents. These entities are placed into an environment and are able to
autonomously react to changes in the environment. This definition in turn implies the agents’
capability of sensing the environment and effecting (actuating) in order to interact with the
environment and change it [12]. In other words the agent entities are able to capture
information from the environment and percept the items of acquired information, and then act
accordingly. In turn, these actions affect the environment; provoking further interactions from
other entities. From the paradigm viewpoint, the ABM can also be seen as microscopic, i.e.
per-entity modelling, as opposed to macroscopic modelling where the integral system is being
modelled. Furthermore, the separation of agents and their environment indicates the inherent
distributable characteristics of ABM. Several classifications of ABM consider the
environment, e.g. its observability (i.e. whether an agent can gather the complete state of the
environment), or whether the environment is deterministic or stochastic etc. The definition of
agent considers a certain degree of autonomy. The agents may autonomously execute various
behaviours appropriate for the system they represent (e.g. purchasing, consuming, and
selling). An intelligent agent exhibits proactiveness, reactivity and social behaviour: it is able
to act towards a certain goal, it can respond to changes in the environment and it is able to
interact with other agents [13]. The intelligent agent research has largely emerged from
artificial intelligence and one is able to build highly complex internal structures of the agents.
Generally, ABM only requires the agents to place reasonable decisions about actions to be
performed. Thus even with relatively simple agent definitions, ABM can deliver repetitive
and competitive interactions between agents that result in complex behaviour patterns, and
this is one of key advantages of ABM: it allows the emergence of complex behaviour patterns
from relatively simple per-entity models. The ABMs have been successfully used in areas
ranging from economics [14] and social sciences [15] to biology and diverse engineering
areas [16]. In general, when the system being modelled is complex, modular and
decentralized, changeable (i.e. not statically defined), and defined at the time of design, ABM
is a well-fitted method of modelling.
The Goal of this work is to model the hourly distribution of the transport energy demand and
utilize that data to analyse the impact personal EVs can have on the potential for the
penetration of wind and PV power in an energy system. The agent based transportation
system modelling tool MATSim [17] has been used to generate said distribution and the

EnergyPLAN [18] advanced energy system analysis tool has been utilized to model Croatia’s
energy system and conduct the analysis.
2. Methodology The methodology of both the processes of obtaining the hourly energy demand curves for the
road transport sector in MATSim and the energy system modelling in EnergyPLAN have
been explained in this chapter.
2.1. MATSim In order to properly analyze the interaction between personal EVs and the electricity grid an
hourly distribution of the energy demand of personal road vehicles had to be created first. As
stated above, the ABM is a well-fitting method for transport modeling: there are numerous
agents whose decisions and behaviours, guided by their own intrinsic rules, that by interacting
among them and with the environment impact the whole transportation system on a larger
scale. Furthermore the transportation system conditions are not fixed. The application of
ABM in the modelling of transport is diverse. In [19] the authors present a TAPAS system for
simulation of transport chains, aimed towards transport-related policy and infrastructure
measures. Similarly, in [20], the authors deliver insights in the use of agent-based modelling
of transport logistics. This paper focuses on the simulation of urban transport, such as the
study presented in [21], where the authors present a study on driver behaviour in congested
streets of the city of Brisbane. Several tools for agent-based modelling of such urban traffic
exist. NISAC FastTrans [22], developed at US Los Alamos National Laboratory is a discrete,
event-based simulator designed to study the impacts of infrastructure components in crisis
management and dynamic prioritization. MAINSIM [23], Multimodal Inner-city Simulation
Tool is a tool developed in Goethe University in Frankfurt, Germany, aimed towards using
map information directly. It is an actor-based simulation system. COS-SIM [24] is an open
source tool for agent-based micro simulation of traffic flows, directed primarily towards
tuning of the traffic control devices.
For the simulations in this paper, MATSim [17] was chosen as a simulation tool. The
MATSIM model provides a framework to implement large-scale agent-based transport
simulations. It is exceptionally modular: demand modeling, mobility simulations, replanning,
controller module and analysis modules are provided. These modules can be used in
combination or stand-alone. The MATSIM model is open-source, cross-platform and highly
customizable, since its Java source code is freely available online. Thus MATSIM offers
extensibility and allows the user to add additional functionalities to its modules and tailor the
MATSIM for a particular problem.
A key feature of MATSIM is agent-based, multi-modal simulation of daily mobility
behaviour. The MATSIM simulations utilize behaviour definition for single persons
(“agents”) to track and model the system behaviour on the whole. In the case of personal EV-
based mobility, the aggregated behaviour is visible as an additional electricity demand and for
this reason, along with the flexibility to include the EV-related specifics, MATSIM was
selected as an appropriate tool for this paper.
The MATSIM simulation architecture [17] makes it particularly suitable for policy-making
issues, and it has been successfully used in tasks such as assessing the emission impact due to
household travelling [25] optimizing taxi service [26], determining policies on traffic
planning [27], [28] etc.
.

2.2. EnergyPLAN
EnergyPLAN is a deterministic input output computer modelling tool that creates an annual
analysis of an energy system on an hourly level. It requires a wide range of input data
including the total annual demands and hourly demand curves for electricity, installed
capacities and efficiencies of different types of energy producers (both renewable and non-
renewable) and energy storage technologies, fuel mix, hourly distribution of energy
production from intermittent sources like wind, solar and small hydro, the energy demands for
different sectors including transport, hourly distribution of transport energy demand, vehicle
to grid connection capacities, different regulation strategies and so on. The results of the
model include energy balances, annual and hourly energy production by source and the
critical excess of electricity production (CEEP) present in the system, fuel consumptions by
fuel type, total cost of the system, CO2 emissions and so on.
EnergyPLAN is a well documented tool that specializes in the large scale integration of RES
in energy systems [29] and [30], the optimal combination of RES [31] and the implementation
of CHP units in energy systems [32]. It has already been used to recreate many different
energy systems and devise numerous energy scenarios. For example, authors of [29] and [33]
used the model to simulate different scenarios for the Macedonian energy system. In [32] and
[34] EnergyPLAN has been used to model the Danish energy system and to analyze the
potential for the integration of RES. The authors of [35] used both the EnergyPLAN and the
H2RES [36] models to recreate the Croatian energy system and plan a 100% energy
independent scenario. EnergyPLAN has already been used to analysis of the impact of the
transport sector, especially electric vehicles, on an energy system [37] and [38] in the past.
3. Case study for Croatia The data gathering and processing and the development of the case study for Croatia using
both MATSim and EnergyPLAN has been explained here.
3.1. Hourly distribution of the transport energy demand In order to create an hourly energy demand curve for the Croatian road transport sector, more
precisely personal vehicles, 4 individual distributions have been created for the cities of
Zagreb, Rijeka, Split and Osijek. The sum of the four curves is used to represent the
distribution for Croatia.
Inputs required by the MATSim are divided into the following categories:
population: provides agent's identification (agent ID number), age, working
municipality and longitudinal and lateral coordinates of home location
activity plan: tells agent at which location (work, home, leisure, shopping) they should
be at the specified time
network: provides the detailed network for each city under the consideration and only
the main roads outside the city limits
facilities (optional): provides the longitudinal and lateral coordinates of non-home
locations
The quality of the solution obtained by MATSim will be closer to reality if the input data
resides on real-world observations. The best possible scenario is when each single agent
represents one surveyed person, but this is highly impractical and impossible to get.
Therefore, input data has to rely on survey conducted amog a limited number of surveyed
people and set of data that is usually available in aggregated form. In order to reduce the
number of input data and simplify the preparation of MATSim inputs, the following
assumptions are used:
the only activities are home and work
leisure is assumed to be on the same locations as work
there are no holidays within the year
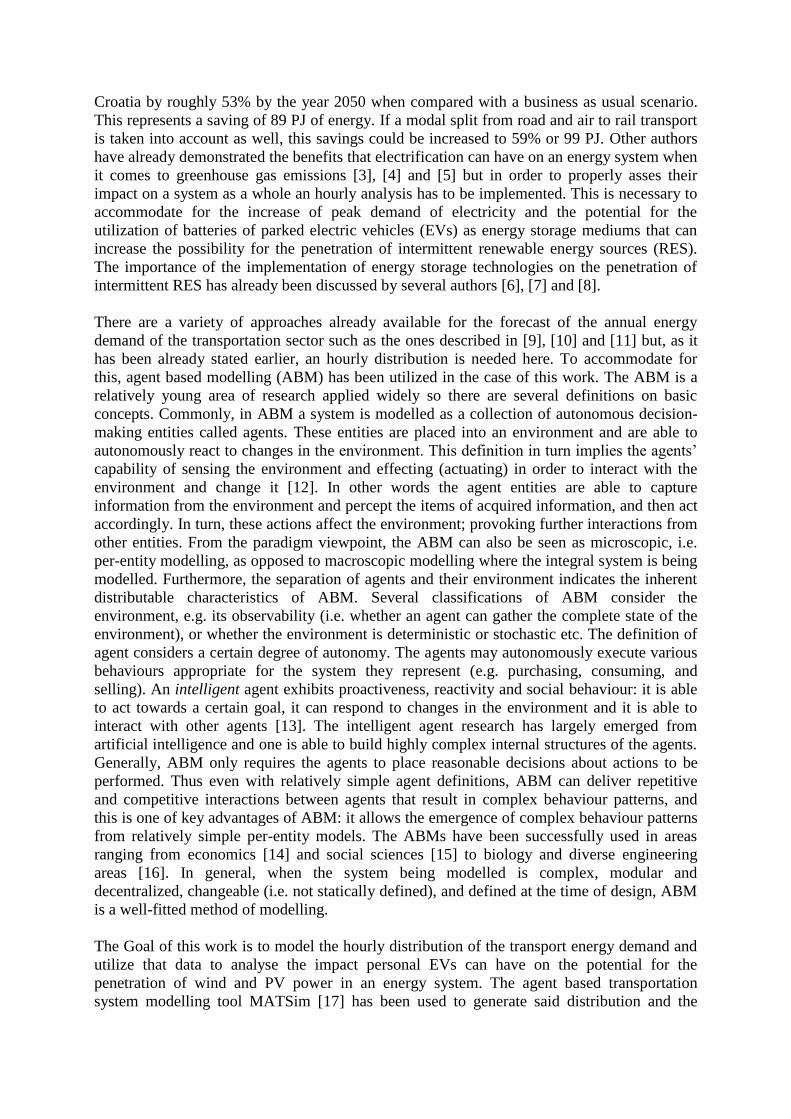
In order to find the population and activity plan inputs for the four biggest Croatian cities, the
spatial distribution of home and work locations were estimated based on the socio-
demographic data, available as aggregated values at the municipality level, building density
per area and the official addresses of registered companies. Since the municipalities are too
big to provide a sufficiently fine resolution of home and work locations, they are further
divided into 200 x 200 m rectangular cells. At this resolution, the home and work locations
can be found and overlaid over the road network, as presented in Figure 1 for the case study
of Croatia.
Figure 1 Network of Croatia's main roads coupled with the detailed road network in the four
biggest cities overlaid with the facilities presenting agent's home and work activity locations.
Aggregated values for population and number of households for city municipalities can be
found at the official web pages of each city [39], [40], [41] and [42] and boundaries of each
city municipalities can be found as polygon data from Google Earth [43].
The buildings density per area is estimated from the percentage of each cell area covered by
the building polygons, divided by the total area of the cell. Buildings polygon data are taken
from the Geofabrik online database [44]. The addresses of companies are extracted from the
Croatian Chamber of Economy (CoE) [45].
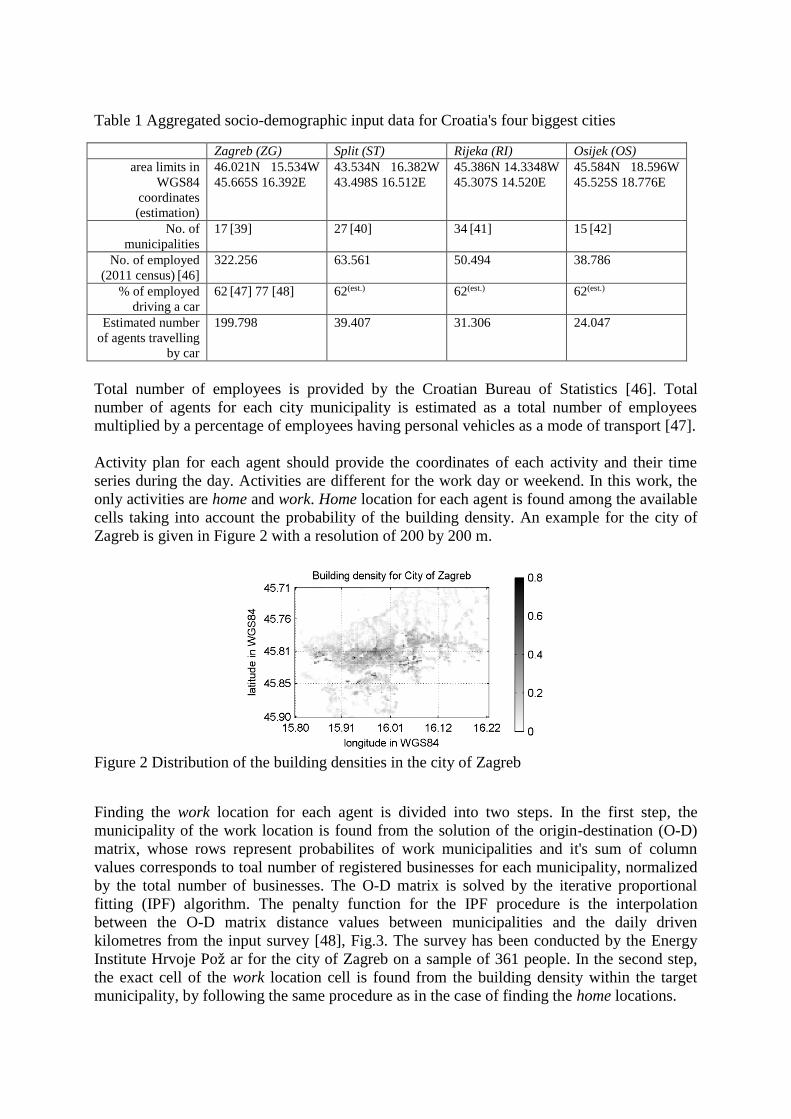
Table 1 Aggregated socio-demographic input data for Croatia's four biggest cities
Zagreb (ZG) Split (ST) Rijeka (RI) Osijek (OS)
area limits in
WGS84
coordinates
(estimation)
46.021N 15.534W
45.665S 16.392E
43.534N 16.382W
43.498S 16.512E
45.386N 14.3348W
45.307S 14.520E
45.584N 18.596W
45.525S 18.776E
No. of
municipalities
17 [39] 27 [40] 34 [41] 15 [42]
No. of employed
(2011 census) [46]
322.256 63.561 50.494 38.786
% of employed
driving a car
62 [47] 77 [48] 62(est.) 62(est.) 62(est.)
Estimated number
of agents travelling
by car
199.798 39.407 31.306 24.047
Total number of employees is provided by the Croatian Bureau of Statistics [46]. Total
number of agents for each city municipality is estimated as a total number of employees
multiplied by a percentage of employees having personal vehicles as a mode of transport [47].
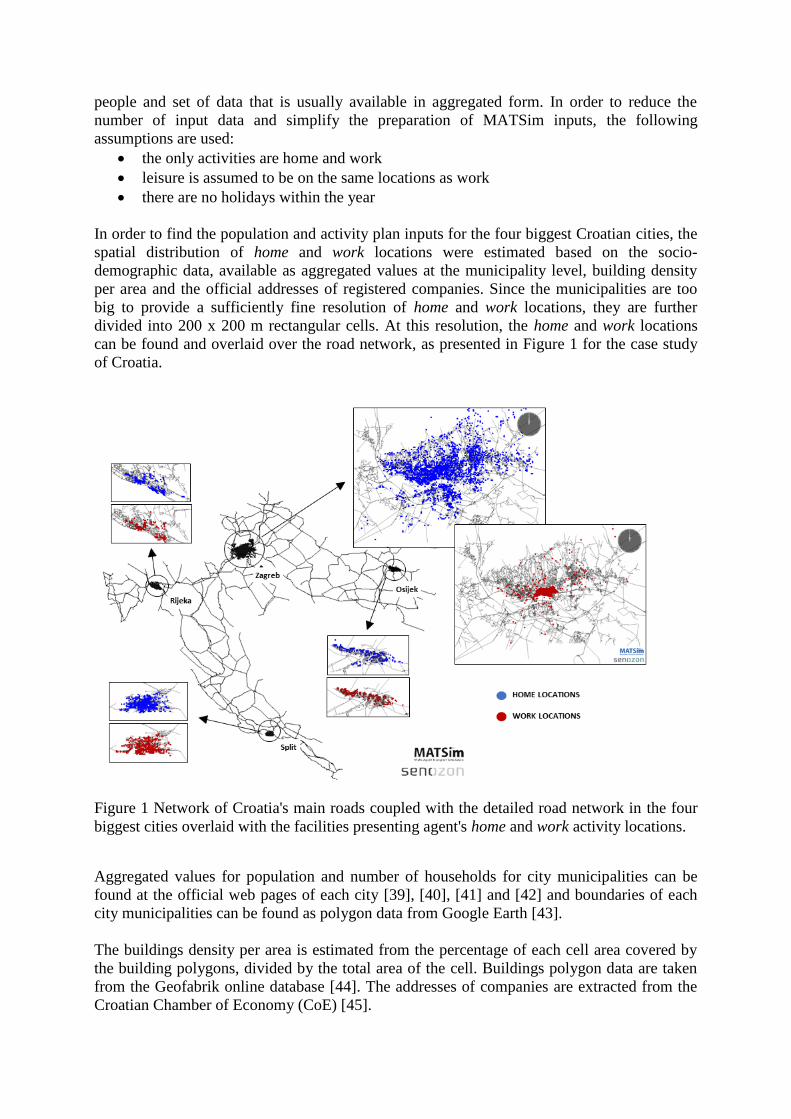
Activity plan for each agent should provide the coordinates of each activity and their time
series during the day. Activities are different for the work day or weekend. In this work, the
only activities are home and work. Home location for each agent is found among the available
cells taking into account the probability of the building density. An example for the city of
Zagreb is given in Figure 2 with a resolution of 200 by 200 m.
Figure 2 Distribution of the building densities in the city of Zagreb
Finding the work location for each agent is divided into two steps. In the first step, the
municipality of the work location is found from the solution of the origin-destination (O-D)
matrix, whose rows represent probabilites of work municipalities and it's sum of column
values corresponds to toal number of registered businesses for each municipality, normalized
by the total number of businesses. The O-D matrix is solved by the iterative proportional
fitting (IPF) algorithm. The penalty function for the IPF procedure is the interpolation
between the O-D matrix distance values between municipalities and the daily driven
kilometres from the input survey [48], Fig.3. The survey has been conducted by the Energy
Institute Hrvoje Pož ar for the city of Zagreb on a sample of 361 people. In the second step,
the exact cell of the work location cell is found from the building density within the target
municipality, by following the same procedure as in the case of finding the home locations.

Figure 3 average daily driven kilometres obtained from the survey (left) and the resulting O-D
matrix of the probabilities for work municipalities for the City of Zagreb (right)
From Figure 3 three municipalities can be recognized as municipalities with the most
registered businesses, which follows directly from the CoE inputs.
Time series are constructed from the assumption that departures from the home, work and
leisure/shopping locations follow a normal distribution. Typical distributions for the work day
and the weekend are presented in Figure 4.
Figure 4 Time series probabilities for activities home, work and leisure/shopping for work day
(left) and weekend (right)
MATSim utilizes the time series, O-D matrix and the developed transport network to generate
the agent’s behaviour and with that the hourly distribution curve. The difference between the
input time series and output distribution is presented in Figure 5.
Figure 5 Difference between the input time series and output distribution
The network is extracted from the OpenStreetMap data, region Europe, sub-region Croatia,
downloaded from the Geofabrik web server [44].
3.2. Modelling of Croatia’s energy system In order to analyse the impact EVs have on the grid a reference model of Croatia’s energy
system has been created in EnergyPLAN. As it has already been mentioned, EnergyPLAN
requires a wide variety of inputs. The fuel mix of the large thermal power plants as well as the
energy use of the individual sectors has been adopted form the International Energy Agencies
(IEA) web site [49]. The hourly electricity load has been taken from the web site of the
European Network of Transmission System Operators for Electricity [50]. Meteorological
data including global insolation and wind speeds have been taken from Meteonorm [51] and
used to calculate the hourly production from wind power and PV. The obtained annual figures
were then compared with the data available on the IEA website [49]. These data is presented
below in Table 2. The installed capacities of the installed power plants have been taken from
[1] and [52] and the statistical information related to the number of personal vehicles from
[53]. A minimal grid stabilization share, the minimum production of electricity from power
plants capable of providing ancillary services in relation to the total production of electricity,
has been set to 30% in all scenarios. The minimal capacity of thermal power plants (PP min)
of 42% has been assumed. The technical regulation strategy number 2 has been used
“Balancing both heat and power demands”. The impact of different optimisation criteria on
energy systems has been discussed in [54] in great detail. The CO2 content of the different
fuels has been taken from [33].
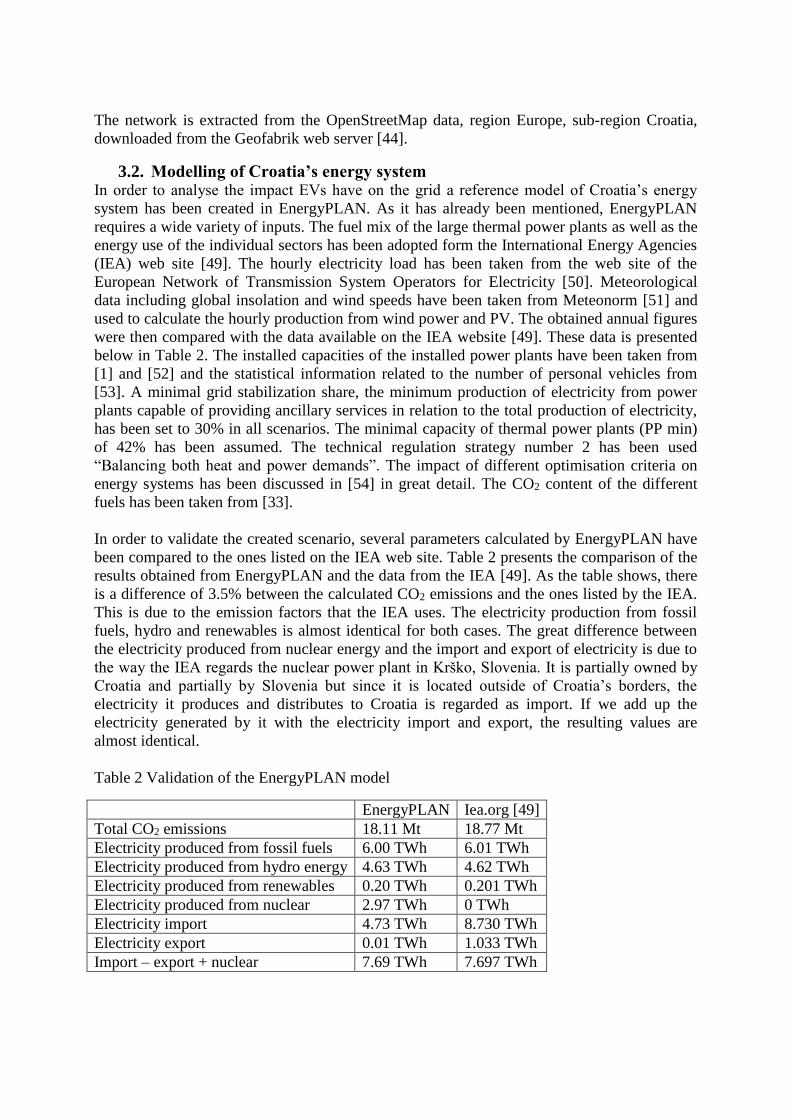
In order to validate the created scenario, several parameters calculated by EnergyPLAN have
been compared to the ones listed on the IEA web site. Table 2 presents the comparison of the
results obtained from EnergyPLAN and the data from the IEA [49]. As the table shows, there
is a difference of 3.5% between the calculated CO2 emissions and the ones listed by the IEA.
This is due to the emission factors that the IEA uses. The electricity production from fossil
fuels, hydro and renewables is almost identical for both cases. The great difference between
the electricity produced from nuclear energy and the import and export of electricity is due to
the way the IEA regards the nuclear power plant in Krško, Slovenia. It is partially owned by
Croatia and partially by Slovenia but since it is located outside of Croatia’s borders, the
electricity it produces and distributes to Croatia is regarded as import. If we add up the
electricity generated by it with the electricity import and export, the resulting values are
almost identical.
Table 2 Validation of the EnergyPLAN model
EnergyPLAN Iea.org [49]
Total CO2 emissions 18.11 Mt 18.77 Mt
Electricity produced from fossil fuels 6.00 TWh 6.01 TWh
Electricity produced from hydro energy 4.63 TWh 4.62 TWh
Electricity produced from renewables 0.20 TWh 0.201 TWh
Electricity produced from nuclear 2.97 TWh 0 TWh
Electricity import 4.73 TWh 8.730 TWh
Electricity export 0.01 TWh 1.033 TWh
Import – export + nuclear 7.69 TWh 7.697 TWh
4. Results
4.1. MATSim results
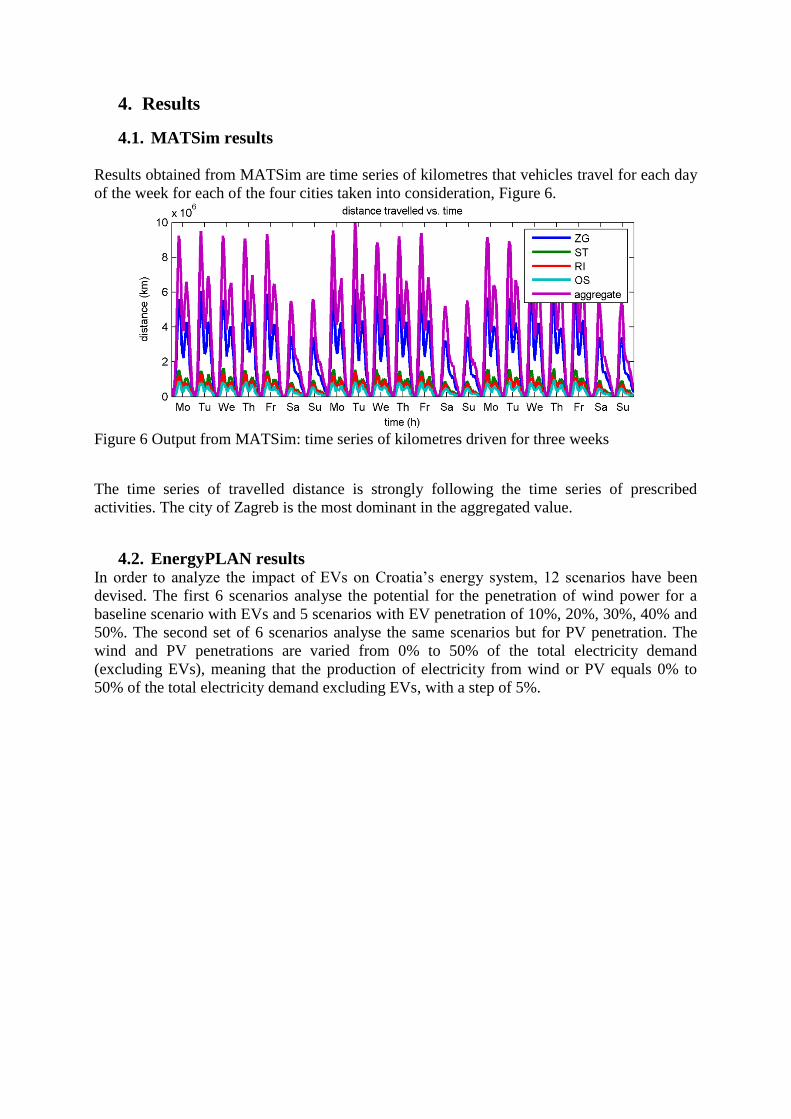
Results obtained from MATSim are time series of kilometres that vehicles travel for each day
of the week for each of the four cities taken into consideration, Figure 6.
Figure 6 Output from MATSim: time series of kilometres driven for three weeks
The time series of travelled distance is strongly following the time series of prescribed
activities. The city of Zagreb is the most dominant in the aggregated value.
4.2. EnergyPLAN results In order to analyze the impact of EVs on Croatia’s energy system, 12 scenarios have been
devised. The first 6 scenarios analyse the potential for the penetration of wind power for a
baseline scenario with EVs and 5 scenarios with EV penetration of 10%, 20%, 30%, 40% and
50%. The second set of 6 scenarios analyse the same scenarios but for PV penetration. The
wind and PV penetrations are varied from 0% to 50% of the total electricity demand
(excluding EVs), meaning that the production of electricity from wind or PV equals 0% to
50% of the total electricity demand excluding EVs, with a step of 5%.
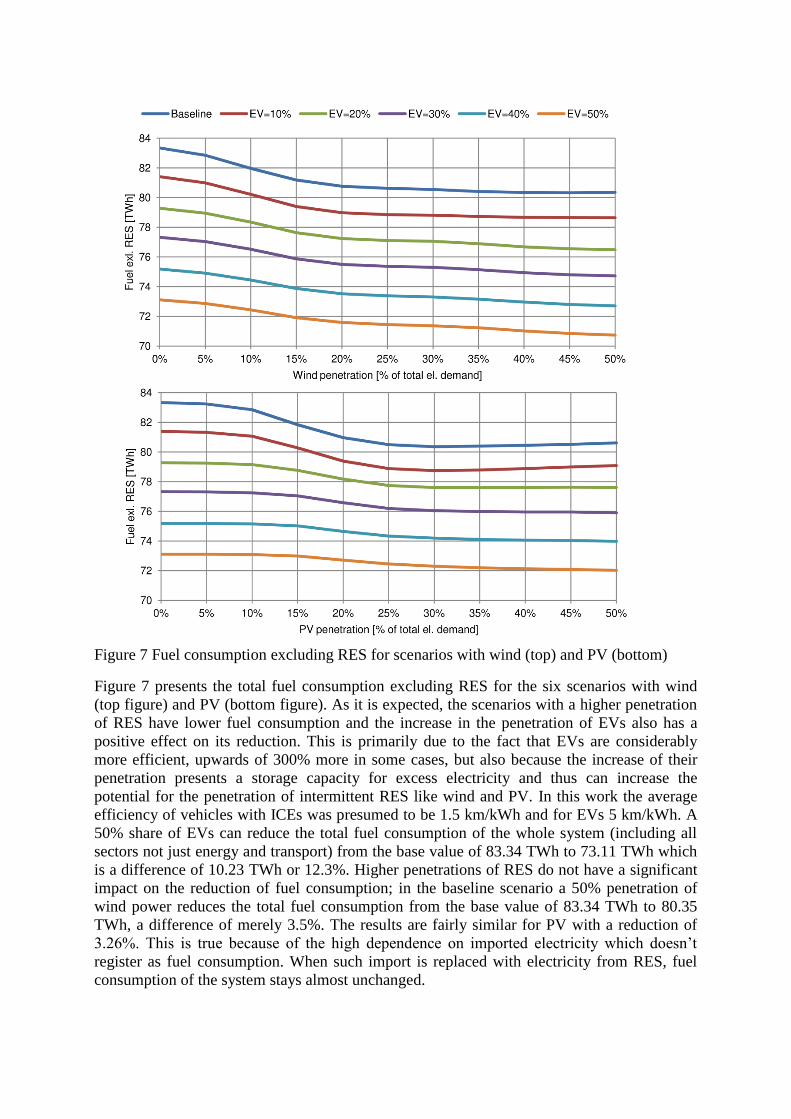
Figure 7 Fuel consumption excluding RES for scenarios with wind (top) and PV (bottom)
Figure 7 presents the total fuel consumption excluding RES for the six scenarios with wind
(top figure) and PV (bottom figure). As it is expected, the scenarios with a higher penetration
of RES have lower fuel consumption and the increase in the penetration of EVs also has a
positive effect on its reduction. This is primarily due to the fact that EVs are considerably
more efficient, upwards of 300% more in some cases, but also because the increase of their
penetration presents a storage capacity for excess electricity and thus can increase the
potential for the penetration of intermittent RES like wind and PV. In this work the average
efficiency of vehicles with ICEs was presumed to be 1.5 km/kWh and for EVs 5 km/kWh. A
50% share of EVs can reduce the total fuel consumption of the whole system (including all
sectors not just energy and transport) from the base value of 83.34 TWh to 73.11 TWh which
is a difference of 10.23 TWh or 12.3%. Higher penetrations of RES do not have a significant
impact on the reduction of fuel consumption; in the baseline scenario a 50% penetration of
wind power reduces the total fuel consumption from the base value of 83.34 TWh to 80.35
TWh, a difference of merely 3.5%. The results are fairly similar for PV with a reduction of
3.26%. This is true because of the high dependence on imported electricity which doesn’t
register as fuel consumption. When such import is replaced with electricity from RES, fuel
consumption of the system stays almost unchanged.
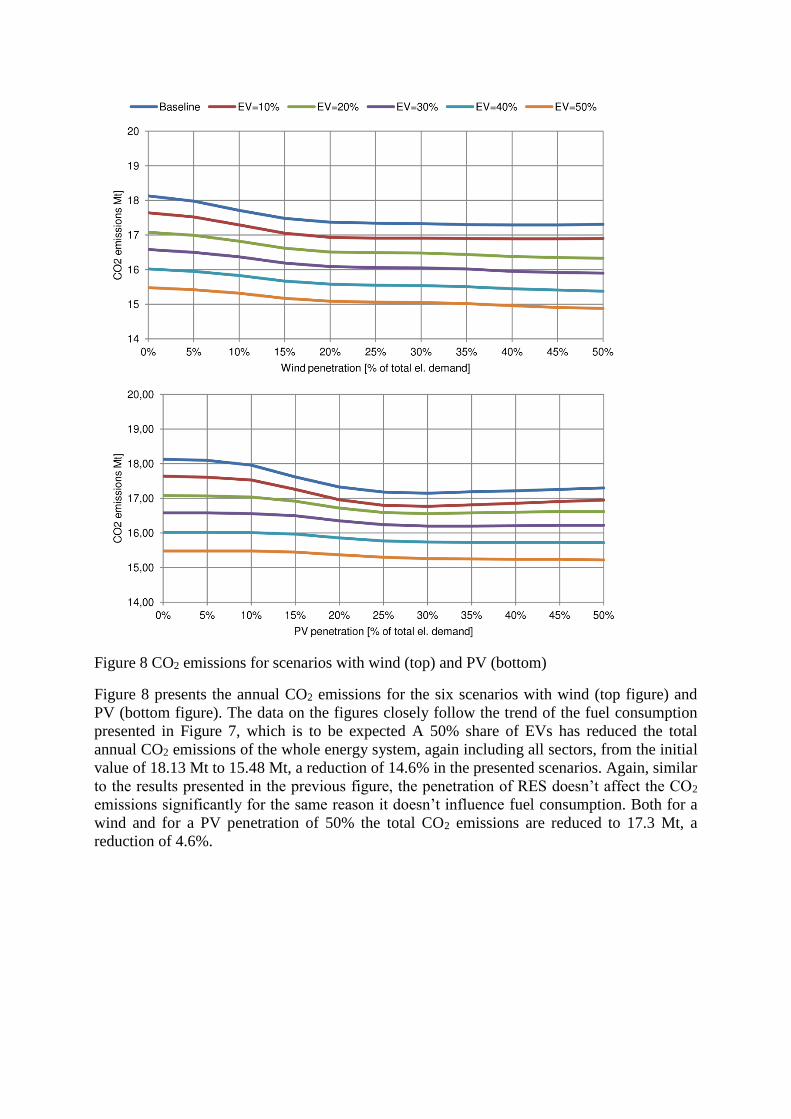
Figure 8 CO2 emissions for scenarios with wind (top) and PV (bottom)
Figure 8 presents the annual CO2 emissions for the six scenarios with wind (top figure) and
PV (bottom figure). The data on the figures closely follow the trend of the fuel consumption
presented in Figure 7, which is to be expected A 50% share of EVs has reduced the total
annual CO2 emissions of the whole energy system, again including all sectors, from the initial
value of 18.13 Mt to 15.48 Mt, a reduction of 14.6% in the presented scenarios. Again, similar
to the results presented in the previous figure, the penetration of RES doesn’t affect the CO2
emissions significantly for the same reason it doesn’t influence fuel consumption. Both for a
wind and for a PV penetration of 50% the total CO2 emissions are reduced to 17.3 Mt, a
reduction of 4.6%.

Figure 9 Export of electricity for scenarios with wind (top) and PV (bottom)
Figure 9 presents the total annual export of electricity, again for the scenarios with wind (top
figure) and PV (bottom figure). It can be observed from the figures that a penetration of wind
higher than 10% or PV higher than 15% will force the system to export some electricity. In
the case of the scenarios that include wind power, its penetration of 15% with no EVs resulted
in the export of 0.27 TWh, or 0.12 TWh for an EV share of 50%. In the case of a 50% wind
power penetration the figures go up to 5.73 TWh with no EVs and 4.92 TWh with an EV
share of 50%. The results are similar for the scenarios with PV, although the export is
somewhat reduced. For the case of a PV penetration of 15% and no EVs, the electricity export
equals 0.05 TWh. There is no export present in the same case but with a 50% share of EVs.
For a PV penetration of 50% and no EVs, the electricity export equals 5.15 TWh and 4.16
TWh for an EV share of 50%. The difference in the exported electricity for a scenario with
50% wind penetration with no EVs and with 50% EVs is 0.81 TWh or roughly 4.4% of the
total electricity demand, excluding EVs, of Croatia in the year 2011. In the case of PV the
same difference is 0.99 TWh or roughly 5.3% of the total electricity demand excluding EVs.
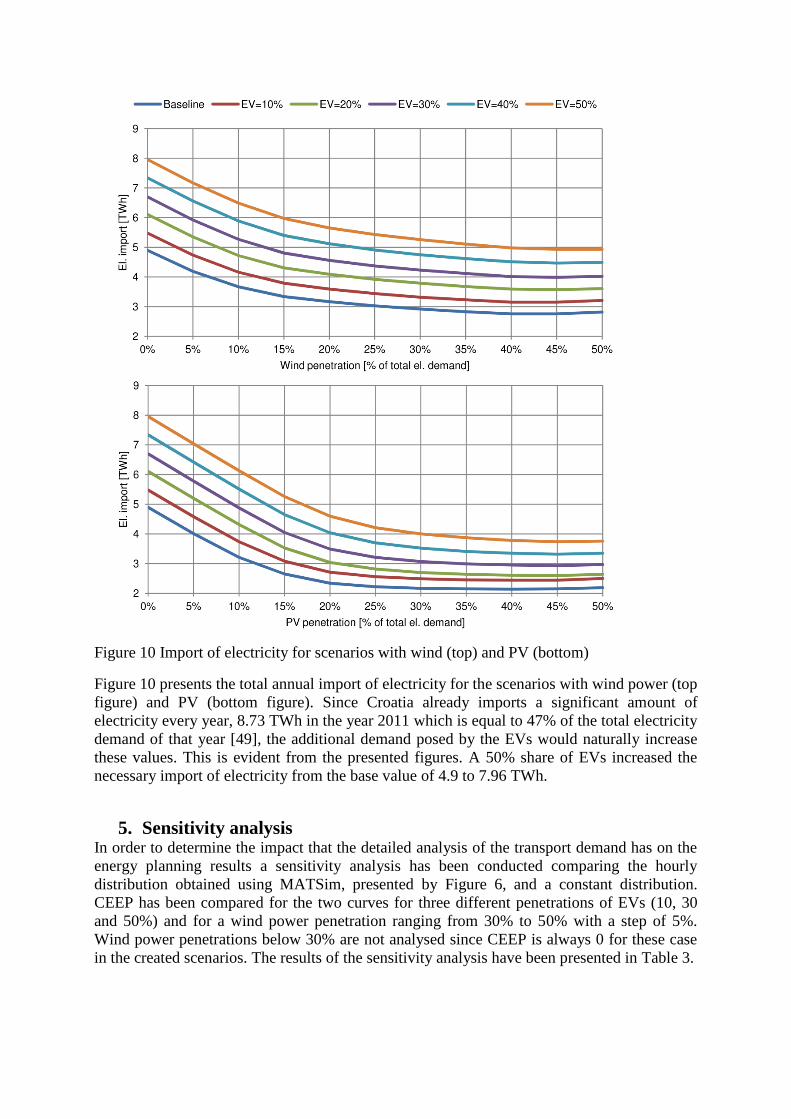
Figure 10 Import of electricity for scenarios with wind (top) and PV (bottom)
Figure 10 presents the total annual import of electricity for the scenarios with wind power (top
figure) and PV (bottom figure). Since Croatia already imports a significant amount of
electricity every year, 8.73 TWh in the year 2011 which is equal to 47% of the total electricity
demand of that year [49], the additional demand posed by the EVs would naturally increase
these values. This is evident from the presented figures. A 50% share of EVs increased the
necessary import of electricity from the base value of 4.9 to 7.96 TWh.
5. Sensitivity analysis In order to determine the impact that the detailed analysis of the transport demand has on the
energy planning results a sensitivity analysis has been conducted comparing the hourly
distribution obtained using MATSim, presented by Figure 6, and a constant distribution.
CEEP has been compared for the two curves for three different penetrations of EVs (10, 30
and 50%) and for a wind power penetration ranging from 30% to 50% with a step of 5%.
Wind power penetrations below 30% are not analysed since CEEP is always 0 for these case
in the created scenarios. The results of the sensitivity analysis have been presented in Table 3.
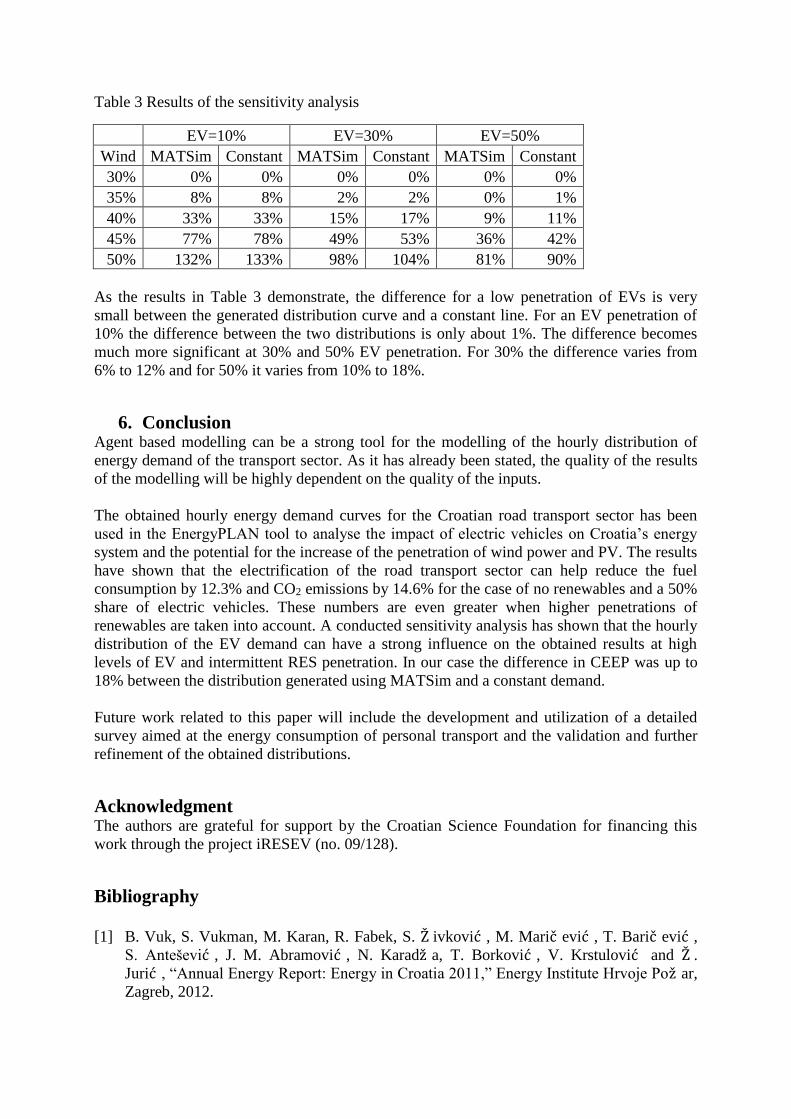
Table 3 Results of the sensitivity analysis
EV=10% EV=30% EV=50%
Wind MATSim Constant MATSim Constant MATSim Constant
30% 0% 0% 0% 0% 0% 0%
35% 8% 8% 2% 2% 0% 1%
40% 33% 33% 15% 17% 9% 11%
45% 77% 78% 49% 53% 36% 42%
50% 132% 133% 98% 104% 81% 90%
As the results in Table 3 demonstrate, the difference for a low penetration of EVs is very
small between the generated distribution curve and a constant line. For an EV penetration of
10% the difference between the two distributions is only about 1%. The difference becomes
much more significant at 30% and 50% EV penetration. For 30% the difference varies from
6% to 12% and for 50% it varies from 10% to 18%.
6. Conclusion Agent based modelling can be a strong tool for the modelling of the hourly distribution of
energy demand of the transport sector. As it has already been stated, the quality of the results
of the modelling will be highly dependent on the quality of the inputs.
The obtained hourly energy demand curves for the Croatian road transport sector has been
used in the EnergyPLAN tool to analyse the impact of electric vehicles on Croatia’s energy
system and the potential for the increase of the penetration of wind power and PV. The results
have shown that the electrification of the road transport sector can help reduce the fuel
consumption by 12.3% and CO2 emissions by 14.6% for the case of no renewables and a 50%
share of electric vehicles. These numbers are even greater when higher penetrations of
renewables are taken into account. A conducted sensitivity analysis has shown that the hourly
distribution of the EV demand can have a strong influence on the obtained results at high
levels of EV and intermittent RES penetration. In our case the difference in CEEP was up to
18% between the distribution generated using MATSim and a constant demand.
Future work related to this paper will include the development and utilization of a detailed
survey aimed at the energy consumption of personal transport and the validation and further
refinement of the obtained distributions.
Acknowledgment The authors are grateful for support by the Croatian Science Foundation for financing this
work through the project iRESEV (no. 09/128).
Bibliography
[1] B. Vuk, S. Vukman, M. Karan, R. Fabek, S. Ž ivković , M. Marič ević , T. Barič ević ,
S. Antešević , J. M. Abramović , N. Karadž a, T. Borković , V. Krstulović and Ž .
Jurić , “Annual Energy Report: Energy in Croatia 2011,” Energy Institute Hrvoje Pož ar,
Zagreb, 2012.

[2] T. Pukšec, G. Krajač ić , Z. Lulić , B. V. Mathiesen and N. Duić , “Forecasting long-
term energy demand of Croatian transport sector,” Energy, vol. 57, pp. 169-176, 2013.
[3] M. Sorrentino, G. Rizzo and L. Sorrentino, “A study aimed at assessing the potential
impact of vehicle electrification on grid infrastructure and road-traffic green house
emissions,” Applied Energy, vol. 120, pp. 31-40, 2014.
[4] M. Sugiyama, “Climate change mitigation and electrification,” Energy Policy, vol. 44,
pp. 464-468, 2012.
[5] O. Bahn, M. Marcy, K. Vaillancourt and J.-P. Waaub, “Electrification of the Canadian
road transportation sector: A 2050 outlook with TIMES-Canada,” Energy Policy, vol. 62,
pp. 593-606, 2013.
[6] R. Segurado, G. Krajač ić , N. Duić and L. Alves, “Increasing the penetration of
renewable energy resources in S. Vicente, Cape Verde,” Applied Energy, vol. 88, pp.
466-472, 2011.
[7] G. Krajač ić , N. Duić , Z. Zmijarević , B. V. Mathiesen, A. A. Vuč inić and M. d. G.
Carvalho, “Planning for a 100% independent energy system based on smart energy
storage for integration of renewables and CO2 emissions reduction,” Applied Thermal
Engineering, vol. 31, pp. 2073-2083, 2011.
[8] D. Connolly, H. Lund, B. Mathiesen, E. Pican and M. Leahy, “The technical and
economic implications of integrating fl uctuating renewable energy using energy
storage,” Renewable Energy, vol. 43, pp. 47-60, 2013.
[9] Z. WooGeem, “Transport energy demand modeling of South Korea usinga rtificial neural
network,” Energy Policy, vol. 39, p. 4644–4650, 2011.
[10] M. Zhang, H. Mu, G. Li and Y. Ning, “Forecasting the transport energy demand based on
PLSR method in China,” Energy, vol. 34, p. 1396–1400, 2009.
[11] J. Anable, C. Brand, M. Tran and N. Eyre, “Modelling transport energy demand: A
socio-technical approach,” Energy Policy, vol. 41, pp. 125-138, 2012.
[12] M. Wooldridge, An Introduction to MultiAgent Systems, London: John Wiley & Sons,
2009.
[13] S. Russell and P. Norvig, Artificial Intelligence: A Modern Approach, New Jersey:
Upper Saddle River, 2009.
[14] L. Tesfatsion and K. Judd, “Agent-Based Computational Economics: A Constructive
Approach to Economic Theory,” in Handbook of Computational Economics, 2006, p.
831–880.
[15] R. Axelrod and L. Tesfatsion, “On-Line Guide for Newcomers to Agent-Based Modeling
in the Social Sciences,” 2014. [Online]. Available:
www2.econ.iastate.edu/tesfatsi/abmread.htm. [Accessed 02 December 2014].
[16] M. Dorigo, “Swarm Intelligence,” 2014. [Online]. Available:
http://www.springer.com/computer/ai/journal/11721.
[17] MATSim, “Agent-Based Transport Simulations|MATSim,” 2012. [Online]. Available:
http://www.matsim.org/. [Accessed 16 November 2013].
[18] EnergyPLAN, “EnergyPLAN|Advanced Energy Systems Analysis Tool,” Department of
Development and Planning, Aalborg University, [Online]. Available:
http://www.energyplan.eu/. [Accessed 21 October 2013].
[19] J. Holmgren, P. Davidsson, J. A. Persson and L. Ramstedt, “TAPAS: A multi-agent-
based model for simulation of transport chains,” Simulation Modelling Practice and
Theory, vol. 23, pp. 1-18, 2012.
[20] P. Davidsson, L. Henesey, L. Ramstedt, J. Törnquist and F. Wernstedt, “An analysis of
agent-based approaches to transport logistics,” Transportation Research Part C:
Emerging Technologies, vol. 13, no. 4, p. 255–271, 2005.
[21] H. Dia, “An agent-based approach to modelling driver route choice behaviour under the
influence of real-time information,” Transportation Research Part C: Emerging
Technologies, vol. 10, no. 5-6, pp. 331-349, 2002.
[22] LANL, “FastTrans: Transportation Simulator,” 2014. [Online]. Available:
http://www.lanl.gov/programs/nisac/fasttrans.shtml. [Accessed 8 January 2014].
[23] MAINSIM, “MAINSIM – MultiModal Intercity Street Traffic Simulator,” [Online].
Available: http://www.mainsim.de/?lang=en. [Accessed 8 January 2014].
[24] COS-SIM. [Online]. Available: https://code.google.com/p/cos-sim/. [Accessed 6 January
2014].
[25] M. Hatzopoulou, J. Y. Hao and E. J. Miller, “Simulating the impacts of household travel
on greenhouse gas emissions, urban air quality, and population exposure,”
Transportation, vol. 38, p. 871–887, 2011.
[26] M. Maciejewski and K. Nagel, “Simulation and optimization of taxi services in
MATSim,” in VSP Working Paper, Berlin, 2013.
[27] J. W. Joubert, P. J. Fourie and K. W. Axhausen, “Large-Scale Agent-Based Combined
Traffic Simulation of Private Cars and Commercial Vehicles,” Transportation Research
Record, vol. 2168, pp. 24-32, 2010.
[28] W. Gao, M. Balmer and E. J. Miller, “Comparisons between MATSim and EMME/2 on
the Greater Toronto and Hamilton Area Network,” Journal of the Transportation
Research Board, vol. 2197, pp. 118-128, 2010.
[29] B. Ć osić , G. Krajač ić and N. Duić , “A 100% renewable energy system in the year
2050: The case of Macedonia,” Energy, vol. 48, no. 1, pp. 80-87, 2012.
[30] W. Liu, H. Lund and B. V. Mathiesen, “Large-scale integration of wind power into the
existing Chinese energy system,” Energy, vol. 36, no. 8, p. 4753–4760, 2011.
[31] H. Lund, “Large-scale integration of optimal combinations of PV, wind and wave power
into the electricity supply,” Renewable Energy, no. 31, pp. 503-515, 2006.
[32] H. Lund and E. Munster, “Modelling of energy systems with a high percentage of CHP
and wind power,” Renewable Energy, vol. 28, no. 14, pp. 2197-2193, 2003.
[33] B. Ć osić , N. Markovska, G. Krajač ić , V. Taseska and N. Duić , “Environmental and
economic aspects of higher RES penetration into Macedonian power system,” Applied
Thermal Engineering, vol. 43, pp. 158-162, 2012.
[34] H. Lund and B. V. Mathiesen, “Energy system analysis of 100% renewable energy
systems—The case of Denmark in years 2030 and 2050,” Energy, vol. 34, no. 5, pp. 524-
531, 2009.
[35] G. Krajač ić , N. Duić , Z. Zmijarević , B. V. Mathiesen, A. A. Vuč inić and M. G.
Carvalho, “Planning for a 100% independent energy system based on smart energy
storage for integration of renewables and CO2 emissions reduction,” Applied Thermal
Engineerin, vol. 31, no. 13, pp. 2073-2083, 2011.
[36] “H2RES Model,” [Online]. Available: http://powerlab.fsb.hr/h2res/. [Accessed 12
February 12].
[37] H. Lund and W. Kempton, “Integration of renewable energy into the transport and
electricity sectors through V2G,” Energy Policy, vol. 36, no. 9, p. 3578–3587, 2008.
[38] M. Munster and H. Lund, “Use of waste for heat, electricity and transport — Challenges
when performing energy system analysis,” Energy, no. 34, pp. 636-644, 2009.
[39] “City of Zagreb official pages,” [Online]. Available:
http://www.zagreb.hr/default.aspx?id=12915. [Accessed 01 05 2014].
[40] “City of Split official pages,” [Online]. Available:
http://www.split.hr/Default.aspx?sec=376. [Accessed 01 05 2014].
[41] “City of Rijeka official pages,” [Online]. Available: http://www.rijeka.hr/mo. [Accessed
01 05 2014].
[42] “City of Osijek official pages,” [Online]. Available:
http://www.osijek.hr/index.php/cro/Mjesna-samouprava/Mjesni-odbori-i-gradske-cetvrti.
[Accessed 01 05 2014].
[43] “Google Earth official,” [Online]. Available: http://www.google.com/earth/. [Accessed
01 05 2014].
[44] “Geofabrik OpenStreetMap data (Europe),” [Online]. Available:
http://download.geofabrik.de/europe.html. [Accessed 01 05 2014].
[45] “Croatian Chamber of Economy official pages,” [Online]. Available: http://www.hgk.hr/.
[Accessed 02 05 2014].
[46] "Croatian Bureau of Statistics," [Online]. Available: http://www.dzs.hr/. [Accessed 01 05
2013].
[47] F. Foundation for the Automobile and Society, “The Automobile and Society”.
[48] “Strategija razvoja energetske infrastrukture za napajanje električ nih vozila na područ ju
Grada Zagreba,” EIHP, Zagreb, 2013.
[49] IEA, “International Energy Agency,” 2013. [Online]. Available: www.iea.org. [Accessed
8 January 2013].
[50] ENTSO-E, “European Network of Transmission System Operators for Electricity,” 2013.
[Online]. Available: https://www.entsoe.eu/. [Accessed 16 December 2013].
[51] meteonorm, “Meteonorm,” 2013. [Online]. Available: meteonorm.com. [Accessed 6
January 2014].
[52] HEP, “HEP Group,” [Online]. Available:
http://www.hep.hr/hep/publikacije/godisnje/2011godisnje.pdf. [Accessed 16 December
2013].
[53] DZS, “Statistical Yearbook of the Republic of Croatia,” Croatian Bureau of Statistics,
Zagreb, 2012.
[54] P. A. Østergaard, “Reviewing optimisation criteria for energy systems analyses of
renewable energy integration,” Energy, vol. 34, no. 9, p. 1236–1245, 2009.