agenda-summer2010 (1)
TRANSCRIPT

8/7/2019 Agenda-Summer2010 (1)
http://slidepdf.com/reader/full/agenda-summer2010-1 1/42
Cool designEngineering in
one o the
harshest climatesin the world
The technical journal or AECOMglobal Building Engineerin
Summer 2010
Tuning in ttall buildinMotion solutions ohigh rise projects
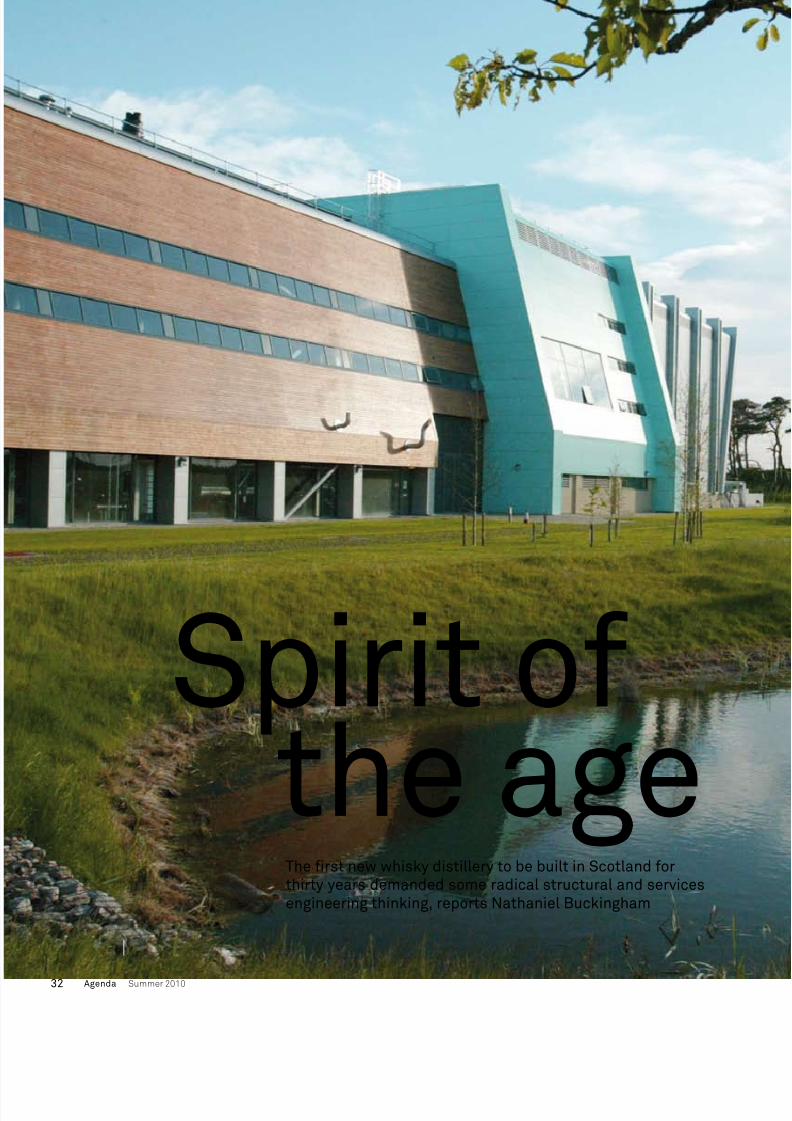
Spirit othe ageDesigning the largeand greenest whiskdistillery in Scotlan
or 30 years
SnowbusinessEngineeringAntarctic style
8/7/2019 Agenda-Summer2010 (1)
http://slidepdf.com/reader/full/agenda-summer2010-1 2/42
uildings are about creating structures andspaces in which people can successully
work and live. Achieving this in a sustainable wayis an increasingly complex process.
As scientists and engineers, our initialthinking involves issues that go wellbeyond concrete, glass and steel. Howwill climate change aect the proposed
structure? How will the structure aectclimate change?
As climate change comes increasinglyto the ore, Mei Ren explains how aunique new planning tool is enablingmasterplanners to develop accurate andmeaningul designs or urban
landscapes.Two essays look at the challenges o
designing or extreme environments: Rob
Murphy illustrates how a new parametricdesign process minimises the solar gainon a new tower in the sweltering heat othe Abu Dhabi Desert, whilst at the other
climatic extreme Michael Wright andPeter Ayres show how some cutting edgesnow-modelling analysis and dramaticpractical testing enabled AECOM’s teamto design a new scientic researchstation capable o withstanding extremeAntarctic conditions.
Extreme winds bring their ownchallenges – especially in Hong Kong.
David Lee and Kong Loi Wong describethe application o state o the artsolutions to motion problems in tall
buildings. Nathaniel Buckinghamdiscusses the issues involved in
designing the rst large-scale whiskydistillery to be built in Scotland or 30years, and explains how its carbonootprint was cut largely by harnessingbiomass produced by the process.Within North America, John Munroe andStean Holst report on the aspiration or
the net zero carbon development oCalgary Airport.
Healthcare environments in particularneed special ocus. AECOM’s designs ora displacement ventilation system or an
Australian hospital leads the way inassisting the management o inection
transmission.In our nal discussion, Ant Wilson and
Graham Fairley discuss how theincreasing complexities o modernaçade designs demand much tighterintegration between all o the
stakeholders involved.These essays illustrate how modern
building engineering techniques arebecoming ever more responsive to therapidly changing social, physical and
economic environment. The scale andcomplexity o the challenge is both
immense and hugely exciting.
Ken DaltonChie Executive,Global Building Engineering
Foreword
2 Agenda Summer 2010

8/7/2019 Agenda-Summer2010 (1)
http://slidepdf.com/reader/full/agenda-summer2010-1 3/42
C ont ent s
2
36
28
16
4 University challenge Sasha Krstanovic explains the
sustainable engineering behind thenew Jubilee Campus extension at the
University o Nottingham
6 Fighting inection Materials and systems assist the
management o inection transmissionin an Australian hospital
10 Tuning in to tall buildings David Lee, Kong Loi Wong and Martin
Ng solve potential motion problems ortall buildings in Hong Kong
16 In search o net zero Can Calgary Airport expand without
increasing net energy consumption?John Munrow and Stean Holst reportrom Canada
24 Beyond planning Mei Ren on an innovative new tool or
sustainable masterplanning
28 Cool design Rob Murphy illustrates how computer
aided design is assisting in the
development o sustainable buildingsin the Middle East
32 Spirit o the age Nathaniel Buckingham describes the
complex engineering on the largestand greenest whisky distillery to be
built in Scotland or 30 years
36 Snow business Michael Wright and Peter Ayres
describe the analysis underpinning the
design o the new British Antarcticresearch station
40 Facing up to açades Graham Fairley and Ant Wilson discuss
the role o the açades specialist
24
32
4Editorial boardKen DaltonSteve HodkinsonPeter Ayres
Garry PalmerHelen Elias
Graphic designEllie MoserMatt Timmins
Summer 2010 Agenda

8/7/2019 Agenda-Summer2010 (1)
http://slidepdf.com/reader/full/agenda-summer2010-1 4/42
There are no conventional ossil uel powered boilers orchillers in these buildings. All heating and cooling isgenerated by the heat exchangers in the nearby lakewhich, in turn, is topped up by surace water run-o.Reversible heat pumps replace conventional boilersand chillers using the embodied energy o the lake.Highly ecient stainless steel heat exchangerssubmerged in the water can reject or absorb the heatwithin the lake providing all space heating and coolingand domestic hot water pre-heat.
The Gateway Building’s triple-heightentrance/reception atrium usesMonodraught SunCatchers (wind catcherventilators with centrally mounted1.5metre diameter sun pipes). These sunpipes provide natural day light without
contributing to solar heat gains or heatloss, can lead to signicant daytimeelectricity cost savings, whilst alsocooling the building during the night withminimal an energy consumption.
4 Agenda Summer 2010

8/7/2019 Agenda-Summer2010 (1)
http://slidepdf.com/reader/full/agenda-summer2010-1 5/42

8/7/2019 Agenda-Summer2010 (1)
http://slidepdf.com/reader/full/agenda-summer2010-1 6/42
Inection control is a paramount concern or hospitalsworldwide. AECOM experts in Australia designed the rstever displacement ventilation solution or a Melbournehospital, researching how materials and systems canassist management o inection transmission withinhealthcare environments.
Fightinginection
The Royal Women’s Hospital
(RWH) in Melbourne, Australia is a 160 bed specialist women’s andneonatal paediatric hospital, completed
in June 2008. The use o a single pass, 100per cent outside air, low level displacementventilation system to the ward rooms was
recognised as an exciting opportunity to applya new and innovative technology with positive
and tangible benets to patients and theiramilies, and hospital sta. It was recognised
that improved inection control, comortand indoor environment quality wouldenable the RWH to ull its vital role o
providing care to the women andbabies o Melbourne and the
state o Victoria.
6 Agenda Summer 2010
8/7/2019 Agenda-Summer2010 (1)
http://slidepdf.com/reader/full/agenda-summer2010-1 7/42
HOW IT WORKS
Displacement ventilation takesadvantage o naturally buoyant warmair. Low velocity tempered outside air(typically 19ºC in a Melbourne,Australia summer) is supplied to a roomat low level. As it gains heat rompeople, lighting and equipment, the airrises to a high level, where it isremoved rom the space. Thisventilation solution is commonlyapplied to commercial buildings.
Until now, application to hospital and
clinical environments has been limited.Signicant benets to a healthcareacility rom a single pass, low leveldisplacement ventilation systeminclude:
Improved inection control through•
the elimination o mixing o ltered,conditioned air with room air, bydisplacing and removing pollutantsrom the environmentReduced risk o cross inection•
between ward rooms by avoiding the
recycling o room airSatisying temperature and comort•
requirementsProviding a high level o amenity•
through increased outside airquantitiesDisplacement ventilation provides•
positive sustainability outcomesthrough reduced energyconsumption and improved indoorenvironment quality.
In Australian hospital design, anaccepted approach or the supply oair conditioning to ward areas hasbeen, traditionally, via overhead airdistribution systems, mixing
conditioned supply air with warm roomair to satisy comort requirements.
The Royal Women’s Hospital,
Melbourne redevelopment project gaveAECOM building engineers theopportunity to explore a displacementventilation air conditioning and ventilationsolution to the ward areas that providedenhanced inection control and satisedsustainability objectives through reducedenergy consumption and improved indoorenvironment quality.
Rigorous analysis o the proposeddisplacement ventilation solution,
including computational fuid dynamics(CFD) studies, prototype testing and postcompletion testing and analysis ensuredthat the system designed or the wardrooms at the redeveloped RWH wasappropriately robust, and veriedperormance post completion.
Concept planning andpreliminary analysis
The displacement ventilation at RWHincludes:• Fulloutsideairoperation
• Lowvelocitysupplyairductworkor
reduced an pressure and energyconsumption
•Heatreclaimsystemusedtopreheat
incoming air during winter operation.
Constraints and design criteriaidentied or detailed evaluation andtesting included:• Inectioncontrolandcarbondioxide
concentration• Temperatureandcomort
•Airspeedandcomort
•Minimumairchangerates
•Energyefciency•Capitalandrecurrentcosts
• Impactuponbuildingdesign
Summer 2010 Agenda
8/7/2019 Agenda-Summer2010 (1)
http://slidepdf.com/reader/full/agenda-summer2010-1 8/42
SUMMERsupply air temperature
19ºC
WINTERsupply air temperature:
21ºC
3000 2500 2000 1500 1000 500
CO2
ppm
1. Inection control and carbon dioxide concentration: Air pollutant contours (CO2)across a typical ward
25.0 24.5 24.0 23.5 23.0 22.5 22.0 21.5 21.0 20.5 20.0
T deg
2. Temperature comort: Detailed temperature contours across a typical ward
0.20 0.18 0.16 0.14 0.12 0.10 0.08 0.06 0.04 0.02 0.00
Speed
3. Airspeed and comort: Detailed air speed contours across a typical ward
CFD analysisAs a displacement ventilation solutionhad not previously been applied to ahealthcare setting in Australia,rigorous analysis was needed. A threedimensional computer model, usingCFD, was developed to predict andoptimise perormance.
The preliminary results o the CFDmodelling indicated:
Inection control and carbon1.dioxide concentration: Inectiontransmission via the airborne routeis related to concentration oairborne particulates. The CFD studyanalysed the concentration andmovement o airborne pollutants bysimulating the exhalation o carbondioxide rom the room occupants.The modelling results indicated thatthe majority o exhaled carbon
dioxide was displaced and drawndirectly upward without mixing withroom air, a signicant benet overtraditional systems.
Temperature comort:2. A signicantbenet o the displacementventilation system, which wasveried by the modelling, was that agreater temperature gradient couldbe permitted across the height o
the room whilst still maintainingacceptable temperature conditionswithin the occupied zone, oeringmeasurable energy savings.
Air speed and comort:3. The CFDresults indicated the highest airspeed to be at the supply air diuser
and as created by plumes o warmair, which gains heat rom peopleand equipment, beore risingupward.
The CFD modelling results providedcondence in the ability o the solutionto provide appropriate temperaturecontrol, air movement and improvedinection control, enabling the AECOMdesign team to proceed with urther,more detailed modelling and design.
8 Agenda Summer 2010
8/7/2019 Agenda-Summer2010 (1)
http://slidepdf.com/reader/full/agenda-summer2010-1 9/42
The post completion testingvalidated the perormance o thedisplacement ventilation solution
Prototype testingA working prototype was constructedand tested to provide urtherconidence in the perormance o thesystem. The prototype testingdetermined an optimal diuser height,over which the perormance o thediuser, regardless o the supply airquantity or velocity, becamecompromised.
Energy eiciency and minimum airchange rates improve energy eiciencywhen compared with a traditionalconstant volume solution. This beneitrom displacement ventilation isprimarily due to reduction in total luidhanding power (an power), resultingrom reduced supply o air quantity,reduced velocity and reduced pressuredrop across the supply air diuser.
Furthermore, high level internalloads such as lighting can be
conidently excluded when sizingcooling coils and, indeed, centralthermal plant.
The energy eiciency o the RWHdisplacement ventilation solution wasurther enhanced with a run-around-coil heat reclaim system, used topreheat the incoming outside air duringwinter operation.
Post completion verifcationPost completion testing o thedisplacement ventilation system wascarried out ollowing the completion o
construction and commissioning toveriy the operation o the system andevaluate the accuracy o the CFD modelin predicting perormance.
The post completion testing ocusedon the measurement o temperatureand air speed in the occupied zone asindicators o “comort”; as well astemperature measurements at speciicpoints within the space to veriy thetemperature gradient. Smoke testingenabled visualisation o air movementwithin the space.
Summer and winter operating
scenarios were simulated and testedusing artiicial thermal loads torepresent occupant loads.
Temperature measurements takenacross the height o the roomdemonstrated that:• Temperaturesmeasuredor
simulated winter conditions correlatedwith the CFD results, particularly in theoccupied zone
• Temperaturesmeasuredor
simulated summer conditions wereobserved to be marginally higher thanthe CFD results; however,temperatures in the occupied zoneremained within an acceptable range.
The measured air speed in theoccupied zone was observed to remainwithin acceptable limits and correlatedreasonably with perormance
predicted by the CFD analysis.
Summary o ndings and key lessonslearned:
The post completion testingvalidated the perormance o thedisplacement ventilation solution aspredicted by CFD analysis, and that theCFD analysis reasonably predicted theperormance o the system withrespect to temperature distribution, airspeed and air movement within thespace.The displacement ventilation solution
was ound to:• Assistintheimprovemento
inection control – by eectively
displacing and removing pollutantsrom the environment and by reducingthe risk o cross inection betweenward rooms by avoiding the recycling oroom air• Provideappropriatecomort
conditions – temperature and airspeed within the occupied zone werewithin accepted limits• Provideahighleveloamenity
– increased outside air quantitieswhen compared with traditional wardair conditioning solutions• Addresssustainabilityobjectives
– reduced energy consumption due tothe exclusion o high level internalloads (lighting, television, etc),reduction in total an power and theintegration o a heat reclaim system topreheat incoming outside air.
Summer 2010 Agenda

8/7/2019 Agenda-Summer2010 (1)
http://slidepdf.com/reader/full/agenda-summer2010-1 10/42
Tun
ing in to
tall building
s
The design o tall buildings has evolved rapidly in recentyears. Improvements in material strengths andadvanced design techniques have allowed lighter andmore slender structures to be designed. Oneconsequence o this evolution is that very tall buildingsare increasingly prone to potential motion problems
under wind and earthquake loading. This is particularlytrue in Hong Kong, where land or development is at apremium and a combination o high wind loads and veryslender high rise buildings means that control o motioncan be a critical limiting actor in the building design.By David Lee, Kong Loi Wong and Martin Ng.
Wind inducedmotion canoccur in two
principaldirections.Windward
response occurs in the directiono the wind low and is caused bythe luctuations in the windspeed, whilst across-windresponse occurs perpendicularto the wind direction due tovortex shedding around thebuilding. Generally, in terms othe dynamic response o thebuilding, the across-windresponse is more critical since
the requency o vortex sheddingcan harmonise with one o thebuildings natural periods omotion leading to mechanicalresonance. Once resonanceoccurs, the buildings can becomesubject to violent swayingleading to discomort tooccupants, damage to ixturesand ixings and in extreme cases,to structural ailure.
The traditional method opreventing excessive windinduced motion is to increase the
stiness o the building. Thisreduces the amplitude o motion,and reduces the likeliness oresonance since as the stinesso the building increases, so doesits natural requency, andthereore the wind speedrequired to cause resonanceincreases to a point where it isunlikely to occur. However, invery slender buildings, thepenalty or increasing the
stiness can be economicallyprohibitive in terms materialcosts and the loss o usable loor
area required accommodatinglarger stiening elements suchas cross walls and bracing.
A much more eicient way ocounteracting tall buildingmotion problems is to useauxiliary damping systems. Thereare many types o damping,including passive systems whichare tuned to the naturalrequency o the building so thatthey provide counteractinginertia orces under motion. Thedamper is designed so that its
motion is out o phase with thenatural requency o thestructure, leading to dissipationo the building vibration, andreductions in motion.
A Hong Kong case studyWhen AECOM was appointed orthe structural design o a new 39storey residential andcommercial building at Wanchai,Hong Kong, it soon becameapparent that the extremely highslenderness (height to width
ratio) o the building would giveunavourable dynamiccharacteristics. A wind tunnelstudy physically evaluated thepotential perormance o thestructure in the extreme windconditions. Experimental resultsdemonstrated that the proposedbuilding was at risk oexperiencing high accelerationlevels in strong winds.
10 Agenda Summer 2010

8/7/2019 Agenda-Summer2010 (1)
http://slidepdf.com/reader/full/agenda-summer2010-1 11/42
Once resonance occurs, buildingscan become subject to violent
swaying leading to discomort tooccupants, damage to ixtures and
ixings and in extreme casesstructural ailure
Summer 2010 Agenda 1
8/7/2019 Agenda-Summer2010 (1)
http://slidepdf.com/reader/full/agenda-summer2010-1 12/42
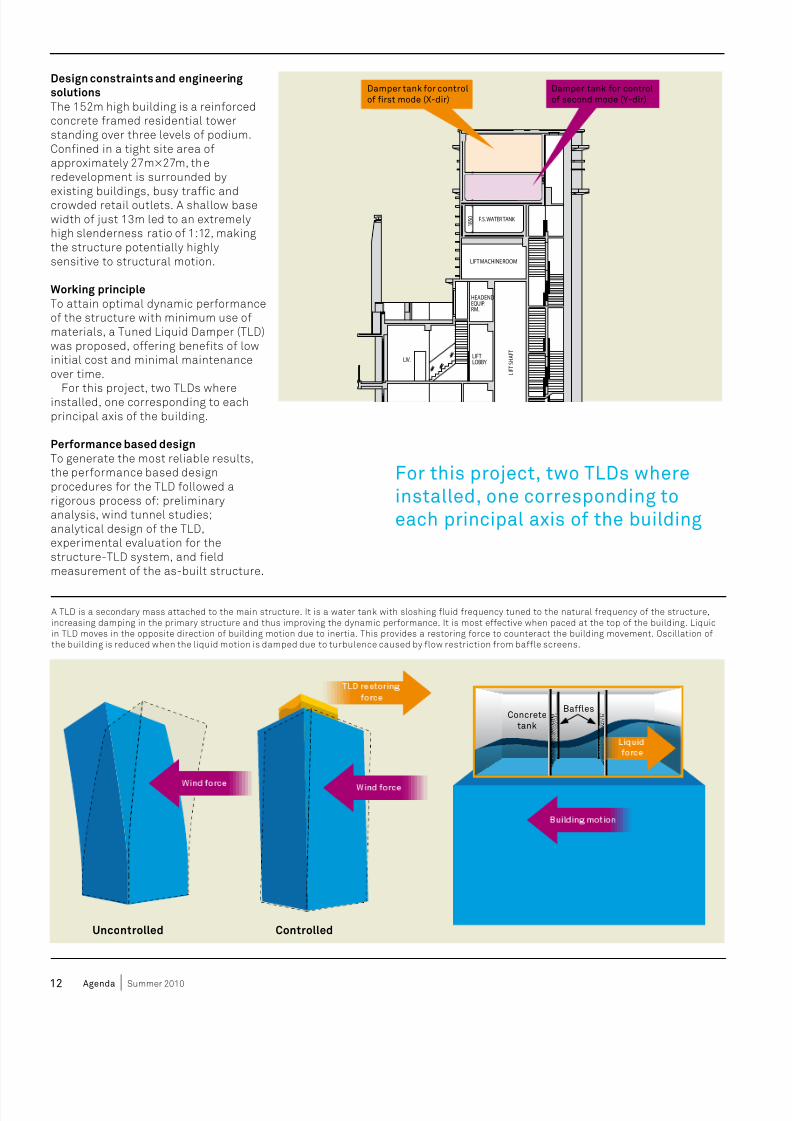
Design constraints and engineeringsolutionsThe 152m high building is a reinorcedconcrete ramed residential towerstanding over three levels o podium.Conined in a tight site area oapproximately 27m×27m, theredevelopment is surrounded by
existing buildings, busy traic andcrowded retail outlets. A shallow basewidth o just 13m led to an extremelyhigh slenderness ratio o 1:12, makingthe structure potentially highlysensitive to structural motion.
Working principleTo attain optimal dynamic perormanceo the structure with minimum use omaterials, a Tuned Liquid Damper (TLD)was proposed, oering beneits o lowinitial cost and minimal maintenanceover time.
For this project, two TLDs whereinstalled, one corresponding to eachprincipal axis o the building.
Perormance based designTo generate the most reliable results,the perormance based designprocedures or the TLD ollowed arigorous process o: preliminaryanalysis, wind tunnel studies;analytical design o the TLD,experimental evaluation or thestructure-TLD system, and ieldmeasurement o the as-built structure.
Concretetank
Bafes
Uncontrolled Controlled
1730
HEADENDEQUIP.RM.
LIFT MACHINE ROOM
LIV.LIFTLOBBY
F.S. WATER TANK
BOTTOM DAMPER TANK
LIFT SHAFT
1850
TOP DAMPER TANK 2600
Damper tank or controlo rst mode (X-dir)
Damper tank or controlo second mode (Y-dir)
For this project, two TLDs whereinstalled, one corresponding toeach principal axis o the building
A TLD is a secondary mass attached to the main structure. It is a water tank with sloshing luid requency tuned to the natural requency o the structure,increasing damping in the primary structure and thus improving the dynamic perormance. It is most eective when paced at the top o the building. Liquidin TLD moves in the opposite direction o building motion due to inertia. This provides a restoring orce to counteract the building movement. Oscillation othe building is reduced when the liquid motion is damped due to turbulence caused by low restriction rom bale screens.
12 Agenda Summer 2010
8/7/2019 Agenda-Summer2010 (1)
http://slidepdf.com/reader/full/agenda-summer2010-1 13/42
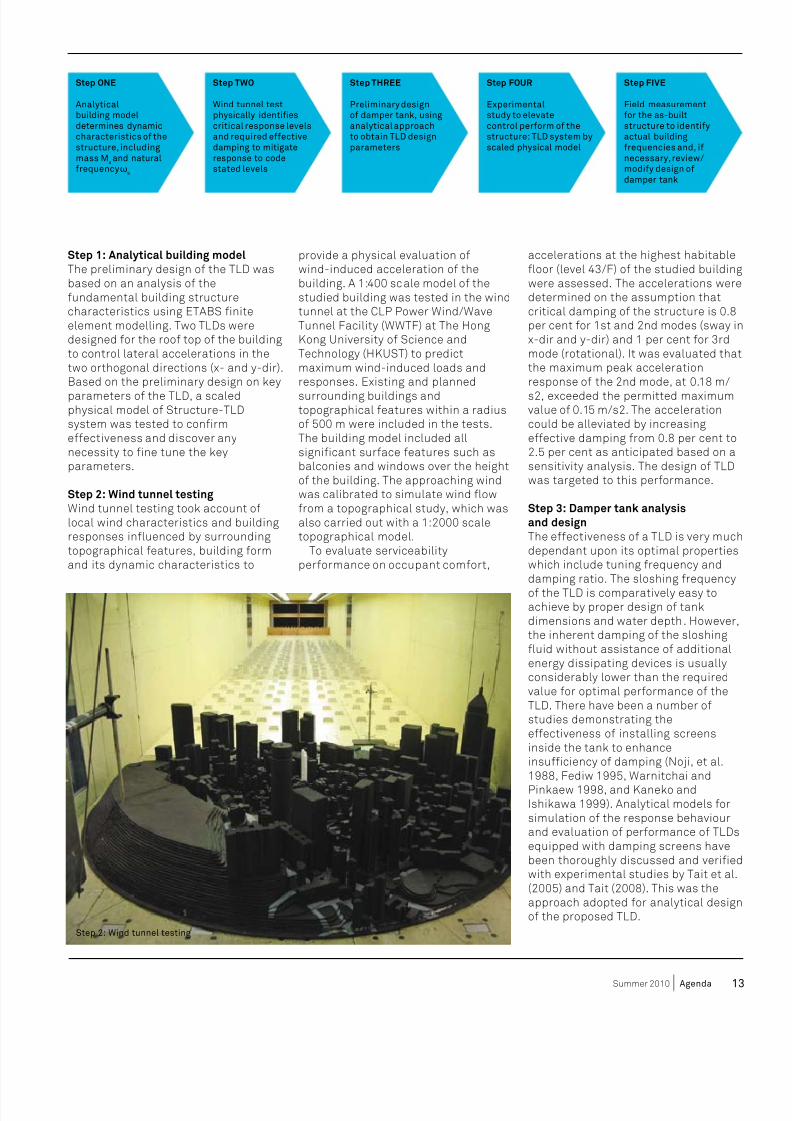
Step 1: Analytical building modelThe preliminary design o the TLD wasbased on an analysis o theundamental building structurecharacteristics using ETABS initeelement modelling. Two TLDs weredesigned or the roo top o the buildingto control lateral accelerations in thetwo orthogonal directions (x- and y-dir).Based on the preliminary design on key
parameters o the TLD, a scaledphysical model o Structure-TLDsystem was tested to conirmeectiveness and discover anynecessity to ine tune the keyparameters.
Step 2: Wind tunnel testingWind tunnel testing took account olocal wind characteristics and buildingresponses inluenced by surroundingtopographical eatures, building ormand its dynamic characteristics to
Step TWO
Wind tunnel testphysically identiescritical response levelsand required eectivedamping to mitigateresponse to codestated levels
Step ONE
Analyticalbuilding modeldetermines dynamiccharacteristics o thestructure, includingmass M
sand natural
requency ω
s
Step FOUR
Experimentalstudy to elevatecontrol perorm o thestructure: TLD system byscaled physical model
Step THREE
Preliminary designo damper tank, usinganalytical approachto obtain TLD designparameters
Step FIVE
Field measurementor the as-builtstructure to identiyactual buildingrequencies and, inecessary, review/modiy design odamper tank
provide a physical evaluation owind-induced acceleration o thebuilding. A 1:400 scale model o thestudied building was tested in the windtunnel at the CLP Power Wind/WaveTunnel Facility (WWTF) at The HongKong University o Science andTechnology (HKUST) to predictmaximum wind-induced loads andresponses. Existing and planned
surrounding buildings andtopographical eatures within a radiuso 500 m were included in the tests.The building model included allsigniicant surace eatures such asbalconies and windows over the heighto the building. The approaching windwas calibrated to simulate wind lowrom a topographical study, which wasalso carried out with a 1:2000 scaletopographical model.
To evaluate serviceabilityperormance on occupant comort,
accelerations at the highest habitableloor (level 43/F) o the studied buildingwere assessed. The accelerations weredetermined on the assumption thatcritical damping o the structure is 0.8per cent or 1st and 2nd modes (sway inx-dir and y-dir) and 1 per cent or 3rdmode (rotational). It was evaluated thatthe maximum peak accelerationresponse o the 2nd mode, at 0.18 m/
s2, exceeded the permitted maximumvalue o 0.15 m/s2. The accelerationcould be alleviated by increasingeective damping rom 0.8 per cent to2.5 per cent as anticipated based on asensitivity analysis. The design o TLDwas targeted to this perormance.
Step 3: Damper tank analysisand designThe eectiveness o a TLD is very muchdependant upon its optimal propertieswhich include tuning requency anddamping ratio. The sloshing requency
o the TLD is comparatively easy toachieve by proper design o tankdimensions and water depth. However,the inherent damping o the sloshingluid without assistance o additionalenergy dissipating devices is usuallyconsiderably lower than the requiredvalue or optimal perormance o theTLD. There have been a number ostudies demonstrating theeectiveness o installing screensinside the tank to enhanceinsuiciency o damping (Noji, et al.1988, Fediw 1995, Warnitchai and
Pinkaew 1998, and Kaneko andIshikawa 1999). Analytical models orsimulation o the response behaviourand evaluation o perormance o TLDsequipped with damping screens havebeen thoroughly discussed and veriiedwith experimental studies by Tait et al.(2005) and Tait (2008). This was theapproach adopted or analytical designo the proposed TLD.
Step 2: Wind tunnel testing
Summer 2010 Agenda 1

8/7/2019 Agenda-Summer2010 (1)
http://slidepdf.com/reader/full/agenda-summer2010-1 14/42
The equations of motion describing the response of a combined structure-tuned liquid damper system can be approximated in matrix form. Theequation of motion is given by:
where , , and are the mass, damping
and stiffness of the structure, respectively. is an equivalent displacement
variable of tuned liquid damping and is related to generalized coordinate of
water free surface motion by , in which modal participation factor
.
The equivalent mass and stiffness representing the fundamental sloshingmode of fluid in a rectangular tank is (Chang and Qu 1998):
)
where is fluid density, is gravitational acceleration. The breadth, length
of tank and water depth are denoted by , and , respectively. The
equivalent damping coefficient and equivalent damping ratio are
amplitude dependent. For the preliminary design in our application, wh itenoise excitation is considered, and the expressions are given by
where
in which is the location of screen inside the tank. Pressure loss coefficient
for the damping screen utilized in this study followed the expression
suggested by Baines and Peterson (1951) on an assumption of steady flow,and is given by:
The contraction coefficient for a thin plate orifice denoted by , and is
the solidity ratio of damping screen submerged in the water.
Step 3: Theoretical background o structure-tuned liquid damper system
The design equations were applied todesign a double-deck TLD to suppressthe 1st and 2nd mode accelerations,equivalent to the x- and y-dir o thebuilding. The estimated buildingrequencies o the 1st and 2nd
undamental modes were estimated tobe 0.24 Hz and 0.26 Hz, respectively.The internal dimensions o dampertanks or both decks are 8.45m ×5.425m (length × breadth), and waterdepths in the upper and lower TLD are1.92m and 0.87m, respectively. Toattain the target eective damping asevaluated in wind tunnel testing, pairso damping screens, o which the slatand gap are respectively 50mm and70mm, with solidity ratio o 40 per centwere deployed in each TLD. The pairs odamping screens were placed in the
middle o the TLD 850mm and 1100mmapart or the upper and lower TLDrespectively.
Unquestionably, modiying thestructural requency by stiening thebuilding would have been a simple andstraight-orward methodology in termso engineering design, but this solutionwould have been costly and would haveaected the architectural layout. So,or this development AECOM proposeda Tuned Liquid Damper (TLD), a solutionwhich improved building perormanceor the owner, and resulted in a
cost-eective and value-engineered
scheme. However, the design o thissystem required an ingenious andrigorous perormance based approachincluding advanced analysis,experimental evaluation and physicalmodelling.
Step 4: Experimental perormanceo structure-TLD systemThe physical perormance o theproposed structure-TLD system wasalso studied with a 1:10 scaled model.The laboratory-scale study wasconducted at The Hong KongPolytechnic University. The primaryobjective o the experimentalinvestigation was to physically validatethe target eective damping to beachieved by the TLD with the designeddimension and arrangement o
damping screens.The experimentally replicated
structure-TLD system was designed asa suspended system which comprisesa rigid mass to simulate the modalmass o building; a TLD with dampingscreens; an actuator to input externalexcitation; an accelerometer tomeasure responses o structure underexcitation; and an acquisition systemto display, record and analyse the inputand output signals rom the system.The structure-TLD system, withdierent settings o water depth and
screen locations, was vibrated to
resonance states with sinusoidalexcitation to the design levels oacceleration over a range orequencies to identiy the controlperormance and eective damping othe system.
The tests or the 1st and 2nd modecontrol were carried out separately. Forthe 1st mode vibration (i.e.x-directional response o building)investigation showed that accelerationlevel o the test structure wasoptimally suppressed with water at alevel o 195mm, which is equivalent to1950mm at ull scale, with a pair odamping screens placed 85 mm apart(850mm at ull scale). The testedvalues were in close agreement withthe analytical design.
The studies demonstrated that, by
optimising the water level and dampingscreen location, accelerations could bereduced by our times compared to theundamped structure.
Parametric studies on designsettings o the TLD were alsoconducted or the 2nd mode vibration(i.e. y-directional response o building).The optimal acceleration reduction wasound to appear at water depth o88mm (880mm at ull scale), with twoslices o damping screens 110mmapart (1100 mm at ull scale).
14 Agenda Summer 2010

8/7/2019 Agenda-Summer2010 (1)
http://slidepdf.com/reader/full/agenda-summer2010-1 15/42
Step 5: Field measurement inas-built structureField measurement o the as-builtstructure was carried out to validate thestructural requency estimated by the
analytical building model, and used orthe damper design. Accelerometers wereemployed to directly measure theacceleration time histories o thebuildings and to determine the structuralrequencies by requency domainanalysis. The measured requencieswere compared with the estimatedvalues to review, i necessary, the degreeo tuning o design parameters toachieve the best perormance.
Four accelerometers were installed
in the top loor o the building toidentiy its irst three undamentalrequencies. The response signals weresampled at requency o 20 Hz andrecorded in duration o 3 hours.
Spectral analysis was perormed orthe recorded signals to identiy thenatural requencies. Analysis o thedata showed that the irst twoundamental requencies were in closeagreement with the analyticalestimations, and that the TLDs wereperorming as expected. A largerdeviation was detected in therequency o the torsional mode (3rdmode) but the perormance was stillwithin acceptable design parameters.
Structure: TLD system Damping screen
Damper tank
ConclusionTall slender buildings on a restrictedsites present structural engineers withdynamic problems that are dicult toresolve economically through aconventional design approach. Thisperormance based design approach orTuned liquid Dampers has great potentiato enhance the dynamic perormance otall slender structures, enabling creative
architecture, optimising usable foorspace and material use and resolving theproblem o occupant comort.
AcknowledgementsThe authors would like to thank thebuilding owners or the support o allexperimental works and eldmeasurement. Thanks also go to Pro.Kenny Kwok at the CLP Power Wind/Wave Tunnel Facility at HKUST or hissupport in the wind tunnel study. Theauthors would like to acknowledge Pro.Xu at the Hong Kong Polytechnic
University or his valuable discussionsand suggestion on the design andexperimental study o Tuned LiquidDampers.
DAVID LEE IS EXECUTIVE VICE PRESIDENT OF AECOM IN
ASIA / [email protected]
KONG LOI WONG IS A PRINCIPAL ENGINEER WITH AECOM
IN HONG KONG / [email protected]
MARTIN NG IS A STRUCTUR AL ENGINEER WITH AECOM IN
HONG KONG / [email protected]
Water lled dampertank (195m water depth)with 2 slices o dampingscreens (85mm spacing)
Water lled damper tank(195m water depth)
Empty damper tank
Step 4: Comparison o 1st modeacceleration o structure indierent control cases using1:10 scale model
Summer 2010 Agenda 1

8/7/2019 Agenda-Summer2010 (1)
http://slidepdf.com/reader/full/agenda-summer2010-1 16/42
I
n 2007, Calgary InternationalAirport surpassed the 12 millionpassenger mark. The existingterminal, with upgrades between
1998 and 2004, is designed tohandle 11 million passengers.
The Calgary Airport Authority (CAA) isreviewing options to accommodate theseincreases to accommodate passengergrowth or the next two decades.
One option under review is anexpansion o its terminal and airsideacilities at Calgary.
One proposal to address the airport ’sincreased passenger trac is anexpansion to the International/Trans-border acilities at Calgary. This wouldtake the orm o a new 72,000 m2
concourse. In addition to increasedprocessing capacity, expanded retail andduty ree shopping acilities willcontribute to the airports overall revenuestream. During planning meetings, theAirport Authority has stressed that theirstated environmental goals were a keyactor in any solution proposed. A themethat emerged during these initialplanning meetings was: could theexpansion be accomplished without
increasing the net energy consumptionand greenhouse gas (GHG) production othe existing campus – the “Net Zero”solution? Through modeling and lie
cycle analyses, a solution that meets theCalgary Airport Authorities economic
and operating criteria was identied thatalso presents a “Net Zero” option or theexpansion o the airport with anannualized return on investment o 6.1%.
As part o the 2004 CalgaryInternational Airport Master Plan, the
Expansion at Calgary International Airport was driven by environmental goals.John Munroe and Stean Holst explain AECOM’s net zero approach.
Calgary, Canada
16 Agenda Summer 2010

8/7/2019 Agenda-Summer2010 (1)
http://slidepdf.com/reader/full/agenda-summer2010-1 17/42
2001
2002
2003
2004
2005
2006
2007
Table 1: No. o passengers (% change)
7,884,194 (1.15%)
7,794,519 (-3.66%)
8,576,541 (8.78%)
9,174,039 (6.97%)
10,148,718 (10.62%)
11,279,080(11.14%)
12,257,865(8.68%)
Figure 1: Existing CalgaryInternational Airport Terminal
Authority introduced the ollowingstatement: “... in addition to minimizingthe environmental impact o osteringaviation development and economic
growth, the Airport Authority will striveto exempliy strong environmentalstewardship to local, national andinternational communities throughinnovation, leadership and newpartnerships.”
During planning meetings, theAuthority stressed that their statedenvironmental goals were a key actor inany solution proposed. A theme thatemerged during initial planning meetingswas: could the expansion beaccomplished without increasing the netenergy consumption and greenhouse gas
(GHG) production o the existing campus– the “Net Zero” solution? As a result, theAuthority authorized a Mechanical andElectrical Master Plan, one acet owhich would review the easibility.
This paper presents a synopsis o theanalyses that were perormed and therecommendations presented to the
Authority or its consideration whennalizing its decision on what measuresto implement in an expansion scenario.All currency quoted are in 2008 Canadian
dollars.
Existing Terminal Baseline(Utility and GHG Production)Calgary International Airport’s terminalhas three concourses (reer to Figure 1),which have been opened, expanded orupgraded over a ten year period, 1998 to2004. Pier B/C handles international andtrans-border (US/Canada) fights; thepassenger segment that hasexperienced the most growth. Thecurrent expansion targets this area. Theplanned 72,000 m2 expansion will also
increase the processing capacity oCanada Border Services Agency and USCustoms and Border Protectionpre-clearance operations. The currentterminal covers 141,648 m2 o rooedarea, consisting o Concourse A throughD, Main Terminal and Court yard Inll.
...could the expansionbe accomplished
without increasingthe net energyconsumption andgreenhouse gas (GHG)production o theexisting campus – the“Net Zero” solution?
Summer 2010 Agenda 1

8/7/2019 Agenda-Summer2010 (1)
http://slidepdf.com/reader/full/agenda-summer2010-1 18/42
Table 3: Baseline Figures or Net Zero Comparisons
Utility ElectricityConsumption(kWh/m2)
Natural GasConsumption(GJ/m2)
WaterConsumption(m3/m2)
CO2eGeneration(tCO
2e/m2)
Baseline 306 1.12 1.93 0.34
Table 2: Tons o CO2
Equivalent Conversions
Utility ElectricityConsumption(MWh)
Natural GasConsumption(GJ)
WaterConsumption
(m3)
tCO2e/unit*m2 915 0.08 0*
* treatment, distribution, sewerage energy were discounted as thesegures were unavailable
500
450
400
350
300
2502000 2001 2002 2003 2004 2005 2006 2007
(KWh/m2)
02 Historical annual electricity consumption
3.00000
2.50000
2.00000
1.50000
1.00000
0.50000
0.000002000 2001 2002 2003 2004 2005 2006 2007
(m3/m2)
04 Historical annual water consumption
2.000
1.900
1.800
1.700
1.600
1.500
1.400
1.300
1.200
1.100
1.0002000 2001 2002 2003 2004 2005 2006 2007
(GJ/m2)
03 Historical annual natural gas consumption
0.6
0.5
0.4
0.3
0.2
0.1
-2000 2001 2002 2003 2004 2005 2006
(Tons/m2)
05 The resulting historical tons o CO2
equivalents are shown below
The Authority has kept historical data on utility consumption,providing a good basis or baseline development. Figures 2though 4 represent the historical annual unit (utility/m2)consumptions or each utility o the existing terminal.
The baseline was chosen as the most stringent value over theprior ve years (2002 – 2007). The resulting baseline or the
Airport was set as shown in Table 3:
The historical utility consumptions were converted toequivalent tons o CO
2 equivalents (tCO2e) using the conversionparameters in Table 5. The resulting historical tons o CO2
equivalents are shown in Figure 5.
A benchmarking study o airports within the Canadian contextwas undertaken simultaneously at the ollowing airports– Edmonton, Montreal, Ottawa, Toronto, and Vancouver. Theresults o this study were not available at the time o writing.
18 Agenda Summer 2010

8/7/2019 Agenda-Summer2010 (1)
http://slidepdf.com/reader/full/agenda-summer2010-1 19/42
Energy/Utility Consumption ModelsSeveral techniques were used togenerate energy and utility consumptionmodels. Energy and electricalconsumption models were developedusing the TRNSYS 16.1 simulationpackage, and water consumption modelswere developed using the Canadian
Green Building Council (CaGBC)simulation calculations.The expansion scenario includes a
new three level Concourse E, shown inFigure 6. With three levels, this additionwill add approximately 72,000 m2 to theterminal area, thus bringing the totalterminal area to 213,648 m2. This will bean increase o 51 per cent rom the grossarea in 2007.
An initial ‘calibration’ consumptionmodel o the existing terminal wasdeveloped to identiy the deviationbetween the models used or
determining the operating parameterscompared to 2006 actual readings. Theresults o the calibration model,presented in Table 4, revealed an overall
Model V0: This model represents the
most basic orm o development othe terminal and its concourses. Noemphasis is placed on bettering theexisting perormance parameters o theacility. Existing envelope, mechanicaland electrical systems are matchedon the new Concourse E and onlymaintenance and repair/replacemento these systems are carried out duringredevelopment o the existing terminaland concourses. The central plant andservices remain in service and areexpanded as required to meet the newloads.
Model V1: This model adds sensibleheat recovery to model V0 includingthe existing terminal. No waterconsumption reduction measures aretaken. The central plant and servicesremain in service and are expanded asrequired to meet the new loads.
Model V2: This model refects
signicant upgrades to improve energyperormance and water consumption.In this model, total (enthalpy) heatrecovery is added to Model V0;moderate water conservation isundertaken by converting all xturesto low fow water saving xtures; theenvelope o the entire acility, includingthe existing terminal, is upgraded to ahigh perormance envelope through newconstruction and redevelopment; andday lighting controls are introduced.The central plant and services remain inservice but are not expanded as there is
no net increase in load.
Model V3: Aggressive measuresare introduced in this model. Theundamental HVAC systems arereplaced with high perormance, lowenergy systems (radiant slabs anddisplacement ventilation, hybrid
ventilation), earth tube pre-conditioning
on all new construction, enthalpyheat recovery is ully deployed, theenvelope is upgraded, aggressiveday lighting strategies employedand water consuming xtures areconverted to ultra-low fow and/orwaterless technologies. Energy sourcesand services are decentralized toreduce distribution losses and to takeadvantage o ‘point o use’ eciencies.
Model V4: This model optimizes theenergy sources and supply systems orModel V3. This involves tri-generation,
rain water harvesting and grey waterrecycling.
Model V5: This model introducesalternative energy sources, specicallyphotovoltaic power generation and thepurchase o wind generated power tominimize GHG production.
Table 4: Calibration Model Results
Utility PowerConsumption(MWh/year)
Heating EnergyConsumption(MWh/year)
Cooling EnergyConsumption(MWh/year)
WaterConsumption(m3/year)
Model 53,801 38,730 2,850 245,953
2006 Actual* 32,022 38,913 3,723 288,872
deviation o plus 28 per cent or energyand minus 15 per cent or waterconsumption. Subsequently, six modelswere developed, labeled V0 through V5.
A signicant consumer o electricalpower was the lighting allowance made
or retail operations. The Authority hadidentied a vibrant retail component asbeing essential to the revenuegeneration opportunities or the airport.Building parameters applied to eachmodel are listed in Table 5.
Figure 6: Expanded Calgary International Airport
Six models were developed:
Summer 2010 Agenda 1

8/7/2019 Agenda-Summer2010 (1)
http://slidepdf.com/reader/full/agenda-summer2010-1 20/42
Table 5: Model Building Parameters
Model V0 Model V1 Model V2 Model V3 Model V4 Model V5
Lighting (Standard) 14 W/m2 14 W/m2 14 W/m2 14 W/m2 14 W/m2 14 W/m2
Lighting (Retail) 60 W/m2 60 W/m2 60 W/m2 60 W/m2 60 W/m2 60 W/m2
Auxiliary Power 10 W/m2 10 W/m2 10 W/m2 10 W/m2 10 W/m2 10 W/m2
Glazing LightTransmittance
50% 50% 70% 70% 70% 70%
Solar Heat GainCoefcient
0.45 0.45 0.5 0.5 0.5 0.5
U Value 1.7 W/m2K 1.7 W/m2K 0.7 W/m2K 0.7 W/m2K 0.7 W/m2K 0.7 W/m2K
Shading Internal Internal Refective, Out oSpace
Refective, Out oSpace
Refective, Out oSpace
Refective, Out o Space
FC 0.95 0.95 0.25 0.25 0.25 0.25
Total SHGC (glass +shades)
0.43 0.43 0.12 0.12 0.12 0.12
Skylights None None 8% o Roo Area,Triple Glazed
8% o Roo Area,Triple Glazed
8% o Roo Area,Triple Glazed
8% o Roo Area, Triple Glazed
Roo U Value 0.45 W/m2K 0.45 W/m2K 0.26 W/m2K 0.26 W/m2K 0.26 W/m2K 0.26 W/m2K
Floor U Value 0.45 W/m2K 0.45 W/m2K 0.26 W/m2K 0.26 W/m2K 0.26 W/m2K 0.26 W/m2K
Opaque Façade U Value 0.7 W/m2
K 0.7 W/m2
K 0.37 W/m2
K 0.37 W/m2
K 0.37 W/m2
K 0.37 W/m2
KPlumbing Fixture Type Normal Normal Low Flow Ultra Low Flow/
WaterlessRain WaterHarvesting, GreyWater Recycling
Rain Water Harvesting, GreyWater Recycling
The results o the modeling exercise, by model, are shown in Table 6:
Table 6: Model Annual Utility and Water Consumption Perormance
Model V0 Model V1 Model V2 Model V3 Model V4 Model V5
Heating 389 kWh/m2 240 kWh/m2 211 kWh/m2 108 kWh/m2 206 kWh/m2 206 kWh/m2
Cooling 51 kW/m2 50 kWh/m2 24 kWh/m2 28 kWh/m2 70 kWh/m2 70 kWh/m2
Electricity 349 kWh/m2 349 kWh/m2 251 kWh/m2 208 kWh/m2 -7 kWh/m2 -61 kWh/m2
Potable WaterConsumption
1.246 m3/m2 1.246 m3/m2 0.817 m3/m2 0.600 m3/m2 0.472 m3/m2 0.472 m3/m2
GHG Production 0.46 Tons CO2e
/m2 0.41 Tons CO2e
/m2 0.31 Tons CO2e
/m2 0.23 Tons CO2e
/m2 0.08 Tons CO2e
/m2 0.0 Tons CO2e
/m2
Reerring to Table 3: Baseline, it can be seen that Models V2, V3, V4 and V5 present “Net Zero” solutions, reerenced to currentenergy and water consumption, or the expansion and redevelopment.
Economic/Lie Cycle AnalysesThe true value o an investment isoten not measured only in the capitalcost, but in the long term benets o
systems impacted by the measures. Thesimulation models developed had LieCycle Cost (LCC) analyses perormedon each in order to gain insight into thelong term costs associated with eachproposal. These costs can then be usedto compare the complete investmentand annualized rate o return in termso capital cost required vs. Net PresentValue (NPV) o the running costs (cashfows).
Two tools were used to develop the
LCC analyses: PACES and RETScreen.The PACES (Parametric Cost EngineeringSystem) sotware is based on patentedcost estimating techniques and is used
to create cost estimates and LCCanalyses early in the programming anddesign phase o a project. PACES usespre-engineered model parameters andconstruction criteria to accuratelypredict construction costs using limiteddesign inormation. PACES was used orthe LCC analyses or models V0 throughV3. RETScreen, developed by NaturalResources Canada, is a unique decisionsupport tool developed with thecontribution o numerous experts rom
government, industry, and academia.The sotware can be used worldwide toevaluate the energy production andsavings, lie-cycle costs, emission
reductions, nancial viability and risk orvarious types o energy ecient andRenewable Energy Technologies (RET’s).RETScreen, in combination with PACESwas used or the LCC analyses ormodels V4 and V5. Items that were notactored in the analyses include retailoperations revenue, GHG credit valuesand productivity gains rom employees.For the economic analyses, commonparameters used or all models are
summarized in Table 7.
20 Agenda Summer 2010

8/7/2019 Agenda-Summer2010 (1)
http://slidepdf.com/reader/full/agenda-summer2010-1 21/42
Table 7: Economic Parameters or Lie Cycle Analyses
Item Value
Year Existing Terminal Constructed 1976
Year Concourse E Constructed 2013
Year Existing Terminal/Concourses Redeveloped 2016
Year LCC Analyses Start 2008
Year LCC Analyses End 2025Major Existing Terminal Upgrades 2002
LCC Analyses Centered on Mid-Point o Timeline (2016)
Existing Terminal Area 126,348 m2
Concourse E Area 72,000 m2
Central Plant Area 6,040 m2
Escalation Rate (Average or 2008 – 2025) 3%
Discount Rate/Capital Interest Rate (2008 – 2025) 3%
Blended Electricity Rate (2008 – 2025) $0.095/kWh (based on lg. term Enmax Rates)
Blended Natural Gas Rate (2008 – 2025) $8.63/GJ
Escalation on Util ity Rates 0.01% (xed rates or span o analysis)
Central Plant Labour Costs $9.79/m2 (no expansion to existing)
Central Plant Labour Costs $14.63/m2 (expanded to First Class Plant)
Table 8: Annualized Return on Investment
Model V0 Model V1 Model V2 Model V3 Model V4 Model V5Capital Cost (2008 $’s) $566,493,731 $574,840,356 $ 615,747,749 $ 647,100,873 $ 659,737,286 $704,748,571
NPV $368,426,650 $347,775,157 $ 308,081,195 $261,985,439 $244,724,643 $238,741,626
Return --- 11.4% 5.6% 6.1% 6.1% 4.3%
Figure 7 and Table 8 summarize theresults o the analyses graphically and intabular orm.
From these results, several scenarioemerge. Model V1 shows the bestannualized return on investment butdoes not meet the “Net Zero” criteria.
Models V3 and V4 show identicalannualized rates o return, and both meethe “Net Zero” criteria. Model V5 has thelowest annualized rate o return. ModelV5 is the scenario where renewableenergy sources are incorporated andthe lower return is an indicator o therelative cost o this type o energy sourcecompared to conventional sources inNorth America.
Figure 7: Capital Cost vs. Net Present Value (NPV)
$1,000,000,000
$800,000,000
$600,000,000
$400,000,000
$200,000,000
$0V0 V1 V2 V3 V4 V5
Model
Capital Cost NPV Sum
Summer 2010 Agenda 2
8/7/2019 Agenda-Summer2010 (1)
http://slidepdf.com/reader/full/agenda-summer2010-1 22/42
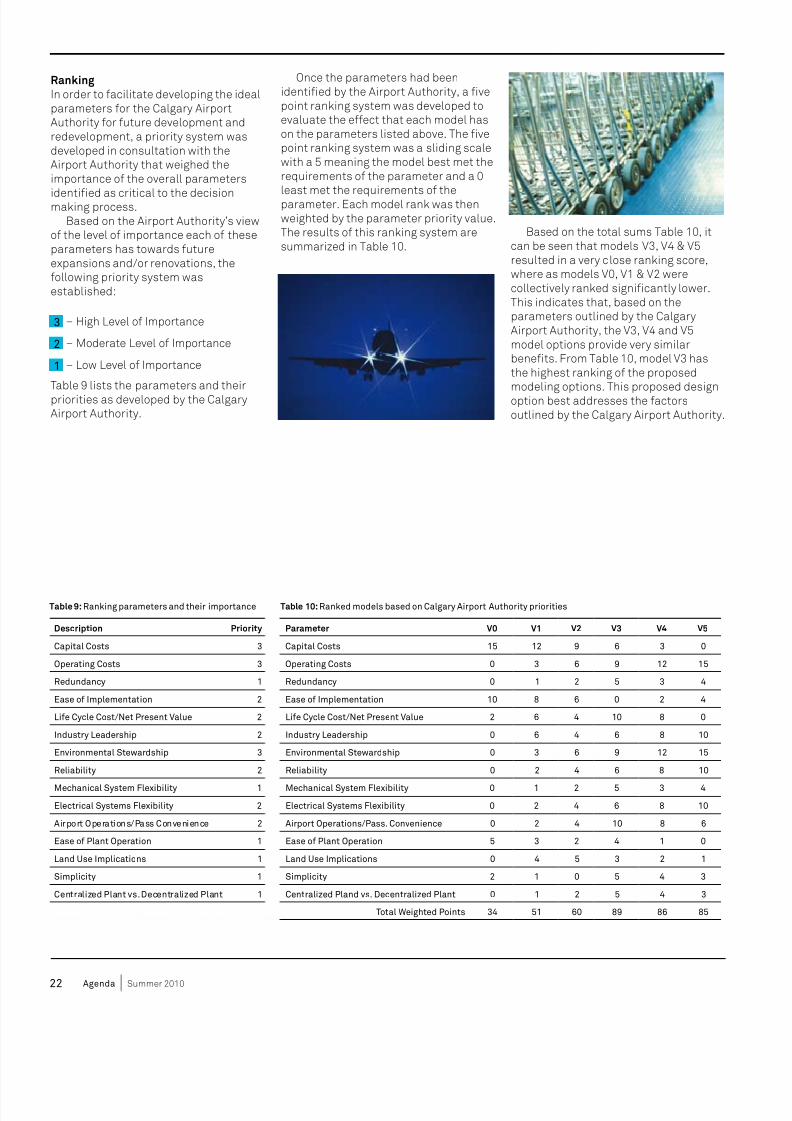
RankingIn order to acilitate developing the idealparameters or the Calgary AirportAuthority or uture development andredevelopment, a priority system wasdeveloped in consultation with theAirport Authority that weighed theimportance o the overall parameters
identied as critical to the decisionmaking process.Based on the Airport Authority’s view
o the level o importance each o theseparameters has towards utureexpansions and/or renovations, theollowing priority system wasestablished:
3 – High Level o Importance
2 – Moderate Level o Importance
1 – Low Level o Importance
Table 9 lists the parameters and theirpriorities as developed by the CalgaryAirport Authority.
Once the parameters had beenidentied by the Airport Authority, a vepoint ranking system was developed toevaluate the eect that each model hason the parameters listed above. The vepoint ranking system was a sliding scalewith a 5 meaning the model best met therequirements o the parameter and a 0
least met the requirements o theparameter. Each model rank was thenweighted by the parameter priority value.The results o this ranking system aresummarized in Table 10.
Based on the total sums Table 10, itcan be seen that models V3, V4 & V5resulted in a very close ranking score,where as models V0, V1 & V2 werecollectively ranked signicantly lower.This indicates that, based on theparameters outlined by the CalgaryAirport Authority, the V3, V4 and V5model options provide very similarbenets. From Table 10, model V3 hasthe highest ranking o the proposed
modeling options. This proposed designoption best addresses the actorsoutlined by the Calgary Airport Authority.
Description Priority
Capital Costs 3
Operating Costs 3
Redundancy 1
Ease o Implementation 2
Lie Cycle Cost/Net Present Value 2
Industry Leadership 2
Environmental Stewardship 3
Reliability 2
Mechanical System Flexibility 1
Electrical Systems Flexibility 2
Airport Operations/Pass Convenience 2
Ease o Plant Operation 1
Land Use Implications 1
Simplicity 1
Centralized Plant vs. Decentralized Plant 1
Table 9: Ranking parameters and their importance
Parameter V0 V1 V2 V3 V4 V5
Capital Costs 15 12 9 6 3 0
Operating Costs 0 3 6 9 12 15
Redundancy 0 1 2 5 3 4
Ease o Implementation 10 8 6 0 2 4
Lie Cycle Cost/Net Present Value 2 6 4 10 8 0
Industry Leadership 0 6 4 6 8 10
Environmental Stewardship 0 3 6 9 12 15
Reliability 0 2 4 6 8 10
Mechanical System Flexibility 0 1 2 5 3 4
Electrical Systems Flexibility 0 2 4 6 8 10
Airport Operations/Pass. Convenience 0 2 4 10 8 6
Ease o Plant Operation 5 3 2 4 1 0
Land Use Implications 0 4 5 3 2 1
Simplicity 2 1 0 5 4 3
Centralized Pland vs. Decentralized Plant 0 1 2 5 4 3
Total Weighted Points 34 51 60 89 86 85
Table 10: Ranked models based on Calgary Airport Authority priorities
22 Agenda Summer 2010

8/7/2019 Agenda-Summer2010 (1)
http://slidepdf.com/reader/full/agenda-summer2010-1 23/42
ConclusionThe comparative energy/utilityconsumption model results or annualprimary energy consumption arepresented in Figure 8. As can be seen,Models V4 and V5 achieve a ‘net zero’status even at the primary energy level.Model V5 has the highest likely capitalcost (and the highest degree o dicultyor implementation). Conversely, ModelV0 has the highest consumption in allareas and the lowest capital cost and
degree o diculty or implementation. From a Net Present Value (NPV) pointo view, Model V4 provides the bestbalance between capital and operatingcosts over the lie o the model scenario.From the ranking criteria establishedwith the Calgary Airport Authority, ModelV3 met the most criteria; howeverModels V4 and V5 were very close. Theannualized rates o return or Models V3and V4 were identical. The preliminary
recommendation to the Calgary AirportAuthority was Model V4; achieving a “NetZero” expansion and redevelopment(both in terms o site energyconsumption and primary energyconsumption) relative to the energyconsumption o the existing campus; andan annualized rate o return on theadditional capital cost that provides longterm nancial benet. The CalgaryAirport Authority has not yet adoptedany recommendation.
ReerencesMaster Plan 2004, 2004, CalgaryInternational AirportAubé, F. 2001. Guide or Computing CO
2
Emissions Related to Energy Use.
JOHN MUNROE WORKS IN AECOM’S CALGARY OFFICE /
STEFAN HOLST, OF TRANSOLAR, WAS A
SUB-CONSULTANT FOR THIS PROJECT.
Figure 8: Total Primary Energy Consumption or All Models
234’074 234’074
166’694139’635
67’662 48’119
76,61147’375
41’613
21’340
40;591
40’591
-71’973-89’116
9’977
9’866
4’656
5’543
13’795
13’795
400’000
350’000
300’000
250’000
200’000
150’000
100’000
50’000
0
-50’000
-100’000V0 V1 V2 V3 V4 V5
Existing acade+ system
Baseline:0.+Sens. Heat
Recovery
1.+ OptimizedFacade/Shading
2.+ OptimizedSystem
3.+Trigeneration
(MWel)
4.+40’000 m2 PVon Pier E
Calgary International Airport MasterplanPrimary Energy Consumption
Compr. Chiller COPel: 6.0, Abs. Chiller: COPth: 0.7, Trigen Engine: 40% electric, 48% thermalPE-Factors: Electr. 3.4, Nat. Gas: 1.1
Cooling
Heating
Electricity
Subst. Electricityby Trigen / PV
Total Primary Energy Consumption (MWh/a)
0%320’661
-9%
291’315
-33%214’963
-48%166’517
-62%122’048 -68%
102’506
Summer 2010 Agenda 2

8/7/2019 Agenda-Summer2010 (1)
http://slidepdf.com/reader/full/agenda-summer2010-1 24/42
As climate change becomes an increasingly important issueor planners it is vital to ensure that masterplanning is based
on accurate and meaningul inormation. The sustainablesystems integrated model is helping AECOM lead the way.Mei Ren sets the scene.
In the light o predicted climatechange it is imperative that weplan or and create communitiesthat can robustly meet thischallenge. New masterplans anddevelopments must be extremely
robust and designed to cope with, andadapt to, uture uncertainty.
This means that all o the elements thatconstitute a masterplan, such as urbanlandscape, open space, utilityinrastructures and transport corridorswill need to be ‘remodelled’ to deal withincreasing temperatures, changing rainallpatterns, and rising sea levels. Evidence osuch ‘climate-proong’ can not onlyenhance an organisation’s reputation withits stakeholders, but can also protectinvestments, as well as reducing healthrisks and insurance costs.
Traditionally, designers havedeveloped these masterplan elements in
the light o their personal experiences.AECOM recognises the need orevidence-based, scientic, scenario-analysis techniques based on accurateand meaningul data, considering the liespan o the urban development. A modelthat includes lie cycle costing is a keyaid to the client’s decision-makingprocess. AECOM has developed a newtechnique, the Sustainable SystemsIntegrated Model (SSIM).
SSIM is a ully scalable climate change/land planning tool that addresses keydrivers aecting planning such asclimate change and carbon emissions,and includes inormation on energyplanning and urban heat islands.Crucially, SSIM also denes KeyPerormance Indicators (KPIs) that will
ensure any subsequent design andconstruction adheres to the masterplan. A typical SSIM will incorporate thesethemes, each with its own set o KPIs:•Buildingenergy
•Publicrealmenergy
•Potablewaterandstormwater
•Wastewater
•Greenbuilding
•Ecologicalservices/carbon
sequestration•Sustainabletransportation
•Social-cultural
•Urbanheatislandeect• Totalcarbonootprint.
Key drivers or urban masterplanningvary rom one country/project to another.For the Tanggu Beitang sustainable newtown in China, or instance, electricity,carbon emissions and waterconsumption were critical (see CaseStudy 2 on page 27). It is necessary toully understand each client’s key driverswhen adapting SSIM to their needs.
The SSIM ProcessSTEP ONE: Base modellingSSIM starts by developing the mostappropriate masterplan baselinecondition, with the greatest potential orsustainability. Environmental indicatorsalso have their own baseline conditions,based on ‘business as usual’. In a UK
oce building , or example, the baselinecondition or energy will meet minimumregulatory standards (Part L o theBuilding Regulations).
STEP TWO: Core theme optimisationOnce the masterplan ramework isestablished a more progressiveevaluation o sustainability practicesand measures can take place to developdierent scenarios on the basis o ‘good’,‘better’ and ‘best’ models. Energyperormance o dwellings, based on theCode or Sustainable Homes, may be
represented as:Good = 25 per cent better than Part LBetter = 44 per cent better than Part LBest = Zero carbonIn the UK, carbon perormance o adevelopment is regulated bylegislation and, to certain extent,planning processes. Thereore,benchmarking and system indicatorsor energy planning are very much inline with the UK carbon emissionpathways and legislation or buildings
Beyond planning
24 Agenda Summer 2010

8/7/2019 Agenda-Summer2010 (1)
http://slidepdf.com/reader/full/agenda-summer2010-1 25/42
Step ONE
Develop theBaseline
Choose a scheme with highpotential to achievesustainability. Look at:
Land plan•
Social culture•
System indicators•
Spacial indicators•
Climate change impact•
Land plan•
Step TWO
Optimisethe Core
Scenario analysis perormedor each element to anincreasingly high standard.Look at:
Ecology•
Transport•
Urban Heat Island•
Water•
Building energy•
Energy inrastructure•
Waste management•
Step THREE
Appraise theMasterplanMake decisions based oncost/benet and liecycleanalysis and compare totalsavings in:
Water•
Building energy•
Public realm energy•
As well as:
Reduction in transport•
Total reduction in•
greenhouse gas emissionsTotal initial costs•
Total on-going monthly•
costs
Step FOUR
Set out KPIs
Throughout designdevelopment stages ormonitoring perormance
Set Key PerormanceIndicators or:
Ecology•
Transport•
Urban Heat Island•
Water•
Building Energy•
Energy inrastructure•
Waste management•
and associated acilities. For lessregulated countries like China, energyconsumption and energy cost are themost critical considerations, alongwith carbon perormance.
Essentially, each model provides a‘package’ o measures that can beincluded to achieve a certain
perormance. Typical measures orachieving ‘good’ and ‘better’ standardsinclude active and passive energyreduction methods such as improvingperormance o building abric andservices, along with cost-eectiverenewable technologies.
All o the measures are costed on botha capital and lie cycle cost basis andcompared to the percentageimprovement o each package to arriveat a cost:benet ratio. This identieswhich packages achieve the highestreduction in resource use or carbon
ootprint at the lowest incremental cost.The scenario analysis provides anevidence-based decision making toolor assessing the site’s current energyinrastructure and determining thetechnically and nancially viable lowand zero carbon technologies thatwould meet zero-carbon buildingrequirements o the uture.
The package structure is highly fexible,enabling ‘mixing and matching’ odierent solutions.
This is an extremely valuable tool inguiding client decision making. Resultsshow that nearly 70 per cent carbonsavings above the baseline can beachieved with around a 10 per cent costincrease over the base case or a t ypicaldomestic project in the UK. However,introducing additional measures toachieve a urther 10 per cent carbonsavings may result in a much highercost increase above base case.
Armed with this inormation theclient, guided by the AECOMmasterplanning team, will be in abetter position to decide whichpackages oer the most cost e ectivesolution to include in a mastersustainability programme.
STEP THREE: Master programmeBased on the ‘good’, ‘better’ and ‘best’packages o measures or each coretheme - with the outputs related toenvironmental benets, capital costsand lie-cycle costs, SSIM will thencombine the individual core themes(energy, water, transportation, etc.) intoa set o comprehensive, all-systems
master programme alternatives. Thesecan be presented as ‘programme A’,‘programme B’ and ‘programme C’, whichcompare the total water savings, totalbuilding energy savings, total publicrealm energy savings, total reduction intransport, total reduction in greenhousegas emissions, total initial costs andtotal on-going monthly costs.
STEP FOUR: Moving Forwardwith KPIsKey Perormance Indicators (KPIs) are setout to acilitate monitoring osustainability perormance and targets.KPIs include key design standards orbuildings and associated acilities inorder to design inrastructure suitable outure demand, taking into accountclimate risks.
In this way, SSIM allows clients tobuild their masterplans in a scientic
and inormed ashion and ensurescontinuity between initial concept andnal implementation - and on tooperation stage.
The Sustainable Systems Integrated Model (SSIM) is aully scalable climate change/land planning tool that
addresses key planning drivers
Summer 2010 Agenda 2

8/7/2019 Agenda-Summer2010 (1)
http://slidepdf.com/reader/full/agenda-summer2010-1 26/42
01 Day time temperature
proles compared to
ambient air (includes
green cover and HVAC
plant heat emission)
02 Night time thermal
plume rising rom
buildings due to day
time heat absorption
rom solar radiation
03 Typical urban canyon
without green cover
showing areas o relative
hot spots due to urban
canyon eect
04 Typical urban canyon
with green cover showing
areas o relative cool spots
due to vegetation
Note: Yellow/red represents
hot spots, blue represents
cool spots
...measurement datarom London showsthat temperatures are
higher towards thecentre, with suracetemperature in thecentral boroughs 4-5°Cwarmer than thesuburbs...
01 03
0402
CASE STUDY 1
Urban Heat IslandsTemperature distribution in urban areasis highly aected by the urban radiationbalance, wind microclimate andevapotranspiration rom plants.
Measurement data rom London, orexample, shows that temperatures are
higher towards the centre with suracetemperature in the central boroughs4-5°C warmer than the suburbs – agrowing cause or concern in nationaland local planning authorities.
The London Development Authorityhas issued guidance that uture city
centre developments should considerthe impact o urban heat island eectand that an ‘Urban Heat Island ActionArea’ must be created where new
developments contribute to osettingthe eect.In China, the Green Building
Assessment (GBAS) requires that aproposed urban development should notcause daily average urban heat islandintensity o more than 1.5°C, compared
with suburban temperatures.Typical mitigating measures to beconsidered include:• Buildingorm
• Urbanheight• Streetwidth
• Suracematerialsselection
• Watersensitivedesign
• Greenspace
• Heatreleaserombuildingsand
energy ecient heating and cooling• Reducingairpollutionrom
mechanical plant• Maximisingwindbreezeand
harnessing building geometry toreduce urban canyon eect.
A computational methodology or urban
development planning, compares theeectiveness o the dierent measuresto achieve certain perormance
standards. This methodology can beused within SSIM to assist urbanplanning.
Temperature profles
due to canyon eect
or a London city centre
development.
26 Agenda Summer 2010

8/7/2019 Agenda-Summer2010 (1)
http://slidepdf.com/reader/full/agenda-summer2010-1 27/42
Summer 2010 Agenda 27
0807
05
06
Masterplan alternatives
or the Tanggu District
new town
05 Option 1. Plan
developed as the base
scheme (with Tianjin
Binhai Urban Planning
and Design Institute)
showing low density
development covering
the entire site
06 Option 2. AECOM
masterplan showing a
central urban area and
outlying residential
development
07 Option 3. AECOM
masterplan showing
distinct neighborhood
centers and a more
connected natural
open space system,
chosen as the
Preerred Masterplan,
shown below (08)
CASE STUDY 2
Tanggu BeitangThe Tanggu Beitangsustainable new town projectin Tianjin, China has beenplanned using AECOM’s SSIM
model. Situated onapproximately 1000 ha and
once home to healthywetlands, the Tanggu Districthas a history o industrialdevelopment that has seriouslyaected the environmentalcondition o the area.
In light o this situation, and
inspired by ‘sustainableplanning’, the local authoritieshave committed to greenerdevelopment as they aim to
become an exemplar newcommercial centre ornorthern China.
To provide measurable
sustainable master planning orthe client, AECOM used theSSIM to evaluate thesustainability o the masterplan
program and measure projectgoals against inancialeasibility.
Sustainability goals andtargets were established in aworkshop with the client. Dataor the site and region was
assembled to allow the Spatialand System Indicators used inthe project to be calibrated oractors such as electricity andwater consumption taking intoaccount site constraints and
local design standards. Good,better and best alternativedesign scenarios (05-07) werethen analysed using a series o
system indicators. Energyconsumption, capital and liecycle cost and carbon
emissions are among the
system indicators or thebuilding energy module.
Comparing the indicatorresults showed that the ‘best’case (06) was the mostsustainable option achieving
an overall 53 per cent carbonreduction. However the ‘better’plan (07 and 08) has beencarried orward to the nextstage as the most costeective design option. It isexpected to achieve 35 per
cent carbon reduction and 55per cent energy reduction.
MEI REN IS REGIONAL DIRECTOR IN AECOM’S
MANCHESTER OFFICE / [email protected]
8/7/2019 Agenda-Summer2010 (1)
http://slidepdf.com/reader/full/agenda-summer2010-1 28/42
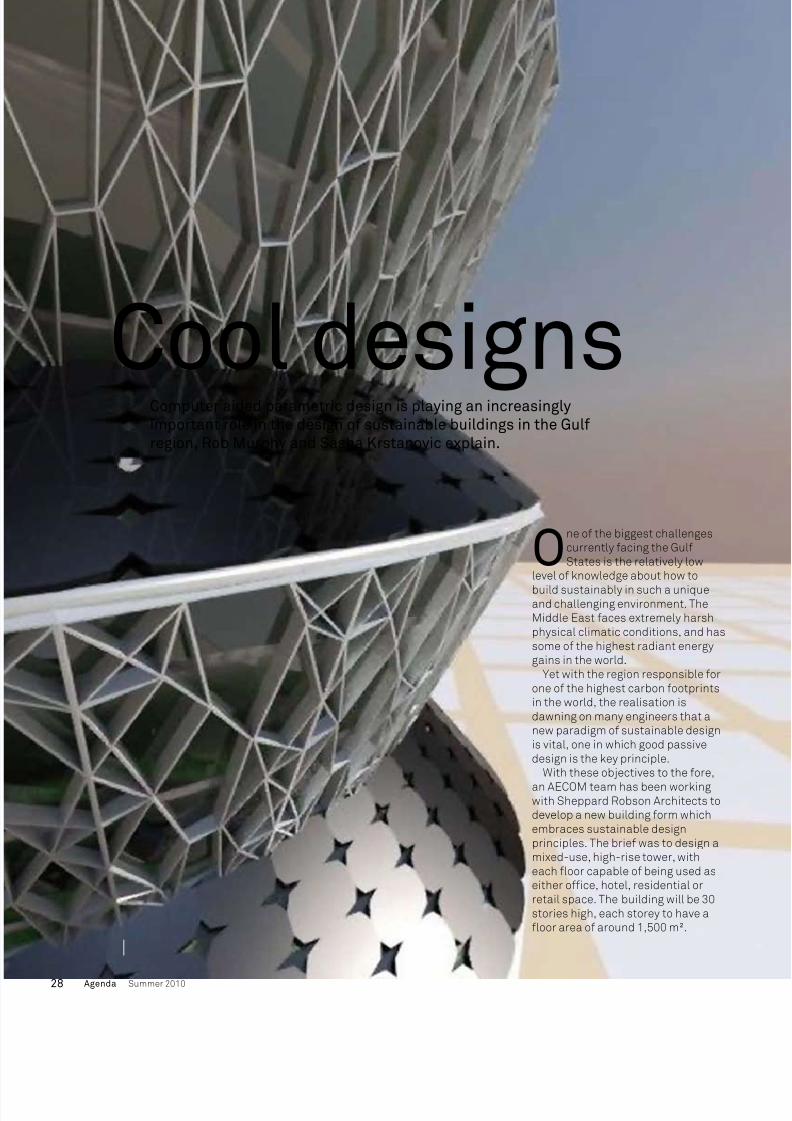
One o the biggest challengescurrently acing the GulStates is the relatively low
level o knowledge about how to
build sustainably in such a uniqueand challenging environment. TheMiddle East aces extremely harshphysical climatic conditions, and hassome o the highest radiant energygains in the world.
Yet with the region responsible orone o the highest carbon ootprintsin the world, the realisation isdawning on many engineers that anew paradigm o sustainable designis vital, one in which good passivedesign is the key principle.
With these objectives to the ore,
an AECOM team has been workingwith Sheppard Robson Architects todevelop a new building orm whichembraces sustainable designprinciples. The brie was to design amixed-use, high-rise tower, witheach foor capable o being used aseither oce, hotel, residential orretail space. The building will be 30stories high, each storey to have afoor area o around 1,500 m².
Cool designsComputer aided parametric design is playing an increasinglyimportant role in the design o sustainable buildings in the Gulregion, Rob Murphy and Sasha Krstanovic explain.
28 Agenda Summer 2010

8/7/2019 Agenda-Summer2010 (1)
http://slidepdf.com/reader/full/agenda-summer2010-1 29/42
The overriding consideration or theconstruction o any building in the regionis the hot, humid and sunny climate,which necessitates a great need orcooling, and very little or heating.Furthermore, the knowledge that thisparticular tower would stand on anas-yet undeveloped site meant that
requent sand storms would be likely,with implications or external shadingdevices and balconies.
Parameter selectionThe reedom o an undeveloped site,together with the low carbon agenda,provided an initially bewildering set opossibilities. A parametric study wasdecided upon as a suitable starting point.
A number o well dened parameterswere chosen, and each building type wastested against these. The results weregiven a weighting dependant on how
important they were elt to be, thensummed to give an overall score. In thisway, a number o building shapes couldbe tested, and a suitable shape selected.The parameters were:AREA:It was known that the foor area shouldbe around 1,500m², so the rst criterionwas simple to ormulate. Floors with anarea o exactly 1,500m² would receive nopenalty points, and as the foor areadeviated away rom this, increasinglysevere penalty points would be received.The deviation in foor area to the power
o our provided a good compromisebetween allowing some fexibility in foorareas and preventing mis-sized foors.RADIUS:Whilst keeping the foor areas to thecorrect size was airly straightorward, itwas also important that the foors sitabove one another, and not drit too arrom, or too close to, the core. To counterthis, penalty points were earned or anywall vertex that was more than or lessthan 22m rom the origin. Again a powero our relationship was used. So as notto discriminate against buildings with
many corners, the average value o thecorner penalty was used.SOLAR:The third parameter ocused on blockingout as much solar gain as possible,which was dened as the annual directsolar alling on the açade, per area ofoor. This parameter was chosen, ratherthan the more obvious choice o annualdirect solar alling per area o açade,since that would give a star shapedbuilding. A star shaped building would
have the same total solar alling on theaçade as a more conventional building,so there would not be environmentalbenet but the increased açade areawould give a low radiation to area ratio.This is a good example o how thecomputer always nds a solution to theexact question asked, rather thaninterpreting the intent in the way that ahuman designer would.
A computer program was written thattook as input a simple description o thebuilding as a set o coordinates deningthe edge o each foor plate. The outputwas the resultant tness score. Thesolar calculation was handled by aninterace to the highly optimisedradiance ray tracing program, which wasadjusted to give a good balance betweenspeed and accuracy.
The rst run: human generated shapes
The rst set o shapes that were testedoriginated in the minds o the designers.Initially, these were simple extrusions ogeometric shapes, which were tested at anumber o sizes and rotations. Fromthese tests, an octagonal shape achievedthe best tness score o 6.02 (01).
01 Three
shapes
tested,
coloured by
annual solar
intensity,
and viewed
rom the south
The second set o shapes tested thesame foor plates, but with each rotatedon top o the next to provide over-shading (02). These were again tested ata number o sizes and rotations, andagain the octagon achieved the bestresult o 6.59 (although as would beexpected, the triangle shape showed
more improvement, as with ewer sidesthere is more overhang).
Finally, two octagonal ‘fowerpot’ shapeswere tested through a series ooverhangs, rotations and foor sizes (03).With a tness score o 9.9, it was clearthat signicant improvements had been
made.
The second run: computergenerated shapesWith the test times or each case having
been reduced to a ew seconds, it wasnow possible to use the computers tohunt through a series o random shapesto nd some possible solutions whichthe human mind may have missed. Theprocess used was as ollows:
1. Create ten copies o a regularoctagonal building
2. For each building select and move arandom number o walls
3. Check that walls do not overlap. Ithey do, then go back to step 2
4. Test the buildings, and delete all butthe two “best”
5. Cross these buildings to orm eighthybrid buildings6. Repeat rom step 3 or around
three thousand generationsThe initial response produced somesurprising results. The programmesuggested buildings which looked like anumbrella, as the top three foors movedapart to orm shading or the lower foors. Itwas clear that programme was placinggreater emphasis on the benets o theshading than the rules on radius and area.
02 Rotated foor plates
03 Flowerpot shapes
000 200 400 600 800
Summer 2010 Agenda 2

8/7/2019 Agenda-Summer2010 (1)
http://slidepdf.com/reader/full/agenda-summer2010-1 30/42
To overcome this problem, and tointroduce an element o buildability, newparameters were put in place to ensurethat no overhang was at more than a 45degree angle. With this extra condition inplace, more sensible building shapesbegan to emerge.
Every run gave a dierent shape.
Example 04 shows the annual solar on aten storey building, giving a tness o10.37. These results showed that largeareas o the building were tucking inunder the foor above.
The results suggested that the buildingneeded to have some repeatingstructure, which could also have theadvantages o improved buildability andaesthetics. Thereore a condition wasimposed that, ater a given number ofoors, the pattern would repeat. Whilstthis limit will reduce the maximumpossible tness, it also made it easier toget to a good value, as there were ewerpossibilities to work through.
Various numbers o repeating foorswere tried, but the best results wereound with foors that repeated every ourfoor levels. Ater running the model anumber o times, a design (05) wasproduced with a tness actor o 10.8.This represented the best tness actoround in the study, and was theculmination o the automatic stage o theparametric study.
Lessons LearnedThe algorithm enabled the designers togenerate a orm undamentally denedto minimise solar gains and carbonemissions through passive designmeasures, whilst maximising suracearea potential or photovoltaics andnatural light penetration.
At no point was the computer expectedto produce the perect building. Ratherthe hope was that it would provide somepointers that could be picked up bydesigners and incorporated into a moretraditional design.
The lessons learned rom this studyare:• Ioorsaretorepeat,thentheyshould
repeat every our stories• Eachoorplateshouldberound
• Eachoorplateshouldberoughlythe
same size• Overlapsonthenorthsidewillhelp
keep foor plates the correct size• Floorplatesshouldbeeccentric,and
should rotate about the core (06)
The nal designWith these lessons taken on board, aorm was arrived at that rotated aroundthe centre. The window sections o thisaçade are shaded rom the sun. Thesolar interception parts o the açade areto be covered with photovoltaic panels.
The eectiveness o this building canbe seen in the two plots (07) showingannual solar alling on the açade in
kWh/m². The plot on the let shows aview rom below, showing the wellshaded window sections. The plot on theright shows a view rom above, where thewindow sections are almost entirelyshaded.
07 Plots showing annual solar on the acade rom below and above
06 Eccentric foor plates
rotate about the core
05 Design with a tness actor o 10.8
ConclusionDesign solely by computer will not bethe norm at any point in the nearuture, yet there is little doubt thatparametric studies and computeroptimisation are useul and possiblyunderused tools in the designer’sarmoury.
ROB MURPHY IS A SENIOR MODELLING ENGINEER IN
AECOM’S LONDON OFFICE / rober [email protected]
SASHA KRSTANOVIC IS A REGIONAL DIRECTOR IN
AECOM’S LONDON OFFICE /
04 Annual solar or a 10 storey building
0.00000 300.00 600.00 900.00 1200.0
30 Agenda Summer 2010

8/7/2019 Agenda-Summer2010 (1)
http://slidepdf.com/reader/full/agenda-summer2010-1 31/42
A rendering o the nal
building shape with açade
and structural elements.
The building orm maximises
daylight whilst minimising
direct solar gain on the
building envelope. A double
helix spirals asymmetrically
around the central core
and creates a sel-shading
building orm with equal
foorplate areas. The upper
suraces o the spiral
are urther optimised or
maximum solar impact and
are laced with photovoltaics.
Incorporating an active double
skin, the açade, a delicate
geometric ligree, orms a
structural diagrid and urther
shades internal spaces
It is expected thatthis building’s ormand systems willoer a 40%
reduction in‘regulated’ carbonwhen compared to atypical orthogonaloce building oequal area
Summer 2010 Agenda 3
8/7/2019 Agenda-Summer2010 (1)
http://slidepdf.com/reader/full/agenda-summer2010-1 32/42
Spirit o
the ageThe rst new whisky distillery to be built in Scotland orthirty years demanded some radical structural and servicesengineering thinking, reports Nathaniel Buckingham
32 Agenda Summer 2010

8/7/2019 Agenda-Summer2010 (1)
http://slidepdf.com/reader/full/agenda-summer2010-1 33/42
E ver-increasing demand or luxury
scotch whisky encouraged drinkscompany Diageo to build the rstnew large-scale distillery in
Scotland or a generation, near Elgin in theSpey Valley.
The whisky produced at this plant willgo into blends such as Buchanan’s,Johnny Walker, Bells and J&B. With theexpectation that the distillery willproduce signicant volumes o spirit, thecapacity is 10 million litres per year, in
contrast to the average distillery capacityo about 3 million litres and the currentlargest distilling capacity o 6 millionlitres.AECOM provided all non-processconsultancy services or the distillery,twenty our dierent disciplines in all,with Diageo providing process designservices. Architecture and costconsultancy were sub-consulted toAustin Smith Lord and Summers Inmanrespectively.The project began with a easibility studyin January 2007, and ater AECOM won thedesign contract the ollowing April, workcommenced on site in October 2007.The 3000m2 building is 150m long andranges rom 20-30m in width. At one endthe distillery foor has to bear anunusually heavy load - ourteenermentation tanks weighing 150 tonneseach, supported on bespoke struts.Fourteen traditional copper whisky stillseach weigh 30 tonnes; alongside two 120tonne mashing tuns and twentycondensers each weighing 7 tonnes.
The oundationsWith the large weights involved in thisbuilding, the ground beneath neededconsiderable stabilising, with vibro-stone columns providing oundationsupport. Normally a scale test would beconducted to conrm the bearingpressure could be achieved, but owing tothe high loads to be applied, a zone testwas carried out with up to 2,250kN opressure used to simulate the actual
...the distillery foor has to bear an unusuallyheavy load - ourteen ermentation tanksweighing 150 tonnes each...
The superstructure is ormed rom 900 tonnes o steelwork
load. Instead o the expected 12mmsettlement, just 6.5mm occurred, whichgave condence in the technique usedand the modied ground capacity. Abearing pressure o up to 250kpa at theheavy end was delivered through 1,500vibro-stone columns - 600mm eachdiameter.
The superstructureThe superstructure is ormed rom900tonnes o steelwork, galvanisedbecause o the location and exposure togive a longer design lie. The walls andceilings are braced rame, leaving thestructure largely open-plan anddesigned to allow easy maintenance othe process tanks and still. The ceilinghas structural redundancy, allowing theroo to be removed in case theermentation units need to be replaced.Similarly, replacing a copper still is arelatively common job, achieved byintegrating vehicular access in thecentre o the still house which couldaccommodate a mobile crane ormaintenance and replacement works.
SustainabilityThe distillery was built with sustainabilityin mind, with Diageo was determined thatthe plant should be both technically andenvironmentally advanced. The result isone o the greenest distilleries inScotland, earning a BREEAM Excellentrating in recognition o the ecientdesign and methodologies usedthroughout the project.
The two ingredients in whisky making,apart rom barley, are energy and water,which produce the steam necessary ordistillation. From the start, it wasapparent that the building and theprocess it houses had to becomeintegrated, reusing the heat and watergenerated rom the distilling process.The water reclamation plant on site putsthe liquid by-product rom the distillerythrough a treatment process that willsave roughly the equivalent o the annuawater demand o the distillery, about300,000m3 per year.
Diageo also saw an opportunity to saveyet more energy by recovering some othe waste heat rom the distilling
Summer 2010 Agenda 3
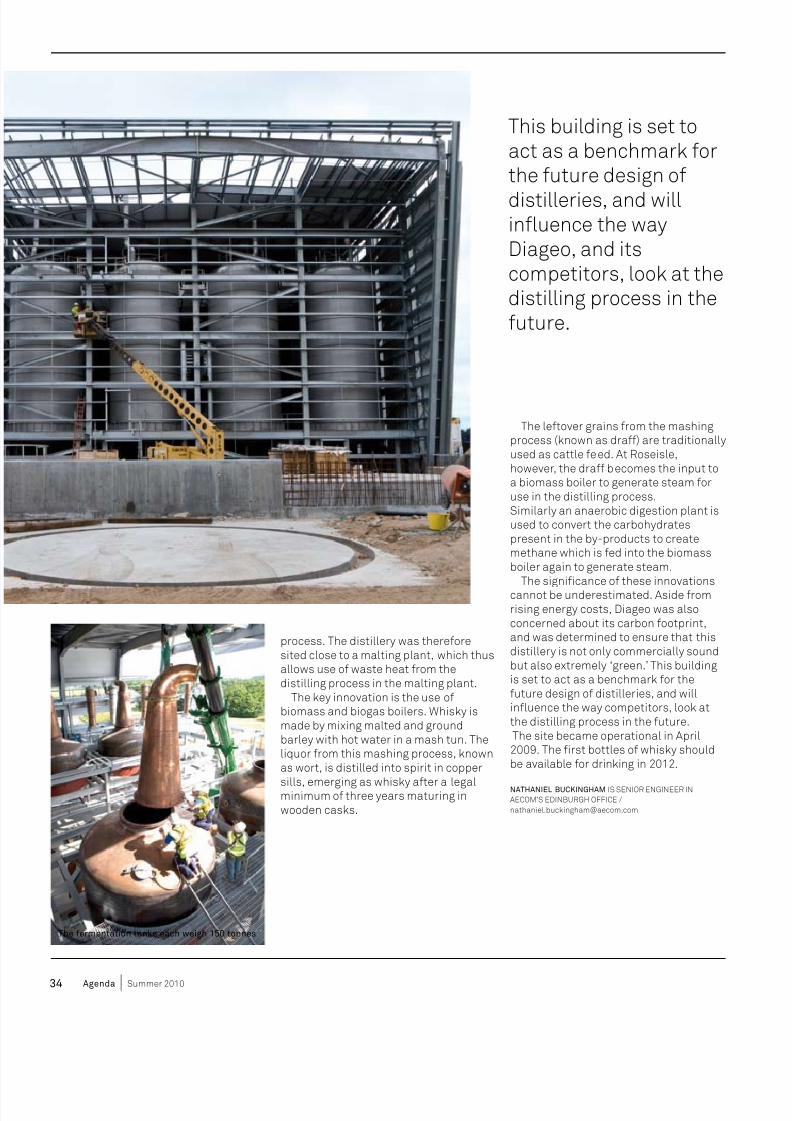
8/7/2019 Agenda-Summer2010 (1)
http://slidepdf.com/reader/full/agenda-summer2010-1 34/42
The letover grains rom the mashingprocess (known as dra) are traditionallyused as cattle eed. At Roseisle,however, the dra becomes the input toa biomass boiler to generate steam oruse in the distilling process.Similarly an anaerobic digestion plant isused to convert the carbohydratespresent in the by-products to createmethane which is ed into the biomassboiler again to generate steam.
The signicance o these innovationscannot be underestimated. Aside romrising energy costs, Diageo was alsoconcerned about its carbon ootprint,and was determined to ensure that thisdistillery is not only commercially soundbut also extremely ‘green.’ This buildingis set to act as a benchmark or theuture design o distilleries, and willinfuence the way competitors, look atthe distilling process in the uture.The site became operational in April2009. The rst bottles o whisky shouldbe available or drinking in 2012.
NATHANIEL BUCKINGHAM IS SENIOR ENGINEER IN
AECOM’S EDINBURGH OFFICE /
This building is set toact as a benchmark orthe uture design o
distilleries, and willinfuence the wayDiageo, and itscompetitors, look at thedistilling process in theuture.
The ermentation tanks each weigh 150 tonnes
process. The distillery was thereoresited close to a malting plant, which thusallows use o waste heat rom thedistilling process in the malting plant.
The key innovation is the use obiomass and biogas boilers. Whisky ismade by mixing malted and groundbarley with hot water in a mash tun. Theliquor rom this mashing process, knownas wort, is distilled into spirit in copper
sills, emerging as whisky ater a legalminimum o three years maturing inwooden casks.
34 Agenda Summer 2010

8/7/2019 Agenda-Summer2010 (1)
http://slidepdf.com/reader/full/agenda-summer2010-1 35/42
...the key innovation is
the use o biomass andbiogas boilers...
Giant copper sills hold liquor made rommashing malted and ground barley
Summer 2010 Agenda 3

8/7/2019 Agenda-Summer2010 (1)
http://slidepdf.com/reader/full/agenda-summer2010-1 36/42
A combination o cutting edge science and pure common sense,along with some dramatic practical testing underpins the
engineering design or Halley VI Michael Wright and Peter Ayresreport on designing or the extreme Antarctic environment.Snow business
36 Agenda Summer 2010

8/7/2019 Agenda-Summer2010 (1)
http://slidepdf.com/reader/full/agenda-summer2010-1 37/42
“THE ANTARCTIC ICE
SHEET CONTAINS
OF THE ICE ON EARTH”90%
Snow is not something that manyengineers need to think about,other than in terms o imposedsnow load on roos. However, or
the scientists with British AntarcticSurvey (BAS) who live and work in extremeconditions, coping with the eects osnow takes on a whole new agenda.
Snow modelling and ComputationalFluid Dynamics (CFD) analysis was acritical issue or the design teamresponsible or delivering the new HalleyVI Antarctic research station or BAS. Atthe bottom o the world, snow is thedominant element which shapes andcontrols the natural environment. In thedry, reezing climate, its characteristicsare dry, ne, powdery and crystalline,made up rom particles o ice as small asgrains as sand.
The powdery Antarctic snow behaveslike sand too, driting and eddying across
the rozen landscapes as it is lited anddropped by Antarctic winds. Likeeverything else in this enormous rozencontinent, wind speeds are extreme, withgusts in total wipeout conditions reaching
over 100 mph. On days when extremeblows set in, the powdery snow can beeasily blown into drits, banking upagainst the smallest o obstaclesstanding in the way o the prevailingeasterly winds.
The sudden appearance o new snowdrits is a real and present danger or the
scientists who live and work at Halley. Intotal whiteout conditions, a drit can ormalmost instantly, with snow piling upagainst anything let outside. It is notunknown or vehicles and people to crashinto newly ormed drits o snow thatsimply were not there a ew hours beore.
Snow banking against buildings alsocauses a major problem, meaning thatthe research station itsel must to beraised in order to stay above the rozensurace. Dealing with the snow pilingagainst the buildings is high maintenance,but an essential activity in order or the
structures to remain sae.Snow blowing over an object has itsown perormance characteristic – risingover the obstruction to settle urtherdownwind, causing a wind tail. A wind tail
rom an oil drum can stretch or manymetres. Standing into the wind, the BASbuildings create huge wind tails odeposited snow hundreds o metresdownwind.
An extra issue is that the wind tail itselcan, once settled on the surace ice,become a generator o urther downwind
snow accumulation. It’s the sameprinciple that sees sand dunes developand then move across open desert.
The new Halley VI Research Station is tobe located on the Antarctic Brent IceShel, a remote site a long way romanywhere, but in ull ace o anunrelenting wind. The challenge acing thedesign team was to ully understand thebehaviour o the snow in this extremeenvironment in order to ensure the newbuilding can stand robustly in the harshconditions without being constantlyenguled in massive snowdrits.
In broad terms, the team needed tounderstand the movement o snow, areaso wind scoop and snowdrit that caninstantly maniest downwind o objectsas a product o wind speed.
Summer 2010 Agenda 37

8/7/2019 Agenda-Summer2010 (1)
http://slidepdf.com/reader/full/agenda-summer2010-1 38/42
How snow modelling inormed the design o Halley VI
The design o Halley VI ollowed astructured process to allow the designteam to actor in as much inormation as
possible in a sequenced phase.
STAGE ONE: The competition
The rst stage in the process began withAECOM working closely in collaborationwith Hugh Broughton Architects todevelop a competition entry that
attracted the interest o the BritishAntarctic Survey judges.
The original design concept was aseries o structures standing high onlegs above the snow, clustered arounda central pod. During a pre-judging
consultation meeting, BAS wasattracted to the concept but pointedout that, with the wind continuallyblowing rom one direction, it did not
matter which way the cluster wasorientated, as any building downwindo another would soon be covered in
snow due to the wind tail eect. BASwas keen to develop a research stationthat had a predictable wind tail whichcould be managed.
A visit to Antarctica during thecompetition phase was criticallyimportant in understanding the
importance o orientating the station tominimise snow drit problems, andhelped guide the early design. The
cluster concept was reconsidered, and alinear ormation o building pods thatwould stand robustly perpendicular tothe wind was proposed instead. With
this crucial amendment, AECOM’ssolution was chosen as the winningentry.
STAGE TWO: Detail designThis stage in the development o the icestation provided the team with the
opportunity to get to grips with the
problems that snow and wind canpresent to a building in the Antarctic. Aconsultation with BAS Scientist Phil
Anderson provided valuable hands-on
and theoretical knowledge about thebehaviour o the weather and thecharacteristic outcomes o major blowso snow.
The inormation enabled the design
team to develop a series o buildingsraised on legs up to our metres abovethe ice, and congured in a long lineoriented to be perpendicular to theprevailing wind. This simple solutioncreated a space underneath thebuildings to allow the wind to blow
through the void when it hits the
buildings side-on. An aerodynamicshape unnels the wind under and overthe buildings, keeping the wind speedhigh beneath the elevated platorm. Thehigh wind speeds keeps the ice particlesrom depositing beneath the platorm,
leading to snow being deposited up to500m downwind o the platorm.
STAGE THREE: Specialist CFDanalysis and modellingAt this point, the design teamcommenced work with AECOM’s
in-house CFD team to develop a ull CFD
analysis o the driting patterns o snowormed around the elevated linearplatorm.
However, the team was never reallysatised with the results o the CFDanalysis, with the engineers aware that
an incorrect analysis had led toproblems with driting at existingAmerican South Pole buildings. Modeltesting in the laboratory using ultra nemicro-silica particles was considered,but it was ound that the Americans hadexperienced unreliable results rom this
method as well. A chance comment romPhil Anderson, who mentioned that thescaling eect at Halley V resulted insimilar driting patterns, gave the teamthe idea to send scale models o the newresearch station to Antarctica ortesting.
A 1:50 scale model o the currentHalley V base was produced, as well as amodel o the new Halley VI base.A comparison o the perormance o thetwo models would enable the team to
gauge whether the drit patternsresulting rom the scaled models wouldbe close to the known drit patternexperienced at the raised Halley VI
platorm.When placed outside in winds blowing
in excess o 20 knots, it only took a ewhours or the drit (in scaled terms) thatbuilt up against each o the models torepresent up to ve years o snow dritagainst the ull size building. The resultswere remarkable. The drit pattern
shown by the Halley V model wasidentical to the driting experienced bythe actual base (01 and 02).
Once it was known that the scalinggave a reliable result, the ocus turned
to on the drit pattern experienced bythe Halley VI model. With its
aerodynamic shape aecting snow buildup, the model’s perormance in thesame wind blow was identical topredictions made by the design team.The area beneath the building had beenkept clear o driting snow and, aspredicted, a wind tail had been created
downwind o the elevated platorm (03 and 04).
Current statusThe rst construction season included
the cladding and elevating o one o thenew station’s distinctive accommoda-
tion modules. This module has nowstood on the ice or two completewinters. The snow prole and dritcreated has been so close to the dritsdemonstrated in the model testing thatone member o the BAS teamcommented ‘it’s almost as i the snow
knows what it is expected to do’. The utureThe second two-month construction
season, which started in January 2010,saw the cladding o all the modulescompleted. A urther construction
season is needed or internal t-out in2011, with plans on schedule or the newbase to be nished in 2012.
Original design concept
38 Agenda Summer 2010

8/7/2019 Agenda-Summer2010 (1)
http://slidepdf.com/reader/full/agenda-summer2010-1 39/42
Wind gusts, in total white out conditions reach over
100 MPH
Snow how: [frequently used snow terms]
Wind tail Anything let standing on the surace o the ice acts as an
obstruction to the wind when it blows across the surace. As the
wind hits the obstructing object, it accelerates, picking up more
surace snow particles into the ast-moving air and generating a
wind scoop o cleared snow immediately around the object.
Once the wind has passed over and around the object, eddies
orm as it passes behind. The slower moving air generated by the
eddies cannot hold the weight o the minuscule pieces o rozen
ice and they drop back to the surace, creating drits o snow
downwind o the obstruction.
Saltation Snow in the Antarctic has its own behavioural
characteristics that mirror the behaviour o ne desert sands. The
ne particles are easily picked up by gusts o wind, to be carried
along the surace in eddies beore alling out o the air back onto the
icy surace. In this way snow can be skipped along in considerable
volume, with the reezing particles landing in drits when the windslows to a speed where the particle becomes too heavy to be carried
along, in a process called saltation.
With the prevailing wind driving the ne snow particles across
the surace or thousands o uninterrupted miles, any man made
intervention, whatever the size, rom single ence post to ull scale
ice station, that is introduced into the Antarctic landscape will
immediately have a local impact upon the behaviour o any snow
that blows up against it.
Spindrit The ice crys tals that are blown across the ice shel vary
in size down to particles the size o dust. The ne particles are
prone to spin drit – being blown into every nook and cranny, just
like ne particles o sand on a beach. A storage container let on
the ice in a gale with a damaged silicone door seal will quickly llup with spindrit.
MICHAEL WRIGHT IS A REGIONAL DIRECTOR IN
AECOM’S ST ALBANS OFFICE AND IS LEAD STRUCTURAL
ENGINEER FOR HALLEY VI / [email protected]
PETER AYRES IS STRATEGIC DEVELOPMENT DIRECTOR,
BUILDING ENGINEERING, AND IS THE HALLEY VI
DESIGN TEAM DIRECTOR / [email protected]
BOTH MICHAEL AND PETER HAVE SPENT TIME IN
ANTARCTICA WORKING ON THE HALLEY VI PROJECT
02
03
04
01
Summer 2010 Agenda 39

8/7/2019 Agenda-Summer2010 (1)
http://slidepdf.com/reader/full/agenda-summer2010-1 40/4240 Agenda Summer 2010
Facing up to
açadesaçades
Growing recognition othe interactionbetween a building’saçade and its servicesis creating a need or
tighter integration between all othe disciplines that make up adesign team. The role o theaçades specialist is to assimilateinormation and views romdierent parties to arrive at acompromise that is acceptable.
GRAHAM FAIRLEY: The açadesspecialist is essentially a ‘wellinormed generalist’ with theability to see things rom thearchitect’s perspective, but whiletaking on board the views andrequirements o other members othe design team. The importantthing is to be able to have adialogue with all o these peopleand go to the architect and theclient with something close towhat they want, that also satisesthe requirements o the quality
surveyor as well as otherdisciplines.What we mustn’t orget is that
the client normally goes to thearchitect because he/she likestheir creative work. The açadesspecialist can help to guide thebuilding design to a completesolution that is right in terms ocost and environmentalperormance, as well as thevisuals.
ANT WILSON: It’s certainly truethat each discipline placesdierent requirements on theaçade. The building servicesengineer wants the structure’senvelope to minimise heattranser, allow natural daylight inand optimise solar heat gains. Thestructural engineer is moreinterested in expansioncoecients, defections, loadbearing etc. It’s also important toconsider buildability and
maintainability. For example, i abuilding is covered with brisessoleil, how easy will it be to get awindow cleaning cradle intoposition?
The açade engineer has todecide what is sensible, look at thealternatives, negotiate with thedierent parties and come up withan aesthetic solution that isacceptable to the architect.
GF: There’s no doubt that mostbuilding projects require some
compromise rom the architectbut i you ask architects what theycan live without, you can thenstart to understand where there isroom or manoeuvre. For example,it might be that the structuralengineer wants mullions o acertain width, but this doesn’tcorrespond to the architect’svision. However, a dierent designo mullion might satisy bothrequirements.
Façade engineering plays an increasingly important role in the designo sustainable buildings. Here, Graham Fairley and Ant Wilson discussthe role o the açades specialist.

8/7/2019 Agenda-Summer2010 (1)
http://slidepdf.com/reader/full/agenda-summer2010-1 41/42
Summer 2010 Agenda 4
AW: For those reasons, it’sessential that the açade engineeris involved early on in the project.To some extent this is driven bydevelopers, who need to satisyplanning requirements, and wantmore inormation at an earlier
stage.Another important point is that
i the building services engineergets early involvement in theaçade design, it is oten possibleto save on the services solutions.That is much better than having todesign services which compensateor ailings in the açade.
GF: One issue that can’t beoverlooked is the dichotomybetween what drives the architectand what drives the engineer. The
base driver or the architect is thevisual expression o the building.
In my experience problemsoccur in this relationship when thearchitect wants to achievesomething or what could beconsidered a purely visual reason- but this may not be the besttechnical solution. For instancesome years ago I was working onone particular project where thecladding included a triple glazedsystem with a mechanicallyventilated cavity. The servicesengineer wanted a certain type oglass which was very unsightly. Itprovided the best (i not the only)technical solution but, believe me,it ruined the visual statement thatthe architects were trying toachieve. The issue was eventuallyresolved ater a series o long,hard and laborious discussions.
Conficts o interest occur all thetime and, given that perormance-driven criteria are becoming moreand more o a primary driverduring the design development obuilding envelope systems, thisissue will come increasingly to theore. Essentially, the architect isno longer solely in charge o thebuilding envelope.
AW: Underlying all this is the actthat architects and engineers havebeen trained to make decisions indierent ways. Architects tend tosee things rom a more subjective
point o view and processinormation in a dierent way toengineers. Engineers considerthings in more black and whiteterms. It is possible to have a rightand a wrong answer whereas, inarchitecture, the reasons or this
or that decision are otenmotivated by instinct. It’ssometimes dicult or theengineer to understand the needto run another set o calculationsor redo the computer model basedpurely on a eeling that it isn’t‘quite right’ – especially when theengineer knows that what hasbeen produced works andprovides the right technicalsolution.
GF: To meet new legislation, the
technical perormance criteria obuilding envelope design havebecome so much moreperormance-driven thatengineers and buildingtechnologists are now irmly inthe driving seat. However, thereis no point in creating anenvelope system or a buildingwhich ticks all the perormanceboxes but looks like a car crash.
However, the architect/engineer relationship is evolving.More engineers are willing to
engage with the architect,appreciate the visionary drivers,understand the bigger pictureand go just that bit urther to inda solution that not only providesthe right technical perormancebut also doesn’t capsize thevisual boat. At the same time,more architects understand thatit is pointless having a wonderullooking açade i it ails toprovide the right perormancelevels.
AW: Basically, as engineers, wewant everything to be correct -but how do we deine ‘correct’?I we’ve ollowed all o theprocedures laid down in theregulations, it’s correct rom acompliance point o view butthat doesn’t mean it’snecessarily right, because thedeined procedure may not takeaccount o all the variables. In
the real world, compliancechecking has to make thingssimpler than they really are.
For design conditions anduture robustness we may need toanalyse beyond the requirementso compliance, taking into
account climate changeadaptation based on the recentUKCP09 data. That’s why a açadespecialist who has a goodoverview o the whole situationor any new building project isvery important in understandingthe implications o what is beinganalysed and providing a sensibleperspective. Fundamentally, theaçade engineer is there to injectreality into the situation and toensure we give our clients goodbuildings that work well in real
situations.
ANT WILSON (LEFT) IS A BUILDING SERVICES
ENGINEER AND DIRECTOR OF SUSTAINABILITY
WITH AECOM / [email protected]
GRAHAM FAIRLEY (RIGHT) IS AN ARCHITECT AND
DIRECTOR OF FAÇADES WITH AECOM /

8/7/2019 Agenda-Summer2010 (1)
http://slidepdf.com/reader/full/agenda-summer2010-1 42/42
Agenda is the global technical journal o Building Engineering at AECOM
AGENDA is the proessional bi-annual global journal or Building Engineeringt AECOM. Technical papers submitted to AGENDA are reviewed by anditorial board and peer-group veried.
Contact:[email protected]