agenda - elisa 2010 english.pdfactive 3g users active gprs users 15 number of active mobile data...
TRANSCRIPT


Agenda
CEO’s reviewVeli-Matti Mattila, CEO
Financial reviewJari Kinnunen, CFO
2

CEO’s review
• 2010 overview• Q4 2010 financial and operational highlights• Segment review• Strategy execution• Progress of new services and smartphone market• Outlook for 2011
3

2010 highlights
• Revenue growth above industry average• Profitability at good level• Strong mobile subscription growth• EBITDA was in line with guidance given in the beginning of 2010• In 2010 profit distribution was EUR 1.42 per share, pay-out ratio 126%• Success of Elisa Viihde IPTV continued• ICT offering extended, new acquisitions• 3G success continues, strong growth in smartphone market at year-end• Dividend proposal: EUR 0.90 per share
– Authorisation for additional dividend of EUR 0.40 and 5m share buy-back
4

2010 financial highlights
2010 Change in 2010
Revenue € 1,463m +2%
EBITDA € 485m 0%
Earnings per share * € 1.15 +2%
CAPEX € 184m +7%
Cash flow * € 212m -16%
Net debt € 776m + 8%
5
* Excluding one-off items
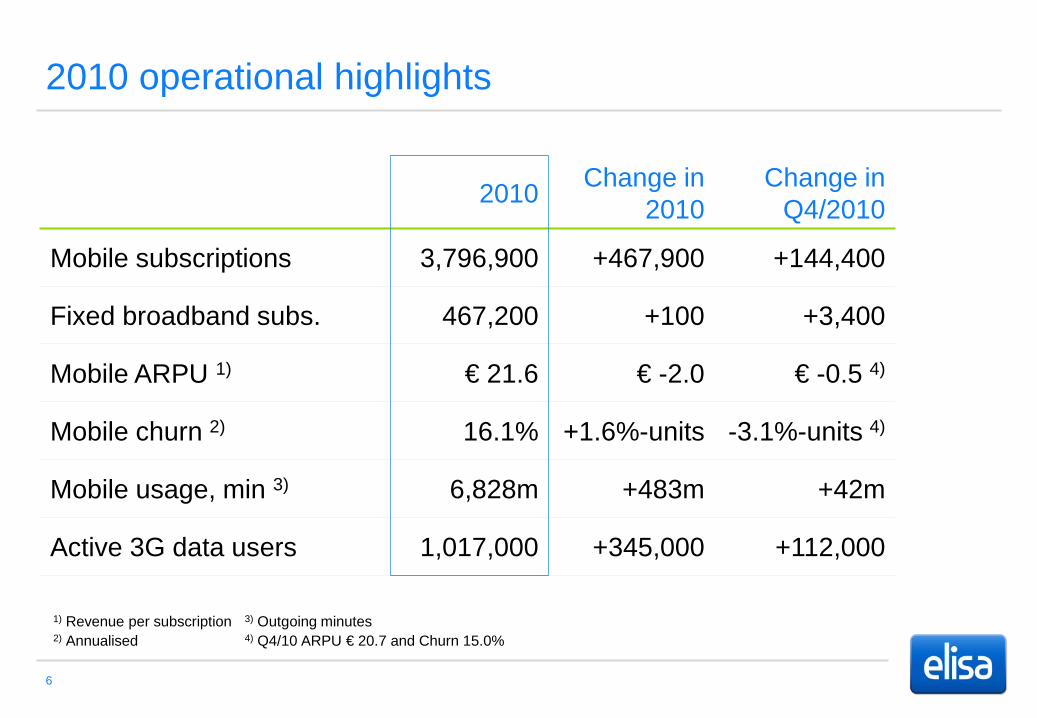
2010 operational highlights
2010 Change in 2010
Change in Q4/2010
Mobile subscriptions 3,796,900 +467,900 +144,400
Fixed broadband subs. 467,200 +100 +3,400
Mobile ARPU 1) € 21.6 € -2.0 € -0.5 4)
Mobile churn 2) 16.1% +1.6%-units -3.1%-units 4)
Mobile usage, min 3) 6,828m +483m +42m
Active 3G data users 1,017,000 +345,000 +112,000
6
1) Revenue per subscription 3) Outgoing minutes 2) Annualised 4) Q4/10 ARPU € 20.7 and Churn 15.0%

Q4 2010 highlights
• Revenue growth was stronger than in previous quarters• Profitability was at a good level, cash flow was affected by
non-recurring CDO guarantee settlement• Mobile subscription base and usage continued to increase• Growth in 3G data services was good• Elisa Viihde IPTV service improved further• Appelsiini acquisition strengthened ICT offering• Smartphone market improved briskly
7

Q4 2010 financial review
Revenue growth continued
• Revenue € 383m (365)– Growth in mobile services, especially
data services and smartphones– Decrease in fixed line business– Growth in online and ICT service
business• EBITDA € 123m (121)• CAPEX € 56m (61), 15% of revenue
– Full year CAPEX according to target, 12% of revenue
• Net debt € 776m (719)– Cash flow € 28m– Net debt / EBITDA 1.6 (1.5)
8
372
351 355 360 365353
364 363
383
35 %33 % 33 %
36 %
33 % 33 % 33 %35 %
32 %
Q4/08 Q1/09 Q2/09 Q3/09 Q4/09 Q1/10 Q2/10 Q3/10 Q4/10
Revenue, EURm EBITDA-%

Q4 2010 operational highlights
Strong mobile subscription growth continued
• 144,400 new subscriptions in Q4– Growth in both customer segments– Growth in mobile broadband and 3G
subscriptions– Estonia +36,400 subscriptions
• Growth in fixed broadband continued– 3,400 new subscriptions in Q4
9
2 8803 026
3 153 3 2183 329
3 4323 550
3 6523 797
502 495 482 476 467 462 462 464 467
Q4/08 Q1/09 Q2/09 Q3/09 Q4/09 Q1/10 Q2/10 Q3/10 Q4/10
Mobile subs ('000) Fixed broadband subs ('000)

Q4 2010 operational highlights
Churn decreased QoQ
• Growth in mobile services – Outgoing minutes growth +6% YoY– SMS growth +10% YoY
• Mobile churn 15.0% (14.7)– Churn dropped from previous quarter– Keen competition will continue
10
1 527 1 525
1 589 1 586
1 645 1 652
1 719 1 7071 74912,0 %
14,0 %14,7 % 14,5 % 14,7 %
15,4 % 15,9 %
18,1 %
15,0 %
Q4/08 Q1/09 Q2/09 Q3/09 Q4/09 Q1/10 Q2/10 Q3/10 Q4/10
Usage (outgoing minutes, million) Churn

Business Segments
11

Q4 2010 Consumer Customers
Growth in mobile usage and handset sales
• Revenue € 229m (217)– Growth in mobile customer billing,
handset sales and online services– Decrease in fixed business
• EBITDA € 71m (71), 31% of revenue– Decrease in SAC per subscription – Increase in sales costs
• CAPEX € 31m (33)
12
217
202209
220 217 214 217225 229
33 %32 %
33 %
37 %
33 %34 %
31 %
34 %
31 %
Q4/08 Q1/09 Q2/09 Q3/09 Q4/09 Q1/10 Q2/10 Q3/10 Q4/10
Revenue, EURm EBITDA-%

Q4 2010 Corporate Customers
Solid performance in the fourth quarter
• Revenue € 154m (148)– Growth in mobile customer billing and
online services– Acquisitions increased revenue– Decrease in fixed business
• EBITDA € 52m (50), 34% of revenue– Revenue growth
• CAPEX € 25m (28)
13
155150
146
139
148
139
147
139
154
37 %34 %
33 %
36 %34 %
31 %
34 %36 %
34 %
Q4/08 Q1/09 Q2/09 Q3/09 Q4/09 Q1/10 Q2/10 Q3/10 Q4/10
Revenue, EURm EBITDA-%

14
Integration of One Elisa
New services and new markets
Strengthening marketposition in core markets
Strategy execution

More than one million 3G data users
1972
112153 173 198
249 282326
374425
496 523569
636 672 709
807
905
1017
398490 526
627 595668 703 740
701790 789
914843
937993
1044 1051
1221 12551308
Q1/06 Q2/06 Q3/06 Q4/06 Q1/07 Q2/07 Q3/07 Q4/07 Q1/08 Q2/08 Q3/08 Q4/08 Q1/09 Q2/09 Q3/09 Q4/09 Q1/10 Q2/10 Q3/10 Q4/10
Active 3G users Active GPRS users
15
Number of active mobile data users in Elisa’s network, thousands

Good growth in mobile broadband and smartphones
• Every fifth subscription includes mobile broadband service
• Smartphone penetration more than doubled, still significant growth potential
• Smartphones top the list of most sold phones
– 45% of all models sold were smartphones in Q4
– Wide assortment of different price categories
16
11,5 %
15,0 %
17,5 %
19,0 %
0,4 % 0,5 %1,5 %
3,5 %
Q1/10 Q2/10 Q3/10 Q4/10
Mobile broadband penetration 1) Smartphone penetration 2)
1) Dongles and mobile BB add-on services of the total subscription base2) iOS, Android and Symbian 3^ phones of the total phone base
Penetration in Finland

Fast development in smartphone and application market
• Applications increasingly popular– Facebook and other social media– E-mail and navigation– Games, like Angry Birds
• Smartphones use over 300 MB of data per month
17
0
100
200
300
400
500
600
700
ZTE Blade
HTC Desire
Nokia N8 iPhone 4 Samsung Galaxy S
MB/month Smartphone data usage in January 2011

Elisa Viihde IPTV developed further
• Elisa Viihde application for Android phones
– Scheduling programs– Recording the programs
• World exclusive for unique NHL content
– Summary of the Finnish players’ performance
18

IT outsourcing services added to Elisa’s offering
• Acquisition of Appelsiini Finland– Revenue EUR 13m– 150 employees
• Elisa ICT services – Customised business solutions– Workstations– Server systems– Data center services and networks
• SME as a target• Expanded to nationwide service
19

Telepresence video conference on tablets
• World’s first– Android application enabling video
conference attendance irrespective of time or place
– Technology provided by Vidyo, Inc
• Smartphone or tablet as a terminal– For example Samsung Galaxy Tab
20

Outlook for 2011
• Positive trends of the general economy have continued
• Competition remains challenging
• Revenue increase slightly
• EBITDA excluding one-offs improve slightly
• CAPEX maximum 12 per cent of revenue
21

Mid-term targets by end-2011
22
1.5 - 2x> 35%
10 - 12%
Above 35%
Above industry average
Target
1.6x43%
12%
33%
Elisa +1,5%Indstry -2,7%*
Status 2010
* European operators’ YoY cumulative Q1-Q3/2010 domestic revenue growth. Peer group companies: Belgacom, BT Group, Deutsche Telecom, Elisa, France Telecom, KPN, OTE, Portugal Telecom, Swisscom, Telecom Austria, Telecom Italia, Telefonica, Telenor and TeliaSonera. Source: Company reports.
Capital structureNet debt / EBITDA
Equity ratio
CAPEX-to-sales
EBITDA-margin
Revenue growth
Parameter

Mid-term targets by end-2013
23
Capital structureNet debt / EBITDA
Equity ratio
CAPEX-to-sales
EBITDA-margin
Revenue growth
1.5 - 2x> 35 %
≤ 12 %
Above 35 %
Above industry average
TargetParameter

Agenda
CEO’s reviewVeli-Matti Mattila, CEO
Financial reviewJari Kinnunen, CFO
24

Revenue and EBITDA in line with guidance
EUR million Q4/10 Q4/09 Δ 2010 2009 ΔRevenue 383 365 18 1463 1430 33Other operating income 2 2 5 4 1Operating expenses -262 -246 -16 -984 -951 -33
EBITDA 123 121 2 485 484 1EBITDA-% 32% 33% 33% 34%Depreciation and amortisation -55 -57 2 -217 -216
EBIT 69 64 4 268 267 1EBIT-% 18% 18% 18% 19%
Profit before tax 66 56 10 197 235 -38Profit before taxes w/o one-off 1) 61 56 6 237 235 2Income taxes -15 -15 -47 -58 11
Profit for the period 52 41 11 151 177 -26Profit for the period w/o one-off 1) 48 41 7 180 177 3EPS, EUR/share 0.33 0.26 0.07 0.96 1.13 -0.17EPS w/o one-off 1) 0.31 0.26 0.05 1.15 1.13 0.02
25
1) Non recurring item: CDO guarantee settlement

Full year revenue change
26
18
75
2010
1463
Corporate Customers
Consumer customers
Equipment salesInterconnection and roaming
3
2009
1430 + Mobile+ Online Services+/- Cable TV- PSTN- Estonia- Broadband
+ ICT services+ Organic+ M&A
+ Mobile+ Estonia - PSTN
+ Volume- MTR price

Equipment sales and acquisitions affected OPEX
• OPEX decreases– Network operating expenses– Interconnections and roaming– Credit losses lower– Productivity improvements
• OPEX increases– Cost of equipment sales– Structural changes:
– M&A Videra and Appelsiini– Personnel expenses
– Salary increases based on collective labor agreements 1.10.2010
– 181 persons in acquired companies– Call center and customer service
personnel increase
27
EURmQ4 09
Q1 10
Q2 10
Q3 10
Q4 10
Materials and services 144 140 148 148 163
Employee benefit expenses 51 55 52 46 55
Other operating expenses 50 43 46 42 44
Total expenses 246 238 247 237 262
Depreciation 57 54 54 54 55

CAPEX/Sales in line with guidance
• Total CAPEX in Q4 EUR 56m (61)– CAPEX/Sales 15% (17%)
• Total CAPEX 2010 EUR 182m 1) (171)– CAPEX/Sales 12% (12%)
• Q4/10 by segments– Consumer EUR 31m (33)– Corporate EUR 25m (28)
• Major CAPEX areas– 3G network– Fixed access and backbone networks– IT systems– Customer equipment
28
36
18 19 22
33
2227 26
31
28
16 1719
28
15
2016
25
2
5 1 2
11
4
20
17 %
10 % 10 %11 %
17 %
11 %13 %
11 %
15 %
-20 %
-15 %
-10 %
-5 %
0 %
5 %
10 %
15 %
20 %
Q4/08 Q1/09 Q2/09 Q3/09 Q4/09 Q1/10 Q2/10 Q3/10 Q4/10
Consumer Corporate Shares 2) Capex/Sales
1) Excluding of shares or acquisitions of business assets 2) Including acquisitions of business assets

Cash flowEUR million Q4/10 Q4/09 Δ 2010 2009 ΔEBITDA 123 121 3 485 484 1Change in receivables -2 10 -12 2 36 -34Change in inventories -3 -7 -6 -9 3Change in payables 23 23 11 10 1
Change in NWC 18 26 -8 7 37 -30Finance income and expenses -1 -1 -28 -30 2CDO Guarantee settlement 1) -40 -40 -40 -40
Financials (net) -41 -1 -40 -68 -30 -38Taxes for the year -6 -11 5 -47 -55 8Taxes for the previous year -6 -2 -4
Taxes -6 -11 5 -53 -57 4CAPEX -55 -61 6 -182 -170 -12Investments in shares -10 0 -10 -19 -10 -9Sale of assets and adjustments -1 0 0 2 -2 4Cash flow after investments 28 74 -46 172 252 -80Cash Flow after investments without non recurring items 68 74 -6 212 252 -40
29
1) Non recurring item

Good subscription growth in Estonia
• Revenue flat, market share increased– Market share 26%, up 3 percentage units– Mobile broadband is picking up
• EBITDA decreased– Strong growth in mobile
– + 80 100 YoY, + 36 400 QoQ– Increased competition
• CAPEX– 3G Coverage
• 4G license awarded
30
2321 21 21 21 20
21 22 22
39 %
36 % 36 %35 %
32 % 31 %28 %
34 %
24 %
Q4/08 Q1/09 Q2/09 Q3/09 Q4/09 Q1/10 Q2/10 Q3/10 Q4/10
Revenue EBITDA-%
EUR million Q4/10 Q4/09 2010 2009
Revenue 22 21 84 84EBITDA 5 7 25 29
EBITDA-% 24 32 29 34EBIT 2 4 13 18
EBIT-% 11 18 16 21CAPEX 4 3 10 7

Liquidity position is good
• Cash and undrawn committed facilities EUR 299m (324m)
• Revolving Credit Facilities– EUR 170m maturing Jun 2012– EUR 130m maturing Nov 2014– EUR 32m drawn Q4/10
• Commercial Paper Program– EUR 102m in use
• Credit ratings constant since 2003– S&P BBB/Stable outlook– Moody’s Baa2/Stable outlook
31
Bond and Bank loan maturities
226
75
300
10
10 10 10 10
2011 2012 2013 2014 2015 2016 2017 2018
Bonds Loans

Capital structure in line with targets
• Capital structure – Net debt / EBITDA 1.6– Gearing 93%, Equity ratio 43%
• Target setting– Net debt / EBITDA 1.5 – 2x– Equity ratio >35%
32
812 854 773 729 719817 752 725 776
1,71,8
1,61,5 1,5
1,7
1,5 1,51,6
43 % 41 % 45 % 48 % 46 % 40 % 42 % 45 % 43 %
Q4/08 Q1/09 Q2/09 Q3/09 Q4/09 Q1/10 Q2/10 Q3/10 Q4/10
Net Debt, EURm Net Debt/EBITDAEquity ratio %

Profit distribution proposal
• EUR 0.90 dividend per share– Total amount EUR 141m– Pro Forma Net Debt/EBITDA after
payment 1.9– Dividend yield 6% *– Payout ratio 94%
• Payment date 7.4.2011• Record date 30.3.2011• Authorisations proposals to AGM
– EUR 0,40 per share additional dividend– If authorised and used total dividend
yield 8% *– Max 5 million share buy back
* total profit distribution /share price as 30.12.2010 (€ 16.27)
33
123 116
402
285
156221
140
79
86
43
77 %
110 %
302 %
149 %
88 %
126 %
94 %
2005 2006 2007 2008 2009 2010 2011e
Dividend / capital repayment Buy-back
EUR 0.40 add. dividend* Pay-out ratio %
136%
* if authorised by AGM and decided by BoD


APPENDIX SLIDE
Consolidated Cash flow statement
35
EUR million Q4 2010 Q3 2010 Q2 2010 Q1 2010 Q4 2009 Q3 2009 Q2 2009 Q1 2009 Q4 2008Cash flow from operating activitiesProfit before tax 67 68 53 10 56 70 56 53 70Adjustments to profit before tax 55 60 67 106 64 60 60 61 57Change in working capital 18 -27 20 -4 26 -23 30 4 33Cash flow from operating activities 140 101 140 112 146 107 146 119 159
Received dividends and interests and interest paid 1) -41 -11 0 -15 -1 -12 -2 -15 -4Taxes paid -6 -16 -19 -13 -11 -11 -18 -17 -11Net cash flow from operating activities 92 74 121 84 134 84 127 87 145
Cash flow in investmentsCapital expenditure -55 -42 -46 -38 -61 -40 -36 -34 -60Investments in shares and other investments -10 -4 -5 -1 0 -2 -7 -1Proceeds from asset disposal 1 0 1 0 0 1 0 0Net cash used in investment -64 -45 -51 -39 -61 -41 -37 -41 -61
Cash flow after investments 28 29 70 45 74 43 89 46 84
Cash flow in financingShare Buy Backs and sales (net) 0Change in interest-bearing receivablesChange in long-term debt 0 -30 25 -36 0Change in short-term debt 65 -42 -33 69 13 -62 -47 40 -70Repayment of financing leases -1 -1 -1 -1 -1 -1 -1 -1 -1Dividends paid -78 -1 -143 -63 0 -8 -86 -1Cash flow in financing -13 -43 -65 -50 -51 -64 -92 -47 -72
Change in cash and cash equivalents 15 -15 5 -5 23 -20 -2 -2 12
1) Includes non recurring item: CDO guarantee settlement

APPENDIX SLIDE
Financial situation
36
EUR Million 31 Dec 2010 30 Sep 2010 30 Jun 2010 31 Mar 2010 31 Dec 2009 30 Sep 2009 30 Jun 2009 31 Mar 2009 31 Dec 2008
Interest-bearing debt Bonds and notes 599 598 598 597 572 572 570 606 606 Commercial Papers 102 68 110 118 74 62 119 101 56 Loans from financial institutions 52 52 52 80 80 80 80 80 80 Financial leases 23 23 24 23 23 24 27 27 27 Committed credit lines 1) 32 0 0 25 0 0 5 70 75 Others 2) 0 0 0 0 0 0 1 1 1Interest-bearing debt, total 808 742 784 843 750 738 802 885 845
Cash and cash equivalents 32 17 32 26 31 9 29 31 33Interest-bearing receivables 32 17 32 26 31 9 29 31 33
Net debt 3) 776 725 752 817 719 729 773 854 812
1) The committed credit lines are EUR 170 million and EUR 130 million revolving credit facilities with five banks, which Elisa Corporation may use flexibly on agreed pricing. The loan arrangements are valid until 17 June 2012 and 23 November 2014.2) Redemption liability for minorities3) Net debt is interest-bearing debt less cash and interest-bearing receivables.