ageing, inequality and social security in mexico
TRANSCRIPT

277
Abstract: The aim of this paper is to analyze the impact of ageing on labor and pension income distribution in Mexico under different scenarios of social security coverage. Static and accounting micro-simulations are used to build synthetic populations in 2025 and 2050. The main findings of the work are, firstly, that, in spite of the critical increase in the elderly population share predicted by the main national and international economic institutions, the level of income dispersion is not likely to dramatically increase in the coming decades. On the contrary, inequality might be reduced in the next few decades because of the higher educa-tional attainment and female activity rates observed among young cohorts at the present moment. Secondly, an upward shift in pension coverage —either through an increase in the share of the population receiving contributory pensions or the establishment of non-contributory old-age benefits— could be an effective tool to achieve improvements in income distribution figures.
Keywords: ageing, pensions, inequality, Mexico, micro-simulation.
Envejecimiento, desigualdad y seguridad social en México: Un enfoque de microsimulación
Resumen: El objetivo de este artículo es analizar el impacto del proceso de enveje-cimiento poblacional sobre la distribución de las rentas procedentes del trabajo y las pensiones en México, en diferentes escenarios de cobertura del sistema de se-guridad social. Para ello, se construyen poblaciones sintéticas para los años 2025 y 2050 usando técnicas de microsimulación. Los principales resultados del trabajo apuntan a que, primero, pese al importante incremento de la población de edad avanzada que se prevé para las próximas décadas, el nivel de dispersión de la ren-
Ageing, Inequality and Social Security in Mexico A Micro-Simulation Approach
José-Ignacio Antón*Fecha de recepción: 3 de mayo de 2010; fecha de aceptación: 10 de febrero de 2011.
∗ José-Ignacio Antón, [email protected], assistant professor, Departamento de Economía Apli-cada, Universidad de Salamanca, Spain. This article is a summary of the second chapter of my PhD dissertation titled “Essays on Social Security and Income Distribution”. I thank the Depart-ment of Economics at the University of the Americas in Puebla (Mexico) for their warm hospital-ity during my research stage there. Very helpful comments from Samuel Freije, Rafael Muñoz de Bustillo, Marcello Morciano, two anonymous referees and a pre-referee are gratefully acknowl-edged. I am also indebted to Estelle James, at the World Bank, for providing me with detailed information on the different pension systems that have been operating in Mexico.
economía mexicana nueva época, vol. XXI, núm. 2, segundo semestre de 2012 . PP. 277-296

278 José-Ignacio Antón: Ageing, Inequality and Social Security in Mexico: A Micro-Simulation Approach
ta no se incrementará dramáticamente. Por el contrario, es posible que la des-igualdad se reduzca debido a los mayores niveles educativos y tasas de actividad femenina que se observan entre las cohortes más jóvenes de trabajadores en la actualidad. En segundo lugar, se muestra que un incremento de la cobertura del sistema de pensiones (ya sea a través de un aumento de la proporción de adultos mayores recibiendo pensiones contributivas o mediante el establecimiento de prestaciones no contributivas) podría ser una herramienta efectiva para generar mejoras distributivas en México.
Palabras clave: envejecimiento, pensiones, desigualdad, México, microsimulación.
jel classification: D30, H55, J18.
Introduction
Ageing is sometimes considered a phenomenon exclusively linked to highly developed economies. However, according to all forecasts, some
low and middle-income economies will experience an impressive increase in the share of total population represented by the elderly. Latin America, and particularly Mexico, is not unconnected to this issue. The aim of this paper is to explore how income distribution in Mexico might be affected by demo-graphic ageing in the coming decades, in a context of considerable low pen-sion coverage among the elderly. According to the United Nations (2009), while the share of world population aged 60 and over will rise from roughly 25 to 35 per cent, in Latin America and the Caribbean, and in Mexico this proportion will increase from 10 to 25 per cent and from 9 to 28 per cent re-spectively. This demographic change and the subsequent increase in the proportion of individuals out of the labor market for reasons of age, together with the low social security coverage of the Mexican pension system, could lead us to think that inequality will increase in the future because of a grow-ing proportion of individuals without labor market or pension income.
To the author’s knowledge, this is the first work to adopt this perspec-tive and whose objective is to test this apparently simple hypothesis in the Mexican case. However, there have been several authors who have tried to model the relationship between inequality and age structure. On the one hand, for example, Deaton and Paxson (1994, 1997) point out that, accord-ing to the permanent income hypothesis, as income and consumption dis-persion within a certain cohort increases with age, an older population can lead to a rise in both consumption and income inequality. These au-thors find some support for their hypothesis in the United States, Taiwan and the United Kingdom. Following a similar argument, Chu and Jiang (1997) explain that the demographic transition in Taiwan, which took

economía mexicana nueva época, vol. XXI, núm. 2, segundo semestre de 2012 279
place from the seventies through the nineties, produced an increase in the percentage of the working age population that resulted in a reduction of income inequality. Nonetheless, Dahan and Tsiddon (1998), using a model of endogenous fertility, suggest an inverted U-shaped relationship be-tween demography and inequality. They argue that, in the first stages, income dispersion rises because of a growing fertility, but then, when fer-tility rates decrease with development, inequality does as well. This alter-native hypothesis is successfully tested by Higgins and Williamson (2002), using a panel data for a cross-section of countries.
To the author’s knowledge, there is no work trying to analyze the valid-ity of this hypothesis for the Mexican case, which is interesting mainly for two specific reasons. First, the Mexican pension system shows quite a low coverage among the population aged 65 years or over, with barely 35 per cent of employed individuals effectively contributing to any social secu-rity scheme between 2000 and 2006 (Rofman, Lucchetti and Ourens, 2008). Second, in 1997 this country undertook a major social security re-form, replacing a government-run pay-as-you-go system with individual private accounts, a model inspired by the pioneering Chilean pension re-form in 1981. Although there is a significant amount of literature dealing with different aspects of pension reform, none of these studies explores the potential distributional implications of low social security coverage in a society where the elderly represent an increasing proportion of the pop-ulation. In addition, the paper explores to what extent a higher coverage —achieved either by lower informality or by a system of non-contributory old-age pensions— could lead to a reduction of inequality in the future.
These results might be useful for other countries that, at the moment, are evaluating how to reform their pension systems and suffer from high levels of inequality, particularly in Latin America. The results obtained suggest that, if one wants to take into account the income distribution is-sue in a pension reform, the most relevant variable is pension coverage. This means that proposed changes should consider mechanisms for ex-tending non-contributory pension coverage, or introducing effective incen-tives for enlarging the proportion of workers actively contributing to regu-lar pension systems. Up to now, this has been an unsolved issue in most of Latin America and the Caribbean.
In order to accomplish the above-mentioned objective, this paper unfolds in four parts that follow these introductory remarks. First, the databases used in the paper in order to explore the relationship between ageing and inequality are described. Second, the micro-simulation methodology used
280 José-Ignacio Antón: Ageing, Inequality and Social Security in Mexico: A Micro-Simulation Approach
in the article is explained in detail. Third, the main results from the re-search are presented and discussed. As usual, the final section summarizes the main findings and policy implications of the paper. A preliminary cau-tion should be kept in mind: micro-simulation is a time-consuming and ar-duous task; therefore, the aim of this research is to present the main results of the analyses performed, whereas, regarding methodology, the article only pretends to provide the reader with the basics of the technique, illustrating the main intermediate steps when needed and outlining the assumptions made and the sensitivity analyses when considered appropriate. Detailed information on all parts of the exercise performed here, including the re-sults of sensitivity analyses, is presented in chapter 2 of Antón (2008).
I. Data
This paper makes use of quite diverse databases. In the first place, Mexican household surveys (Encuesta Nacional de Ingresos y Gastos de los Hogares, enigh) represent the main source of information in terms of past and pres-ent income distribution, age structure, activity and employment rates, edu-cational attainment and pension coverage. This survey was run by the Insti-tute of Statistics and Geography (whose Spanish acronym is inegi), and their micro-data can be freely accessed by researchers at the inegi website.
Second, the micro-simulation strategy requires a set of predictions on demographic trends and activity rates, which are taken from calculations made by the National Council of Population (Conapo, 2003a, 2003b). The World Bank, the Economic Commission for Latin America and the Carib-bean (eclac) and the United Nations also produce their own projections. They do not substantially differ from the Conapo projections and do not alter the results shown here. The total population is projected by Conapo using data from Census 2000, whereas the projections of active popula-tion are based on Census 2000 and National Employment Surveys (En-cuesta Nacional de Empleo) together with a model of probabilities of tran-sition from inactivity to work and from work to retirement.
II. Methodology
II.1. The Micro-Simulation Approach
Micro-simulation has become an increasingly popular tool for evaluating public policies in the last decades, especially on an ex ante basis. The main

economía mexicana nueva época, vol. XXI, núm. 2, segundo semestre de 2012 281
advantage of this technique is the possibility of taking into account a high degree of heterogeneity of economic agents, apart from the opportunity of accurately account for the cost of social policy (Bourguignon and Spadaro, 2006). Nowadays, micro-simulation is a core instrument in the ex ante evaluation of anti-poverty programs and tax pension reforms.1
The objective of the exercise presented in this article is (taking the year 2004 as a base, which corresponds to the last wave available when this research was begun) to construct a synthetic Mexican population for 2025 and 2050, when population ageing will be a relevant issue in the country.2 The focus of the simulation is only on labor income and pensions, which are treated as deferred wages among the population aged 18 or older. In order to isolate the demographic and labor market effects on inequality, the unit of analysis is not the household but the individual, so no income pooling or redistribution at household level is considered here. Moreover, to try to simulate household structures in the future would have been a cumbersome task, far from the spirit of the paper. The construction of such synthetic populations proceeds in several steps which are described below.
Before beginning to explain the main stylized features of the simula-tion model, it is worth highlighting somewhat the usual work assumptions of this type of exercise. To devise projections of future scenarios is always a very difficult task and requires many assumptions on the evolution of a relevant range of parameters. When the simulations include some hetero-geneity, as in the case of micro-simulations, the assumptions can be even more difficult to make. The procedure is basically to choose a (reasonable) baseline scenario and, according to our knowledge of the economic world, carry out a sensitivity analysis of the most controversial assumptions in order to test the robustness of the results. The following pages are devoted to outlining the micro-simulation exercise, providing the results obtained for the baseline scenario. The robustness of the results to the most rele-
1 In this respect, Spadaro (2007) provides the interested reader with several examples of applications of micro-simulations to policy evaluation. Particularly on the use of micro-simula-tions for studying the effect of anti-poverty programs see, among others, Bourguignon, Ferreira and Leite (2003), and Todd and Wolpin (2006). Authors like Dang et al. (2006) present an excel-lent insight into the study of aging and public policies using these sorts of analytical tools. Furthermore, it is worthy to mention that several governments of oecd countries, like Canada, Sweden or Norway, rely on large and detailed micro-simulation models for studying the bud-getary and distributional implications of pension reforms.
2 Choosing another year (for example 2000 and 2005) as baseline is not likely to affect the results, as long as during the period 2000-2005 there have not been any dramatic changes in income distribution or returns to education. In addition, one should keep in mind that the sample design of enigh 2004 is based on the Census 2000.
282 José-Ignacio Antón: Ageing, Inequality and Social Security in Mexico: A Micro-Simulation Approach
vant assumptions on returns to education or the earnings penalty on women is also discussed. For the sake of brevity, the results presented in tables and figures are limited to the baseline scenario, only explicitly re-viewing the results under other assumptions when they imply changes of substantial relevance. When the use of alternative assumptions does not affect the main results, this issue is noted in the main text without over-loading it with the corresponding tables and graphs.
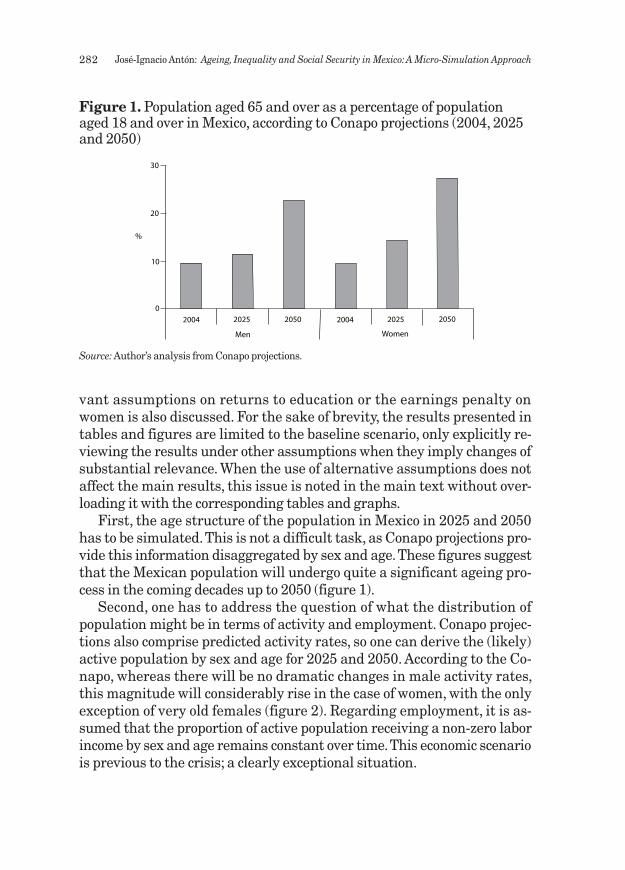
First, the age structure of the population in Mexico in 2025 and 2050 has to be simulated. This is not a difficult task, as Conapo projections pro-vide this information disaggregated by sex and age. These figures suggest that the Mexican population will undergo quite a significant ageing pro-cess in the coming decades up to 2050 (figure 1).
Second, one has to address the question of what the distribution of population might be in terms of activity and employment. Conapo projec-tions also comprise predicted activity rates, so one can derive the (likely) active population by sex and age for 2025 and 2050. According to the Co-napo, whereas there will be no dramatic changes in male activity rates, this magnitude will considerably rise in the case of women, with the only exception of very old females (figure 2). Regarding employment, it is as-sumed that the proportion of active population receiving a non-zero labor income by sex and age remains constant over time. This economic scenario is previous to the crisis; a clearly exceptional situation.
Figure 1. Population aged 65 and over as a percentage of population aged 18 and over in Mexico, according to Conapo projections (2004, 2025 and 2050)
Source: Author’s analysis from Conapo projections.
20502025 2050202520042004
Men Women
0
%
30
20
10

economía mexicana nueva época, vol. XXI, núm. 2, segundo semestre de 2012 283
The third step involves assigning schooling levels to such synthetic popu-lations. Considering that education is usually complete at the age of 25, it is assumed that the educational level of workers aged x years old in 2004 determines the human capital endowments of employed population aged x + 21 years old in 2025 and x + 46 in 2050. For reasons of space and clari-ty, the presentation of such data is limited to the case of men from 2004 to 2050 (figure 3). The graph shows that, even in the absence of any kind of educational improvement in the next few decades (something quite un-likely), the educational levels of the employed population will dramati-cally improve in the future. Furthermore, since it is possible that school-ing levels will increase in the coming decades, the additional assumption of improvement of human capital levels according to the pattern observed during the period 1994-2004 is introduced. In order to derive this trend, transition matrices for men and women computed from enigh 1994 and 2004 are used.
Fourth, the earnings distributions of the counterfactual populations are simulated. In order to do so, a Mincerian regression that includes
Figure 2. Activity rates of population aged 18 and over in Mexico according to Conapo projections (2004 and 2050)
Source: Author’s analysis from Conapo projections.
100
90
80
70
60
50
40
30
20
10
18-1
9
20-2
4
25-2
9
30-3
4
35-3
9
50-5
4
45-4
9
40-4
4
70-7
4
75-7
9
60-6
4
80-8
4
55-5
9
65-6
9
85-8
9 89
Age
0
%
Men 2004
Men 2050
Women 2004
Women 2050

284 José-Ignacio Antón: Ageing, Inequality and Social Security in Mexico: A Micro-Simulation Approach
basic socio-demographic variables and human capital endowments (gen-der, age, age squared, educational level —using dummies— and interac-tions of these covariates) is carried out. The estimation is performed us-ing Ordinary Least Squares (ols) by regressing the labor income of each individual (in logs) on the set of characteristics mentioned above. One should keep in mind that the econometric specification does not control for sample selection bias, and the number of variables is kept at the min-
Figure 3. Distribution of employed population by level of completed schooling in Mexico, according to simulations (2004 and 2050)
Source: Author’s analysis.
+89
85-8
9
80-8
4
75-7
9
70-7
4
65-6
9
60-6
4
55-5
9
50-5
4
45-4
9
40-4
4
35-3
9
30-3
4
25-2
9
20-2
4
18-1
9
0
20
40
60
80
100
Tertiary Secondary Primary or less
%
Age
2004
85-8
9
80-8
4
75-7
9
70-7
4
65-6
9
60-6
4
55-5
9
50-5
4
45-4
9
40-4
4
35-3
9
30-3
4
25-2
9
20-2
4
18-1
9
0
20
40
60
80
100
Tertiary Secondary Primary or less
%
Age
2050

economía mexicana nueva época, vol. XXI, núm. 2, segundo semestre de 2012 285
imum in order to make the simulation feasible.3 Then, predicted earnings over the life cycle are calculated by applying the estimated econometric coefficients to the available observable characteristics in each time peri-od. In particular, earnings are predicted following the methodological ap-proach suggested by Wooldridge (2003, pp. 202-204) and assuming a real wage increase of 1 per cent for all workers each year.4 As the predicted earnings distribution is much less disperse than the actual one, the same methodology is applied to the 2004 population, that is, predicted labor incomes instead of real ones are used in order to obtain a comparable time reference. Whereas this methodological option certainly biases downwards the absolute level of income inequality, the same should not apply to its evolution across time, which represents the main focus of in-terest of the paper. Two final additional assumptions are made: first, con-sidering that Mexico is likely to experience an improvement in terms of human capital training in the next few decades, it is assumed that the returns to education among the different schooling levels will narrow as a result of a larger supply of graduates; specifically, it is assumed that returns to college education will decrease by 10 per cent from 2004 to 2050;5 second, assuming higher economic development and, thus, a better labor market functioning in the future, mean earnings differentials by
3 Not controlling for unobserved ability can yield inconsistent estimates. Nevertheless, it is possible that ols estimates are roughly consistent if, because of the endogeneity of education, the upward bias is compensated by the downward bias that might be present because of a measurement error in education (Card, 1999).
4 Wooldridge (2003) suggests, first, obtaining the fitted values from the regression of the log earnings; second, carrying out the exponentiation of each value; third, regress earnings (without logs) on the values obtained in the previous step without including an intercept; fourth, computing the prediction by multiplying the predicted log earnings by the estimated coefficient obtained in the third step. Regarding the assumption of a 1-per cent increase in real wage per year, it is worth mentioning that it is quite common in simulations involving pension features to assume such a productivity increase (and, thus, the same applies to mini-mum wages). This is the case, for example, of the simulations carried out by the Social Secu-rity Administration in the United States, which is also used in most of the studies performed by academic researchers. In the case of Mexico, the economic turbulence experienced in the previous decades makes it impossible to extrapolate any reasonable trend. Therefore, the 1-per cent increase in real wages is also assumed. In any case, the results presented here hold if no real rise is considered.
5 Even though the evolution of human capital returns is uncertain, this assumption is con-sistent with the speculations of Contreras (2000), Lustig, Arias and Rigolini (2002) and Lego-vini, Bouillón and Lustig (2005), which point out that the persistent high levels of inequality in Latin America respond to very high returns to tertiary education associated with a labor de-mand biased against low-skilled workers in the last decades. Therefore, as some of these au-thors suggest, it is expected that, if the levels of human capital rise in the future, the gap in educational returns will decrease.

286 José-Ignacio Antón: Ageing, Inequality and Social Security in Mexico: A Micro-Simulation Approach
gender found in the regression are assumed to fall from 40 to 20 per cent in the same period.6
The fifth and last step involves calculating the distribution of social security benefits in 2025 and 2050. This task is addressed making several assumptions. First, coverage is assumed to be determined by age, gender
6 It seems reasonable to assume that the higher the level of development, the lower the gender wage gap, other things being equal. This view is supported by the empirical evidence presented by, among others, Blau (1998), Blau and Kahn (2000, 2006) and Goldin (2006) for the United States and other high-income countries. Also worthy of mention is the work of Contre-ras and Puentes (2000) on Chile, which shows that the gender wage differentials in this coun-try decreased from the 1970s to the 2000s.
Table 1. ols estimates of the determinants of labor income in Mexico (2004)
Coefficients Robust standard errors
Sex (Man = 0) -0.400* 0.123
Age 0.073* 0.004
Age squared -0.001* 0.000
Education (no education = 0)
Primary incomplete 0.442* 0.071
Primary complete 0.789* 0.068
Secondary incomplete 0.950* 0.072
Secondary complete 1.017* 0.068
Preparatory incomplete 1.091* 0.071
Preparatory complete 1.246* 0.070
Tertiary incomplete 1.352* 0.077
Tertiary complete 1.941* 0.069
R2 = 0.329
F(20, 31, 843) = 280.72*
Observations = 31 866
Source: Author’s analysis from enigh 2004. Note: An intercept and interactions among variables are also included in the model. *Significant at 1%.
economía mexicana nueva época, vol. XXI, núm. 2, segundo semestre de 2012 287
and education of the population. The composition by gender and age is straightforwardly obtained from Conapo projections. Second, the educa-tion of the retired population is computed assuming that the relationship between the levels of schooling of the employed population and the retired population —modelled using a transition matrix— remains constant over time. Once the distribution of this set of variables has been simulated, the predicted earnings over time are computed using the results of the Mince-rian regression, as explained above. Third, the amount of pension benefits in 2025 and 2050 is calculated by applying the rules of the fully-funded scheme that has been in operation since 1997.7 A complex issue here is the computation of workers’ careers, which are the main determinant of pen-sions. In this respect, a quite eclectic view is adopted: since recent findings for Chile (Arenas de Mesa, Behrman and Bravo, 2004) and Mexico (Levy, 2008) suggest that the distribution of pension contributions to fully-fund-ed systems in Latin America is bimodal, with a pole of workers who nearly never contribute and another group that regularly makes contributions to social security, it is assumed that covered workers had a full record of con-tributions, and uncovered workers receive no benefits at all.8 The adoption of this quite extreme assumption helps to make the model more tractable, and captures reasonably well the distribution of the data. However, one should keep in mind that they do not exactly replicate the data on pension contributions, and thus interpret the results with caution. In fact, a natu-ral extension of this paper would be to benefit from the eventual availabil-ity of administrative registers of contributors in the future, in order to construct a more complex model able to capture a higher heterogeneity of patterns of pension contribution.
In order to compute the pension benefits, the model also takes into ac-count the different rules of transition from the old pay-as-you-go system to the new fully funded scheme. Such a framework establishes that, at the moment of retirement, those workers who started to contribute to social security before the pension reform in 1997 can choose between the pen-sion they would have obtained under the old system and the benefit re-
7 The main features of this social security reform are detailed by, among many others, Me-sa-Lago (2004).
8 For example, according to Levy’s data, almost 45 per cent of people affiliated to the new system showed a contribution density below 30 per cent between 1997 and 2007, and nearly 30 per cent contributed 70 per cent or more months since affiliation. To the author’s knowledge, these kinds of data are not available for academic researchers on a general basis, neither through the inegi nor the Comisión Nacional del Sistema de Ahorro para el Retiro (Consar).

288 José-Ignacio Antón: Ageing, Inequality and Social Security in Mexico: A Micro-Simulation Approach
sulting from contributions to the new one. This mechanism is fully incor-porated in the model, which also considers the minimum and maximum pensions and the so-called Cuota Social, a state-funded contribution to all individual accounts fixed at 5.5 per cent of the minimum wage.9 Private pensions in the new system are computed using a 4 per cent yearly rate of return. The model is tested using alternative assumptions on the rate of return (3 and 6% respectively), obtaining similar results. This result is explained by the very long time that the system will take to mature (that is, to have the bulk of pensions calculated according to the new system). Finally, in order to compute the annuities received by workers in the new system, retirement is assumed to be at 65 years old and total funds accu-mulated by each individual are transformed into pensions, using the pro-jected life expectancies according to the Conapo (2003a).
II.2. Alternative scenarios
As in any type of projection, some of the assumptions of the baseline sce-nario described above, though reasonable, are, to some extent, discretion-al. Therefore, the simulation has been carried out assuming no educa-tional improvement and no change in returns to schooling or gender pay differentials. The results obtained in such alternative scenarios closely resemble the baseline. The reason is that the main driving force of earn-ings distribution in the future will be the educational level of young peo-ple. Even in the absence of additional improvement of educational levels, since human capital levels have grown in Mexico during the last few years, such a trend is likely to have an equalizing effect in the future, when other cohorts with lower and more poorly distributed schooling lev-els will be replaced by them. Therefore, the results obtained are essen-tially invariant to these assumptions, as is shown in the next section.
Nevertheless, it is interesting to guess what the effect might be, on the one hand, of a larger coverage of the contributory pension system, consist-ent with an optimistic view of the future in which labor market informali-labor market informali- market informali-ty decreases, and, on the other hand, of an active role of the Mexican fed-eral government in providing non-contributory benefits to retirees. In this respect, first, the coverage of the contributory system is assumed to rise by
9 The inclusion of the Cuota Social and minimum pensions in the analysis thus requires making assumptions about the evolution of the minimum wage in Mexico. Because of the tur-bulent evolution of this magnitude in the last few years, it is assumed that it remains constant in real terms.

economía mexicana nueva época, vol. XXI, núm. 2, segundo semestre de 2012 289
5 and 10 percentage points respectively for men and women aged between 65 and 74 in 2025; it is assumed that in 2050 this same age group benefits from an additional increase of 5 percentage points for both sexes. In the second place, the distributional and fiscal implications of a non-contributo-ry pension established at the extreme and moderate poverty line in 2004, that targeted individuals without contributory pensions, are simulated.
II.3. Measuring inequality
In order to measure the degree of inequality across the different scenarios described above and considering the presence of a large share of observa-tions with zero-income in the micro-simulation (which makes many dis-persion measures unsuitable), the calculations presented here are limited to the classical Gini index, which can be defined as follows:
G (Y) = 1-2 Ç L (p) dp (1)
where Y denotes income, p represents the p poorest fraction of the popula-tion, and L(·) is the concentration curve for income. As is well-known, the Gini index is delimited between zero (which corresponds to a population where income is equally distributed) and one (which is associated with a completely unequal society, where one person receives the whole income). The higher the Gini index, the higher the income dispersion.
III. Empirical results
The first finding to be highlighted is that, according to the micro-simula-tions (figure 4), labor income distribution in Mexico is not likely to worsen in the coming decades. This result is not dependent on the assumptions about the evolution of wage premia and the educational attainment of the Mexican labor force, as the sensitivity of these figures to a no-change sce-nario is minimal. As mentioned above, the main driving force of this trend is the evolution of the distribution of schooling levels among the working-age population, since the younger and more educated cohorts in 2004 will represent an increasing share of workers in 2025.
Regarding the distribution of pension income among the elderly (figure 5), one can see that very high levels of inequality will persist in 2025 and 2050. These results do not change at all with the assumptions described above, as long as they basically affect the working-age population.
1
0

290 José-Ignacio Antón: Ageing, Inequality and Social Security in Mexico: A Micro-Simulation Approach
Figure 4. Distribution of labor income (Gini index) among population aged 18 and over in Mexico, according to simulations (2004, 2025 and 2050)
Source: Author’s analysis. Note: The Gini index is a measure of inequality between 0 and 1. The higher the index, the higher the inequality. Changes in returns refer to a reduction in the wage penalty for females and the narrowing of the returns to education.
With improvements in education and changes in returns.
Without improvements in education and changes in returns.
Gin
i ind
ex
0.400
0.500
0.550
0.450
0.600
2004 2025 2050
Figure 5. Distribution of pension income among population aged 65 and over in Mexico, according to simulations (2004, 2025 and 2050)
Source: Author’s analysis. Note: The Gini index is a measure of inequality between 0 and 1. The higher the index, the higher the inequality. Changes in returns refer to a reduction in the wage penalty for females and the narrowing of the returns to education.
0.0
0.200
0.400
0.600
0.800
1.0
Gin
i ind
ex
Pensionrecipientsaged 65and over
Populationaged 65and over
Pensionrecipientsaged 65and over
Populationaged 65and over
Pensionrecipientsaged 65and over
Populationaged 65and over
2004 2025 2050
With improvements in education and changes in returns.
Without improvements in education and changes in returns.

economía mexicana nueva época, vol. XXI, núm. 2, segundo semestre de 2012 291
Third, the pessimistic view of the negative impact of aging on income dis-tribution in Mexico is not confirmed when adding labor income and pen-labor income and pen- income and pen-sion income (figure 6), as long as one does not observe a wider degree of inequality; if anything, one could talk about a slight decrease in the Gini index in 2025, and a very similar figure for 2050.
The rejection of the hypothesis of a more unequal income distribution in the next decade leads to the exploration of what the effect of either an increase in the coverage of the contributory system or the establishment of a generous scheme of non-contributory old-age benefits would be on fu-ture inequality. According to the results of micro-simulations (figure 7), a moderate increase in contributory coverage —resulting from, for instance, an improvement in labor market functioning— in the terms described in the previous section would mean a substantial decrease in income inequal-ity. However, its impact is limited by the fact that changes that happen in the labor market right now require several decades to reach a retired pop-ulation. In turn, a more radical pension policy, namely a non-contributory scheme at the level of 2004 indigence and poverty lines would result in a larger reduction of inequality levels.
Figure 6. Distribution of total income (labor income plus pension income) among the population in Mexico, according to simulations (2004, 2025 and 2050)
Source: Author’s analysis. Note: The Gini index is a measure of inequality between 0 and 1. The higher the index, the higher the inequality. Changes in returns refer to a reduction in the wage penalty for females and the narrowing of the returns to education.
0.0
0.200
0.400
0.600
0.800
205020252004205020252004205020252004205020252004
Gin
i ind
ex
Population aged18 and over
Population aged65 and over
Population aged18 and over
Population aged65 and over
Without improvements ineducation and changes in returns
With improvements ineducation and changes in returns

292 José-Ignacio Antón: Ageing, Inequality and Social Security in Mexico: A Micro-Simulation Approach
0.300
0.400
0.500
0.600
0.700
Non
-con
trib
utor
y(p
over
ty)
Non
-con
trib
utor
y(in
dige
nce)
Incr
ease
of
cont
ribut
ory
cove
rage
Base
line
Non
-con
trib
utor
y(p
over
ty)
Non
-con
trib
utor
y(in
dige
nce)
Incr
ease
of
cont
ribut
ory
cove
rage
Base
line
2025 2050
Gin
i ind
ex
Figure 7. Distribution of total income (labor income plus pension income) under different coverage scenarios according to simulations (2004, 2025 and 2050)
Source: Author’s analysis. Note: The Gini index is a measure of inequality between 0 and 1. The higher the index, the higher the inequality.
Population aged 18 and over
0.0
0.200
0.400
0.600
0.800
1.0
Non
-con
trib
utor
y(p
over
ty)
Non
-con
trib
utor
y(in
dige
nce)
Incr
ease
of
cont
ribut
ory
cove
rage
Base
line
Non
-con
trib
utor
y(p
over
ty)
Non
-con
trib
utor
y(in
dige
nce)
Incr
ease
of
cont
ribut
ory
cove
rage
Base
line
2025 2050
Gin
i ind
ex
Population aged 65 and over
economía mexicana nueva época, vol. XXI, núm. 2, segundo semestre de 2012 293
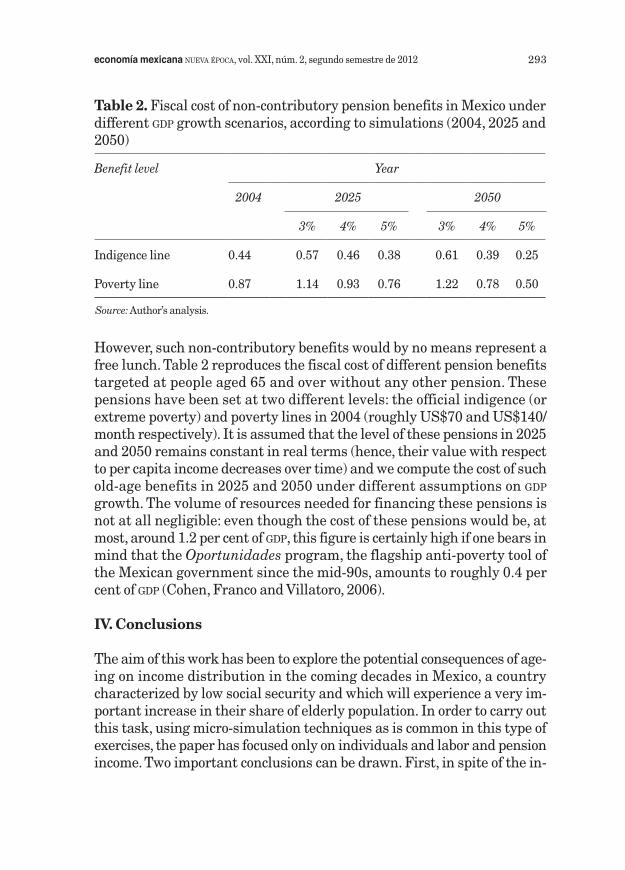
However, such non-contributory benefits would by no means represent a free lunch. Table 2 reproduces the fiscal cost of different pension benefits targeted at people aged 65 and over without any other pension. These pensions have been set at two different levels: the official indigence (or extreme poverty) and poverty lines in 2004 (roughly US$70 and US$140/month respectively). It is assumed that the level of these pensions in 2025 and 2050 remains constant in real terms (hence, their value with respect to per capita income decreases over time) and we compute the cost of such old-age benefits in 2025 and 2050 under different assumptions on gdp growth. The volume of resources needed for financing these pensions is not at all negligible: even though the cost of these pensions would be, at most, around 1.2 per cent of gdp, this figure is certainly high if one bears in mind that the Oportunidades program, the flagship anti-poverty tool of the Mexican government since the mid-90s, amounts to roughly 0.4 per cent of gdp (Cohen, Franco and Villatoro, 2006).
IV. Conclusions
The aim of this work has been to explore the potential consequences of age-ing on income distribution in the coming decades in Mexico, a country characterized by low social security and which will experience a very im-portant increase in their share of elderly population. In order to carry out this task, using micro-simulation techniques as is common in this type of exercises, the paper has focused only on individuals and labor and pension income. Two important conclusions can be drawn. First, in spite of the in-
Table 2. Fiscal cost of non-contributory pension benefits in Mexico under different gdp growth scenarios, according to simulations (2004, 2025 and 2050)
Benefit level Year
2004 2025 2050
3% 4% 5% 3% 4% 5%
Indigence line 0.44 0.57 0.46 0.38 0.61 0.39 0.25
Poverty line 0.87 1.14 0.93 0.76 1.22 0.78 0.50
Source: Author’s analysis.
294 José-Ignacio Antón: Ageing, Inequality and Social Security in Mexico: A Micro-Simulation Approach
creasing proportion of elderly in Mexico and even under the assumption of constant (and low) pension coverage, the results suggest that income dis-tribution is not likely to worsen in the future (all things being equal) as long as the current younger cohorts present much higher and better dis-tributed levels of schooling than the oldest ones, with education acting as a compensating device for the increasing proportion of people without any income from labor. The second finding, linked to the previous one, has to do with the potential improvements in income distribution through enlarging the coverage of the pension system. Two alternatives have been analyzed: an increase in contributory coverage associated with a better functioning of the labor market, and the establishment of a non-contributory system targeted at people aged 65 and over who receive no contributory pension. The latter alternative has been found to be more powerful in terms of ine-quality reduction than the former, whose effects are more likely to be ob-served in the very long run. However, the fiscal cost of non-contributory pensions has been shown to be very high in terms of gdp, exceeding the cost of the most important anti-poverty program in Mexico today.
Although the article illustrates a potential role of micro-simulations for evaluating social policy and the implications of aging, it presents some limitations as well. In the first place, it would be desirable to increase the degree of heterogeneity captured by the model, for example, using more detailed information on contribution patterns. Second, the work does not take into account the relevance of family formation and capital income in determining income distribution. Lastly, the model is not truly dynamic and does not include behavioral responses of individuals to policy chang-behavioral responses of individuals to policy chang- responses of individuals to policy chang-es. It is expected that such issues will be addressed in future extensions of this work, providing with a further knowledge of the implications of aging and pension policy.
References
Antón, J. I. (2008), “Ensayos sobre seguridad social y desigualdad”, Depar-tamento de Economía Aplicada de la Universidad de Salamanca, Sala-manca, available at: http://web.usal.es/~janton/docs/PhDdissertation_Anton.pdf.
Arenas de Mesa, A. and J. B. D. Bravo (2004), “Characteristics and Deter-ter-minants of the Density of Contributions in a Private Social Security System”, Working Paper 2004-077, Ann Arbor, Retirement Research Center of the University of Michigan.
economía mexicana nueva época, vol. XXI, núm. 2, segundo semestre de 2012 295
Blau, F. D. (1998), “The Trends in The Well-Being of American Women 1970-1995”, Journal of Economic Literature, 36 (1), pp. 115-128.
Blau, F. D. and L. M. Kahn (2000), “Gender Differences in Pay”, Journal of Economic Perspectives, 14 (4), pp. 75-99.
______ (2006), “The US Gender Gap in the 1990s: Slowing Convergence”, Industrial and Labor Relations Review, 60 (1), pp. 45-66.
Bourguignon, F. and A. Spadaro (2006), Microsimulation as a Tool for Evaluat ing Redistribution Policies”, Journal of Economic Inequality, 4 (1), pp. 77-106.
Bourguignon, F., F. H. G. Ferreira and P. G. Leite (2003), “Conditional Cash Transfers, Schooling, and Child Labor: Micro-Simulating Brazil’s Bol-sa Escola Program”, World Bank Economic Review, 17 (2), pp. 229-254.
Card, D. (1999), “The Causal Effect of Education on Earnings”, en O. Ash-enfelter y D. Card (eds.), Handbook of Labor Economics, Amsterdam, vol. 3A, pp. 1801-1863.
Chu, C. C. Y. and L. Jiang (1997), “Demographic Transition, Family Struc-ture, and Income Inequality”, Review of Economics and Statistics, 79 (4), pp. 665-669.
Cohen, E., R. Franco and P. Villator (2006), “México: El programa de de-sarrollo humano Oportunidades”, in E. Cohen and R. Franco (eds.), Transferencias con corresponsabilidad: Una mirada latinoamericana, Mexico, flacso, pp. 21-84.
Conapo (Consejo Nacional de Población) (2003a), Proyecciones de la po-blación nacional 2000-2050, Mexico, Conapo.
______ (2003b), Proyecciones de la población económicamente activa 2000-2050, Mexico, Conapo.
Contreras, D. (2000), “Distribución del ingreso en Chile: Nueve hechos y algunos mitos”, Perspectivas, 2 (2), pp. 311-322.
Contreras, D. and E. Puentes (2000), “Is the Gender Wage Discrimination Decreasing in Chile? Thirty Years of “Robust” Evidence”, paper pre-sented at the 2000 Latin American Economic Association Meeting in Rio de Janeiro, Brazil, available at: http://www.lacea.org/meeting2000/EstebanPuentes.PDF.
Dahan, M. and D. Tsiddon (1998), “Demographic Transition, Income Distribu-tion, and Economic Growth”, Journal of Economic Growth, 3 (1), pp. 29-52.
Dang, T. T., H. Immervoll, D. Mantovani, K. Orsini and H. Sutherland (2006), “An Age Perspective on Economic Well-Being and Social Protec-tion in Nine oecd Countries”, iza discussion paper, 173, Bonn, Institute for the Study of Labor.

296 José-Ignacio Antón: Ageing, Inequality and Social Security in Mexico: A Micro-Simulation Approach
Deaton, A. and C. Paxson (1994), “Intertemporal Choice and Inequality”, Journal of Political Economy, 102 (3), pp. 437-467.
______ (1997), “The Effects of Economic and Population Growth on Na-tional Saving and Inequality”, Demography, 34 (1), pp. 97-114.
Goldin, C. (2006), “The Rising (and then Declining) Significance of Gender”, in F. D. Blau, M. Brinton and D. D. Grusky (eds.), The Declining Signifi-cance of Gender? New York, Russell Sage Foundation, pp. 67-101.
Higgins, M. and J. G. Williamson (2002), “Explaining Inequality the World Around: Cohort Size, Kuznets Curve and Openness”, Southeast Asian Studies, 40 (3), pp. 268-302.
Legovini, A., C. P. Bouillón and N. Lustig (2005), “Can Education Explain Changes in Income Inequality in Mexico”, in F. Bourguignon, F. H. G. Ferreira and N. Lustig (eds.), The Microeconomics of Income Distri-bution Dynamics in East Asia and Latin America, Washington, D. C., The World Bank, pp. 275-312.
Levy, S. (2008), Good Intentions, Bad Outcomes: Social Policy, Infor-mality, and Economic Growth in Mexico, Washington, D. C., Brook-ings Institution Press.
Lustig, N., O. Arias and J. Rigolini (2002), “Reducción de la pobreza y cre-cimiento económico: La doble causalidad”, working paper of the Intera-merican Development Bank. Interamerican Development Bank, Wash-t Bank. Interamerican Development Bank, Wash-ington, D. C.
Mesa-Lago, C. (2004), “Las reformas de pensiones en América Latina y su impacto en los principios de la seguridad social”, Serie Financiamiento del Desarrollo, 144, Santiago de Chile, Economic Commission for Latin America and the Caribbean.
Rofman, R., L. Lucchetti and G. Ourens (2008), “Pension systems in Latin America: Concepts and measurements of coverage”, Social Protection Discussion Paper, 616, Washington, D. C., The World Bank.
Spadaro, A. (ed.) (2007), Microsimulation as a Tool for the Evaluation of Public Policies: Methods and Applications, Madrid, Fundación bbva.
Todd, P. E. and K. I. Wolpin (2006), “Assessing the Impact of a School Sub-sidy Program in Mexico Using Experimental Data to Validate a Dy-namic Behavioral Model of Child Schooling”, American Economic Re-view, 96 (5), pp. 1384-1417.
United Nations (2009), World Population Prospects: The 2008 Revision, New York, United Nations.
Wooldridge, J. M. (2003), Introductory Econometrics: A Modern Approach, 2nd edition, Mason (Ohio), Thomson South-Western.