age uk’s fit for the future programme -...
TRANSCRIPT

Age UK’s fit for the future Programme
Interim evaluation report
Dr Andrea Wigfield
Dr Erika Kispeter
Dr Royce Turner
CIRCLE
(Centre for International Research on Care, Labour and Equalities)
University of Leeds
June 2014
fit as a fiddle is a programme run by Age UK and funded by
the Big Lottery Fund as part of the Wellbeing programme
www.ageuk.org.uk www.fitasafiddle.org.uk

i
Key Findings
Main characteristics of survey participants
The average age of Survey One respondents is 75 years.
Three-quarters (74%) are women and a quarter (26%) are men.
Nine-tenths (91%) of respondents are White British and 4 per cent are Indian.
30 per cent have one and 63 per cent have multiple long-term health conditions.
60 per cent consider themselves to have a disability.
Over one-tenth (13%) are carers.
90 per cent of respondents do not smoke.
40 per cent drink alcohol, with 90 per cent consuming within the limits
recommended by the NHS.
60 per cent think physical activity is important and say they are doing something
about it, with walking being the most popular form of physical activity.
Three-quarters think healthy eating is important and say they are doing something
about it, with 69 per cent eating at least three, and 26 per cent at least five portions
of fruit and vegetables a day.
Over nine-tenths of respondents feel fully informed about and involved in the
management of their long-term health conditions.
Around half have companions but a third feel isolated some of the time.
Implementing fit for the future
Local Age UKs have adopted a variety of approaches to recruiting or referring older
people to the programme. Detailed analysis is required to learn from the different
local referral patterns.
Overall, General Practitioners have been difficult to engage in the referral process.
However it emerged from the case studies that referrals from health professionals
may be taken more seriously than invitations from voluntary organisations, which
suggests that engaging more GPs would benefit the programme.
Case studies highlighted the importance of older people being informed about the
referral process and the activities offered in fit for the future.
Two models of providing group-based activities have been identified: ‘single-’ and
‘multi-purpose’ groups; in some cases ‘outreach’ services have also enabled frail
older people to benefit from the programme in their own homes.
fit for the future activities were more affordable and more accessible to older people
than mainstream exercise groups, due to more appropriate start times and more
convenient locations.
ii
Impact
Case study participants invited to join fit for the future groups responded positively
to the invitation primarily because they wished to meet new people.
Participants joining through self-referral were often actively seeking activities
outside the home.
Almost all case study participants felt they had benefitted from the programme.
Some partner organisations benefitted from the increased number of referrals, while
others were unable to meet the increased demand for their services.
Engaging volunteers was difficult in some areas; further analysis is necessary to
unpack the reasons.
Existing relationships between organisations are becoming stronger, but partnership
building has not yet been facilitated by fit for the future, with some stakeholders
unaware of the programme.
The future and sustainability
Case study participants were satisfied with the programme; the individual attention
they received was particularly appreciated.
The stakeholders who have been interviewed also supported the continuation of the
programme.
Some stakeholders recommended that a small fee should be charged for services,
and that costs should be reduced by finding free venues and involving volunteers to
contribute to sustainability.
Stakeholders suggested that fit for the future should be integrated in the
commissioning of non-clinical health and social care services.

Contents
1. Introduction and background .................................................................................... 1
2. Methods ................................................................................................................... 3
3. Characteristics of participants and partner organisations........................................... 7
3.1. Older people supported by fit for the future .............................................................. 7
3.2. Profile of partner organisations ............................................................................... 20
3.3. Summary: Main characteristics of the sample population ...................................... 21
4. Implementing fit for the future: plans and current practices .................................... 22
4.1. Referrals to the programme .................................................................................... 22
4.2. Nature and delivery of services and activities ......................................................... 25
4.3. Summary: Implementing fit for the future ............................................................... 31
5. Impact of Fit for the future ...................................................................................... 32
5.1. Impact on participants ............................................................................................. 32
5.2. Impact on individual partner organisations ............................................................. 38
5.3. Impact on local partnerships ................................................................................... 38
5.4. Impact on the wider health and social care system ................................................ 39
5.5. Summary: Impact ..................................................................................................... 40
6. The future and sustainability ................................................................................... 41
7. Potential areas for improvement ............................................................................. 43
8. Summary and conclusions ....................................................................................... 44
9. References .............................................................................................................. 46
10. Annex ................................................................................................................... - 1 -

1
1. Introduction and background
It is widely acknowledged that the UK’s population is ageing, with the Department of Health
predicting that the number of people aged over 65 will increase by 51 per cent between
2010 and 2030, whilst the number of those aged over 85 is expected to double in the same
period. Furthermore, by 2030 more than 40 per cent of households are predicted to be
comprised of people living on their own (Jowit, 2013; The King’s Fund, 2013). A number of
authors (Bardsley et. al., 2011; Victor, 2010; Wigfield et. al., 2013) advise that as people live
longer, they are often affected, in later life, by long-term ill health and disabilities. For
example, over the next 30 years, the number of people with dementia is expected to more
than double (The King’s Fund, 2013).
In efforts to maintain and improve the health and well-being of older people, Age UK have
developed a portfolio of work, fit as a fiddle 2013-2015, supported with £3.6m from the Big
Lottery Funded Well-being Programme. The portfolio has emerged as a result of learning
from a previous Age UK project, also called fit as a fiddle. The portfolio further develops the
key elements of the previous project, with a specific focus on older people with long term
health conditions; as well as those from groups who are traditionally excluded or
overlooked, including older men, Black & Minority Ethnic (BME) and faith communities, and
people living with dementia and their carers.
CIRCLE (Centre for International Research on Care, Labour and Equalities), University of
Leeds has been commissioned by Age UK to evaluate the fit as a fiddle 2013-2015 portfolio
of work which includes three programmes of activity (fit for the future; Cascade Training;
and Dementia Friendly). This interim report summarises the initial findings of the
evaluation, focusing on the fit for the future element of the portfolio only.
Fit for the future
Fit for the future is a person-centred programme with the overall objective of supporting
the physical health and mental well-being of older people living with at least one long-term
health condition. The programme aims to achieve this through the provision of holistic, co-
ordinated services and activities which improve participants’ quality of life and enable them
to maintain their independence for longer, while delaying the need for more intensive and
costly health and social care interventions. Once an older person is recruited, and prior to
any intervention, a trained Age UK staff member or volunteer meets with the older person
to develop a tailored personal plan that best suits their health and well-being needs. The
programme is being implemented by 11 local Age UK partners: Blackburn with Darwen;
Cheshire East; Exeter; Hillingdon; Lancashire; Leeds; Newcastle; Nottingham and
Nottinghamshire; Rotherham; Warwickshire; and West-Cumbria.
The overall aim of evaluating fit for the future is to determine the programme’s benefits for
older people and the health service, focusing on cost effectiveness and on the impact on
statutory bodies. As the evaluation is in an early stage, this interim report provides a
2
summary of the initial findings on fit for the future, including the benefits felt by older
people, and potential impact on statutory bodies in health and social care and the
Voluntary, Community and Faith (VCF) sector.
Roadmap to this report
This interim report contains the following sections:
Section Two focuses on the methods used in the evaluation. All stages of the analysis
used to evaluate fit for the future are outlined and the current stage of the evaluation
process is reported on.
Section Three describes the characteristics of older people supported by fit for the
future as they emerge from Survey One; and outlines the profile of partner
organisations represented by the stakeholders whose views are included in this report.
Section Four describes how fit for the future is being implemented, analyses and
comments on the different practices used by different local Age UK partners. As the
analysis of implementation has focussed only on four areas, the findings presented here
are both tentative and preliminary.
Section Five focuses on the impact of fit for the future, exploring how the programme
affects participating older people, partner organisations and local partnerships, as well
as the broader health and social care system in England.
Section Six discusses both participating older people’s and stakeholders’ views in
relation to the future of the programme and its potential for sustainability.
Section Seven summarises some potential areas for improvement which have emerged
from the research so far.
Section Eight provides a summary and some areas for further consideration.
The Annex provides more detailed description of findings emerging from Survey One.

3
2. Methods
The evaluation of fit for the future is based on a variety of research methods and includes
the following key stages:
Analysis of monitoring data and background documents. Documentary analysis and
interrogation of management information data is being undertaken to produce a greater
understanding of: the nature of fit for the future; its aims and objectives; how it is being
implemented; and how well it is performing against the targets. The analysis of monitoring
data and background documents is an ongoing process; this report draws on the expression
of interest documents prepared by local Age UK partners and data on referrals to the
programme. Following the findings of this interim evaluation report, a review of other
interventions aimed at improving the physical and mental well-being of older people will
also be conducted.
A three-wave paper-based survey of older people, designed by Age UK, and completed by
older people participating in fit for the future at the start of their involvement in the
programme, then three and nine months later. Each local Age UK partner aimed to reach a
target of at least 100 older people completing the survey. This interim report summarises
findings from the first wave of the survey. Some of the data were supplied by local Age UK
partners in the form of completed paper surveys, and some in electronic format (extracted
from Charity Log). The data were subsequently entered into statistical software, Statistical
Package for Social Sciences (SPSS 21), checked, cleaned and then analysed. As Survey One
was conducted when older people first engaged in fit for the future, the findings can be
used to outline the profile of participants, but insights into the programme’s impact cannot
yet be gained (this is expected from the second and third surveys).
Case studies of older people. In addition to the largely quantitative data emerging from the
survey, the research team are also conducting 55 case studies of older people to gain a
greater and more in-depth understanding of the local operation of fit for the future. This
amounts to five case studies of older people in each of the 11 Age UK partner localities. Four
of the five case studies in each locality involve carrying out a face-to-face interview with the
older person, while one of the five case studies provides more in-depth data. In addition to
the face-to-face interview with the older person, the more in-depth case studies involve
participants being asked to complete a diary booklet that focuses on their lifestyle and
attitudes to healthy living in more detail, as well as interviews with members of their
support network, such as friends, family, neighbours or home care workers. Case studies
also draw on information supplied about participants’ involvement in the programme: the
tailored action / support plans developed at the start of the intervention; a summary of the
initial assessment and the actions undertaken (up to March 2014); or the initial ‘contract’
between the participating older person and the local Age UK.

4
In order to present as much in-depth information as possible in this interim report, the
research team have concentrated their initial case studies in four localities: Blackburn with
Darwen, Leeds, Nottingham and Nottinghamshire and Rotherham. 16 case studies were
completed between May and June 2014 and an additional two in-depth case studies were in
progress at the time of writing this report; the data from these case studies have been
analysed to inform the findings in this report.
Interviews with older people participants were semi-structured and each lasted between 45
and 60 minutes. All interviews were conducted face-to-face, with the exception of one,
which was conducted by telephone, as requested by the interviewee. Each interview
focussed primarily on older people’s expectations, experiences and opinions about the
programme, and explored what may have happened to the older person in the absence of
fit for the future. Rather than presenting individual case studies here, extracts of case
studies are included to illustrate the findings. It is anticipated that the final report will
provide more detailed illustrative case studies of participants’ experiences.
The case studies have been conducted so far with 13 women and five men, aged between
63 and 87, living with a range of long-term health conditions and disabilities. The
disproportionate amount of women interviewed is a reflection of the larger number of older
women accessing the programme overall (see Section Three). The case study interviewees
live in a variety of residential settings, some of them come from a BME background and
some of them are carers. Names and minor personal details of case study participants
referred to this this report and their friends and family have been changed to protect their
anonymity.
Qualitative interviews with 55 stakeholders (five in each participating local Age UK partner
area) to capture information about their expectations at the beginning of the programme,
experiences of the partnership running the programme, suggestions for improvement,
lessons learned for themselves and for their organisation, and their assessment about the
programme’s sustainability. Stakeholders were identified by the 11 local Age UK partners to
be drawn from Clinical Commissioning Groups (CCGs); General Practitioners; local
authorities; local Age UK Partners; and voluntary sector organisations. The research team
will interview each stakeholder twice, once at the beginning of the programme and once
towards the end. 35 stakeholders have been interviewed so far and the findings from 26
interviews have been included in the preliminary analysis for this report. Each interview
lasted approximately 30 minutes and was conducted by telephone following a semi-
structured interview schedule. Stakeholders represented a range of organisations and Table
2.1 below gives a summary of basic information about the stakeholders whose input has
been analysed.

5
Table 2.1 Information about stakeholders
Area Organisation Area of expertise
Cheshire East Local authority Adult social care
NHS Community health
Exeter CCG Commissioning services for older people
Hillingdon Local authority Health promotion
Local authority Sheltered housing
Age UK Navigator – primary care services
Age UK Fall prevention
Self-employed contractor Sports and exercise
Lancashire NHS Care for people with long term health conditions
Leeds CCG Working with GPs to shape referral practices
Local authority and voluntary organisation
Sports and exercise
Newcastle Age UK Senior member of staff
Age UK Services for older people
Nottingham and Nottinghamshire
NHS Nutrition
Local authority and voluntary organisation
Signposting to older people’s services
Rotherham Voluntary sector Campaigning and influencing on behalf of older people
Voluntary sector Community organisers
Local authority Community centre management
Voluntary sector Campaigning and influencing on behalf of older people
Local authority and CCG Health and wellbeing
Warwickshire Age UK Services for older people
Age UK Services for older people
CCG Services for older people with long- term conditions
Private sector Housing
West Cumbria NHS Occupational Therapy
Housing Association Community centre management

6
Presentation of data. Initial findings emerging from Survey One and the qualitative
interviews and case studies are presented alongside each other in this interim report. All
figures are rounded to the nearest whole per cent. Quotes from case studies and interviews
with stakeholders are presented to illustrate findings and add specific detail to the
discussion, with the sources identified where appropriate. It is important to note that the
sample of participants and stakeholders identified for interviews is not statistically
representative, and their opinions do not necessarily reflect the views of all participants and
stakeholders involved in fit for the future.

7
3. Characteristics of participants and partner organisations
3.1. Older people supported by fit for the future
Originally it was anticipated that 1650 older people would engage in fit for the future across
the 11 local Age UK partner localities. The monitoring data supplied by the local Age UK
partners show that with the exception of three areas the recruitment targets have been met
or exceeded, with 1750 older participants recorded in the programme overall (see Table
3.1).
Table 3.1 The number of older people engaged in fit for the future
Planned Actual
Blackburn with Darwen 150 140
Cheshire East 150 151
Exeter 150 110
Hillingdon 150 150
Lancashire 150 171
Leeds 150 116
Newcastle 150 150
Nottingham and Nottinghamshire 150 282
Rotherham 150 136
Warwickshire 150 150
West Cumbria 150 194
Total 1650 1750
Of the 1750 participants, data from 1520 completed questionnaires were provided to the research team in a format which was suitable for entry into the statistical software. Some of these questionnaires later had to be excluded from analysis because basic information, such as age (year of birth) or gender was missing or incorrect (e.g. birthday: 2014). A few questionnaires were excluded from analysis because the participant was younger than 50 (those who were only a few months younger than 50 when Survey One was completed were included). The final number of surveys included in the analysis presented in this interim report is 1405. The total number of responses may be smaller for some questions due to missing responses. This interim report focuses on the survey questions which are the most relevant at this early stage of the evaluation; the summary of all findings is presented in the Annex.

8
Gender and age of participants
As alluded to earlier, the vast majority of the survey respondents (74%) are women, with
just over a quarter being men. The age of the participants ranges from 50 to 101 years, as
shown in Figure 3.1, with the average (mean) age being 75 (standard deviation=10). The
average age of female respondents is slightly higher (76 years) than that of males’ (74
years).
Figure 3.1 Age distribution of participants (n=1405)
Living arrangements
Respondents were asked whether they lived alone or with one or more other person. The
majority of the respondents (63%) live alone, and there are important differences between
men and women’s living arrangements: a larger proportion of older women (66%) than men
(55%) live alone (Figure 3.2), reflecting national trends.

9
Figure 3.2 Participants’ living arrangements by gender (n=1398)
Caring responsibilities
Comparing the caring responsibilities of survey respondents, we do not find a difference
between men and women: 13 per cent of both groups look after or support someone who is
sick, disabled or frail elderly.
Healthy eating: attitudes and behaviour
The majority (75%) of respondents agreed with the statement ‘I think healthy eating is
important for my health, and I am doing something about it at the moment’, and only 3%
chose the statement ‘I don’t think healthy eating is important for my health’. Almost a
quarter of respondents (22%) thought that healthy eating was important for their health,
but they said they were not doing anything about it.
The eating habits of participants were explored further in the questionnaire by asking how
many portions of fruit and vegetables respondents eat on an average day. Pictures
illustrating portion sizes of different fruit, vegetables and fruit juice were included to help
the older people to answer the question. Only a quarter of respondents (26%) said that they
eat five or more portions of fruit and vegetables a day (Figure 3.3).

10
Figure 3.3 Eating fruit and vegetables (n=1311)
To further explore their eating habits, respondents were also asked how many times a week
they ate a meal that was prepared and cooked from basic ingredients, either by themselves
or by someone else. As Figure 3.4 shows, a third of respondents (35%) eat a cooked meal
prepared from scratch every day, and another 23% eat such a meal almost every day (four-
six times a week). A quarter of older people completing the survey eat freshly cooked food
two to three times a week, and 18% eat such a meal only once a week, or less often (Figure
3.4).
Figure 3.4 Eating a meal prepared from basic ingredients (n=1378)

11
Physical activity: attitudes and behaviour
To explore their attitudes to physical activity, respondents were asked to choose the
statement which best represents their attitude to physical activity. 60 per cent of the older
people who completed the survey thought that physical activity was important for their
health and they were doing something about it, whilst just 3 per cent did not think that
physical activity was important for their health. 38 per cent of respondents thought that
physical activity was important, but they were not doing anything about it at the time when
Survey One was conducted.
The type of physical activity that questionnaire respondents carry out was explored by three
specific questions, focusing on three types of exercise: walking; exercise that makes them
breathe somewhat harder than normal; and muscle-strengthening exercise. Respondents
were then asked to write down the number of minutes they spent doing these forms of
exercise a day (walking) or a week (for the others). Individual responses have been grouped
into categories and presented in Figures 3.5 – 3.7 below.
Walking is by far the most popular form of exercise: 40 per cent of respondents walked
more than 30 minutes a day. However, 8 per cent of respondents could not walk at all, and
half of all respondents walked less than 30 minutes on an average day, as shown in Figure
3.5.
Figure 3.5 Number of minutes spent walking on an average day (n=1313)
A further aspect of respondents’ physical activity was explored by asking them how many
minutes a week they spent doing exercise that made them breathe somewhat harder than
normal, not including walking. A few examples, such as housework, gardening or sports
were provided to help them with their answer. As above, individual answers were grouped
into categories. The data reveal that 40 per cent of older people completing the survey did

12
not do any physical activity that made them breathe harder than normal; 31 per cent did
less than an hour, and 29 per cent more than an hour a week (Figure 3.6).
Figure 3.6 Number of minutes spent doing physical activity making breathing harder per week (n=1219)
The third question associated with physical activity focussed on muscle-strengthening
exercise, and as above, respondents were given some examples (carrying groceries, heavy
gardening, walking up and down the stairs) to help them answer the question. The data,
shown in Figure 3.7 reveals a similar pattern to the one described in the previous question:
36 per cent do not / cannot do any muscle-strengthening exercise; a third (33%) do less than
60 minutes a week, while about another third (30%) do more than one hour a week.
Figure 3.7 Number of minutes of muscle-strengthening physical activity per week (n=1257)

13
Smoking
Another important aspect of Survey One was mapping the smoking habits of respondents:
90 per cent said they did not smoke, and only 10 per cent indicated that they did (n=1384).
Those who said they smoked were asked how many cigarettes they had a day. Slightly less
than two thirds of smokers had fewer than ten cigarettes a day (59%), about a third smoked
11-20 cigarettes a day (34%) and the remaining 7 per cent smoked more than two packets
of cigarettes a day, as shown in Figure 3.8.
Figure 3.8 The number of cigarettes smoked a day (n=111)
Alcohol consumption
The final question exploring the lifestyle of older people focussed on their alcohol
consumption. 60 per cent of respondents said they did not drink alcohol and 40 per cent
said they did. The findings show a sizable gender difference: 37 per cent of women but 49
per cent of men said that they drink alcohol, as shown in Figure 3.9.

14
Figure 3.9 Alcohol consumption by gender (n=1367)
Those who said they drank alcohol were then asked to specify how many units of alcohol
they consumed a week, and examples were included to guide the respondents in answering
the question. The findings are shown separately for men and women. About three quarters
(76%) of men consume fewer than 10 units of alcohol a week, 15 per cent 11-20 units, and 9
per cent consume 21 or more units of alcohol (Figure 3.10). The NHS recommends that men
should not regularly drink more than 21 units of alcohol a week, thus 9 per cent of male
respondents drink more than the maximum amount.
Figure 3.10 Number of units of alcohol consumed per week: men (n=156)

15
As the recommended limit for women is 14 units of alcohol per week, the categories
presented in Figure 3.11 have been constructed differently. 91 per cent of female
respondents consume fewer than 14 units a week; 6 per cent consume 15-28 units (not
more than twice the recommended weekly limit); and 3 per cent consume more than 28
units of alcohol per week, as shown in Figure 3.11. In summary, approximately 90 per cent
of those men and women who drink alcohol do not consume more than the limits
recommended by the NHS.
Figure 3.11 Number of units of alcohol consumed per week: women (n=315)
Long-term health conditions
As fit for the future aims to improve the physical and mental well-being of older people
living with at least one long-term health condition, it was essential to map what type of
health conditions participants live with. Older people were asked specifically whether a
doctor or other health professional had diagnosed them with: respiratory conditions;
arthritis; heart conditions; vascular conditions and stroke; cancer; diabetes, dementia;
mental health; and other conditions. They were also given the option to select ‘other’ health
conditions. The most common long-term health condition among respondents is arthritis
(51%), followed by heart conditions (29%), respiratory conditions (24%) and diabetes (20%),
as shown in Table 3.2. Many respondents indicated that they had been diagnosed with
‘other’ health conditions, but the design of the questionnaire did not allow all of them to
specify what this condition was.

16
Table 3.2 Respondents reporting being diagnosed with a long-term health condition (percentage)1
Long-term health condition Percentage of respondents
Arthritis 51
Heart conditions 29
Respiratory conditions 24
Diabetes 20
Vascular/Stroke 16
Mental health problem 13
Cancer 10
Dementia 4
Other 43
Many older people who completed the survey questionnaire have multiple long-term health
conditions: 30 per cent reported two, 20 per cent three, 10 per cent four, and 4 per cent five
or more such conditions (see Table 3.3). Seven per cent of respondents did not report
having a long-term health condition.
Table 3.3 Respondents reporting being diagnosed with multiple long-term health conditions (percentage)
The number of long-term health conditions Percentage of respondents
None 7
One 30
Two 29
Three 20
Four 10
Five or more 4
Total 100
1 The figures presented in this table do not add up to 100 per cent, as many participants lived with multiple
long-term health conditions.

17
Feelings about the management of long-term health condition
The survey aimed to explore how older people felt about the way their long-term health
conditions were managed. Participants were asked to indicate to what extent they agreed
with a series of statements, covering four areas: feeling fully informed about issues relating
to their long-term health condition; feeling fully involved in decisions regarding managing
their condition; feeling fully supported in managing their health condition; and feeling fully
in control of the care for their long-term condition. Very similar patterns have emerged in all
areas, with the majority either ‘agreeing’ (36-38%) or ‘strongly agreeing’ (53-55%) with the
four statements. Looking at those who did not agree with the statements, indicating that
they had negative feelings about the way their long-term health condition was managed, we
find that 12 per cent of respondents felt unsupported and 11 per cent not in control of
managing their long-term health condition, a slightly larger proportion than those who felt
uninformed or uninvolved in decisions (8%).
Satisfaction with life
Respondents were asked to mark on a scale of zero to ten how satisfied they felt about their
lives in general, with zero indicating extremely dissatisfied and ten indicating extremely
satisfied. Almost half (45%) of the older people who completed the survey were very
satisfied with their lives (choosing eight to ten), and a quarter (27%) were quite satisfied
(choosing six to seven). Another quarter (28%) were completely or mostly unsatisfied
(choosing zero to five), as shown in Figure 3.12. The average (mean) value on the
satisfaction with life scale is 7 (standard deviation: 2.3).
Figure 3.12 Satisfaction with life as a whole (percentages, n=1346)

18
Mental well-being
The survey included the ‘seven-item Warwick-Edinburgh Mental Wellbeing Scale’
(WEMWBS), a validated measure of mental well-being. Respondents were asked to rate
their feelings over the previous two weeks from 1 (none of the time) to 5 (all of the time) on
seven statements: ‘I’ve been feeling optimistic about the future’; ‘I’ve been feeling useful’;
‘I’ve been feeling relaxed’; ‘I’ve been dealing with problems well’; ‘I’ve been thinking clearly’;
‘I’ve been feeling close to other people’; and ‘I’ve been able to make up my own mind about
things’. Ratings were summed up, producing a total score ranging from 7 to 35 for each
respondent, and then the individual scores were averaged for the whole sample. The mean
value on the scale for all Survey One respondents is 25.8 (standard deviation=5.5, n=1208).
Social networks
Survey One also focused on participants’ loneliness, measured by four questions selected
form of the Revised UCLA loneliness scale (Hughes et al, 2004): ‘How often do you feel you
lack companionship?’; ’How often do you feel isolated from others?’; ‘How often do you feel
left out?’; and ‘How often do you feel in tune with the people around you?’. There were
three response options to each question: ‘hardly ever or never’, ‘some of the time’, and
‘often’. Around half of all respondents never or hardly ever or never lack companionship
(46%), feel isolated (52%) or feel left out (55%). At the other end of these three scales, 16
per cent often lack companionship, 15 per cent often feel isolated from others and 14%
often feel left out. Focusing on the positive question, 45 per cent often feel in tune with the
people around them, while 20 per cent hardly ever or never feel in tune with others. Thus,
in the ‘feeling in tune with other people around’ dimension of loneliness a slightly different
pattern has been found than in the other three dimensions.

19
Ethnicity
Older people who have completed the survey come from 16 different ethnic groups, with the majority from only two groups: 91% White British and 4% Indian (n=1392). These overall figures however hide large differences in the ethnic background of respondents in the 11 areas where fit for the future is being implemented: local level data are presented in Table 3.4. Proportions below 2.5 per cent are shown together under ‘Other’.
Table 3.4 Ethnic background of participants in the 11 areas (percentages) White
British Irish Other
White Indian Pakistani Other
Asian Other Total
Blackburn with Darwen
60 24 9 7 100
Cheshire East 98 2 100
Exeter 100 100
Hillingdon 62 6 21 5 6 100
Lancashire 97 3 100
Leeds 94 3 3 100
Newcastle 94 4 2 100
Nottingham and Nottinghamshire
95 5 100
Rotherham 99 1 100
Warwickshire 97 3 100
West Cumbria 99 1 100

20
Disability
59 per cent of older people who have responded to this question of the survey (n=1311)
consider themselves to live with a disability. Within this group, people mentioned several
different disabilities, as shown in Table 3.5.
Table 3.5 Respondents with different types of disability2
Disability Percentage
Chronic illness 60
Physical disability 39
Deafness / serious hearing impairment 7
Blindness / serious visual impairment 7
Serious mental health condition 5
Substantial learning disability 1
Substantial learning difficulty 1
Other disability 38
3.2. Profile of partner organisations
As explained in Section Two and Table 2.1, the partner organisations who were spoken to
through the stakeholder interviews represented a range of organisations, including CCGs,
GPs, local Age UK partners, local authorities and voluntary sector organisations. Many, if not
all, partner organisations represented through the stakeholder interviews are already
engaged in providing services to older people, though not exclusively through fit for the
future. The services that they provide include: information on support options; signposting
to specialised health services, such as hearing clinics or neurologists; activities and initiatives
to combat social isolation; exercise and sports instruction; campaigning, influencing and
lobbying on behalf of older people; transport; and statutory social care and health services.
The stakeholders stated that the organisations they represent support different groups of
older people, for example the ‘younger’ and the ‘older’ old; those with multiple health
conditions; those living in a range of different residential settings; those living in
disadvantaged areas or belonging to BME groups.
2 The percentages in Table 3.5 do not total 100%, as many respondents have more than one type of disability.

21
3.3. Summary: Main characteristics of the sample population
The average age of Survey One respondents is 75 years.
Three-quarters (74%) are women and a quarter (26%) are men.
Nine-tenths (91%) of respondents are White British and 4 per cent Indian.
30 per cent have one, and 63 per cent have multiple long-term health conditions.
60 per cent consider themselves to have a disability.
Over one-tenth (13%) are carers.
90 per cent of respondents do not smoke.
40 per cent drink alcohol, with 90 per cent consuming within the limits
recommended by the NHS.
60 per cent think physical activity is important and say they are doing something
about it, with walking being the most popular form physical activity.
Three-quarters think healthy eating is important and say they are doing something
about it, with 69 per cent eating at least three and 26 per cent at least five portions
of fruit and vegetables a day.
Over nine-tenths of respondents felt fully informed about and involved in the
management of their long-term health conditions.
Half hardly ever lack companionship, although a third do some of the time.

22
4. Implementing fit for the future: plans and current practices
4.1. Referrals to the programme
In this section we compare plans, as stated in expressions of interest by local Age UK
partners, and current practices, drawing on the evidence provided through the latest
monitoring data on referrals to the programme; stakeholder interviews; tailored plans and
case studies of older people.
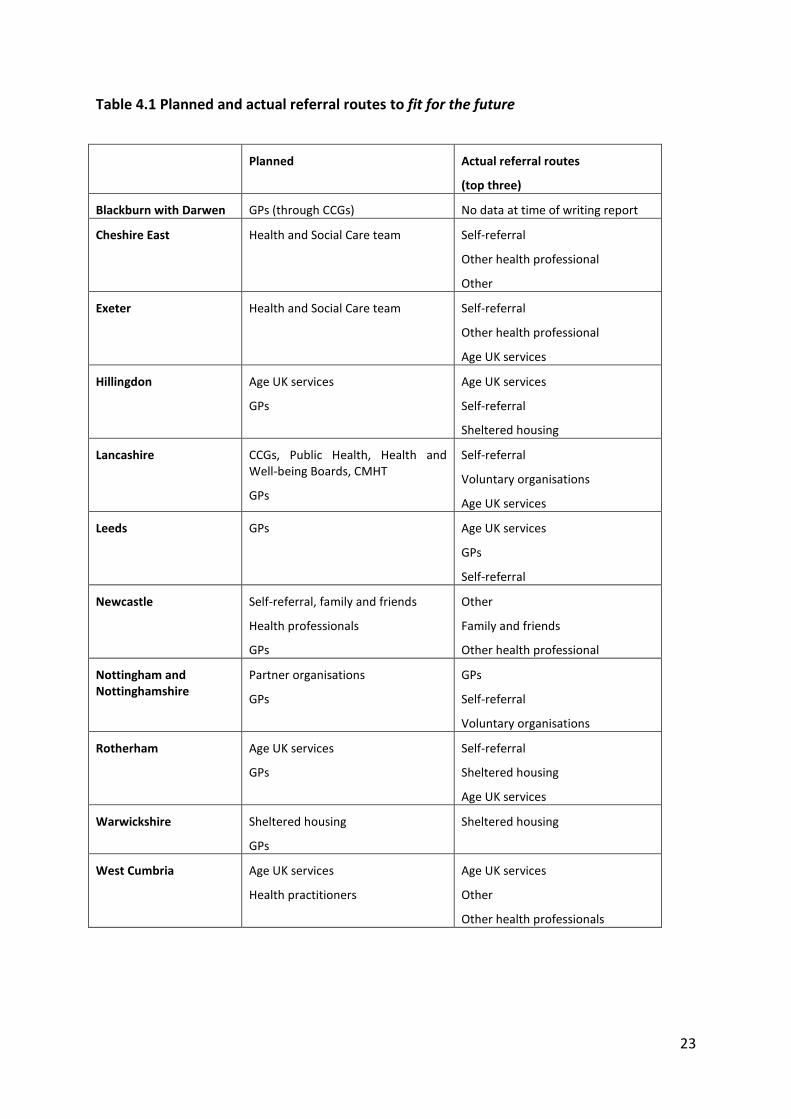
Local Age UK partners planned to recruit participants via health professionals, for example
GPs and Community Mental Health Teams (CMHTs); social care; sheltered housing; existing
local Age UK services; friends and families; and self-referrals (see Table 4.1). According to
recent monitoring data collected from local Age UK partners, most older people have been
referred to fit for the future from other Age UK services; by self-referral; and by ‘other’
health professionals, but, overall, less so by GPs. Two local Age UK partners, Nottingham
and Nottinghamshire and Leeds have recruited a large proportion of participants via GPs as
Table 4.1 shows. Rotherham and Warwickshire have had particular success with referrals
from sheltered housing.
23
Table 4.1 Planned and actual referral routes to fit for the future
Planned Actual referral routes
(top three)
Blackburn with Darwen GPs (through CCGs) No data at time of writing report
Cheshire East Health and Social Care team Self-referral
Other health professional
Other
Exeter Health and Social Care team Self-referral
Other health professional
Age UK services
Hillingdon Age UK services
GPs
Age UK services
Self-referral
Sheltered housing
Lancashire CCGs, Public Health, Health and Well-being Boards, CMHT
GPs
Self-referral
Voluntary organisations
Age UK services
Leeds GPs Age UK services
GPs
Self-referral
Newcastle Self-referral, family and friends
Health professionals
GPs
Other
Family and friends
Other health professional
Nottingham and Nottinghamshire
Partner organisations
GPs
GPs
Self-referral
Voluntary organisations
Rotherham Age UK services
GPs
Self-referral
Sheltered housing
Age UK services
Warwickshire Sheltered housing
GPs
Sheltered housing
West Cumbria Age UK services
Health practitioners
Age UK services
Other
Other health professionals

24
The importance of health professionals and GPs in the referral process emerged in some of
the detailed support / action plans and also in case study interviews with the older people
who were participating in fit for the future. Some of the older people inferred that they
sometimes took referrals from health professions more seriously than from other
organisations, as the example in Box 1 illustrates.
Box 1: The importance of GP referrals
An older person in Nottinghamshire stated that he had received a letter from his general practice inviting him to join an exercise group as part of the programme. He said that he would not have opened the letter had it been sent by Age UK or another voluntary organisation, saying that “there is so much rubbish mail these days.”
(Ron, Nottinghamshire)
Case studies with older people participating in the programme have also revealed that
clarity about their referral to fit for the future is important. The exact reason for being
referred to the programme by their GPs and the process of the referral was sometimes
unclear and somewhat puzzling for some participants, as the examples in Box 2 illustrate:
Box 2: The importance of clarity of communication about referrals
Ron and Kate in Nottinghamshire mentioned that they did not understand why they were ‘selected’ by their GP to be referred to the programme and this puzzled them even several weeks after they had completed the course:
“No one knows who decided who gets invited.” (Ron, Nottinghamshire)
“I don’t know why I was chosen, I think they just picked someone, I don’t know how it worked out.” (Kate, Nottinghamshire)
Although the above examples demonstrate that some GPs are getting involved in referrals
to fit for the future, as well as highlighting the importance of encouraging GPs and other
health professionals to refer older people to the programme, some stakeholders also
indicated that involving GPs in fit for the future was a challenging task, with some GPs
reluctant to engage. This reluctance, often due to time constraints, is something that has
been found in research elsewhere, for example in the identification and provision of support
to carers (Wigfield et al, 2012). Indeed, some potentially missed opportunities for referrals /
social prescribing were identified from the case study interviews with older people as
described in Box 3.

25
Box 3: Example of missed opportunities for referral
During a routine health check it was discovered that Tajinda had slightly elevated cholesterol levels and blood pressure, and although she was given advice about lifestyle changes, she was not referred to an exercise group. It was by chance that she found out about a walking club, run by Age UK, which was the first step towards becoming more active, losing weight and having lower blood pressure and cholesterol levels:
“My granddaughter brought a letter home from the school. It was about grandparents’ day, and it really appealed to me. There I heard about the walks. … I’ve just had a check-up and my cholesterol is very good, and so is my blood sugar. Before, my blood pressure and my cholesterol was borderline, so they put me on a small dose of medication. But exercise helped me a lot and it makes me a happier person, I think”. (Tajinda, Blackburn with Darwen)
The stakeholders mentioned that the system of referring older people to fit for the future
meant that parts of the health and social care system were becoming more ‘joined up’, with
examples of referrals to the programme from the health sector. Examples cited included
district nurses and General Practices who provided older people with information and
advice about available services and promoted the programme; referrals from General
Practices or hospitals (social prescribing); social prescribing as a form of prevention, when a
referral was made to prevent a health condition deteriorating; and CCGs discussing ways in
which the programmes’ scope could be widened (see section 5.4 for a more detailed
discussion).
4.2. Nature and delivery of services and activities
In this section we focus especially on the four localities (Blackburn and Darwen; Leeds;
Nottingham and Nottinghamshire; and Rotherham) where the completed case studies allow
us to reflect on how the local Age UK partner plans for fit for the future have been
implemented and enable us to analyse participants’ experiences of the activities.
The types of services and activities offered
Local Age UKs offered a variety of services and activities in the framework of fit for the
future.
Improving physical activity
Exercise groups: Yoga; Zumba; Tai Chi; led walks; Trampolining; swimming, and Aqua
Mobility.

26
Healthy eating
Courses on healthy eating: nutrition course
Workshops on healthy eating: these workshops were integrated into the activities of
‘multi-purpose’ groups (discussed below in more detail)
Social engagement activities
The activities and services in this category aimed to improve participants’ social
networks, reduce isolation and thus improve their mental well-being.
Arts and crafts: making cards using various techniques, origami, knitting, crocheting.
Games and quizzes: cards, dominoes, bingo, quizzes (designed by the facilitator,
participants forming groups).
Befriending service: visits and telephone calls from Age UK staff and volunteers (also
offered to Age UK clients who do not participate in fit for the future).
Internet/digital skills training: courses on using the internet and tablets, also
provided in the form of one-to-one tuition. These services are included here,
because case study participants explained that they primarily used the internet to
keep in touch with friends and family.
Delivery of the services: providing complex, highly personalised services and support
The collection of services, listed above, aim to improve participants’ well-being in the
broadest, most holistic sense. The different ways in which this support is being provided and
delivered are listed here:
1) Signposting: participant older people are sent information about services available
for them to access, this includes: a) information about local services provided by
other organisations, such as the Breathe Easy Group and Ear Foundation leaflet
(Nottingham and Nottinghamshire); and b) information material produced by Age
UK, such as the Healthy Eating Guide, Save Energy, Pay Less Guide, Home Safety
Checker Guide, and Winter Wrapped Up Guide. The support / action plans devised
for the participant older people indicate that this kind of signposting took place after
the needs assessment, and thus only the relevant guides were given to the
participants.
2) Referrals: participant older people are also referred to other appropriate services,
following their initial assessment in fit for the future. Some of the services that they
have been referred to include: Age UK Benefit Check; Age UK Debt Advice; Age UK
Advice and Information Outreach; Green Doctor (a voluntary organisation making
homes more energy efficient); Library at Home service; home care providers; Vision
Consortium; local organisations which run groups for older people (bingo, lunch
club); local charities organising home care services; Adult Social Care services at the
local authorities; Fire Service (for safety check, fitting fire alarms).

27
3) Practical help: Some participant older people have been provided with practice help
following their assessment, for example, Age UK staff / volunteers have made
arrangements to: have a water metre fitted; get boilers and heaters repaired; get
rebates from utility service providers; set up insurance for household items; and
contacted the local authority to arrange for assisted refuse collection.
4) Personal support and encouragement: many case study participants received regular
phone calls from Age UK as a result of participating in the fit for the future
programme. Age UK staff / volunteers also supported older people to improve their
well-being, for example: they accompanied Tajinda to exercise classes until she was
confident enough to go independently; encouraged Peter to go for a short walk
every day; encouraged Rachel to join groups and attend activities out of the home
rather than staying at home where she is visited and telephoned by Age UK staff and
the volunteers of the befriending service; advised Kate about care home options and
accompanied her to visit potential care homes for her husband.
The group-based activities (mentioned above) were organised differently by local Age UKs
and their partner organisations. Based on the case study interviews with participants so far,
we have identified two models of providing services to older people:
Organising new, ‘multi-purpose’ fit for the future groups with the intention of
engaging older people in social activities, and improving physical activity and healthy
eating (this model is evident in Rotherham);
Encouraging fit for the future participants to join ‘single purpose’ groups (either
existing or newly developed ones), focusing on physical activity or nutrition
(Blackburn with Darwen, Leeds, Nottingham and Nottinghamshire).
These models are not necessarily reflected in the expressions of interest that the Age UK
partners submitted but appear to have emerged once the programme implementation has
commenced. The two contrasting examples in Boxes 4 and 5 illustrate how two older people
engaged in the two types of group:
Box 4: ‘Multi-purpose’ groups
Sue joined the special fit for the future group that was organised by Age UK Rotherham in her village. She describes the group activities in this way:
“[We do] exercise and we always do a quiz. Play games and dominoes because we have a couple of men who come and like cards and dominoes. Scrabble. There’s always a craft table. … This is it, you see, because [another group member] has very bad arthritis, and she’s been crocheting to keep her fingers going.”
(Sue, Rotherham)

28
Box 5: ‘Single-purpose’ groups
Sarah has attended three different groups organised by Age UK Leeds, including a fit for the future Zumba Gold class:
“I went first to do a computer course. … The writing class just came after that. … Zumba [came because] I was looking for an exercise class, [and it] is great fun.”
(Sarah, Leeds)
Participants reported that they received complex, highly personalised support in all
locations, regardless of the model adopted in the delivery of group-based activities. It
emerged from the case studies that Age UK staff / volunteers paid specific attention to
ensuring that individual needs were at the centre of their provision. In Rotherham for
example, one participant was offered tailored help through a ‘multi-purpose group’ when
she was discharged from hospital. Another participant attended a ‘single-purpose’ group
focusing on nutrition in another local Age UK locality, and was given help with choosing a
new care home for her husband. This therefore reflects an additional unexpected outcome,
and highlights the holistic nature of the programme.3
The tailored support/action plans and the follow up notes have revealed that Age UK staff
and volunteers view supporting participants with complex needs as a gradual process. This
is most evident in the case studies of older people who were in poor health at the beginning
of their engagement with the programme: their support started with arranging personal and
housekeeping services and reducing their social isolation. These steps were thought to
prepare the older person for going out more and becoming involved in activities designed to
increase their physical activity.
Accessibility of services and activities
According to case study interviewees, some older people found fit for the future attractive
because the services were easy to access: in terms of time, location, transport options and
fees. These factors can be separated for analytical purposes, but they all come together and
influence the decisions of individual participants. Some interviewees mentioned that fit for
the future groups were run at times that best suited them, whereas ‘standard’ exercise
classes in gyms or community centres were often run at inappropriate times, sometimes
starting too late.
3 These types of unplanned interventions are hard to formulate as targets and quantifiable outcomes of a
specific programme, but they are very important for the participant and also take up the time of Age UK staff, and are thus important elements of the report.

29
Box 6: Providing activities at appropriate times
One case study participant explained that older people may have more free time than those who are employed, but they do not necessarily have the energy later in the day:
“I was looking for an exercise class but everything was so expensive. And … most classes are in the evening and I’m tired.”
(Sarah, Leeds)
Offering activities at suitable times was particularly important for the participant older
people who are also carers, as they often have a very strict daily routine, limited by the
availability of formal care services that they can draw on to enable them to go out and leave
the person being cared for. Even those carers who have a relatively light care load may be
restricted in terms of their ability to leave the home (see Box 7, for example).
Box 7: The importance of appropriate activity start times for carers
Kate in Nottinghamshire was interested in joining fit for the future exercise classes, but they were in the afternoon, when Kate visits her husband in a care home:
“They also offered an afternoon dance thing. Then they were doing this sitting down yoga, but that was in the afternoon, and I could not take up on those, and I told them about the situation. If it was in the morning that’d be great, or if it finishes by 3 o’clock and it’s [here], it’s not too bad, but most of them were 2-4 pm, so that’s not good for me”.
(Kate, Nottinghamshire)
The overall cost of accessing services was mentioned by many of the interviewees. They said
that they were more likely to access the services if they were free of charge or relatively
cheap. The cost that they were referring to included the fees they paid for the services, the
room hire and the cost of transport to the venues. Some participants mentioned that the
cost was often kept down through fit for the future, particularly if the venue was provided
free of charge, which sometimes happened as a result of a special arrangement with the
local authority.

30
The example in Box 8 illustrates how the low cost and convenient location contributed to
and an older person’s decision to choose fit for the future services over mainstream
exercise classes.
Box 8: The importance of the low cost of activities
“You see, the good thing is that I can come here on the bus and that’s free, so I have to pay only for the class and that’s minimal. And the bus stops just outside. I probably would have found something else, but it suited me to come here and I enjoyed coming here.”
(Sarah, Leeds)
The location of the group sessions was particularly important for older people who were
carers or who had limited mobility, as the example in Box 9 illustrates.
Box 9: The importance of the location of the activities
Adam and his wife use a car to go into the town centre from their sheltered accommodation as Adam walks very slowly and his wife is in a wheelchair. The ‘multi-purpose’ group meets only a hundred meters from their bungalow, and has been their main source of social contact apart from their family in the last couple of months.
Feeling accepted by other group members was particularly important to some participants,
as the examples in Box 10 illustrate.
Box 10 The importance of feeling accepted and welcome by others in the group
Anne (Blackburn with Darwen) suffered from an impaired sense of balance and facial palsy as consequence of brain surgery. Physical exercise was vital in helping her to learn to walk again and improve her sense of balance, but Anne was at first embarrassed about her appearance. Others in her Zumba and walking groups were understanding and supportive, and the regular exercise helped her to recover remarkably fast.
Tajinda (Blackburn with Darwen) felt comfortable with joining first the walking group then the swimming and aqua mobility classes because there were several other Asian women in the groups and the activities were tailored to their needs.

31
4.3. Summary: Implementing fit for the future
Local Age UKs have adopted a variety of approaches to recruiting fit for the future
participants. Detailed analysis is required to learn from the different local practices.
Overall, GPs have been difficult to engage in the referral process. However it
emerged from the case studies that referrals from health professionals may be taken
more seriously than invitations from voluntary organisations, which suggests that
engaging more General Practices would benefit the programme.
Case studies highlighted the importance of older people being informed about the
referral process and the activities offered in fit for the future groups.
Two models of providing group-based activities have been identified: ‘single-’ and
‘multi-purpose’ groups; in some cases ‘outreach’ services have also enabled frail
older people to benefit from the programme in their own homes.
fit for the future activities were more affordable and more accessible to older people
than mainstream exercise groups, due to more appropriate start times and more
convenient locations.

32
5. Impact of Fit for the future
In this section we draw on the case studies with older people, and the interviews with
stakeholders to provide a preliminary assessment of the programme’s initial impact on
participating older people, individual organisations, including local Age UK partners, local
partnerships and the wider health and social care system in England.
5.1. Impact on participants4
The programme’s impact on older people’s lives cannot be discussed strictly according to
the three outcome areas of the Well-being Programme of the Big Lottery Fund (physical
health; healthy eating; and mental well-being), as participants and stakeholders talked
about their expectations, experiences and perceptions of the programme’s impact in an
interconnected way.
When talking about their expectations of Fit for the future, older people who were
interviewed in the case studies most often mentioned socialising and making new friends.
Expectations varied depending on how they became involved in the programme: older
people who joined the programme through self-referral appeared to have better defined
objectives and they were often actively seeking activities outside the home. They also had a
clear idea of what they wanted in terms of the kinds of activities that they wanted to access
and were prepared to be on a waiting list for their preferred group / activity (Box 11).
Box 11: Self referrals often have clearly defined objectives
Louise, who attended three different exercise groups in fit for the future, was consciously looking for ways of becoming more physically active and having fun:
“I promised myself that when I retire it’s not going to be boring. … I signed up while I was still working, and by the time I retired I had a place in the groups.”
(Louise, Leeds)
Many of those who were invited by Age UK to participate in the programme said that
although they were not actively seeking activities outside the home, they responded
positively to the invitation to get involved because they wanted to meet new people, as the
following example in Box 12 illustrates:
4 As only 18 case studies have been completed, these are tentative findings and the findings outlined here may
be modified later.

33
Box 12: Avoiding isolation and meeting new people
“We didn’t really know, we just went across and they said we were going to chat and you know do crafts and quizzes. I love quizzes, they keep your brain going and I do like crafts. … They said they would be organising little trips out, so I just thought, it’s something different. And also, meeting different people. See, I missed that. Because in my job I was travelling up and down the country, meeting different people every day, you do tend to miss it later.”
(Sue, Rotherham)
A group of older people engaging with the programme, who spoke about their expectations
of it in relation to reduced isolation and loneliness, was carers. This included older carers
who had recently ceased caring due to the death of the person being cared for, and who
were currently experiencing transition from an intensive and stressful time (Box 13).
Box 13: The importance of social interaction for current and past carers
Barbara only alluded to how difficult caring for her late husband had been, but her best friend explained that Barbara had lost a lot of weight and suffered from anxiety, and had also been ‘tied to the house’ while caring for her husband who suffered from Alzheimer’s disease. She benefitted from joining a fit for the future group, in her friend’s words:
“She’s more outgoing. She’s out and about. … She’s got something to look forward to.”
(Barbara’s friend, Rotherham)
The most often mentioned improvement was increased social engagement (Box 14).
Box 14: The importance of social interaction
“My Mondays have changed.” (Sue, Rotherham)
“This group has been a lifeline.” (Joanna, Rotherham)
Older people participating in fit for the future often perceived the programme’s impact on
their well-being in a holistic way and emphasised the connections between improved
physical and overall well-being (see for example Box 15).

34
Box 15: Improving physical activity and overall well-being
“Zumba makes me happier because I enjoy it. I don’t think it does much for anything else (laughs). It makes me breathe a bit harder. Meeting people that you know, having a chat, having a coffee.”
(Sarah, Leeds)
“The main benefits of the programme? Hmm, learning new things, going out and having a laugh.”
(Louise, Leeds)
Sarah and Louise, who were quoted above mentioned ‘having a laugh’ and ‘having a chat,
having a coffee’ as part of the positive experience of joining an exercise class. The
relationship between physical exercise and overall well-being also worked the other way
round, as Barbara’s example illustrates (Box 16):
Box 16 Benefits of social interaction and physical activity
Barbara joined a Fit for the future group primarily to meet new people and improve her low moods, but she is now feeling the benefits of physical exercise as well:
“I feel better because I go out more, and because I’m feeling more fit, I can cope better”
(Barbara, Rotherham)
Expectations of learning about healthy eating have so far been less common in the case
study interviews. This may be explained by the fact that, of the case study interviews carried
out to date, only older people living in Nottingham and Nottinghamshire mentioned groups
focused solely on nutrition. However, a few participants have reported that they had
developed healthier eating habits as a result of their participation in fit for the future (Box
17):

35
Box 17: Healthy eating
Anthony thought that the nutrition course he had attended was useful:
“I’ve learnt a few new recipes on the course. Our favourite is the cheese and chive bread, everybody loves it.”
(Anthony, Nottinghamshire)
Sue, who attended a ‘multi-purpose’ group, benefitted from a short activity focussing on healthy eating:
“I wouldn’t say [my diet] has changed but there are certain things that I became aware [of], things you let slip a little bit and it brought it back to the forefront. I mean we had a thing the other day, all different fruit, and I thought, you know, I like all those, so why do I only buy bananas, apples and pears, why not other types of fruit? So I started buying blueberries.”
(Sue, Rotherham)
However, the following example from a case study illustrates that these positive changes
can easily be lost, and that continued support to reduce stress is sometimes needed (Box
18)
Box 18 Learning about healthy eating and mental well-being “I did change the way I cook until a couple of weeks ago, and then it just all went… I was worried about my husband and I was on the go all the time, so I just can’t be bothered. I mean I do things and then I freeze them. It’s boring to cook for yourself.”
(Kate, Rotherham)
Case studies with older people participating in fit for the future have also revealed that, in
some cases, expectations were unmet, particularly when the details of the activity or group
had not been fully explained, as the following example illustrates (Box 19).

36
Box 19: The importance of providing an accurate description of the activities
Ron was then invited to a group focusing on healthy eating and nutrition, which did not meet his expectations:
“I didn’t really know what it was going to be. I went to the four sessions. I suppose it wasn’t many of us, only eight people. We talked about food. They got us cooking something. I thought it was going to be more like a lecture. It wasn’t what I expected. I did learn something I suppose. I expected a more detailed discussion about food.”
(Ron, Nottinghamshire)
Impact on older people – from stakeholders’ point of view
When asked about the impact of the fit for the future programme on the older people
participants, some stakeholders said that it was too early to comment or to point to specific
examples where they had experienced an impact. Others felt that older people had already
experienced a positive impact and pointed to positive feedback they had heard from
participants, and one stakeholder mentioned positive feedback from General Practitioners.
At this stage, the two main positive impacts of the programme on older people that have
been highlighted by the stakeholders are: the engagement of older people who had not
previously been involved in other local Age UK activities; and the creation and provision of
new activities which had not previously been available to older people. Some examples of
the benefits in both these areas are provided in both Box 20 and Box 21.
Box 20: Fit for the future engaging with a wider range of older people
‘There is one client that’s really benefitted from involvement in fit for the future. A lot has been done to engage this lady and take her to social groups, which she loves. It’s been really positive’.
(Stakeholder in Hillingdon)
We have some who are very isolated. One is a lady in her 90s. She was referred by her doctor. She had depression, never went out. She’s now got a befriender, she’s linked into the door to door service to shops, lunch clubs, [and] she does exercise. She had nobody, now she’s got a much more active life. I could see a different woman.’
(Stakeholder in Newcastle)

37
Box 21: The benefits of activities resulting from fit for the future:
‘Some specific falls prevention efforts have helped particular clients’
(Stakeholder in Hillingdon)
‘I’ve seen activities, people are doing physical things, … it improves confidence.
(Stakeholder in Rotherham)
Differences between participants benefitting from the programme:
The evidence so far from the case studies shows that participants have not necessarily
benefitted from the programme in the same way or to the same degree. One of the main
reasons for the different experiences that the older people have had in relation to the
programme can be attributed to the health of the participating older person.
As already alluded to in Section Four, some older people participating in fit for the future,
were aware of the exercise classes available to them, but felt that these were beyond their
abilities, and therefore they engaged in and benefitted only from the social engagement
aspect of the programme (Box 22):
Box 22: Benefits of the programme may be limited by poor health
Marie (Blackburn with Darwen) participated in Knit and Natter, benefitted from debt advice and her mental health has improved a great deal as she made new friends. However, she felt that walking and other forms of exercise offered in the programme were difficult for her, because of her arthritis, which contributed to her undergoing knee and hip surgeries.
Gender is another important factor influencing how older people benefit from fit for the
future. Firstly, this relates to the way men and women deal with their long term health
condition, and to the way they react when they are approached and being offered help. Two
of the five older men who participated in case studies so far mentioned jokingly that they
were ‘supported by women’, referring to staff at Age UK and other voluntary organisations
and befriending volunteers. It was also clear from these interviews that they had difficulty
coming to terms with their health conditions. Secondly, gender is an important factor when
influencing group dynamics. Case study participants explained that some men found it
difficult to engage in groups where there were more women. In a group in Rotherham, for
example, women participants thought that the only man dropped out exactly because he
was the only man in a group of women. Remaining group members were aware of this and
were planning to invite other men. Thirdly, gender / masculinity construction may not only

38
affect how men participate in the programme, but also contribute to their willingness to join
the programme in the first place.
5.2. Impact on individual partner organisations
Stakeholders were asked about the impact of their involvement in the programme on their
own organisation. Many stakeholders indicated that it was too early to state what the
impact had been in this respect, however, some stakeholders stated that there were
positive effects being experienced already. Stakeholders representing parts of the NHS or
local authorities mentioned that they had increased the number of referrals that they make
by referring older people to the fit for the future programme. Those stakeholders
representing Voluntary, Care and Faith (VCF) sector organisations, on the other hand,
mentioned a series of slightly different benefits. Some said that their organisations
experienced more referrals of older people to the activities that they are offering as a result
of the programme. A couple of the stakeholders who were interviewed actually stated that
the organisations they represent had been ‘a victim of their own success’, experiencing an
increase in referrals which they were unable to always accommodate. They stated that they
had been unable to increase supply of services to match the increased demand that had
been generated as a result of the programme.
Some of the stakeholders representing the VCF sector indicated that the increase in
referrals had wider benefits for the organisation, including: developing new voluntary roles
within the organisation; raising the awareness of organisation amongst the wider health
and social care system; assisting the participating VCF sector organisation to reach a wider
range of older people; increasing their organisations lists of potential service users;
increasing the usage of local community centres and venues, which in turn brings additional
income into the organisations as users spend money on refreshments and other products
and services.
5.3. Impact on local partnerships
Stakeholders were asked about their expectations in relation to partnership working for the
fit for the future programme and the extent to which those expectations had been realised.
Initial expectations were listed as including: successfully engaging with GPs; gaining access
to more and a wider range of older people than individual organisations have done; working
with older people on a one-to-one basis and providing appropriate, tailored support; an
increase in the use of community centres and venues; providing services / organising
activities which are beyond medical intervention and enabling older people to get ‘out and
about’; and improving older people’s mental health.
When asked if expectations about partnership working has been realised, the views of
stakeholders were somewhat mixed. Many felt that their expectation had been realised or
were in the process of being realised. Examples of positive benefits included some new

39
partnerships that have been developing and/or existing partnerships which are being built
upon as a result of the programme. Just under half of those stakeholders who have been
interviewed so far, for example, said that they had developed or strengthened links with the
NHS. One stakeholder mentioned links they have established with emergency services.
However, there was a general consensus among stakeholders that the fit for the future
programme has not yet facilitated the process of partnership building as much as it could
have and that further work in this direction is desirable. In addition, a significant minority of
the stakeholders who were interviewed thought that there was not any real partnership
working as part of the programme.
Some of the stakeholders also outlined other areas where they felt that their expectations
of the programme had not been met. These included difficulties accessing GPs in some
localities, and for some partners; some difficulties engaging with volunteers, in particular
recruiting volunteer buddies; and the inability to meet demand for services in areas where
the programme has been particularly successful in engaging large numbers of older people.
5.4. Impact on the wider health and social care system
Stakeholders were also asked about the way in which fit for the future was having an impact
on the wider health and social care system but most were unable to answer this question.
This is partly because the programme is at an early stage of development and partly
because some of those stakeholders who have been interviewed do not feel that they have
the knowledge to answer this question. This reiterates the need for stronger partnership
working between health, social care and the voluntary sector and a need to raise awareness
of the programme across the health and social care system.
Nevertheless, many stakeholders said that they had started to see improvements in local
level integration of health and social care as a result of fit for the future, such as wider
knowledge of the services available elsewhere in the system; and the growing number of
referrals across the health and social care system, although it is clear that these
improvements are still at a fairly early stage of development.

40
5.5. Summary: Impact
Case study participants invited to join fit for the future groups responded positively
to the invitation because they wished to meet new people.
Case studies joining through self-referral were often actively seeking activities
outside the home.
Almost all case study participants said they had benefitted from the programme.
Some partner organisations benefitted from the increased number of referrals, while
others were unable to meet the increased demand for their services.
Engaging volunteers was difficult in some areas, further analysis is necessary to
unpack the reasons.
Existing relationships between organisations have become stronger, but partnership
building has not yet been facilitated by fit for the future, with some stakeholders
unaware of the programme.

41
6. The future and sustainability
Older people who were attending fit for the future groups when the case study interviews
were conducted said that they liked the groups and wanted them to continue. Participants
in the ‘multi-purpose’ fit for the future groups in Rotherham have directly experienced and
reflected on the issue of sustainability, and although they were sorry about not meeting Age
UK staff every week, they were keen to ‘keep’ their groups, as the following quote illustrates
(Box 23):
Box 23: Fit for the future groups becoming ‘self-funding’
“Age UK has finished now and the Lions have taken over. It’s a shame because they had these groups going, but they couldn’t continue, they had only so many weeks. I think they have to move on and have to start groups in different areas. Now we are self-funding. The local council have just given us £400 to pay for a day trip.”
(Sue, Rotherham)
As the groups in the Rotherham area became self-funded, one participant was concerned
about the cost of the room hire, while others were concerned that the group may dissolve
and they would lose their newly formed links.
The stakeholders who were interviewed were overwhelmingly in agreement that fit for the
future is an important programme and should be continued beyond the existing funding
that is available through the Big Lottery. The key reasons given were that beyond the
importance of the programme in terms of improving health and well-being, the programme
provides a programme of support which facilitates prevention and helps combat social
isolation and promote independence. One stakeholder said, for example (Box 24):
Box 24: Combatting social isolation
“It [fit for the future] gets people out of the house, combats social isolation, people learn new skills, it helps to keep them healthy, it is good for their health”
(Stakeholder, Nottingham and Nottinghamshire)
Another reason given for the need to continue the programme was that it supports
integration across service provision, as a stakeholder involved in social prescribing as part of
fit for the future said (Box 25):
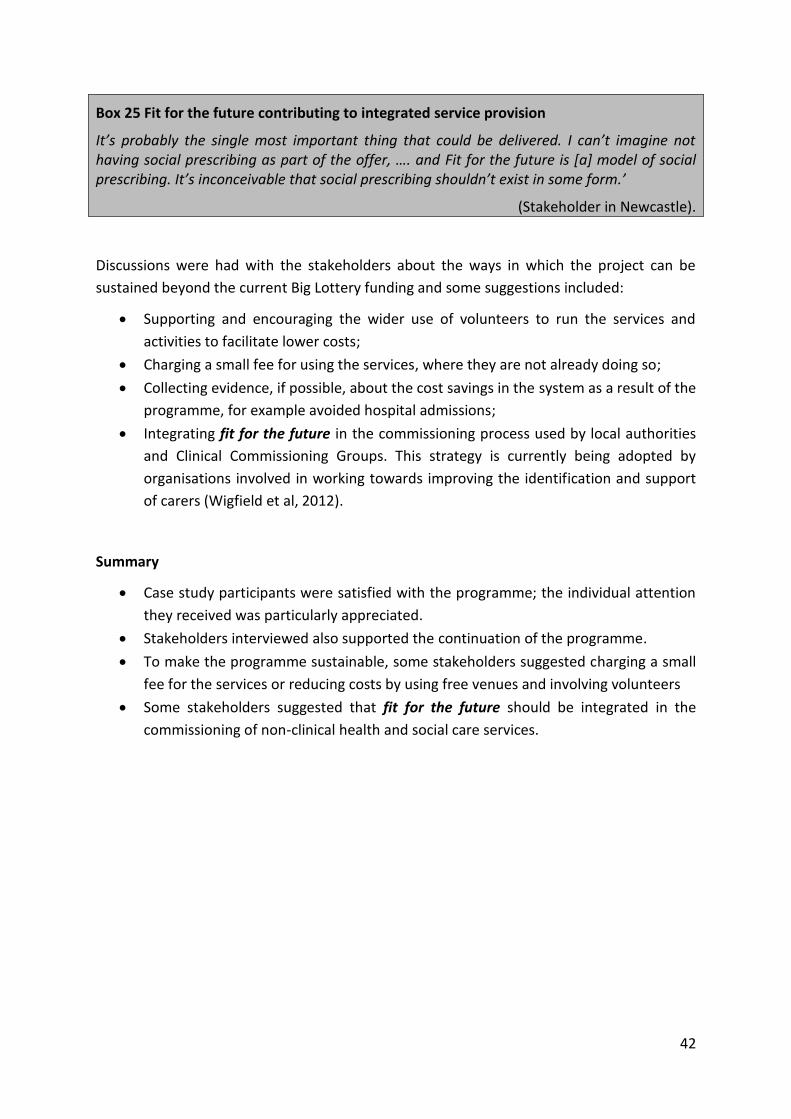
42
Box 25 Fit for the future contributing to integrated service provision
It’s probably the single most important thing that could be delivered. I can’t imagine not having social prescribing as part of the offer, …. and Fit for the future is [a] model of social prescribing. It’s inconceivable that social prescribing shouldn’t exist in some form.’
(Stakeholder in Newcastle).
Discussions were had with the stakeholders about the ways in which the project can be
sustained beyond the current Big Lottery funding and some suggestions included:
Supporting and encouraging the wider use of volunteers to run the services and
activities to facilitate lower costs;
Charging a small fee for using the services, where they are not already doing so;
Collecting evidence, if possible, about the cost savings in the system as a result of the
programme, for example avoided hospital admissions;
Integrating fit for the future in the commissioning process used by local authorities
and Clinical Commissioning Groups. This strategy is currently being adopted by
organisations involved in working towards improving the identification and support
of carers (Wigfield et al, 2012).
Summary
Case study participants were satisfied with the programme; the individual attention
they received was particularly appreciated.
Stakeholders interviewed also supported the continuation of the programme.
To make the programme sustainable, some stakeholders suggested charging a small
fee for the services or reducing costs by using free venues and involving volunteers
Some stakeholders suggested that fit for the future should be integrated in the
commissioning of non-clinical health and social care services.

43
7. Potential areas for improvement
At this early stage of the programme’s development it was felt important, as part of the
evaluation, to ask both participants and stakeholders how the programme could be
improved. This will help ensure that early lessons from the programme can be disseminated
to local Age UK partners and considered during the next phases of the programme’s
delivery.
Very few case study participants mentioned areas for improvement, apart from some very
specific issues such as more convenient times for specific activities to commence and one
person who mentioned that the range of activities available was too limited at present.
Issues mentioned by stakeholders included setting out in a clearer way the outcomes
expected as a result of the programme; raising awareness of the programme amongst a
wider group of organisations, including amongst GPs (despite the known challenges);
increasing publicity through adverts in newspapers, newsletters to stakeholders; avoiding
duplication but signposting to and building on existing classes and activities rather than
setting up new ones offering identical services; and getting a better match between
assessing the need of individuals and providing the activities that best meet those needs.
This does not always occur currently but is not always easy either, due to capacity and
funding constraints. It was suggested that consideration should be given to the involvement
of volunteers: some stakeholders thought that more volunteers should be involved, while
others thought that there should be a greater reliance on paid staff. Finally, one stakeholder
suggested that it was important to collect ‘hard’ evidence rather than anecdotal comments
about the impact of the activities, at the same time warning against asking intrusive
questions.

44
8. Summary and conclusions
This interim report aimed to provide a summary of the initial findings on the fit for the
future programme, including the benefits felt by older people and its potential impact on:
statutory bodies in health and social care and the Voluntary, Community and Faith sector.
Focussing on the processes through which participants were recruited or referred to the
programme we found that the recruitment targets had been met in most of the 11 areas,
albeit through different approaches and methods. Referral routes were somewhat different
from those originally planned, which highlights the challenges of engaging health
professionals in the programme. More detailed analysis is necessary to unpack the reasons
behind the locally specific referral patterns and the divergence from plans.
Data emerging from the case studies suggests that older people joined the programme
primarily to expand their social networks, though some self-referrers were also seeking
physical activity. Looking at fit for the future groups, two models of service provision have
been identified: ‘single-purpose’ groups focus on promoting healthy eating or increasing
physical activity; while the ‘multi-purpose’ groups observed so far primarily focus on social
engagement, with physical activities and healthy eating workshops included.
Considering the accessibility of activities, fit for the future activities were more accessible
than mainstream services to older people, due to more appropriate start times and more
accessible locations. Fit for the future groups were also more affordable. Although ‘hard to
reach’ groups of older people, such as carers and those with limited mobility, could access
the group activities, or benefit from services in their own homes, further attention to their
specific needs is essential in order to ensure that they are successfully engaged in the
programmes.
The programme’s impact has been analysed by focusing on older people and on individual
organisations and local partnerships involved in the delivery of the programme, from the
point of view of participants and stakeholders. Both participants and stakeholder reported
improved overall well-being among participants, attributing this primarily to more intensive
engagement in social activities. One stakeholder observed that the physical activity of
participants had increased, and a few stakeholders mentioned that new groups of older
people had been successfully engaged in activities and new types of activities were offered.
Benefits in terms of increased physical activity and improved healthy eating practices were
also illustrated by case studies. Further analysis is needed to explore how different groups
of older people, such as carers, men, and those in poor health and/or living with disabilities
experience the programme’s impact. Although a few case studies drew attention to unmet
expectations, older people were satisfied with the programme in general and with the
person-centred approach in particular.
Findings on the impact on organisations and on local partnerships involved in the
programme have highlighted improved social prescribing practices, and the strengthening of
existing relationships between organisations in some areas. Areas of concern were also

45
identified, however: it was challenging to engage new volunteers, and there was consensus
among the interviewed stakeholders that fit for the future had not met their expectations of
facilitating partnership building. Despite the criticism, the stakeholders interviewed so far,
and most case study participants, supported the continuation of the programme, with some
expert stakeholders recommending that the programme be integrated into local-level
commissioning of community-based health and social care services.

46
9. References
Bardsley, M., Billings, J., Dixon, J., Georghiou, T., Lewis, G.H., Steventon, A. (2011). "Predicting who will use intensive social care: case finding tools based on linked health and social care data", Age and Ageing, Vol. 40 No.2, pp.265-70.
Hughes ME, Waite LJ, Hawkley LC, Cacioppo JT. (2004) “A short scale for measuring
loneliness in large surveys: Results from two population-based studies”, Aging Research Reviews; Vol 26 No 6, pp. 655–672.
Jowit, J. (2013). “Britain’s ageing population: the impact on families and services”, The
Guardian, Sunday, 24 February, available at: www.guardian.co.uk/society/2013/feb/24/ageing-population-impact-familiesservices (accessed 1 July 2013).
The King’s Fund (2013). Co-ordinated Care for People with Complex Chronic Conditions [online]. Available at: http://www.kingsfund.org.uk/sites/files/kf/field/field_publication_file/co-ordinated-care-for-people-with-complex-chronic-conditions-kingsfund-oct13.pdf (accessed on 27 August 2013).
Victor, C. (2010). Ageing, health and care. Policy Press Wigfield, A., Moore, S., Buse, C. and Fry, G. (2012). Workforce development for Assisted
Living Technology: Understanding Roles, Delivery and Workforce Needs. CIRCLE, Leeds. Wigfield. A., Wright, K., Burtney, E. and Buddery, D. (2013). “Assisted Living Technology in
Social Care: workforce development implications”, Journal of Assistive Technologies, Vol 7. No 4: 204-218.

- 1 -
10. Annex
Survey One Frequency Tables: All areas

- 2 -
List of tables
Table A 1 Age: computed using Q3 ‘What is your date of birth?’ and Q1 Today’s date (years) ........................ - 5 -
Table A 2 Age groups .......................................................................................................................................... - 5 -
Table A 3 Q5 Do you live alone, or do you share your home with one or more other person? ......................... - 6 -
Table A 4 Q6 Is there anyone sick, disabled or elderly whom you look after or give special help to? ............... - 7 -
Table A 5 Q7 Which of the following best represents your attitude to healthy eating? .................................... - 8 -
Table A 6 Q8 How many portions of fruit and vegetables have you eaten on an average day? ........................ - 9 -
Table A 7 Q9 Over the last two weeks, on average, how often have you eaten a meal that has been prepared
and cooked from basic ingredients? ................................................................................................................. - 10 -
Table A 8 Q10 Which of the following best represents your attitude to physical activity? ............................. - 11 -
Table A 9 Q11 Over the last two weeks, how many minutes did you walk on an average day? ...................... - 12 -
Table A 10 Q12 Over the last two weeks, how many minutes of physical activity did you do per week that made
you breathe somewhat harder than normal, not including walking? .............................................................. - 13 -
Table A 11 Q13 Over the last two weeks, how many minutes of muscle strengthening activity did you do per
week?................................................................................................................................................................ - 14 -
Table A 12 Q14a Confidence - walking around the house ................................................................................ - 15 -
Table A 13 Q14b Confidence - doing light housekeeping ................................................................................. - 15 -
Table A 14 Q14c Confidence – doing simple shopping ..................................................................................... - 15 -
Table A 15 Q14d Confidence - preparing a meal .............................................................................................. - 16 -
Table A 16 14e Confidence - getting myself up in the morning ....................................................................... - 16 -
Table A 17 Q15a Height (in metres, computed) ............................................................................................... - 17 -
Table A 18 Q15b Weight (in kilograms, computed) .......................................................................................... - 17 -
Table A 19 Q15c Waist circumference: inches ................................................................................................. - 17 -
Table A 20 Q16a Do you smoke? ...................................................................................................................... - 18 -
Table A 21 Q16b If yes, how many cigarettes do you smoke per day? ............................................................ - 18 -
Table A 22 Q17a Do you drink alcohol? ............................................................................................................ - 19 -
Table A 23 Q17b If yes, how many units of alcohol do you consume per week? Men .................................... - 19 -
Table A 24 Q17c If yes, how many units of alcohol do you consume per week? Women ............................... - 19 -
Table A 25 Q18a Has a doctor or a health professional diagnosed you with any of the following conditions?
Respiratory conditions ...................................................................................................................................... - 20 -
Table A 26 Q18b Has a doctor or a health professional diagnosed you with any of the following conditions?
Arthritis ............................................................................................................................................................. - 20 -
Table A 27 Q18c Has a doctor or a health professional diagnosed you with any of the following conditions?
Vascular / stroke ............................................................................................................................................... - 20 -
Table A 28 Q18d Has a doctor or a health professional diagnosed you with any of the following conditions?
Cancer ............................................................................................................................................................... - 21 -

- 3 -
Table A 29 Q18e Has a doctor or a health professional diagnosed you with any of the following conditions?
Diabetes ............................................................................................................................................................ - 21 -
Table A 30 Q18f Has a doctor or a health professional diagnosed you with any of the following conditions?
Dementia .......................................................................................................................................................... - 21 -
Table A 31 Q18g Has a doctor or a health professional diagnosed you with any of the following conditions?
Mental health ................................................................................................................................................... - 22 -
Table A 32 Q18h Has a doctor or a health professional diagnosed you with any of the following conditions?
Other ................................................................................................................................................................. - 22 -
Table A 33 Q19a I am fully informed about issues relating to my long term health conditions ...................... - 23 -
Table A 34 Q19b I am fully involved in decisions regarding managing my long term health conditions ......... - 23 -
Table A 35 Q19c I am fully supported in managing my long term health conditions ....................................... - 23 -
Table A 36 Q19d I am fully in control of the care for my long term health conditions .................................... - 24 -
Table A 37 Q20a Number of days of unplanned GP visits ................................................................................ - 25 -
Table A 38 Q20b Number of days of unplanned hospital visits ........................................................................ - 25 -
Table A 39 Q20c Number of days of unplanned visit to other health professionals, e. g. nurses .................... - 25 -
Table A 40 Q21 In the last month have you experienced a fall or loss of balance? ......................................... - 26 -
Table A 41 Satisfaction with life scale (Q22 On a scale of 0-10 how satisfied are you with your life as a whole
nowadays?) ....................................................................................................................................................... - 27 -
Table A 42 Q23 Seven-Item Warwick-Edinburgh Mental Wellbeing Scale ....................................................... - 28 -
Table A 43 Q24a How often do you feel you lack companionship? ................................................................. - 29 -
Table A 44 Q24b How often do you feel isolated from others? ....................................................................... - 29 -
Table A 45 Q24c How often do you feel left out? ............................................................................................ - 29 -
Table A 46 Q24d How often do you feel in tune with the people around you? ............................................... - 30 -
Table A 47 Q25 What is your ethnic group? ..................................................................................................... - 31 -
Table A 48 Q26 What is your gender? .............................................................................................................. - 32 -
Table A 49 Q27a Do you consider yourself to have a disability? ...................................................................... - 33 -
Table A 50 Q27b If yes, what is the nature of your disability? Deafness, or severe hearing impairment ........ - 33 -
Table A 51 Q27c If yes, what is the nature of your disability? Blindness, or severe vision impairment .......... - 33 -
Table A 52 Q27d If yes, what is the nature of your disability? A physical disability ......................................... - 34 -
Table A 53 Q27e If yes, what is the nature of your disability? A substantial learning disability ...................... - 34 -
Table A 54 Q27f If yes, what is the nature of your disability? A substantial learning difficulty ....................... - 34 -
Table A 55 Q27g If yes, what is the nature of your disability? A serious mental health condition .................. - 35 -
Table A 56 Q27h If yes, what is the nature of your disability? A chronic illness .............................................. - 35 -
Table A 57 Q27i If yes, what is the nature of your disability? Another disability ............................................. - 35 -
Table A 58 Q28 Sexual orientation ................................................................................................................... - 36 -
Table A 59 Q29 Religion or belief ..................................................................................................................... - 37 -

- 4 -
Table A 60 Q30a Is your gender identity the same as your were assigned at birth? ....................................... - 38 -
Table A 61 Q30b Do you live full-time in the gender role opposite to that assigned at birth? ........................ - 38 -
Table A 62 Q30c Do you feel able to discuss your gender identity with anyone?............................................ - 38 -
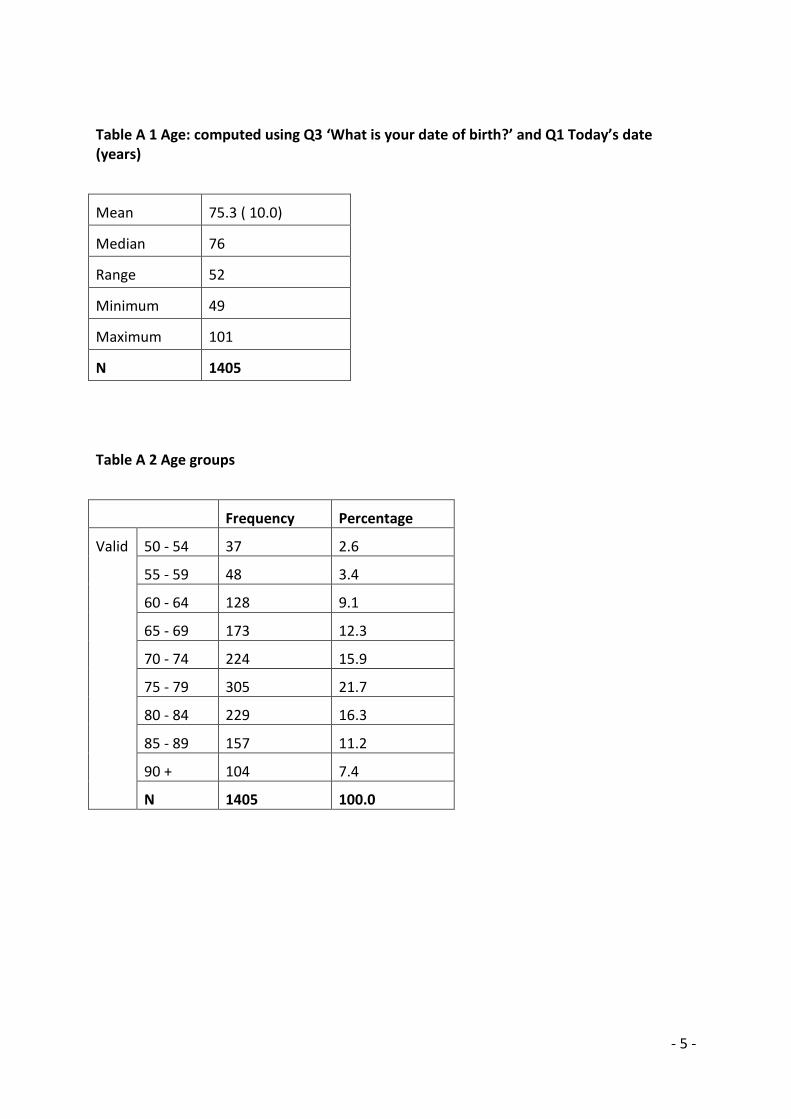
- 5 -
Table A 1 Age: computed using Q3 ‘What is your date of birth?’ and Q1 Today’s date (years)
Mean 75.3 ( 10.0)
Median 76
Range 52
Minimum 49
Maximum 101
N 1405
Table A 2 Age groups
Frequency Percentage
Valid 50 - 54 37 2.6
55 - 59 48 3.4
60 - 64 128 9.1
65 - 69 173 12.3
70 - 74 224 15.9
75 - 79 305 21.7
80 - 84 229 16.3
85 - 89 157 11.2
90 + 104 7.4
N 1405 100.0
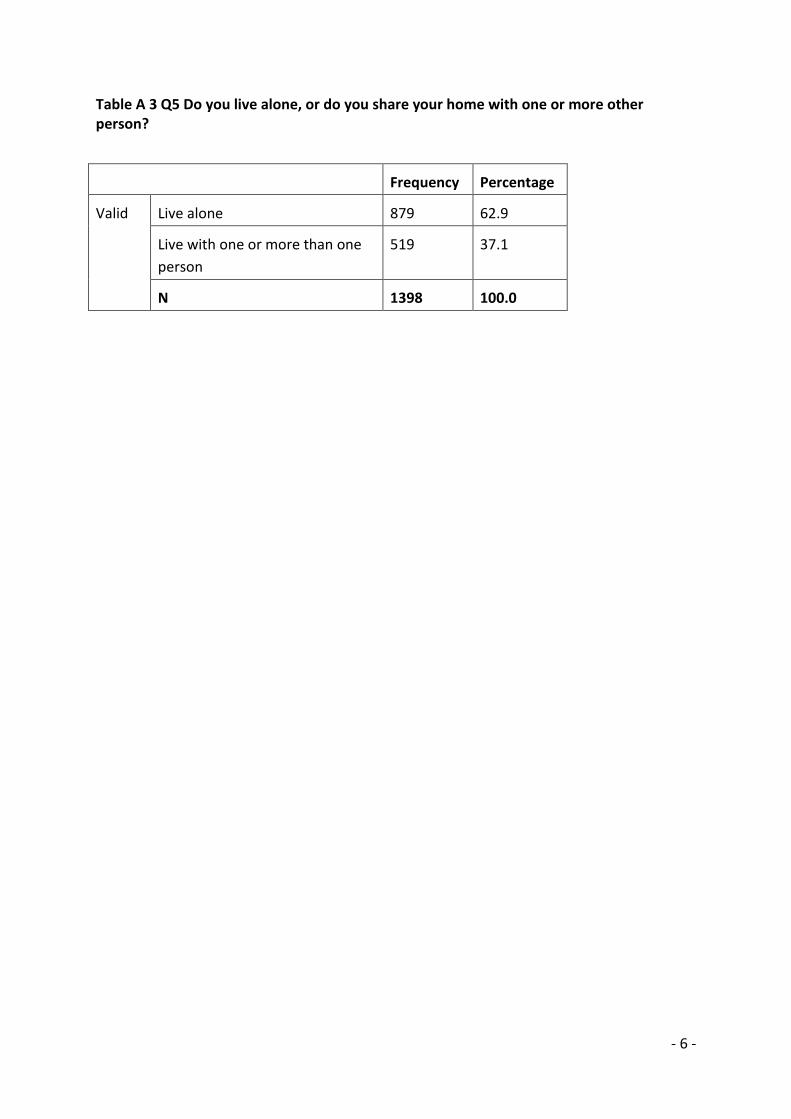
- 6 -
Table A 3 Q5 Do you live alone, or do you share your home with one or more other person?
Frequency Percentage
Valid Live alone 879 62.9
Live with one or more than one
person
519 37.1
N 1398 100.0

- 7 -
Table A 4 Q6 Is there anyone sick, disabled or elderly whom you look after or give special help to?
Frequency Percentage
Valid No 1212 86.9
Yes 182 13.1
N 1394 100.0

- 8 -
Table A 5 Q7 Which of the following best represents your attitude to healthy eating?
Frequency Percentage
Not important 44 3.2
Important, but not doing
anything
297 21.5
Important and doing
something
1038 75.3
N 1379 100.0

- 9 -
Table A 6 Q8 How many portions of fruit and vegetables have you eaten on an average day?
Frequency Percentage
Valid 0 22 1.7
1 123 9.4
2 263 20.1
3 327 24.9
4 236 18.0
5 260 19.8
6 + 80 6.1
N 1311 100.0

- 10 -
Table A 7 Q9 Over the last two weeks, on average, how often have you eaten a meal that has been prepared and cooked from basic ingredients?
Frequency Percentage
Valid Never 87 6.3
Less than once a week 56 4.1
Once a week 108 7.8
2-3 times a week 329 23.9
4-6 times a week 314 22.8
Daily 484 35.1
N 1378 100.0

- 11 -
Table A 8 Q10 Which of the following best represents your attitude to physical activity?
Frequency Percentage
Valid Not important 37 2.7
Important, but not doing
anything
522 37.9
Important and doing
something
820 59.5
N 1379 100.0

- 12 -
Table A 9 Q11 Over the last two weeks, how many minutes did you walk on an average day?
Frequency Percentage
Valid 0 101 7.7
1-30 minutes 691 52.6
31-60 minutes 317 24.1
61-120 minutes 144 11.0
More than 120
minutes
60 4.6
N 1313 100.0
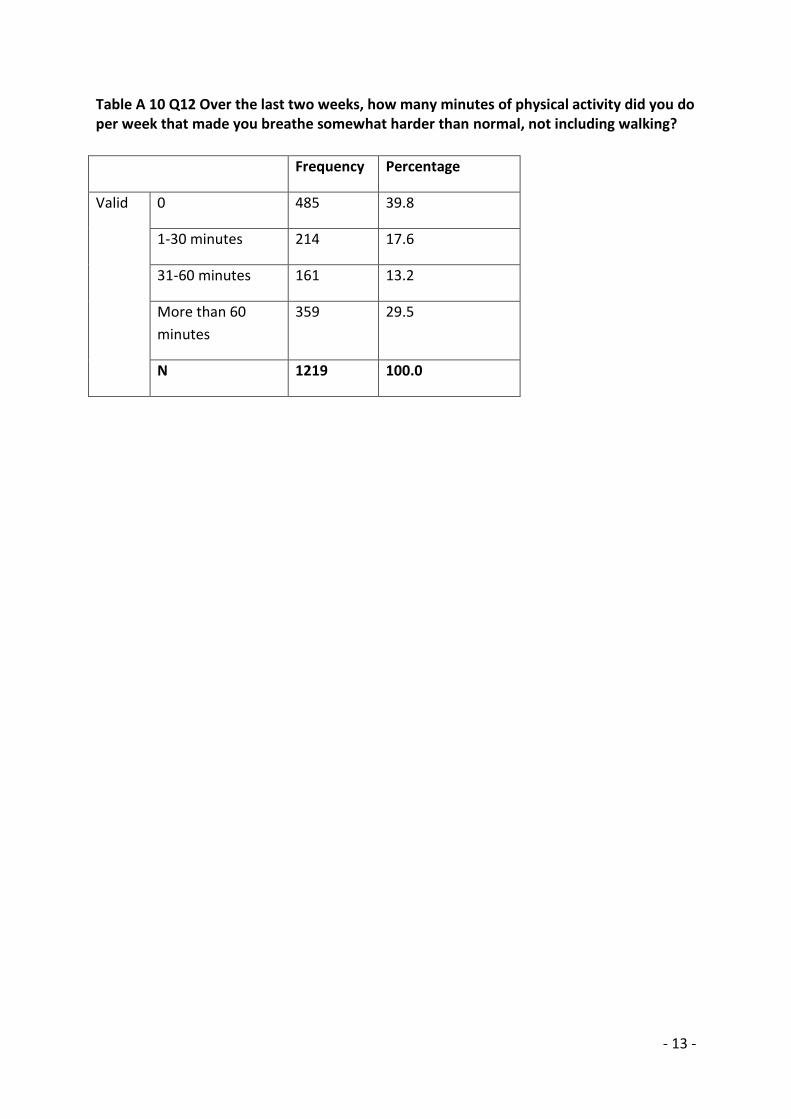
- 13 -
Table A 10 Q12 Over the last two weeks, how many minutes of physical activity did you do per week that made you breathe somewhat harder than normal, not including walking?
Frequency Percentage
Valid 0 485 39.8
1-30 minutes 214 17.6
31-60 minutes 161 13.2
More than 60
minutes
359 29.5
N 1219 100.0

- 14 -
Table A 11 Q13 Over the last two weeks, how many minutes of muscle strengthening activity did you do per week?
Frequency Percentage
Valid 0 458 36.4
1-30 minutes 227 18.1
31-60 minutes 192 15.3
More than 60
minutes
380 30.2
N 1257 100.0

- 15 -
Table A 12 Q14a Confidence - walking around the house
Frequency Percentage
Valid 1 53 3.8
2 103 7.4
3 212 15.3
4 299 21.6
5 720 51.9
N 1387 100.0
Table A 13 Q14b Confidence - doing light housekeeping
Frequency Percentage
Valid 1 166 12.1
2 125 9.1
3 219 16.0
4 222 16.2
5 635 46.5
N 1367 100.0
Table A 14 Q14c Confidence – doing simple shopping
Frequency Percentage
Valid 1 243 18.0
2 129 9.5
3 175 12.9
4 204 15.1
5 601 44.5
N 1352 100.0

- 16 -
Table A 15 Q14d Confidence - preparing a meal
Frequency Percentage
Valid 1 168 12.3
2 119 8.7
3 184 13.4
4 220 16.1
5 679 49.6
N 1370 100.0
Table A 16 14e Confidence - getting myself up in the morning
Frequency Percentage
Valid 1 73 5.3
2 106 7.6
3 172 12.4
4 240 17.3
5 795 57.4
N 1386 100.0

- 17 -
Table A 17 Q15a Height (in metres, computed)
Frequency Percentage
Valid 1.40-1.49 m 31 2.9
1.50-1.59 m 308 28.6
1.60-1.69 m 445 41.4
1.70-1.79 m 222 20.6
1.80 + m 70 6.5
N 1076 100.0
Table A 18 Q15b Weight (in kilograms, computed)
Frequency Percentage
< 50 kilos 42 4.5
51-60 kilos 137 14.6
61-70 kilos 259 27.6
71-80 kilos 195 20.8
81-90 kilos 153 16.3
91-100 kilos 86 9.2
101-110 kilos 38 4.1
111-120 kilos 12 1.3
121+ kilos 15 1.6
N 937 100.0
Table A 19 Q15c Waist circumference: inches
Frequency Percentage
Valid <69 cm 34 6.2
70-89 cm 213 38.6
90-109 cm 237 42.9
110-129 cm 57 10.3
130+ cm 11 2.0
N 552 100.0
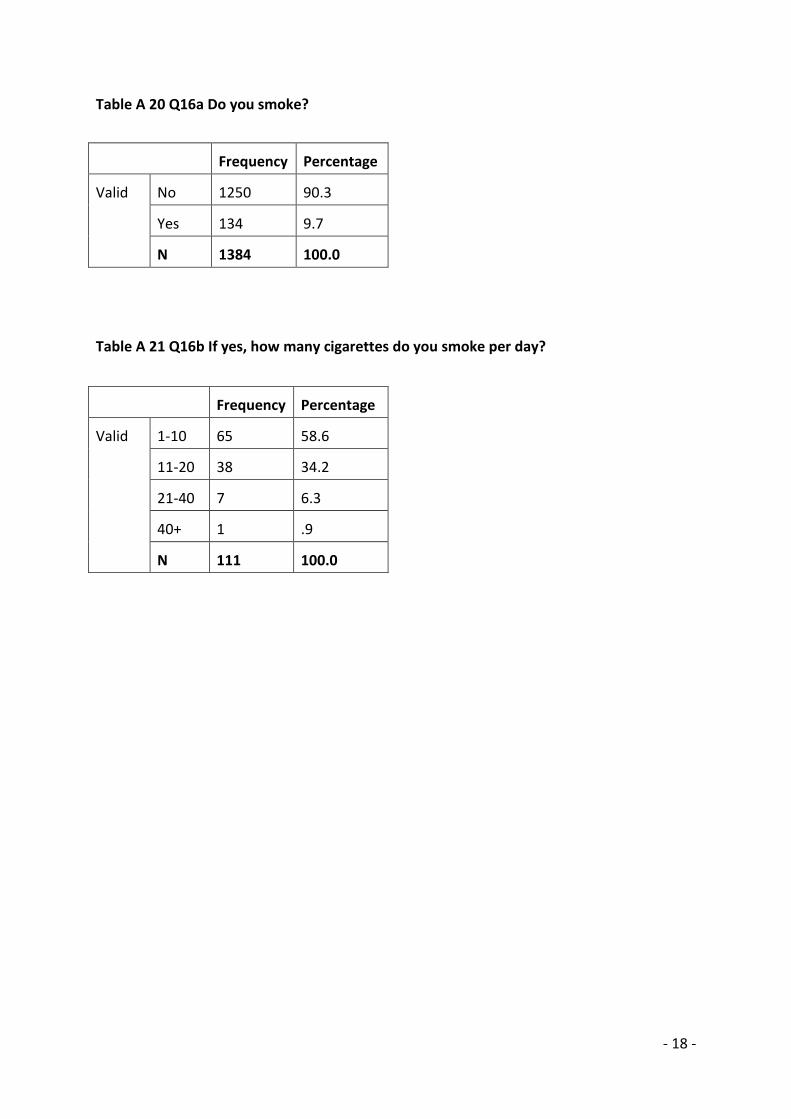
- 18 -
Table A 20 Q16a Do you smoke?
Frequency Percentage
Valid No 1250 90.3
Yes 134 9.7
N 1384 100.0
Table A 21 Q16b If yes, how many cigarettes do you smoke per day?
Frequency Percentage
Valid 1-10 65 58.6
11-20 38 34.2
21-40 7 6.3
40+ 1 .9
N 111 100.0

- 19 -
Table A 22 Q17a Do you drink alcohol?
Frequency Percentage
Valid No 816 59.7
Yes 551 40.3
N 1367 100.0
Table A 23 Q17b If yes, how many units of alcohol do you consume per week? Men
Frequency Percentage
Valid 1-10 115 76.2
11-20 22 14.6
21-30 14 9.3
N 151 100.0
Table A 24 Q17c If yes, how many units of alcohol do you consume per week? Women
Frequency Percentage
Valid 1-14 290 90.9
15-28 18 5.6
29+ 11 3.4
N 319 100.0

- 20 -
Table A 25 Q18a Has a doctor or a health professional diagnosed you with any of the following conditions? Respiratory conditions
Frequency Percentage
Valid No 1063 75.7
Yes 342 24.3
N 1405 100.0
Table A 26 Q18b Has a doctor or a health professional diagnosed you with any of the following conditions? Arthritis
Frequency Percentage
Valid No 689 49.0
Yes 716 51.0
N 1405 100.0
Table A 27 Q18c Has a doctor or a health professional diagnosed you with any of the following conditions? Vascular / stroke
Frequency Percentage
Valid No 1181 84.1
Yes 224 15.9
N 1405 100.0
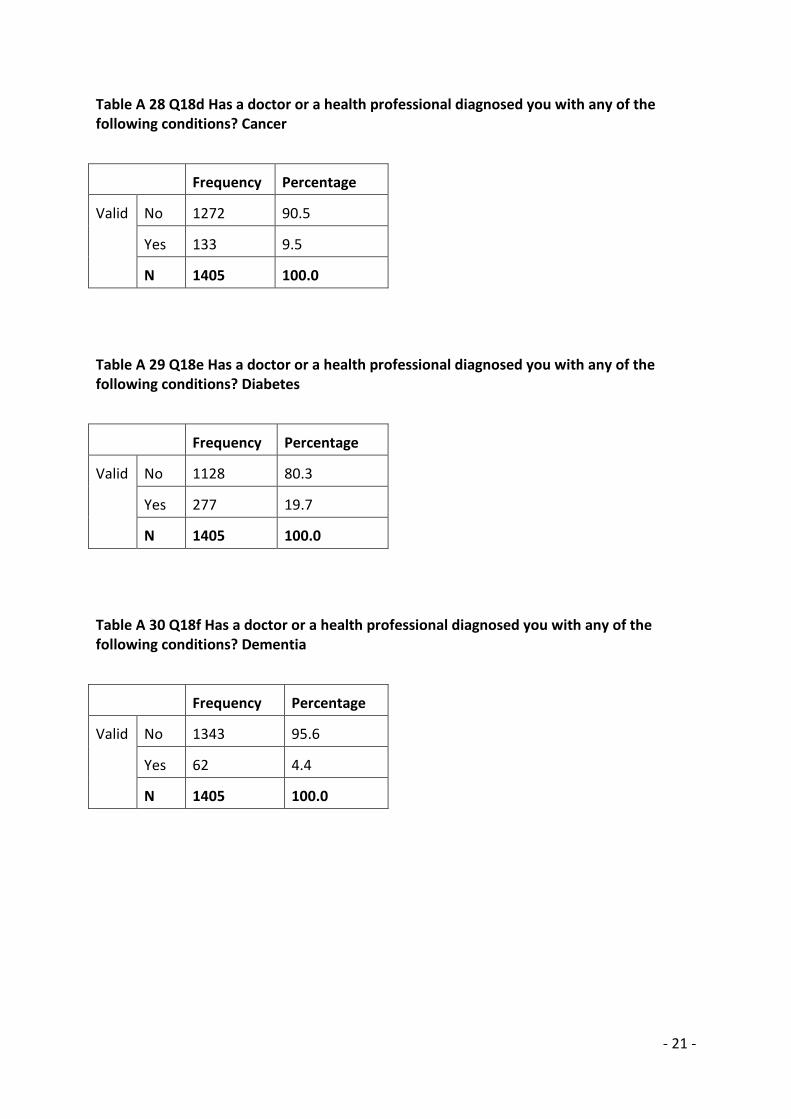
- 21 -
Table A 28 Q18d Has a doctor or a health professional diagnosed you with any of the following conditions? Cancer
Frequency Percentage
Valid No 1272 90.5
Yes 133 9.5
N 1405 100.0
Table A 29 Q18e Has a doctor or a health professional diagnosed you with any of the following conditions? Diabetes
Frequency Percentage
Valid No 1128 80.3
Yes 277 19.7
N 1405 100.0
Table A 30 Q18f Has a doctor or a health professional diagnosed you with any of the following conditions? Dementia
Frequency Percentage
Valid No 1343 95.6
Yes 62 4.4
N 1405 100.0

- 22 -
Table A 31 Q18g Has a doctor or a health professional diagnosed you with any of the following conditions? Mental health
Frequency Percentage
Valid No 1217 86.6
Yes 188 13.4
N 1405 100.0
Table A 32 Q18h Has a doctor or a health professional diagnosed you with any of the following conditions? Other
Frequency Percentage
Valid No 798 56.8
Yes 607 43.2
N 1405 100.0

- 23 -
Table A 33 Q19a I am fully informed about issues relating to my long term health conditions
Frequency Percentage
Valid Strongly agree 467 38.3
Agree 649 53.2
Disagree 89 7.3
Strongly disagree 15 1.2
N 1220 100.0
Table A 34 Q19b I am fully involved in decisions regarding managing my long term health conditions
Frequency Percentage
Valid Strongly agree 448 37.2
Agree 662 54.9
Disagree 76 6.3
Strongly disagree 19 1.6
N 1205 100.0
Table A 35 Q19c I am fully supported in managing my long term health conditions
Frequency Percentage
Valid Strongly agree 432 35.7
Agree 641 52.9
Disagree 116 9.6
Strongly disagree 19 1.6
N 1211 100.0
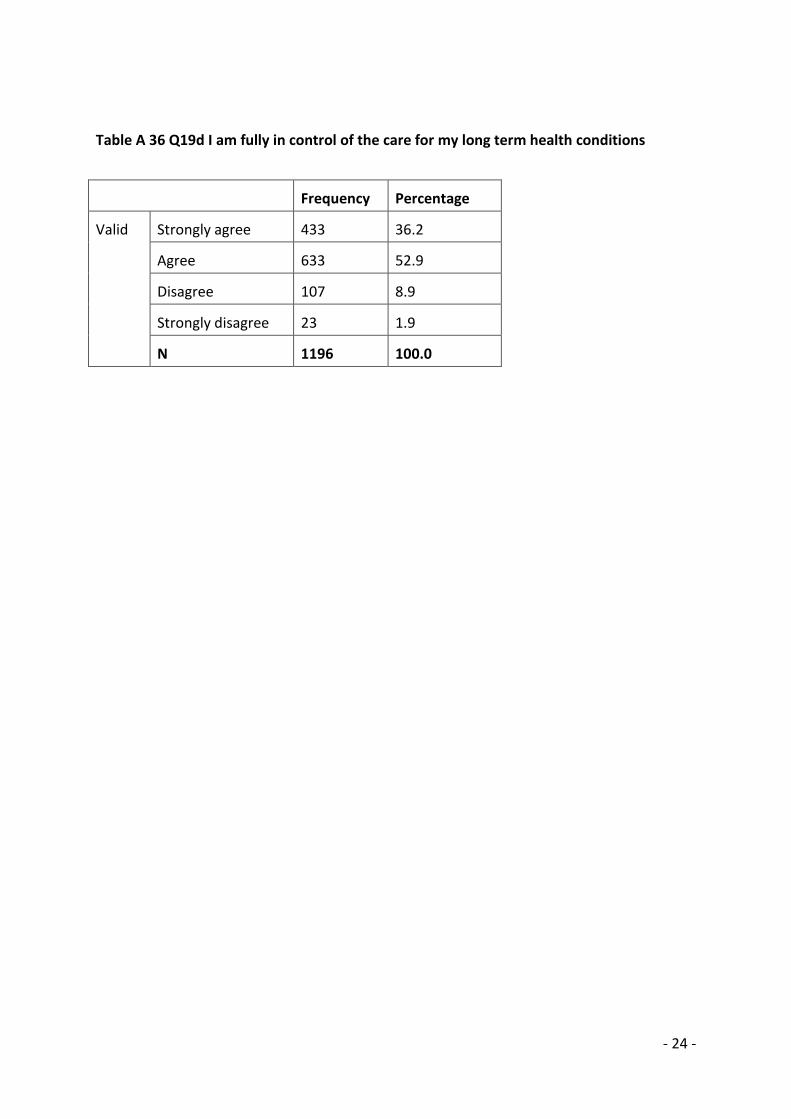
- 24 -
Table A 36 Q19d I am fully in control of the care for my long term health conditions
Frequency Percentage
Valid Strongly agree 433 36.2
Agree 633 52.9
Disagree 107 8.9
Strongly disagree 23 1.9
N 1196 100.0

- 25 -
Table A 37 Q20a Number of days of unplanned GP visits
Frequency Percentage
Valid 0 864 75.9
1 163 14.3
2 83 7.3
3+ 29 2.7
N 1139 100.0
Table A 38 Q20b Number of days of unplanned hospital visits
Frequency Percentage
Valid 0 961 90.8
1 70 6.6
2 17 1.6
3+ 10 1.0
N 1058 100.0
Table A 39 Q20c Number of days of unplanned visit to other health professionals, e. g. nurses
Frequency Percentage
Valid 0 937 92.7
1 49 4.8
2 19 1.9
3+ 6 .6
N 1011 100.0

- 26 -
Table A 40 Q21 In the last month have you experienced a fall or loss of balance?
Frequency Percentage
Valid No 954 70.3
Yes 403 29.7
N 1357 100.0

- 27 -
Table A 41 Satisfaction with life scale (Q22 On a scale of 0-10 how satisfied are you with your life as a whole nowadays?)
Mean 6.9
Std. Deviation 2.3
Range 10
Minimum 0
Maximum 10
N 1346

- 28 -
Table A 42 Q23 Seven-Item Warwick-Edinburgh Mental Wellbeing Scale
Mean 25.8
Std. Deviation 5.5
Range 28
Minimum 7
Maximum 35
N 1208

- 29 -
Table A 43 Q24a How often do you feel you lack companionship?
Frequency Percentage
Valid Hardly ever 635 46.2
Some of the
time
518 37.7
Often 221 16.1
Total N 100.0
Table A 44 Q24b How often do you feel isolated from others?
Frequency Percentage
Valid Hardly ever 707 51.8
Some of the time 451 33.0
Often 207 15.2
N 1365 100.0
Table A 45 Q24c How often do you feel left out?
Frequency Percentage
Valid Hardly ever 745 55.4
Some of the time 417 31.0
Often 182 13.5
N 1344 100.0

- 30 -
Table A 46 Q24d How often do you feel in tune with the people around you?
Frequency Percentage
Valid Hardly ever 263 19.6
Some of the time 478 35.7
Often 598 44.7
N 1339 100.0

- 31 -
Table A 47 Q25 What is your ethnic group?
Frequency Percentage
Valid White British 1265 90.9
Irish 20 1.4
Gypsy or Irish Traveller 1 .1
Other White 8 .6
Indian 56 4.0
Pakistani 9 .6
Chinese 1 .1
Other Asian 9 .6
Mixed white and Black
Caribbean
3 .2
Mixed white and Black
African
5 .4
Mixed white and Asian 1 .1
Other mixed background 1 .1
Caribbean 8 .6
Other Black, African,
Caribbean
1 .1
Arab 1 .1
Any other ethnic
background
3 .2
N 1392 100.0

- 32 -
Table A 48 Q26 What is your gender?
Frequency Percentage
Valid Male 362 25.8
Female 1043 74.2
Total 1405 100.0

- 33 -
Table A 49 Q27a Do you consider yourself to have a disability?
Frequency Percentage
Valid No 535 40.8
Yes 776 59.2
N 1311 100.0
Table A 50 Q27b If yes, what is the nature of your disability? Deafness, or severe hearing impairment
Frequency Percentage
Valid No 739 87.8
Yes 103 12.2
N 842 100.0
Table A 51 Q27c If yes, what is the nature of your disability? Blindness, or severe vision impairment
Frequency Percentage
Valid No 745 88.5
Yes 97 11.5
N 842 100.0

- 34 -
Table A 52 Q27d If yes, what is the nature of your disability? A physical disability
Frequency Percentage
Valid No 301 35.7
Yes 542 64.3
N 843 100.0
Table A 53 Q27e If yes, what is the nature of your disability? A substantial learning disability
Frequency Percentage
Valid No 832 98.9
Yes 9 1.1
N 841 100.0
Table A 54 Q27f If yes, what is the nature of your disability? A substantial learning difficulty
Frequency Percentage
Valid No 824 97.9
Yes 18 2.1
N 842 100.0

- 35 -
Table A 55 Q27g If yes, what is the nature of your disability? A serious mental health condition
Frequency Percentage
Valid No 767 91.0
Yes 76 9.0
N 843 100.0
Table A 56 Q27h If yes, what is the nature of your disability? A chronic illness
Frequency Percentage
Valid No 610 72.4
Yes 232 27.6
N 842 100.0
Table A 57 Q27i If yes, what is the nature of your disability? Another disability
Frequency Percentage
Valid No 775 92.0
Yes 67 8.0
N 842 100.0

- 36 -
Table A 58 Q28 Sexual orientation
Frequency Percentage
Valid Heterosexual 1123 99.3
Gay or lesbian 4 .4
Bisexual 1 .1
Other 3 .3
N 1131 100.0

- 37 -
Table A 59 Q29 Religion or belief
Frequency Percentage
Valid Christian 876 71.0
No religious affiliation or
belief
157 12.7
Other 121 9.8
Hindu 32 2.6
Muslim 27 2.2
Sikh 11 .9
Buddhist 8 .6
Jewish 2 .2
N 1234 100.0

- 38 -
Table A 60 Q30a Is your gender identity the same as your were assigned at birth?
Frequency Percentage
Valid No 43 4.0
Yes 1035 96.0
N 1078 100.0
Table A 61 Q30b Do you live full-time in the gender role opposite to that assigned at birth?
Frequency Percentage
Valid No 673 85.7
Yes 112 14.3
N 785 100.0
Table A 62 Q30c Do you feel able to discuss your gender identity with anyone?
Frequency Percentage
Valid No 104 13.6
Yes 662 86.4
N 766 100.0