age-friendly boston: assessing need and charting a · pdf filei . age-friendly boston:...
TRANSCRIPT

i
Age-Friendly Boston: Assessing need and charting a course of action
Center for Social & Demographic Research on Aging Gerontology Institute John W McCormack School of Policy and Global Studies University of Massachusetts Boston June 2016

ii
ABOUT THE AUTHORS This report was prepared by the Center for Social & Demographic Research on Aging, within the Gerontology Institute at the University of Massachusetts Boston, in consultation with staff from the City of Boston Commission on Affairs of the Elderly, AARP of Massachusetts and with generous support from the Tufts Health Plan Foundation. Individuals responsible for the report include Jan E. Mutchler, PhD, Caitlin E. Coyle, PhD and Hayley Gleason, MSW MS. ACKNOWLEDGEMENTS We acknowledge with gratitude our partnership with members of the Age-Friendly Boston Leadership Team including Emily Shea, Commissioner of Affairs for the Elderly, Andrea Burns, Director of Age-Friendly Boston, Michael Festa, Director of AARP of Massachusetts, Kara Cohen, Community Outreach Director for AARP of Massachusetts, Sandra Albright, AARP Massachusetts State President, and Robert Haynes, AARP Massachusetts Executive Council. We are grateful for the financial support of the Tufts Health Plan Foundation, and for the leadership and vision of its president, Nora Moreno-Cargie. We acknowledge the excellent assistance from University of Massachusetts Boston students, including Ceara Somerville, Mai See Yang, Maryam Khaniyan, Molly Evans, Naomi Gallopyn, Adrita Barooah, Joyce Wang, Ping Xu, Natalie Pitheckoff, Lindsey Raymond, Nalat Siwapornchai, Nhung Vo, Chris Carriero, and Felix Garcia. Most importantly, we offer our sincere thanks to the many residents of Boston who participated in listening sessions, shared their views during focus groups, or responded to a survey. Without these engaged partners this project would not have been possible.
Recommended Citation: Mutchler, Jan, Caitlin Coyle and Hayley Gleason. “Age-Friendly Boston: Assessing Needs to Chart a Course of Action” (2016). Gerontology Institute Publications. http://www.umb.edu/demographyofaging

iii
Table of Contents Executive Summary ............................................................................................................. iv
Introduction ........................................................................................................................ 1
Background ......................................................................................................................... 3
Defining an Age Friendly City .......................................................................................... 3
Domains of an Age-Friendly City ..................................................................................... 3
Methods .............................................................................................................................. 6
Listening Sessions ........................................................................................................... 6
Survey .............................................................................................................................. 6
Professional Provider Focus Groups ............................................................................... 7
Sample Description ............................................................................................................. 8
Language & English Proficiency .................................................................................. 8
Age, Gender & Race .................................................................................................... 8
Socioeconomic Status of Survey Respondents ......................................................... 10
Health & Disability Status of Survey Respondents ................................................... 11
Results by Domain ............................................................................................................ 13
Outdoor Spaces and Buildings ...................................................................................... 13
Transportation .............................................................................................................. 17
Housing ......................................................................................................................... 19
Social Participation ....................................................................................................... 21
Respect & Social Inclusion ............................................................................................ 24
Civic Participation & Employment ................................................................................ 27
Communication & Information ..................................................................................... 29
Community Supports & Health Services ....................................................................... 33
Perceived Age-Friendliness ............................................................................................... 36
Professional Provider Perspective .................................................................................... 38
Conclusion ......................................................................................................................... 40
Moving Towards Action .................................................................................................... 42
References ........................................................................................................................ 43
Exhibit I. Age-Friendly Boston Survey Tool ....................................................................... 45

iv
Executive Summary
Boston’s population of residents age 60 and older is rapidly growing in size as well as racial and ethnic diversity. In response to these demographic features and as a means of assuring Boston’s commitment to current and future older residents, Mayor Martin J. Walsh announced in 2014 that the City of Boston would join the World Health Organization’s Age-Friendly Cities Network, in cooperation with the Massachusetts AARP. Boston’s Age-Friendly Initiative promotes eight domains of age-friendliness: outdoor spaces and buildings, transportation, housing, social participation, respect and social inclusion, civic participation and employment, communication and information, and community supports and health services. In this report, we describe the needs assessment portion of the age-friendly transformation process.
Methods The Age-Friendly Boston Initiative has spent the last 12 months conducting a needs assessment to address the age-friendliness of Boston. Through this process over 800 senior residents of Boston participated in one of 25 listening sessions within each of Boston’s distinct neighborhoods, 3,629 residents age 50 or older completed a survey about the age-friendliness of Boston, and dozens of provider and advocacy organizations throughout the city were engaged in promoting the Age-Friendly Boston Initiative and providing feedback via 3 focus groups.
Summary of Results Two over-arching themes emerged from this needs assessment of Boston’s senior population. The first theme relates to the issue of accessibility. Access to the amenities and resources of an age-friendly city is critical to the success of the Age Friendly Boston Initiative. Across all eight domains, senior residents indicated that it was not for lack of programs, resources or service options that they struggled to meet their needs or were dissatisfied with their experiences; rather, barriers to access created barriers to taking advantage of opportunities and amenities. Examples of ways in which access is featured in this assessment include:
• Walkability. Safe and maintained sidewalks, benches to sit along walking or cycling paths and the availability of public restrooms are all facilitators of walkability for seniors in Boston. Being able to access Boston’s amenities on foot not only encourages physical activity; but also promotes feelings of independence for seniors.
• Centrally located and up-to-date information available in multi-media and multiple languages. Access to engaging with the Age-Friendly Boston Initiative hinges on awareness and communication. There is an unmet need in Boston for centrally located and up-to-date information. Resources that are not well known or are poorly understood cannot be effectively utilized by seniors aiming to age in community. Multi-media communication is needed to reach all of the diverse

v
segments of Boston. Increased communication about supports and services is not only a need reported by seniors; but is also an unmet need of organizations and professionals who provide services and supports to Boston’s older residents.
• Inclusivity of Boston’s most vulnerable senior residents. Residents with poor health or disabling conditions stand out as segments of Boston’s older adult population that face additional barriers to accessing services and supports necessary to remain in the community. For example, although public transportation is satisfactory to many seniors in Boston, those with limited mobility may require supports in using public transportation or they may need a higher level of access to senior transportation options, such as the RIDE. Additional outreach and support is needed for these adults to engage with the activities promoted by the Age Friendly Boston Initiative. This result underpins the potential synergy between an age-friendly and a disability-friendly community: both models strive to improve accessibility and livability for adults of all ages and functioning.
Differences between age cohorts within the senior population in Boston is a second major theme stemming from results of this needs assessment effort. The survey portion of this needs assessment included residents age 50 and older. Results suggest that the “midlife” residents of Boston (ages 50-69) have thoughts and needs about aging that substantially differ from those expressed by residents age 70 and older. For example, younger residents are less satisfied with opportunities for employment, report less satisfaction with elements of respect and social inclusion, and also report less satisfaction with opportunities for social interaction. These differences prompt the Age-Friendly Boston Initiative to think creatively about how the actions they take will impact not only the current cohort of seniors, but also the cohort of seniors coming of older age in Boston.

1
Introduction Boston is a city like no other. Its neighborhoods are rich in history, culture, knowledge and technology. However, not unlike other cities around the world, the population of this great city is rapidly growing older and more diverse. In 2010, more than 88,000 Boston residents age 60 years or older were enumerated in the US Census, representing 14% of its population. By 2030, projected increases in the older population will result in as many as 140,000 seniors residing in Boston (see Figure 1), representing 19% of the city’s residents. Current estimates suggest that already, more than 100,000 Boston residents are age 60 or older.1
Source: Donahue projections are prepared by the UMass Donahue Institute (http://pep.donahue-institute.org/). MAPC projections are prepared by the Metropolitan Area Planning Council (http://www.mapc.org), an organization based in Boston. MAPC-SQ projections assume growth that aligns with “status quo” growth while MAPC-SR projections assume stronger population growth.
Boston’s older population is rapidly approaching “minority-majority” status. In 2010, 45% of all seniors were persons of color. Between 2000 and 2010, the size of the older Hispanic and Asian populations in Boston increased by over 50% while the size of the older Black Bostonian population and those identifying as some ‘other race’ increased by 35% or more (see Figure 2). In contrast, the senior population reporting their race as White alone declined by 3%.2
60,000
70,000
80,000
90,000
100,000
110,000
120,000
130,000
140,000
150,000
2000 2010 2020(proj.)
2030(proj.)
Num
ber o
f res
iden
ts a
ge 6
0+
Figure 1: Number of Boston residents age 60+, 2000-2010, and projections to 2030
Donahue Vintage 2015
MAPC-SR
MAPC-SQ

2
Source: 2000, 2010 Census, Summary File 2, Table QT-P1. *Includes individuals listing more than one race. **Hispanics may be of any race.
Other key features of Boston’s older population include diversity in cultural background. For example, one-third of Boston older adults speak a language other than English at home; fully one-quarter speak English less than “very well” or do not speak English at all.3 Financial challenges include high levels of income insecurity and high rates of housing burden. Health challenges like high rates of hypertension, diabetes, and other chronic conditions are also prevalent.4 In support of Boston’s highly diverse, highly urban community, steps must be taken to continue promoting livability for residents of all ages while making Boston a community where residents can expect to grow older with security, dignity, and well-being.
In response to these demographic features and as a means of assuring Boston’s commitment to current and future older residents, Mayor Martin J. Walsh announced in 2014 that the City of Boston would join the World Health Organization’s Age-Friendly Cities Network, in cooperation with the Massachusetts AARP. Boston’s Age-Friendly Initiative promotes eight domains of age-friendliness: outdoor spaces and buildings, transportation, housing, social participation, respect and social inclusion, civic participation and employment, communication and information, and community supports and health services. In this report, we focus on the needs assessment portion of the age-
-3%
37%
52%
35%
85%
-20%
0%
20%
40%
60%
80%
100%
White alone Black or AfricanAmerican alone
Asian or NativeHawaiian/Pacific
Islander alone
Some otherrace*
Hispanic orLatino**
Figure 2: Change in number of Boston residents age 60+, by race and ethnicity, 2000-2010

3
friendly transformation process. Results from three primary data collection efforts will be presented and implications of these data for the planning and implementation processes will be discussed.
Background Defining an Age Friendly City The World Health Organization (WHO) launched the Global Age Friendly Cities Project in 2005 as way for cities, towns and communities to ready themselves for the dramatic demographic shifts happening worldwide.5 An age friendly city has been described by the WHO as a place that optimizes opportunities for health, participation and security as people age, and adapts its structures and services to be accessible to, and inclusive of, older individuals with varying needs and capacities. Living in the community with necessary long term services and supports (LTSS) is not only the preferred setting for aging; but recent studies have suggested potential cost-effectiveness of providing home and community based supports.6 The Age Friendly Cities initiative has roots in environmental gerontology, the multidisciplinary examination of how older adults are connected to their physical and social surroundings. For example, an extensive literature has emerged in recent years relative to neighborhood characteristics that shape wellbeing in later life.7 In addition, the linkage between social engagement and well-being in later life has been extensively documented in the aging literature.8 9 10 Together, ample research evidence supports the concepts of the Age-Friendly movement and highlights its importance to the health and well-being of older adults.
Domains of an Age-Friendly City Characteristics of an age-friendly city have been developed by the WHO and others.11 These community domains are thought to provide guidance for how cities and towns can operationalize what it means to be age-friendly (see Figure 3). Together, they illustrate the components necessary for a person to age as a healthy and vibrant member of the community. The domains do not stand alone; rather, they are interwoven with one another in multiple ways. For example, without reliable transportation it is difficult to imagine how an older adult would be able to attend religious services or participate in other activities, or how they might get to their place of employment. In isolation and in combination, each of the domains is important to the process of creating a city that is accessible and supportive for all older adults.
• Outdoor spaces and buildings. Features and perceptions of indoor and outdoor spaces impact mobility, independence and quality of life.
• Transportation. Being able to get where one wants to go promotes participation and helps maintain networks.
• Housing. Appropriate housing shapes independence, quality of life, and being able to stay in the community.
• Social Participation. Participating in family and community activities builds social networks and social support, and promotes health and well-being.

4
Figure 3. Domains of an Age Friendly City
• Respect and Social Inclusion. Feeling respected and included promotes participation and facilitates effective use of services.
• Civic Participation and Employment. Civic participation (e.g., volunteering and voting) and paid employment build social capital, may yield income, and allow older adults to pursue interests and be involved.
• Communication and Information. Active aging is promoted by being aware of opportunities to stay connected and having access to needed information.
• Community Supports and Health Services. Medical and non-medical services promote wellness and quality of life.
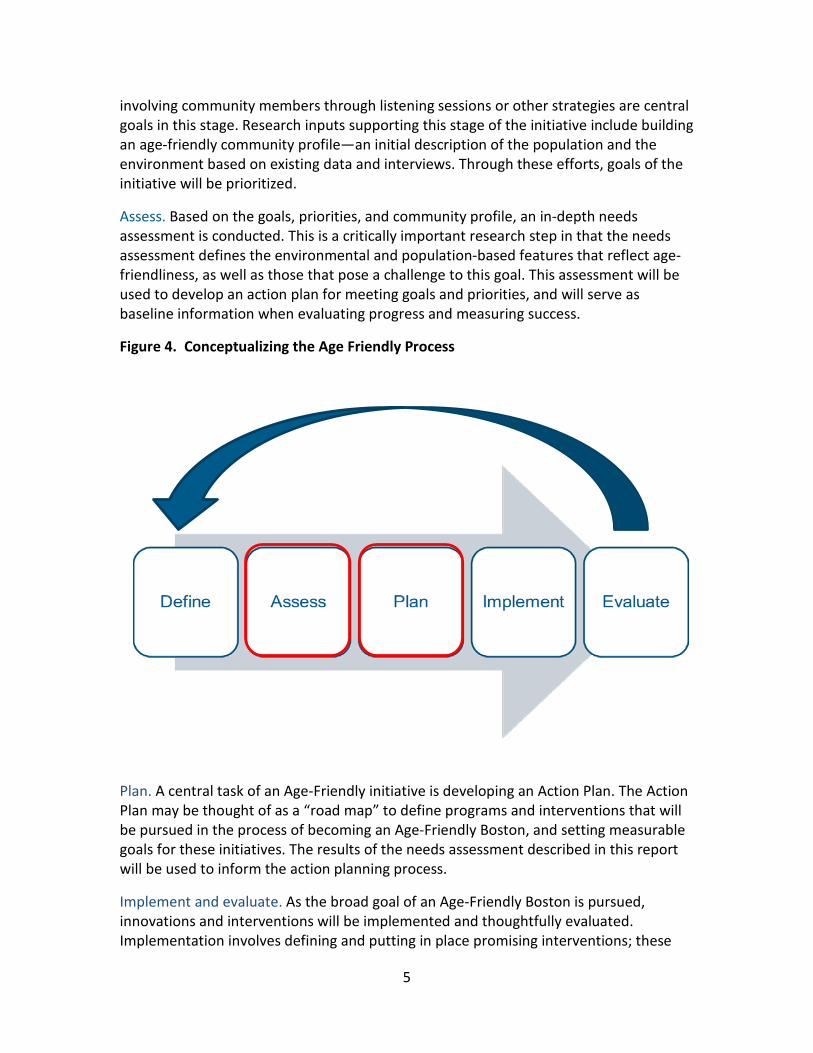
Achieving Age-Friendliness Creating an age-friendly city involves assessing features of the community, planning for change, and evaluating progress—all over an extended period of time and in consultation with a wide range of stakeholders (see Figure 4). The emphasis of this report is the needs assessment phase and how the results will inform the planning process within each domain; but first, we briefly describe the process as a whole.
Define. Defining local principles is a key first step because each city will conceptualize the effort in a somewhat unique way. Building partnerships, creating a vision, and
Source: Adapted from WHO by S. Harris (Design for Aging Committee, BSA)
5
involving community members through listening sessions or other strategies are central goals in this stage. Research inputs supporting this stage of the initiative include building an age-friendly community profile—an initial description of the population and the environment based on existing data and interviews. Through these efforts, goals of the initiative will be prioritized.
Assess. Based on the goals, priorities, and community profile, an in-depth needs assessment is conducted. This is a critically important research step in that the needs assessment defines the environmental and population-based features that reflect age-friendliness, as well as those that pose a challenge to this goal. This assessment will be used to develop an action plan for meeting goals and priorities, and will serve as baseline information when evaluating progress and measuring success.
Figure 4. Conceptualizing the Age Friendly Process
Plan. A central task of an Age-Friendly initiative is developing an Action Plan. The Action Plan may be thought of as a “road map” to define programs and interventions that will be pursued in the process of becoming an Age-Friendly Boston, and setting measurable goals for these initiatives. The results of the needs assessment described in this report will be used to inform the action planning process.
Implement and evaluate. As the broad goal of an Age-Friendly Boston is pursued, innovations and interventions will be implemented and thoughtfully evaluated. Implementation involves defining and putting in place promising interventions; these

6
may include programs (such as evidence-based health promotion activities) as well as environmental modifications (such as expanding traffic-calming features at key intersections). As programs and modifications are put in place, research inputs are usefully incorporated to evaluate their implementation, allowing appropriate mid-course corrections. Ultimately, evaluations will be needed both of outcomes (that is, were the proposed modifications implemented appropriately?) as well as of impacts (that is, have well-being, health, and quality of life been impacted by the improvements put in place?). These evaluation components are critical in defining the success of the initiative overall, and setting a course for continued intervention.
Methods Assessing the needs of Boston’s aging population is necessary to plan and implement change. Data from three primary sources as well as existing demographic data were analyzed and used together to generate a baseline understanding of Boston as a community in which to age; these data will be used in developing recommendations for the Age Friendly Boston Initiative.
Listening Sessions In the Summer and Fall of 2015, a total of 25 listening sessions were held in neighborhoods throughout the City of Boston. Three sessions were made available in languages other than English (Spanish, Haitian Creole and Chinese). The general public was invited to attend these forums to discuss the strengths and weaknesses of Boston for older adults; participants were also invited to identify opportunities for creating a more Age-Friendly Boston. More than 800 seniors participated in these sessions. Note-takers were present at each listening session. These notes were analyzed using NVivo 11, a qualitative analysis software package. Two independent coders independently organized the themes by ‘challenge’, ‘strength’ or ‘recommendation’ and subsequently by Age-Friendly domain. Within each domain, a secondary set of domain-specific themes were created. Coders met frequently to corroborate their coding process and address any discrepancies.
Survey A survey was offered to Boston residents age 50 or older. Questions about housing, public spaces, communication and information, social participation, inclusion and community supports, civic participation and employment, safety and navigating the community were developed by the researchers in consultation with the Age-Friendly Boston leadership team. Additional questions about age, race, gender, health and language abilities were included in the four-page survey (See Exhibit I for a copy of the survey tool). An initial draft of the questionnaire was reviewed and refined with the assistance of participants in the Osher Life-Long Learning Institute (OLLI) at University of Massachusetts Boston. The survey tool was made available both online and in print. The survey was available in print in 5 languages other than English (Spanish, Haitian Creole, Russian, Cape Verdean and Chinese). The survey was open from May 2015 until January 2016. Response was primarily generated via the distribution of paper questionnaires at senior events and locations throughout the City, including listening sessions. Initiative partners from neighborhood

7
organizations and other organizations serving Boston elders also helped to distribute questionnaires (e.g., ETHOS, Chinatown Golden Age, and Action for Boston Community Development, Inc. (ABCD)). Electronic responses were generated via email contact with various groups, including AARP members living in Boston, and through wide distribution of a postcard including the URL for the electronic questionnaire. All paper surveys were entered in IBM SPSS 23.0 and all online survey responses were downloaded and merged with data from paper surveys. Basic descriptive statistics were calculated (percentages, crosstabs, means etc.). Data were analyzed by domain as well as stratified in some cases by race, economic security status, disability or health status.
Professional Provider Focus Groups Three focus groups were held in the Spring of 2016 with professional providers: 1) City of Boston staff from across 9 different departments (n=11); 2) provider organizations who receive funding from the Boston Area Agency on Aging (N=4) and; 3) other provider organizations that had been involved in the initiative through hosting a listening session or helping to promote the survey (n=9). The purpose of these focus groups was to develop information that can contextualize results from listening sessions and the survey to begin conceptualizing how this information can inform action. These groups were selected because they have deep knowledge and unique perspective on the older population of Boston as well as the resource environment of the community. As well, members of these organizations and departments will play an integral role in executing many action-items. All focus group sessions were audio recorded and transcribed verbatim. These transcripts were coded using NVivo 11 software using the same coding process as was used with the listening session data.
A description of the survey sample is detailed next in this report, followed by results according to each domain. Data from all three sources (listening sessions, surveys and focus groups) are incorporated into the presentation of results.

8
Sample Description Language & English Proficiency A total of 3,629 Boston residents age 50 or older completed the survey (2,741 paper surveys and 888 online surveys). Table 1 illustrates the diversity in language of responses. Responses were received in English (80%), Chinese (10%), Spanish (5%), Haitian Creole (2%), Cape Verdean (2%) and Russian (1%).
Table 1. Language of Survey Completion
Language Percent
English 80%
Chinese 10%
Spanish 5%
Haitian Creole 2%
Cape Verdean 2%
Russian 1%
Thirty percent of survey respondents reported that they speak a language other than English at home1.
Age, Gender & Race About one-third of survey respondents were ages 60-69 (36%) and another one-third were ages 70-79 (32%) (see Figure 5). Fifteen percent of respondents were in a younger age bracket (age 50-59), and 17% of survey respondents were age 80 or older.
1 All survey results reported are based only on those who answered the questions—those who declined to respond to individual questions are not included in those statistics. For example, there was 11% missing data for the question about age and thus results for age represent only 89% of the total sample.

9
Figure 5. Age Distribution of Survey Respondents
Two thirds of survey respondents reported being female (70%) and the remaining one-third reported being male (30%) (see Table 2). Nearly one half (47%) of survey respondents reported being White, 23% reported being Black, 14% reported being Asian, 9% Hispanic and 7% reported multiple races or selected an ‘other’ race category (see Figure 6). When compared to data from the US Census Bureau, these results indicate that the proportion of survey respondents who are female is higher than the general age 50+ population of Boston, and that this sample of older Bostonians includes more Asian individuals and fewer Hispanic persons than would be representative of the City of Boston (American Community Survey, 2010-2014, calculations generated by authors using IPUMS microdata).
Table 2. Gender Distribution of Survey Respondents
Gender Percentage
Male 30%
Female 70%
15%
36%32%
17%
Age 50-59 Age 60-69 Age 70-79 Age 80+

10
Figure 6. Race & Ethnicity of Survey Respondents
Socioeconomic Status of Survey Respondents The Elder Economic Security Standard Index12 is a useful indicator of the financial resources needed for an adult age 65 or older to live independently in Boston. The Index value for 2015 was $28,680 for single renters and $38,136 for couples who rent. Comparing these Index values to the incomes that Boston seniors living independently actually have indicates that 68% of Boston seniors age 65 or older and living alone have incomes below the Elder Index value for single renters. In addition, 40% of Boston seniors age 65 or older and living in a two-person senior-only household have incomes below the Elder Index value for couple renters. This comparison suggests that many Boston seniors struggle to make ends meet. In comparison, over half of survey respondents (64%) reported that they did, in fact, have adequate resources to meet their financial needs and 36% of survey respondents reported that they did not. When analyzed by race/ethnic group, the proportion of those who report not having adequate resources to meet their financial needs is larger among Black respondents and respondents of other races (47%), and Hispanic respondents (44%) compared to White (28%) or Asian (33%) respondents (see Figure 7). These findings illustrate the economic disparities that exist among Boston’s senior population and are consistent with data on racial disparities in income derived from the American Community Survey.
47%
14%
23%
9%
7%
White Alone
Asian Alone
Black Alone
Hispanic
Other or Multiple

11
Figure 7. Economic Security, by race
Health & Disability Status of Survey Respondents Respondents were asked to describe their current health as being excellent, good, fair or poor. Self-rated health has been found to be highly predictive of clinical measures of physical health.13 In other words, self-rated health is a reliable proxy measure by which to assess the health of a population. Figure 8 illustrates the health status of this sample of older Bostonians. Most respondents rated their health as being excellent (17%) or good (50%). This is a positive result and speaks to the volume and quality of health services available in Boston as well as the many aspects of healthy living available, including opportunities for physical activity and access to nutritious food sources. About one-third of survey respondents reported that their health was fair (27%) or poor (6%).
71%67%
53% 55% 53%
28%33%
47% 44% 47%
White Asian Black Hispanic Other
Economically Secure Economically Insecure*
*Note. Persons with economic insecurity are defined as those who answered “Strongly Disagree” or “Disagree” with the following statement: “I have adequate resources to meet my financial needs, including home maintenance, personal healthcare, and other expenses.”

12
Figure 8. Self-reported Health Status of Survey Respondents
In this survey, disability status was defined as whether someone responded affirmatively to the question “Do you have an impairment or condition that limits your availability to participate in your community?” Disability, or limited functioning, is associated with age and has implications for many of the Age Friendly domains. For example, if a person is limited in his or her ability to participate in the community, he or she may benefit from transportation support or in-home services. Among the Bostonians age 50+ who responded to this survey, nearly one-third reported (29%) having a condition that limits their community participation (Figure 9). To note, 29% is also the share of older residents age 50 or older who report a disability in the American Community Survey (2010-14). Over half of respondents (53%) who reported their health as being fair or poor also reported having a condition or impairment that keeps them from participating in their community. This result suggests that a segment of Boston’s older population is significantly limited by their health and functional abilities and thus the Age-Friendly Boston Initiative should consider ways to engage this group of seniors and support them as they, too, desire to remain active members of their community.
17%
50%
27%
6%
Excellent Good Fair Poor

13
Figure 9. Disability Status of Survey Respondents
Results by Domain Outdoor Spaces and Buildings Characteristics and perceptions of outdoor spaces and public buildings are important to older residents because those features of the environment impact mobility, independence, and access to natural amenities and the assets that make Boston a desirable place to age. Moreover, a sense of safety within one’s community shapes the extent to which residents feel confident in accessing local resources and enjoying amenities. Respondents to the Age-Friendly Boston survey reported many strengths of Boston as a community. For example:
I enjoy living in the city, close to supermarkets, pharmacies, and all. That helps me to be more independent than if I lived in the outskirts of town where I would have to depend on my personal transportation to run errands and other things.
As a life-long resident, I feel extremely safe in my community.
Where I live, I am very happy. Everything I need is within walking distance, 1 or 2 blocks from my home.
In the listening sessions, nearly 50% of all recommendations voiced about this domain centered on improving walkability. Specifically, concerns were noted about the condition
29%
71%
Yes No
Note. Persons with disability are defined as those survey respondents who answered “yes” to the following question, “Do you have an impairment or condition that limits your ability to participate in your community?”

14
of sidewalks and crosswalks as challenges to walking in Boston when accessing outdoor spaces and some buildings. The opportunity to walk to amenities as well as the beautiful parks were noted as strengths in this domain. Overall, outdoor spaces in Boston are perceived as a strength of the City; but ensuring safety and accessibility of these amenities requires improvement. For example, results from the sample survey indicate that availability of parking is rated as dissatisfactory by nearly half of the sample (48%) (Figure 10). Listening session participants noted that poor parking availability impedes their ability to have visitors, including those who provide in-home care and support. Survey respondents echoed these sentiments in their responses, such as the following:
Since moving here in 2001 parking for visitors and family members has hindered my ability to have people who care about me come to visit very often!!! A policy should be designed so taxpayers who live here can have guests visit!!!
Resident parking gives unequal access to valuable curb space to those who own cars. Those who don't own a car, and only need occasional access to the curb in front of their building for a short time, while their nurse or family visits, must tell their people to search for a visitor space. Because those spaces are open to anyone, they can be hard to find!
Figure 10. Satisfaction with aspects of walkability in Boston
Approximately one-third of the survey sample considers the availability of safe sidewalks and places to sit along walkways dissatisfactory. These aspects of outdoor space create a barrier to walking in Boston, particularly for seniors experiencing changes in health or mobility. In listening sessions, participating seniors voiced concern about the timing of traffic lights and crosswalks as challenging their ability to walk safely in Boston. These
31%
44%
48%
49%
50%
51%
67%
21%
25%
22%
23%
26%
25%
16%
48%
31%
30%
27%
24%
24%
15%
Availability of parking
Availability of benches in public areas andalong walkways
Availability of maintained sidewalks
Timing of traffic lights and markedcrosswalks
Handicap accessibility of walkways andbuildings
Lighting along sidewalks and cycle paths
Clear labeling of street names and businessaddresses
Satisfied or very satisfied Neutral Dissatisfied or very dissatisfied

15
results suggest that in order to maintain the walkability of Boston as an important asset to seniors, some necessary improvements are needed to ensure the safety of residents of any age. Survey respondents illustrated why these pedestrians safety measures are so important for all residents of Boston,
We need focus on street crossings, light timing and coordination. There are MANY streets that are confusing or dangerous, where when to cross is not clear, the time allowed is not sufficient for the distance needed to cross.
As a pedestrian, navigating city streets remain an age-less problem from brick sidewalks to signaling at intersections, traffic speed, icy sidewalks. Boston does not take pedestrians’ ability to navigate safely and efficiently seriously. A problem for all ages, but amplified by aging.
Among survey respondents, 50% reported disagreeing with a statement that public restrooms are available in convenient locations (Figure 11). Access to public, and handicap-accessible, restrooms is particularly important to older adults who may experience incontinence or require privacy for the administration of medications or assistive devices. The importance of public restrooms is illustrated by one survey respondent,
The greatest problem for active Boston seniors is the lack of public bathrooms. The few that exist whether in private or public buildings are not publicized. Why is there no published list of public bathrooms in Boston? Why isn't there one at or near every T station? What is available to the public in City Hall and what are the days/hours of availability? What happened to those outside cylindrical pay toilets? Boston needs to proactively address its public bathroom problem if it really wants to be age friendly.
Figure 11. Park safety and Availability of public restrooms
32%
56%
19%
24%
50%
20%
Public restrooms are available inconvenient locations
I feel safe going to public parks in mycommunity
Strongly agree/agree Neutral Disagree/strongly disagree

16
In contrast, most respondents report that public parks in Boston are safe (56%; see Figure 11). However, this positive view was not shared by all segments of the respondents. Among respondents reporting having a disability, a higher percentage (29%) reported disagreement with the statement, “I feel safe going to public parks in my community” compared to those without disability (17%) (see Figure 12). These results highlight the importance of considering persons with functional limitations when it comes to designing safety features of public spaces in Boston.
Figure 12. “I feel safe going to public parks in my community”, by disability status
Another important aspect of making Boston age-friendly is to consider the extent to which older residents feel safe in their communities in general. A majority of older Bostonians agree that they feel safe where they live; a majority also agrees that law enforcement is visible in their neighborhoods (see Figure 13).
46%
25%
29%
59%
24%
17%
Strongly Agree/Agree
Neutral
Strongly Disagree/Disagree
No Disability
Disability*
*Note. Persons with disability are defined as those survey respondents who answered “yes” to the following question, “Do you have an impairment or condition that limits your ability to participate in your community?”

17
Figure 13. Public Safety
Especially for the 14% who do not feel safe in their neighborhood, improvements in public safety may promote confidence in taking advantage of opportunities for participation in the community. Survey respondents described how the perceived safety of their neighborhood impacts their ability to be outside, including the following:
It's been scary at times because of the crime level in my community. If the crime level could be controlled I would feel more safe when I am out, especially late nights.
I know that it is unsafe in the parks and certain locations, I try to be home not too late and be aware of my surroundings. Crime is everywhere, I have a son and worry when he is outside. It's not easy.
Transportation Access to safe and reliable transportation is essential in allowing residents to go where they want and need to go, helping them to meet service and participation goals. Concerns about transportation were the most frequently mentioned concerns in the listening sessions. Participants value Boston’s extensive public transportation system and many commented favorably on their experiences traveling by public transit. Affordability of transportation designed specifically for seniors, as well as the accessibility (schedule, reliability and availability) of senior transportation, was cited as a concern by those residents who attended listening sessions. Survey results indicate some dissatisfaction (see Figure 14) but overall high levels of satisfaction for the location (68%), schedule (56%) and affordability (55%) of public transit. Relatively large proportions of ‘neutral’ responses for both senior transportation options (37%) and volunteer driver programs
59%
66%
20%
20%
21%
14%
Law enforcement is visible in myneighborhood
I feel safe in the neighborhood where Ilive
Agree or strongly agree Neutral Disagree or strongly disagree

18
(52%) likely reflect respondents who are unaware of or have not used senior transportation or volunteer driver programs in Boston.
Figure 14. Satisfaction with transportation services
Survey respondents commented on ways in which transportation can present both opportunities and challenges for age-friendliness:
Everything is easy to get to by foot or public transportation. I know more of my neighbors than I did living in the suburbs.
We moved from the suburbs to take advantage of what the city offers without being dependent on a car. We are glad we made the change.
Public transportation is an issue. Stairs are a challenge for me, so I find I go downtown less than I used to. I'm retired and can't afford parking and the T is really not friendly to anyone with creaky knees and hips. Not enough escalators and too many stairs.
Senior shuttle is hard to get unless way in advance.
I had trouble with "the ride" and had to wait 3 hours for pick-up. (I was) on oxygen with fear of running out.
I wish there were a better way for seniors to feel independent without a car. I fear giving up driving because I still want to be able to leave the house whenever I please. Finding other options is very confusing and difficult.
Senior transportation options, like the RIDE, are particularly useful for Boston seniors who have mobility challenges when it comes to getting out and using public transportation. A
27%
48%
55%
56%
68%
52%
37%
23%
23%
19%
21%
15%
22%
21%
13%
Volunteer driver program
Van rides or other senior transportation
Affordability of public transport
Public transport schedule
Location of public transportation
Satisfied or very satisfied Neutral Dissatisfied or very dissatisfied

19
higher proportion of survey respondents who reported having a disabling condition were “very satisfied” or “satisfied” with senior transportation options (52%) compared to those without a disability (46%) (see Figure 15). Conversely, Boston senior residents with a disability also reported higher levels of dissatisfaction with these senior transportation options (19%) compared to those without a disability (13%). Clearly, this service is integral to the ability of older adults in Boston who struggle to remain engaged in their community due to a health or functional problem; and thus, the reliability, accessibility and affordability of these senior transportation options is critical to this group. Improving awareness of these programs, designed specifically to meet the travel needs of older adults, may be beneficial.
Figure 15. Satisfaction with van rides (such as the Ride), or other senior transportation, by disability status
Housing Affordable, appropriate, and stable housing are important elements of an age-friendly city. When asked, over half of survey respondents reported that sufficient and affordable housing options were not available in their neighborhood (see Figure 16). Similar patterns were noted when stratified by age, gender, disability or race/ethnicity.
52%
29%
19%
46%
41%
13%
Satisfied or very satisfied
Neutral
Dissatisfied or very dissatisfied
No Disability Disability *
*Note. Persons with disability are defined as those survey respondents who answered “yes” to the following question, “Do you have an impairment or condition that limits your ability to participate in your community?”

20
Figure 16. “Are there sufficient and affordable housing options available in your neighborhood?”
Understanding the types of housing stock that is appropriate for Boston’s senior residents is equally as important as the quantity of units. A majority of survey respondents (63%) reported that housing with services is the most needed type of housing in their area of Boston (see Figure 17). This result held true even when analyzed by age, gender, disability, race/ethnicity and economic status. Otherwise referred to as ‘supportive housing’, this type of residence typically includes a combination of housing and social services (e.g., case management, medical transport or meals). This type of housing includes assisted living facilities, but is also meant to include a wider trend in senior housing to create ways to help older residents live more stable, productive lives in their communities as opposed to nursing homes.
Figure 17. “In your experience, what kind of housing needs to be developed for seniors in your community?”
16%
55%
29%
Yes No Don't know
50%
26%
63%
Rental apartments
Houses and condos for homeowners
Housing with services (such as assistedliving)
Rental apartments
Houses and condos for homeowners
Housing with services (such as assisted living)

21
Evidence suggests that housing with services is a subset of social services that impacts the health and well-being of residents. 14
Survey respondents described additional unmet housing needs for seniors, for example:
There is not affordable housing available other than public housing projects which I am not eligible to get and honestly don’t want. We need over 55 housing here desperately.
I am a long time Charlestown homeowner/resident facing having to move due to the lack of affordable accessible housing options.
I have my own home. I need to sell it because I am too old to be a homeowner. I need to repair it. I have no money to repair it. I can't take a loan. Can the city make a little loan available to the elders?
Since we have an older home, home maintenance has become more labor and money-intensive. We are 60 and 64 and probably are not up to keeping the house much longer.
Social Participation Social isolation has been linked to serious health consequences including depression, hypertension, and cognitive impairment; isolation has even been associated with an increased risk of death15. Participation in social activities and informal sharing is critical to well-being. Social relationships and interaction are important to self-esteem and can provide not only purposeful activity, but meaningful emotional connections as well. In the survey, about half of respondents reported being “very satisfied” or “satisfied” with opportunities for social participation (see Figure 18). That being said, more than one out of five survey respondents reported being “very dissatisfied” or “dissatisfied” with the availability of recreational opportunities (21%) and accessible opportunities for informal sharing and social interaction (23%). These results suggest that there is room for improvement when it comes to creating accessible opportunities for Boston seniors to engage socially with one another as well as with persons of different generations.

22
Figure 18. Satisfaction with opportunities for social participation
Social networks and opportunities for social engagement do change with advancing age, due to loss of friends and family, changes in health status or increasing mobility limitations. Thus, it is important to consider this outcome in the context of age. Interestingly, satisfaction with opportunities for social engagement was highest among those survey respondents age 80 or older (51%), compared to those age 50-59 (39%) (see Figure 19). It is possible that older residents perceive more opportunities to be available, or prefer lower levels of interaction, accounting for this result. However, it is also possible that as they reach later life, midlife Boston residents will desire social engagement opportunities that differ in meaningful ways from those enjoyed by the current generation of older Bostonians. This result highlights the need for the City to be prepared to adapt its social engagement opportunities to appeal to the next generation of Boston seniors.
60%
46%
50%
25%
31%
29%
15%
23%
21%
Opportunities for you to participate incommunity activities
Accessible opportunities in yourneighborhood for informal sharing and
social interaction
The availability of recreationalopportunities
Satisfied or very satisfied Neutral Dissatisfied or very dissatisfied

23
Figure 19. Satisfaction with “accessible opportunities in your neighborhood for informal sharing and social interaction”, by age
Many listening session participants and survey respondents expressed great satisfaction with Boston’s many cultural amenities and activities, for example:
So many free offerings, especially at our fantastic public library!
It's a great city, and I am really enjoying it since I retired last year. I thought I wanted to move to Maine when I retired, but I'm having a whole new relationship with Boston now that I am free and at large in the city. So many educational opportunities!
I like having so many interesting cultural options. I like the way that Boston feels both small and large.
Other survey respondents expressed dissatisfaction with their options for participating in activities, their comments additionally suggesting access challenges:
Boston is not an age-friendly city. Where are the social activities (besides bingo) for seniors?
While some resources are devoted to the needs of indigent elders (as it should be), that which is available to those of us who are not indigent is catch-as-catch can. Moreover, much of what is available to me through non-governmental sources (university life-long learning, films, etc.) is difficult to access without a car, as the nearest bus stop is a 15-20 minute walk and not one I'd want to walk by myself in the dark.
39%
44%
48%
51%
34%
31%
30%
29%
27%
25%
22%
20%
50-59
60-69
70-79
80+
Very Satisfied/Satisfied Neutral Very Dissatisfied/Dissatisfied

24
And some participants at listening sessions indicated that they would like dedicated space for seniors to gather, consistent with these comments made by survey respondents:
[We] need a place to gather besides a bar- perhaps a coffee house, book store or room in library. [Boston has] lots to do for kids, young families but as our kids grow up we could use ways, places to connect with neighbors.
I just moved here to the area. I find it to be very lovely—my only concern is there is no senior center. The community center is more [focused] on younger needs. We need a senior center to explore and relate to other seniors.
Respect & Social Inclusion Respect and social inclusion are elements of the age-friendly framework because they promote participation and positively shape life satisfaction and well-being. Although this domain was not frequently verbalized during listening sessions, there were discussions of feeling ‘heard’ by health care professionals and other social service providers. Participants also reported a perceived lack of respect when using public transit and other community services. Among survey respondents, nearly half reported satisfaction with the extent to which older residents were treated respectfully (46%) (see Figure 21). Respondents to the survey wrote about their feelings regarding lack of respect, including the following comments:
When you are a senior, I feel that people feel that they have to make everything difficult for you. You have to fight for everything you need. You are treated with just disrespectful questions and answers.
A lot of people tend to ignore or take advantage of the elderly. It is difficult to know who to trust.
In general Boston is pretty age-friendly but there is some subtle ageism in the whole "innovation hub" approach. I would like to see some awareness that older folks can be innovative as well!
Another way to conceptualize respect and social inclusion among senior residents of Boston is to consider the extent to which they feel their voices are being heard from a policy or political perspective. Older adults turn out to vote at higher rates than their younger counterparts and as a consequence are an important constituent group with specific needs and perspectives. Over one-third (34%) of survey respondents expressed satisfaction with the extent to which local policy makers take the interests and concerns of older residents into account (see Figure 20). Ironically, a similar proportion of survey respondents reported dissatisfaction (36%) suggesting that providing accessible opportunities for older residents to interact with local policymakers is integral to advancing the age-friendliness of the city. For example, other than just hosting in-person events to engage with politicians, perhaps offering opportunities by which older adults can participate in the policy making process via volunteer work or advocacy would

25
improve the extent to which older residents feel that their concerns and opinions are validated by policymakers.
Figure 20. Respectful treatment of seniors and perceived political influence
When these results were examined by age (see Figure 21), it again becomes clear that residents age 50-69 report markedly different views than Boston residents age 70 or older. In the case of this particular domain, those ages 50-59 report the lowest rates of satisfaction with the extent to which older residents are treated respectfully (35%); and those age 80 and older report the highest rates of satisfaction (59%). Recommendations made by focus group participants include a multi-media campaign to combat age stereotypes and create an image of aging in Boston that reflects the vitality and diversity of the older residents. One specific example given by focus group participants included leveraging one of the Boston sports teams to engage in such a public campaign. This idea brings issues of ageism to light and also appeals to younger generations of Boston residents to increase awareness for the importance of the respectful treatment and social inclusion of older residents.
34%
46%
30%
28%
36%
26%
The extent to which local policy makerstake into account the interests and
concerns of older residents
The extent to which older residents aretreated respectfully
Satisfied or very satisfied Neutral Dissatisfied or very dissatisfied

26
Figure 21. Satisfaction with “the extent to which older residents are treated respectfully”, by age
Additional analysis revealed that survey respondents who reported being economically insecure were substantially less satisfied with the extent to which older residents were considered by local policymakers (see Figure 22). Among financially insecure respondents, over half reported being dissatisfied with the extent to which local policy makers take into account the interests and concerns of older adults (53%). In contrast, just 27% of those with adequate resources to meet their financial needs reported being dissatisfied. This disparity further highlights the differing experiences reported by Boston’s diverse senior population across age-friendly domains.
35%
39%
52%
59%
32%
29%
24%
23%
32%
32%
24%
18%
50-59
60-69
70-79
80+
Very Satisfied/Satisfied Neutral Very Dissatisfied/Dissatisfied

27
Figure 22. Satisfaction with “the extent to which local policymakers take into account the interests and concerns of older residents”, by economic security
Civic Participation & Employment Civic participation and employment are essential components of well-being for all age groups. These experiences provide a sense of purpose, an opportunity to remain engaged and involved, and access to social networks and supports. For most adults, including many “retirement-aged” adults, employment is a meaningful and sometimes essential component of participation. In a large urban city like Boston, opportunities for civic engagement and volunteering appear abundant. Indeed, nearly half of survey respondents (48%) agreed that older adults are encouraged to volunteer and remain engaged in the community. With the hustle and bustle of a large city also comes steep competition for employment among all age groups, and seniors are no different. Only 18% of survey respondents agreed that there are adequate employment opportunities available to older adults (see Figure 23).
40%
22%
33%
24%
27%
53%
Economically Secure
Economically Insecure*
Very Dissatisfied/Dissatisfied Neutral Very Satisfied/Satisfied
*Note. Persons with economic insecurity are defined as those who answered “Strongly Disagree” or “Disagree” with the following statement, “I have adequate resources to meet my financial needs, including home maintenance, personal healthcare, and other expenses.”

28
Figure 23. Extent to which older residents have the opportunity to engage in volunteer work or paid employment
This result appears particularly salient among Boston’s “working-age” seniors age 50-69, among whom over half report disagreement with the adequacy of employment opportunities for older Bostonians (see Figure 24). Survey respondents comment on unmet needs relative to employment for seniors in Boston, remarking:
[There are] not enough job opportunities for baby boomers who aren't ready to retire. I'm relatively healthy. I'm already 70 but I still want to keep working. I applied for at least 20 jobs, but nobody hired me.
Results from the survey and listening sessions suggest that by financially supporting the extensive volunteer workforce in Boston (i.e., with a stipend or vouchers), the needs for employment may be ameliorated to some degree.
48%
18%
30%
33%
22%
49%
Older adults are encouraged tovolunteer and remain engaged in the
community
There are adequate employmentopportunities available to older adults in
my community
Agree or strongly agree Neutral Disagree or strongly disagree

29
Table 24. “There are adequate employment opportunities available to older adults in my community”, by age
Communication & Information Accessing information about resources, events, and opportunities is important to well-being and quality of life. Good communication and adequate information allow residents to participate in community events that interest them or may be helpful to them or their families. In addition, effective communication with seniors, and all residents for that matter, contributes to safety during emergencies. An overwhelming majority of Boston seniors (76%) reported that they felt informed about what to do in the event of a weather or other emergency (see Figure 25). This level of communication is a true asset to Boston’s seniors as specific evacuation routines and extra support are typically required by older residents during these types of emergencies (e.g., more time to evacuate or the provision of air conditioning units during high heat periods). However, among survey respondents who reported economic insecurity, only 68% confirmed that they felt informed about what to do in the event of an emergency, suggesting that information gaps are present around this essentially important issue.
15% 15%21% 22%
27% 30%34%
42%
58%55%
45%
37%
50-59 60-69 70-79 80+
Strongly Agree/Agree Neutral Strongly Disagree/Disagree

30
Figure 25. “Do you feel informed about what to do in the event of a weather or other emergency?”
It is impossible to access a service, amenity or support resource without being aware of its existence. With adequate information, residents can take advantage of community amenities or services that are already in place. Results from listening sessions illustrated that Boston is a city full of desirable amenities and services for older adults; and yet knowing about these resources continues to be a barrier to utilization, and subsequent benefit. Communication gaps about resources and events were consistently noted by residents as an unmet need. Thus, improving communication about available resources and programs is recognized as among the most crucial vehicles through which accomplishing age-friendliness in Boston may be improved.
Subsequently, it is important to understand the means by which older Bostonians receive information in order to make improvements. Newspapers and television (58% and 50%) were cited as the most preferred sources of communication for older residents (see Figure 26). These results suggest that while many older adults are effectively reached through electronic media, print media, television and radio are important mechanisms for delivering information to seniors.
When this survey item was stratified by race/ethnic group, results revealed important differences in preferences for source of information. Nearly two-thirds of older Hispanic survey respondents prefer television (64%) as a source of information about local activities, and approximately half of older Black residents prefer to get local information from churches or faith organizations (see Figure 27). As providing information and outreach to Boston’s seniors continues to be a priority, understanding the nuances of how information is consumed by residents is necessary for successfully engaging all members of Boston’s older adult community in the age-friendly movement.
76%
14%
10%
Yes
No
Don't know

31
Figure 26. “What are your preferred sources of information about programs, activities, and services in your community?”
Figure 27. “What are your preferred sources of information about programs, activities, and services in your community?”, by race/ethnicity
58%
30%
50%
30%
39%
Newspaper Radio TV Churchorganizations
Internet
53%
64%
49%
42%
64%
24%
0% 10% 20% 30% 40% 50% 60% 70%
Newspaper
Radio
TV
Internet Posting
Church or faith-based organization
Other
Other Hispanic Black Asian White

32
Being aware of social programming and opportunities for social interaction is a first step in accessing such supports. Among survey respondents, differences emerged with respect to how information about social activities and events are communicated. For all age groups combined, 42% of the sample reported being “very satisfied or satisfied” with how activities and events are communicated, including information about the activity, its accessibility and transportation options. However, when stratified by age (see Figure 28), satisfaction with how social activities are communicated is higher in the older age groups. This result suggests that communication about social events and activities is satisfactory to nearly half of seniors age 70-79 (48%) and those 80 or older (51%); however, social communication can be improved upon, particularly among those ages 50-59 and 60-69.
Figure 28. Satisfaction with “how activities and events are communicated to older residents, including information about the activity, its accessibility, and transportation options”, by age
Ideas about ways to improve information and communication were offered by listening session participants as well as by survey respondents, such as these recommendations for improving communication to older residents:
Events like the tall ships in Boston: I was totally surprised to learn about this event after they left. Note: I do not get the daily newspapers. Too expensive! I must say the TV could do a better job at announcing up and coming important events like the tall ships.
[The City] needs a better way for us to communicate, a website.
34% 35%48% 51%
30% 29%
23% 21%
36% 36% 28% 28%
50-59 60-69 70-79 80+
Very Dissatisfied/Dissatisfied
Neutral
Very Satisfied/Satisfied

33
The City of Boston should also consider providing affordable Wifi beyond the boundaries of the Boston Common public space. Technology is essential to maintaining communication among our growing elderly population.
Community Supports & Health Services Community supports and health services include a vast array of programs, services and industries in Boston. Items in this domain include resources that promote health among older adults or provide the infrastructure by which aging at home for Boston’s seniors is made feasible. These supports and services are equally essential features of an age-friendly community because these services help residents secure wellness, respond to medical events, and fill gaps in the matrix of informal supports. Listening session participants reported many strengths among Boston’s services and amenities, as well as challenges and gaps. In addition, numerous recommendations for enhancing the age-friendliness of the City by improving community supports emerged during these events. This domain is relevant to the many provider organizations in Boston that promote age-friendliness through the provision of community supports or health services as well as to the City as a whole.
Focusing first on rates of reported dissatisfaction, it is noted that opportunities for continued learning (26%) and availability of affordable, quality food (25%) are the amenities yielding the highest rates of dissatisfaction among Boston survey respondents (see Figure 29). Satisfaction ratings from 36% (for caregiver support) to 58% (for fitness opportunities) are observed across these features. Notably, more than four out of ten respondents report being “neutral” on their satisfaction with home care services (chore/homemaking/home health aide) and with caregiver support—possibly suggesting that many Boston residents have little familiarity with these services.

34
Figure 29. Satisfaction with community support services
Eligibility for many of the programs and services within this domain are needs-based. In other words, seniors in Boston with limited income are often exclusively eligible to take advantage of programs like Meals on Wheels or receive significant support to access programs like respite care. For this reason, it is important to examine this survey item by economic security status to understand differences in experience with these community supports. Compared to economically secure older residents, those without adequate resources to meet their financial needs report substantially lower rates of satisfaction with each of the community support services: fitness opportunities, affordable food, home care services and caregiver support services (see Figure 30). Perhaps most striking, is that only 35% of economically insecure older residents report being satisfied with affordable, quality food compared to 60% of older residents who are categorized as economically secure, a difference of nearly double. These results, together, suggest that although many community supports exist in Boston they may be inaccessible to segments of the city’s senior population who most need the help.
36%
44%
44%
51%
58%
46%
30%
42%
24%
24%
18%
26%
14%
25%
18%
Caregiver support (such as respite, daycare,and support groups)
Opportunities for continued learning (such aslifelong learning opportunities, workshops, or
tours)
Chore/homemaking or home health aideservices
Affordable, quality food
Fitness opportunities (such as exercise classesand paths or trails)
Satisfied or very satisfied Neutral Dissatisfied or very dissatisfied

35
Figure 30. Percentage “very satisfied” or “satisfied” with community support services, by economic security status
Survey respondents also commented on additional limitations of community amenities and support services, such as the following:
Food in stores is priced too high.
…elderly discounts & services should be based on age. There are a lot of elderly people who are in between low income assistance level and level able to afford activities that encourage engagement in the community and quality of life as one ages.
I am still very able to live alone in my own home, will expect to need some home help in 5-10 years. As seniors, I feel we really need help cleaning sidewalks, snow shoveling and with home repair and maintenance.
In addition to community support services, health services are a necessary feature of an age-friendly city. For a city like Boston, rich in high-quality hospitals and medical schools,
65%
60%
49%
41%
51%
44%
35%
34%
28%
30%
Fitness Opportunities (such as exerciseclasses and paths or trails)
Affordable, quality food
Chore/homemaking or home health aideservices
Caregiver Support (such as respite, daycareand support groups)
Opportunities for Continued Learning (suchas lifelong learning opportunities,
workshops, or tours)
Economically Insecure* Economically Secure
*Note. Persons with economic insecurity are defined as those who answered "Strongly Disagree" or "Disagree" with the following statement, "I have adequate resources to meet my financial needs, including home maintenance, personal healthcare, and other expenses."

36
it is not surprising that over half of survey respondents were satisfied with access to physical health services (see Figure 31). However, substantially lower satisfaction rates are reported when it comes to accessing mental or behavioral health services (39%). Once again, rates of “neutral” response in this domain likely indicate respondents who simply don’t use these services and thus cannot speak to their satisfaction. A similar pattern of results is evident when stratified by age, gender, race/ethnicity, disability or economic security status.
Figure 31. Percentage “very satisfied” or “satisfied” with health and social services
Perceived Age-Friendliness The Age-Friendly Boston Initiative is both a process and a movement at the City level to acknowledge older residents as an important and valuable segment of the city. For this reason, it is important to prompt residents to evaluate their city and neighborhoods in terms of their “age-friendliness”. In order to gauge survey respondents’ perception of the current age-friendliness of Boston, they were asked the extent to which they agree or disagree with the statement “My community is age-friendly.” Over half of the survey respondents indicated that they “agreed” or “strongly agreed” (see Figure 32) that their community is age-friendly; while one out of five respondents disagree with this characterization.
39%
48%
52%
39%
34%
29%
22%
18%
19%
Access to mental or behavioral healthservices for older residents
Quality of social services available toolder residents (such as information &
referral, Meals on Wheels)
Access to physical health services forolder residents
Satisfied or very satisfied Neutral Dissatisfied or very dissatisfied

37
Figure 32. “My community is age-friendly”
This survey item was also analyzed by age (see Figure 33). Interestingly, the percentage agreeing with the statement “My community is age-friendly” was higher in the older age groups (70-79 and 80+) as compared to the younger age groups (50-59 and 60-69). Further, the percentage of “neutral” responses is highest among those age 50-59 and lowest among those age 80 or older. Together, these results support the notion that although the aims of the Age-Friendly Boston Initiative may be beneficial for Boston residents of all ages, these concepts may seem most relevant to older residents. Thus, continued outreach and promotion of the initiative among younger age groups is necessary for residents of Boston to fully appreciate the concept of age-friendliness and for the City to be capable of creating a truly age-friendly environment.
13%
41%27%
15%
4% Strongly agree
Agree
Neutral
Disagree
Stronglydisagree

38
Figure 33. “My Community is age-friendly”, by age
Professional Provider Perspective Across the 3 focus groups, comprised of service providers and representatives from a number of city departments, common themes emerged. First, providers felt a great need for availability of centralized information about services and supports available to Boston’s seniors. They described that elders had difficulty navigating the system and thus there is a need to provide better guidance and support in understanding the available services. Related to this, they also felt that there was a disconnection between the local government and their organizations that were providing the services. The providers felt that it was through collaboration and communication between the different bodies that we would succeed in making Boston more age friendly. This includes both local government and their organizations as well as between different community organizations. In addition, the domain of communication was also seen as an opportunity to be readily built upon. Utilizing existing relationships and resources, providers felt that with some additional support and recognition, a more comprehensive network of information and communication could be developed. Many providers that participated in the focus groups talked about the need for improved communication from government and organizations to seniors but also between organizations. For example, one focus group participant said:
46%
32%
23%
50%
29%
21%
58%
25%
17%
65%
22%
14%
Strongly Agree/Agree
Neutral
Strongly Disagree/Disagree
80+ 70-79 60-69 50-59
39
It's just about helping folks connect the dots. The services are there. It's just creating a roadmap for those who serve elders to help find the resources that they need. I always think of these two really great resources that I think are untapped. Number one, there's already a magazine for seniors… increase its distribution. You can find new distribution channels. You can bring it more online so that you're hitting the professionals who tend to look for resources. And then obviously there is [a phone line] that is a one stop shop for everything that you need as an elder and those are probably the two resources that I think can be built up to help …tackle that communication issue.
A second set of themes had to do with specific, and important, needs relative to housing and transportation. Housing was discussed both in terms of a challenge and as part of the recommendations. The major challenges relating to housing identified in focus groups were overbuilding, lack of education for older homeowners in Boston, construction of high-end buildings, and lack of affordable housing units. The providers also commented that transportation was key to being able to get elders out of their homes. Some providers identified transportation as a component of their services, but transportation support is often tied instead to other services like meeting medical needs, or helping people with disabilities take part in day programs; some transportation services are event-specific and not available for more frequent use. Additional options for seniors to get where they need and want to go on a more convenient basis was cited as a recommendation for making the City more age-friendly. For example, another focus group participant said:
Elder friendly transportation is very expensive. The needs of an elder are very different than that of a general working population…. Our transportation network is very much built around getting people back and forth to work. It's not necessarily around getting both to and from the activities that enable them to remain independent, like going to the doctor, or going to social activities.
Another participating provider emphasized the unmet housing needs that exist particularly for low-income seniors in Boston:
… We have a basic needs division that serves people of all ages, many of whom are older, and it's housing and – housing and housing. In some cases it's representing people who are losing their housing. In other cases it's trying to help people find housing who are homeless or who can't afford to live where they are, or are transitioning, making a move to a different kind of housing 'cause they had lived where they are for health reasons.
A final theme which emerged in all three focus groups was the issue of respect and social inclusion. This theme was commented on from a social participation perspective, a political and advocacy perspective, a media or communication perspective, and also from an intergenerational perspective. Suggestions that were generated included the creation of more intergenerational volunteer activities. Providers called the wealth of young people in the City an “untapped resource.” Establishing volunteer opportunities in support of age-friendly themes could fostering intergenerational relationships and teach

40
younger generations to respect and acknowledge older residents. One participant suggested pairing younger and older advocates together to teach one another different methods of being politically active. In addition to increasing volunteering among the younger generation, the providers also emphasized the need to include the elders themselves in identifying solutions. This would help in changing the image of the seniors and draw the valuable insights and experiences of older adults.
Three providers discussed in one focus group the importance of raising awareness of senior issues among the general public and engaging seniors in a direct capacity through the Age Friendly Boston Initiative:
Participant 1: We need to raise awareness that the elderly are out there and that they're still an active part of the community and they still have abilities and interests.
Participant 2: Old lives matter, I mean this idea that you [want] to galvanize interest and visibility and –
Participant 3: And activate the people who are affected by all of it. I mean there's just something wrong, that … the city was made great by that generation, and now they're being edged out and pushed out, and I don't think, you know, the young folks moving in want that to happen, but they don't know that it's happening.
The individuals involved in focus groups for this study identified the need for greater emphasis on elder issues as key to the initiative. They suggested that making elders more “visible” in public awareness would be a positive result. Public campaigns to counter age stereotypes and increase awareness of older people in Boston were mentioned as a strategy that may contribute to more respect and inclusion of seniors.
Conclusion It is clear from the consistently high rates of satisfaction and agreement from survey responses that a large share of older residents find Boston to be a favorable place to age. When it comes to specific services and supports that emerged as unmet needs, both access to mental health services and the availability of appropriate and affordable housing alternatives were among the most striking.
In addition, two over-arching themes emerged from this needs assessment of Boston’s senior population. First is the issue of accessibility. Access to the amenities and resources of an age-friendly city is critical to the success of the Age Friendly Boston Initiative. Across all eight domains, senior residents indicated that it was not for lack of programs, resources or service options that they struggled to get their needs met or were dissatisfied with their experiences; rather, it was issues of access that created barriers. Examples of ways in which access is featured in this assessment include:

41
• Walkability. Safe and maintained sidewalks, benches to sit along walking or cycling paths and the availability of public restrooms are all facilitators of walkability for seniors in Boston. Being able to access Boston’s amenities on foot not only encourages physical activity; but also promotes feelings of independence for seniors.
• Centrally located and up-to-date information available in multi-media and multiple languages. Access to engaging with the Age-Friendly Boston Initiative hinges on awareness and communication. There is an unmet need in Boston for centrally located and up-to-date information. Resources that are not well known or are poorly understood cannot be effectively utilized by seniors aiming to age in community. Multi-media communication is needed to reach all of the diverse segments of Boston. Increased communication about supports and services is not only a need reported by seniors; but is also an unmet need of organizations and professionals who provide services and supports to Boston’s older residents.
• Inclusivity of Boston’s most vulnerable senior residents. Residents with fair or poor health and disabling conditions stand out as segments of Boston’s older adult population that face additional barriers to accessing services and supports necessary to remain in the community. For example, although public transportation is satisfactory to many seniors in Boston, those with limited mobility may require supports in using public transportation or they may need a higher level of access to senior transportation options, such as the RIDE. Additional outreach and support is needed for these adults to engage with the activities promoted by the Age Friendly Boston Initiative. This result underpins the potential synergy between an age-friendly and a disability-friendly community: both models strive to improve accessibility and livability for adults of all ages and functioning.
Differences between age cohorts within the senior population in Boston is a second major theme stemming from results of this needs assessment effort. The survey portion of this needs assessment included residents age 50 and older. Results suggest that the ‘midlife’ residents of Boston (ages 50-69) have differing thoughts and needs for aging in Boston than those residents of Boston age 70 and older. For example, younger residents are less satisfied with opportunities for employment, report less satisfaction with elements of the respect and social inclusion of older residents, and also report less satisfaction with opportunities for social interaction. These differences prompt the Age-Friendly Boston Initiative to think creatively about how the actions they take will impact not only the current cohort of seniors, but also the cohort of seniors coming of older age in Boston.

42
Moving Towards Action What will it take to add life to years for Boston residents? Results from this needs assessment portion of the age-friendly process will directly inform the next steps of the planning and implementation processes. A series of domain-specific work groups is being planned to review what has been learned so far about aspects of each domain. Members of these groups will include seniors, service providers and experts from other City departments and initiatives. These workgroups will be tasked with generating a series of recommended action items. An advisory group is being established to further develop the steps necessary to execute each action item and see to it that these actionable steps are implemented. Appropriate metrics for evaluation will be established to track the progress made towards an Age-Friendly Boston. Results of these evaluation efforts will subsequently inform how action items continue to be prioritized and executed. Recalling that an age-friendly city initiative is an iterative and cyclical process, these action and evaluation processes will continue as each domain is addressed.

43
References
1Author calculations based on the American Community Survey and the US Census Bureau population estimates program.
2Mutchler, Jan, Bernard Steinman, Caitlin Coyle, Hayley Gleason, Jiyoung Lyu, and Ceara Somerville. “Aging in Boston: Preparing today for a growing tomorrow” (2014). Gerontology Institute Publications. http://www.umb.edu/demographyofaging
3US Census Bureau, American FactFinder 5-year estimates (2010-2014), Table S0102
4Massachusetts Healthy Aging Community Profiles (2014). http://mahealthyagingcollaborative.org/connect/conversations/
5World Health Organization (2007). Global Age Friendly Cities: A Guide. Retrieved June 7, 2016 http://www.who.int/ageing/publications/Global_age_friendly_cities_Guide_English.pdf
6Fox-Grage W, Walls J. State studies find home and community-based services to be cost-effective. Washington, DC: AARP Public Policy Institute; 2013. Accessed at http://www.aarp.org/content/dam/aarp/research/public_policy_institute/ltc/ 2013/state-studies-find-hcbs-cost-effective-spotlight-AARP-ppi-ltc.pdf
7Leyden, Kevin M. "Social Capital and the Built Environment: The Importance of Walkable Neighborhoods." American Journal of Public Health 93.9 (2003): 1546-51. ProQuest. Web. 2 June 2016.
8Adams, K. B., Leibbrandt, S., & Moon, H. (2011). A critical review of the literature on social and leisure activity and wellbeing in later life. Ageing and society, 31(04), 683-712.
9Berkman, L. F., Glass, T., Brissette, I., & Seeman, T. E. (2000). From social integration to health: Durkheim in the new millennium. Social science & medicine, 51(6), 843-857.
10Holt-Lunstad, J., Smith, T. B., & Layton, J. B. (2010). Social relationships and mortality risk: a meta-analytic review. PLoS Med, 7(7), e1000316.
11Ontario Senior Secretariat, Accessibility of Ontario, University of Waterloo and McMaster University (nd).) http://www.seniors.gov.on.ca/en/resources/AFCP_Eng.pdf
12The Elder Index is calculated by the Gerontology Institute at UMass Boston, for every county in the United States. Detailed information on the Elder Index is available at http://www.umb.edu/demographyofaging/projects/elder_economic_security
13Pérez-Zepeda, M. U., Belanger, E., Zunzunegui, M. V., Phillips, S., Ylli, A., & Guralnik, J. (2016). Assessing the Validity of Self-Rated Health with the Short Physical Performance Battery: A Cross-Sectional Analysis of the International Mobility in Aging Study. PloS one, 11(4), e0153855.

44
14 Taylor, L. A., Coyle, C. E., Ndumele, C., Rogan, E., Canavan, M., Curry, L., & Bradley, E. H. (2015). LEVERAGING THE SOCIAL DETERMINANTS OF HEALTH: WHAT WORKS?. Blue Cross Blue Shield of Massachusetts Foundation. New Haven, CT: Yale Global Health Leadership Institute. Retrieved June, 7, 2016. http://bluecrossmafoundation.org/publication/leveraging-social-determinants-health-what-works
15 Holt-Lunstad, J., Smith, T. B., Baker, M., Harris, T., & Stephenson, D. (2015). Loneliness and Social Isolation as Risk Factors for Mortality A Meta-Analytic Review. Perspectives on Psychological Science, 10(2), 227-237.

45
A City of Boston Initiative, in partnership with the University of Massachusetts Boston and AARP
Exhibit I. Age-Friendly Boston Survey Tool
This survey of City of Boston residents aged 50 and over is being conducted by the University of Massachusetts Boston on behalf of the Age-Friendly Boston Initiative. This survey is part of a wider community consultation process to gain feedback that will inform the development of the City of Boston Age-Friendly Initiative Action Plan. Completion of this survey is voluntary and all responses are confidential.
Please complete and return this survey to: The Center for Social and Demographic Research on Aging, The Gerontology Institute, UMass Boston, 100 Morrissey Blvd., Boston, MA, 02125. You may also complete the survey online at: https://www.surveymonkey.com/r/AgeFriendlyBoston. For assistance or to request a survey in Spanish, Haitian Creole, Chinese, Russian, or Cape Verdean please call 617-287-7361 or email [email protected]. Thank you for your participation in this important initiative.
COMMUNICATION AND INFORMATION
1. Which of the following services are available in your community? (Check all that apply) Legal aid Tax work-off programs Food banks Tax abatements
2. What are your preferred sources of information about programs, activities, and services in your community? (Check all that apply) Newspaper Radio TV Church and faith-based organizations Internet postings Other:_____________________________________________
3. Do you feel informed about what to do in the event of a weather or other emergency?
PUBLIC SPACES
4. Please select your level of agreement with each statement below. Strongly
Agree Agree Neutral Disagree Strongly
Disagree Public restrooms are available in convenient locations
I feel safe going to public parks in my community
Yes No Don’t Know

46
HOUSING
5. In your experience, what kind of housing needs to be developed for seniors in your community? (Check all that apply) Rental
apartments Houses and condos
for homeowners Housing with services (such as assisted living)
Other: ________________________
6. Are there sufficient and affordable housing options available in your neighborhood? SOCIAL PARTICIPATION, INCLUSION,
AND COMMUNITY SUPPORTS
7. Please rate your level of satisfaction with each of the following aspects of your community. Very
Satisfied Satisfied Neutral Dissatisfied Very
Dissatisfied Fitness opportunities (such as exercise classes and paths or trails)
Affordable, quality food Chore/homemaking or home health aide services
Caregiver support (such as respite, daycare, and support groups)
Opportunities for continued learning (such as lifelong learning opportunities, workshops, or tours)
8. Please rate your level of satisfaction with each of the following aspects of your community.
Yes No Don’t Know
Very Satisfied
Satisfied Neutral Dissatisfied Very Dissatisfied
Opportunities for you to participate in community activities
Accessible opportunities in your neighborhood for informal sharing and social interaction
The availability of recreational opportunities
How activities and events are communicated to older residents, including information about the activity, its accessibility, and transportation options
The extent to which local policy makers take into account the interests and concerns of older residents

47
CIVIC PARTICIPATION AND EMPLOYMENT
9. Please select your level of agreement with each statement below. Strongly
Agree Agree Neutral Disagree Strongly
Disagree Older adults are encouraged to volunteer and remain engaged in the community by providing them with flexible and accessible opportunities
There are adequate employment opportunities available to older adults in my community
SAFETY
10. Please select your level of agreement with each statement below. Strongly
Agree Agree Neutral Disagree Strongly
Disagree Law enforcement is visible in my neighborhood I feel safe in the neighborhood where I live NAVIGATING THE COMMUNITY
11. Please rate your level of satisfaction with each of the following aspects of your community. Very
Satisfied Satisfied Neutral Dissatisfied Very
Dissatisfied Clear labeling of street names and business addresses
Availability of parking Handicap accessibility of walkways and buildings
Availability of maintained sidewalks Lighting along sidewalks and cycle paths Availability of benches in public areas and along walkways
The extent to which older residents are treated respectfully
The quality of social services available to older residents (such as information and referral services, and meals on wheels)
Access to physical health services for older residents
Access to mental or behavioral health services for older residents

48
Timing of traffic lights and marked crosswalks
Van rides (such as The Ride), or other senior transportation
Volunteer driver program (organized rides from volunteers)
Location of public transportation Public transportation schedule Affordability of public transportation OVERALL COMMUNITY PERSPECTIVE
12. Select your level of agreement with the statement below. Strongly Agree Agree Neutral Disagree Strongly Disagree My community is age-friendly
DEMOGRAPHIC INFORMATION
13. Sex:
14. Age:
15. What Boston neighborhood do you live in?
Allston Back Bay Bay Village Charlestown Beacon Hill Brighton Chinatown/Leather District Downtown East Boston Fenway/Kenmore Hyde Park Jamaica Plain Mattapan Mission Hill North Dorchester North End Roslindale Roxbury South Boston South Dorchester South End West End West Roxbury
16. Do you speak a language other than English at home? 17. Which of the following best describes your race/ethnicity? (Check all that apply)
18. How would you describe your current health? 19. Do you have an impairment or condition that limits your ability to participate in your community?
20. Please indicate your level of agreement with the following statement: “I have adequate resources to meet my financial needs, including home maintenance, personal healthcare, and other expenses.”
21. Please include additional comments related to your experience living in Boston: _______________
Female Male
50-59 60-69 70-79 80-89 90+
Yes No
White/Caucasian Asian Black/African American Hispanic/Latino Other: ____________________________________________
Excellent Good Fair Poor
Yes No
Strongly Agree Agree Disagree Strongly Disagree

49
___________________________________________________________________________________
___________________________________________________________________________________
Thank you for your participation!
If you have any questions about the survey, or about participating in this study, you may contact Dr. Jan Mutchler at the University of Massachusetts Boston, at 617-287-7321.
The Institutional Review Board (IRB) at the University of Massachusetts Boston (UMB) has approved this study. If you have any concerns about your rights as a participant in this study, please contact a representative of the IRB at UMB, which oversees research involving human participants. The IRB may be reached at the following address: IRB, Quinn Administration Building-2-080, the University of Massachusetts Boston, 100 Morrissey Boulevard, Boston, MA 02125-3393. You can also contact the Board by telephone (617-287-5374) or by email ([email protected]).