africa s business revolution
TRANSCRIPT

AFRICA’S BUSINESS
REVOLUTION
HOW TO SUCCEED IN THE WORLD’S
NEXT BIG GROWTH MARKET
BY ACHA LEKE, MUTSA CHIRONGA,
AND GEORGES DESVAUX

Contents
Figure P-1 3
Figure 1-1 4
Figure 1-2 5
Figure 1-3 6
Figure 1-4 7
Figure 1-5 8
Figure 2-1 9
Figure 2-2 10
Figure 2-3 11
Figure 2-4 12
Figure 2-5 13
Figure 3-1 14
Figure 3-2 15
Figure 3-3 16
Figure 4-1 17
Figure 5-1 18
Figure 5-2 19
Figure 6-1 20
Figure 6-2 21
Figure 6-3 22
Figure 6-4 23

FM.indd Page x 29/11/18 1:59 PM
African countries with over40 million citizens in 2017,millions of people
AlgeriaEgypt SudanUgandaEthiopia KenyaTanzaniaDRC S. AfricaNigeria
189
93 92 87
5750 47 42 42 41
African countries by population in 2017,millions of people
*Data for Somalia and South Sudan from the World Bank. Other country data on mapcame from the UN.
Source: United Nations World Population Prospects; World Bank; International MonetaryFund; World Economic Outlook Database, April 2017.
Morocco
Senegal
CaboVerde
EritreaDjibouti
Tunisia
Cameroon
Congo
EquatorialGuinea
Benin
Togo Gabon
CentralAfrican Rep.
Somalia*
UgandaRwandaBurundi
Madagascar
Swaziland
Lesotho
Namibia
AngolaComoros
Mauritius
Seychelles
Mozambique
Malawi
Zambia
Zimbabwe
Botswana
Libya
Chad
South Sudan*
Niger
BurkinaFaso
Ghana
Guinea
Côted'Ivoire
LiberiaSierra Leone
Guinea-BissauThe Gambia
MauritaniaMali
Egypt
Sudan
Ethiopia
Kenya
Tanzania
DemocraticRepublic
of the Congo(DRC)
SouthAfrica
Nigeria
Algeria
<10 10–40 >40
São Toméand Príncipe
Africa’s 54 countries are home to 1.2 billion people
FIGURE P-1
3

Chapter_01.indd Page 10 27/08/18 9:39 PM
The numbers highlight Africa’s acceleration—andthe opportunity for business
trillion dollars in projectedconsumer and businessspending by 2025
FIGURE 1-1
5.6billion people—with population expectedto double by 2050
1.2
89
54potential growth in manufacturing output by 2025
2x
million square miles ofland—three times thatof Europe
11companies with annual revenues of $1 billionor more
400
million active users of mobile �nancial services
122cities of over 1 millioninhabitants by 2030
countries expected to create the world’s largest free trade area
4

Chapter_01.indd Page 13 27/08/18 9:39 PM
Among respondents to our Africa business survey, Africa-basedcompanies are especially bullish.
Most companies see Africa as a major growth market
FIGURE 1-2
Of the following scenarios in Africa over the next 20 years,which do you believe are likely to occur? % of respondents*
African All other African All other
What changes do you expect for your organization in Africain the next five years? % of respondents*
Increase in number ofcountries where theorganization operates
Increase in revenuefrom Africa
Increase in workforcesize in Africa
African All other African All other
89
76
African All other
72
49 4958
Africa’s educational performance has improvedsignificantly, due to digital technologies and otherinvestments.
Most African households have joined the consumer class.
Africa’s combined GDP is one of the fastest-growing in the world.
New investments in Africa’s mineral resources have contributed significantly to the continent’s economic growth.
85
65
African All other
62
50
African All other
65
54
6663
*Total respondents = 1,025 (respondents from Africa = 253; from all other regions = 772).
Source: Mckinsey Insights executive survey on business in Africa, 2017.
5

Chapter_01.indd Page 19 27/08/18 9:39 PM
Africa’s 700 largest companies earn a combined$1.4 trillion in revenues
Source: MGI African companies database; McKinsey Global Institute analysis.
13>$10 billion
Number of companies Total revenue*Revenue size
42$5 billion–$10 billion
341$1 billion–$5 billion
296$500 million–$1 billion
200
703
284
261
$ billion
Companieswith >$1 billionrevenue
396companies
$1.2 trillion revenue
Total 692companies
$1.4 trillionrevenue
Breakdown of companies by revenue size, April 2016
*2014 or most recent data.
FIGURE 1-3
6

Chapter_01.indd Page 21 27/08/18 9:39 PM
Nearly half of Africa’s big firms are based in South Africa
Source: MGI African companies database; McKinsey Global Institute analysis.
*Regional definition from the African Development Bank; 2014 or most recent data.
Note: Includes multinational corporations with local branches registered in Africa; does notinclude those based outside of Africa.
North Africa 133
East Africa 25
West Africa 40
Nigeria 56
Southern Africa 43
Central Africa 19
South Africa 300
North
South Africa West Central
EastSouthern
49 22 7 6 4 3
North Africa
West Africa East Africa
Central Africa
Nigeria
Southern Africa
SouthAfrica
Nigeria
9
Companies with more than $500 million in revenue, by region, 2014,*number of companies
Regional share of Africa’s total, %
FIGURE 1-4
7

Chapter_01.indd Page 32 27/08/18 9:39 PM
How to win in Africa
Set a clear aspiration for growth
Prioritize the markets that matter most
De�ne how you’ll achieve scale and relevance
Build the ecosystem you need to thrive
Map your Africastrategy4 navigation tools:
Innovate yourbusiness model4 innovation practices:
Build vocational skills for frontline workers
Create robust processes to grow talent from within
Harness the power of inclusion—particularly women’s advancement
Unleash Africa’stalent3 talent imperatives:
Do wellby doing good
Solve Africa’s unmet needs to drive
pro�table,sustainable
growth
Take a long-term view—and ride out short-term volatility
Diversify to build a balanced portfolio
Integrate up and down your value chain
Understand local context and engage with governments
Build resiliencefor the long term4 cornerstones:
Create products and services that ful�ll Africa’s unmet needs
Rethink your business model to truly engage with customers
Get lean to drive down cost and price points
Harness technology to unleash the next wave of innovation
FIGURE 1-5
8

Chapter_02.indd Page 39 29/08/18 12:41 AM
Megatrends create big opportunities for business
In our Africa business survey, digitization, consumer, and infrastructurestand out.
What trends and/or forces do you expect to be the biggest growthopportunities in Africa over the next 20 years?* % of respondents,n = 792
Source: McKinsey Insights executive survey on business in Africa, 2017.
Increasing adoption of mobile and/or digital technologies
Growing demand for basic services (e.g., education, health care)
Demand for new or improved infrastructure
Rise in consumer spending
Rapid urbanization
Africa’s growing workforce
Increasing use of renewable energy
Potential to increase agricultural production
Abundance of mineral resources
Rise in spending by businesses
*Respondents who answered “other” or “don’t know/not applicable” are not shown.Question was asked only of respondents who said they have been to at least one countryin Africa, for either personal or business reasons, and who said 5 percent or more of theirorganizations’ current revenue is earned in Africa.
38
37
37
35
29
19
19
18
16
12
FIGURE 2-1
9

Chapter_02.indd Page 42 29/11/18 2:03 PM
Africa’s cities are growing rapidly
African cities by population,millions of people
African cities bypopulation, number
Source: United Nations World Population Prospect, June 2014 revision, UN populationdivision; MGI Cityscope; McKinsey Global Institute analysis.
1+ million
2015
546
3
2030 2015 2030
2015 2030
5+ million
10+ million
89
17
*Greater Johannesburg includes the City of Johannesburg, Ekurhuleni, and the West Rand.
5
Alexandria
20302015
Cairo
KhartoumKano
DakarOuagadougou
Abidjan
Bamako
Lagos
Kinshasa
Yaoundé
Ibadan
Luanda
Nairobi
Addis Ababa
Antananarivo
GreaterJohannesburg*
5 million–10 million
>10 million
FIGURE 2-2
10
Chapter_02.indd Page 51 29/08/18 12:41 AM
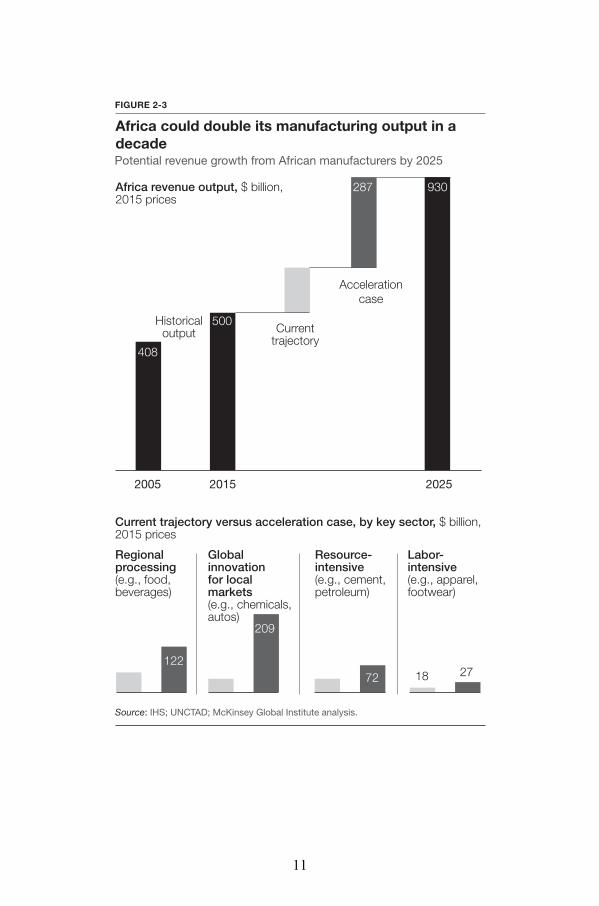
Africa could double its manufacturing output in adecadePotential revenue growth from African manufacturers by 2025
Africa revenue output, $ billion,2015 prices
Current trajectory versus acceleration case, by key sector, $ billion,2015 prices
Source: IHS; UNCTAD; McKinsey Global Institute analysis.
2005
143
53 36 3618 27
2015 2025
Current trajectory
Historicaloutput
Accelerationcase
287
122
209
72
930
Regionalprocessing(e.g., food, beverages)
Globalinnovationfor local markets(e.g., chemicals, autos)
Resource-intensive(e.g., cement, petroleum)
Labor-intensive(e.g., apparel, footwear)
408
500
FIGURE 2-3
11

Chapter_02.indd Page 59 29/08/18 12:41 AM
4.1x
Most African countries lag other emerging marketsin infrastructure
Africa SouthAfrica
Egypt Algeria Ghana Kenya Nigeria Ethiopia BRIC*
Electric power consumption, kilowatt hours per person
Source: World Bank, World Development Indicators Database; CIA, World Factbook.
*Brazil, Russia, India, and China. Comparisons exclude Russia for roads and rail.
632
2,622
4,198
1,6581,356
355 167 144 70
1.5x
Africa SouthAfrica
Kenya Egypt Nigeria Ghana Algeria Ethiopia BRIC
Rail density, kilometers of track per square km
7.1
10.4
17.2
6.65.1
4.1 4.01.7
0.6
Africa SouthAfrica
Ghana Kenya Nigeria Egypt Ethiopia Algeria BRIC
Road density, kilometers of road per square km
97
485
613
459
277209
137100
48
5.0x
FIGURE 2-4
12

Chapter_02.indd Page 78 29/08/18 12:41 AM
FIGURE 2-5
East Asiaand Pacific
Latin Americaand Caribbean
1Active for 90 days.2Age 15 or over.
Source: GSMA Mobile Money Deployment Tracker; GSMA State of Industry Report 2016;World Bank Global Findex.
Sub-Saharan Africa
SouthAsia
Europe andCentral Asia
Adults2 with mobile money account, 2017, %
Sub-Saharan Africa
SouthAsia
Middle Eastand N. Africa
East Asiaand Pacific
Latin Americaand Caribbean
Middle Eastand N. Africa
Europe andCentral Asia
Africa is the world leader in mobile money
Active1 mobile money accounts, 2017, million
20.9
121.9 86.3 18.3 11.5 7.2
4.2 5.8 1.3 3.2
1.7
5.3
13

Chapter_03.indd Page 84 27/08/18 10:33 PM
Africa is bigger than you think: it dwarfs China, India,Europe, and the United States
FIGURE 3-1
EuropeChina India ContinentalUnited States
Source: Kai Krause, “The True Size of Africa,” http://kai.sub.blue/images/True-Size-of-Africa-kk-v3.pdf.
China
Spain
BelgiumNetherlandsPortugal
United States EasternEurope
China Ireland
Italy
Switzerland
France
India
UK
Japan
Germany
India
14
Chapter_03.indd Page 87 27/08/18 10:33 PM
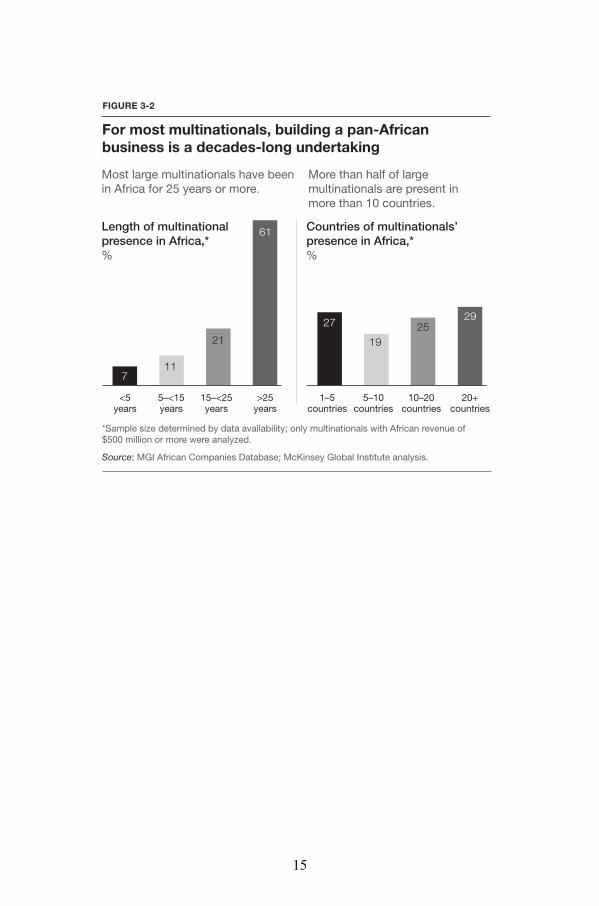
For most multinationals, building a pan-Africanbusiness is a decades-long undertaking
Most large multinationals have beenin Africa for 25 years or more.
More than half of largemultinationals are present inmore than 10 countries.
Length of multinationalpresence in Africa,*%
Countries of multinationals’presence in Africa,*%
<5years
5–<15years
15–<25years
>25years
Source: MGI African Companies Database; McKinsey Global Institute analysis.
*Sample size determined by data availability; only multinationals with African revenue of$500 million or more were analyzed.
711
21
61
1–5countries
5–10countries
10–20countries
20+countries
27
1925
29
FIGURE 3-2
15

Chapter_03.indd Page 97 27/08/18 10:33 PM
*Includes 15 countries in Central and West Africa; excludes North Africa and East Africa.
Consumption is growing much faster in some parts ofAfrica than others
Source: Oxford Economics: IHS; African Development Bank; McKinsey Global Institute analysis.
Total household consumption by region, %, $ billion, 2015 prices
826
9
1215
14
16
2005100% =910
13
14
9
16
26
9
13
2015
100% = 1,420
11
12 15
17
13
1022
2025
100% = 2,065
South Africa East Africa
Egypt
Nigeria
Franco-phoneAfrica*
Rest ofNorthAfrica
Rest of sub-SaharanAfrica
FIGURE 3-3
16

Chapter_04.indd Page 124 27/08/18 4:06 PM
High performers2 All others3
High-performing firms put technology at the heart oftheir Africa growth strategyQuestion: Which technologies will most support your organization’sgrowth in Africa in the next five years?1 % of respondents
1Respondents who answered “other” or “don’t know” are not shown.2Respondents in high-performing companies, n = 166.3Respondents in all other companies n = 603.
Applications on mobile computing devices
Social mediatools
Big dataand analytics
The internetof things
Self-service websites and/or portals
Cloudcomputing
Artificial intelligenceand machine learning
Blockchain
2439
1534
2331
1729
1619
1618
415
512
38Autonomousvehicles
Source: McKinsey Insights executive survey on business in Africa, 2017.
FIGURE 4-1
17

Chapter_05.indd Page 142 25/08/18 3:27 PM
McKinsey’s African Stability Index pinpointscountries’ growth and risk profiles1
Comparison of historical GDP growth rates to country stabilityrankings2
Real GDPgrowth,2012–17% CAGR3
Relative stability ranking 2017
Source: McKinsey Global Institute analysis.
1The index covers 30 economies accounting for 97% of Africa’s GDP.2Bubble size represents country GDP estimate, 2016.3Compound annual growth rate.4Equatorial Guinea and Libya are plotted manually because of negative growthrates over this period.
10
8
6
2
00 8 16 24 32
Vulnerable growers make up 33% of Africa’s GDP
Stable growersmake up 31%
Slow growers make up 36%
Vulnerable
Low
High
Stable
Low
High
4
South Africa
Egypt
AlgeriaAngola
Morocco
GLOBAL
Sudan
Kenya
Tanzania
Tunisia
Democratic Republic ofCongo
GhanaCameroon
Côte d’Ivoire
Uganda
Zambia
Ethiopia
Botswana
Mozambique
Gabon
Senegal
Namibia
Burkina Faso
Mauritius
Mali
Madagascar
Rwanda
Libya4 EquatorialGuinea4
Togo
Nigeria
FIGURE 5-1
18
Chapter_05.indd Page 145 25/08/18 3:27 PM
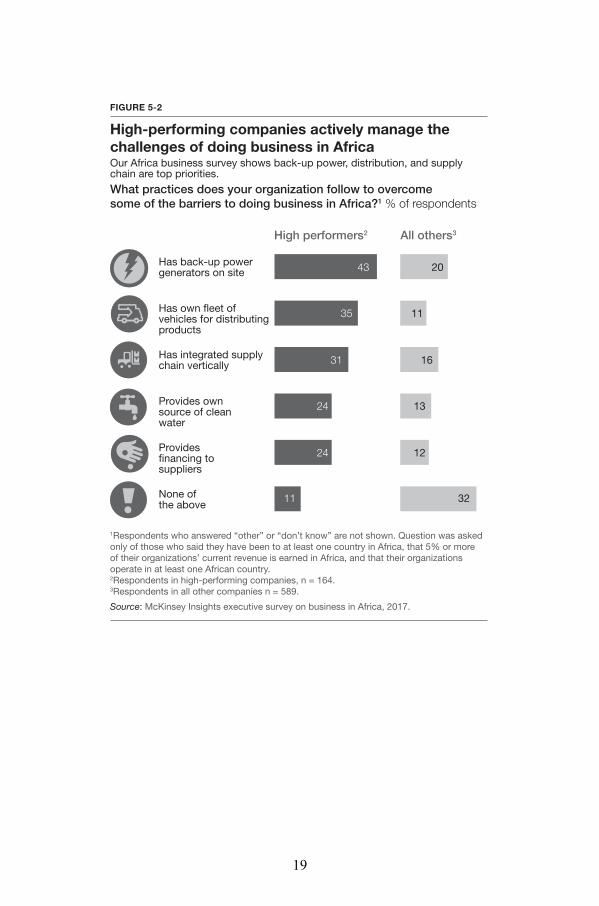
High performers2 All others3
High-performing companies actively manage thechallenges of doing business in Africa
Source: McKinsey Insights executive survey on business in Africa, 2017.
What practices does your organization follow to overcomesome of the barriers to doing business in Africa?1 % of respondents
1Respondents who answered “other” or “don’t know” are not shown. Question was askedonly of those who said they have been to at least one country in Africa, that 5% or moreof their organizations’ current revenue is earned in Africa, and that their organizationsoperate in at least one African country.2Respondents in high-performing companies, n = 164.3Respondents in all other companies n = 589.
Has back-up power generators on site
Our Africa business survey shows back-up power, distribution, and supply chain are top priorities.
Has own fleet of vehicles for distributing products
Has integrated supply chain vertically
Provides own source of clean water
Provides financing to suppliers
None of the above
43 20
35 11
31 16
24 13
24 12
11 32
FIGURE 5-2
19
Chapter_06.indd Page 159 27/08/18 3:48 PM
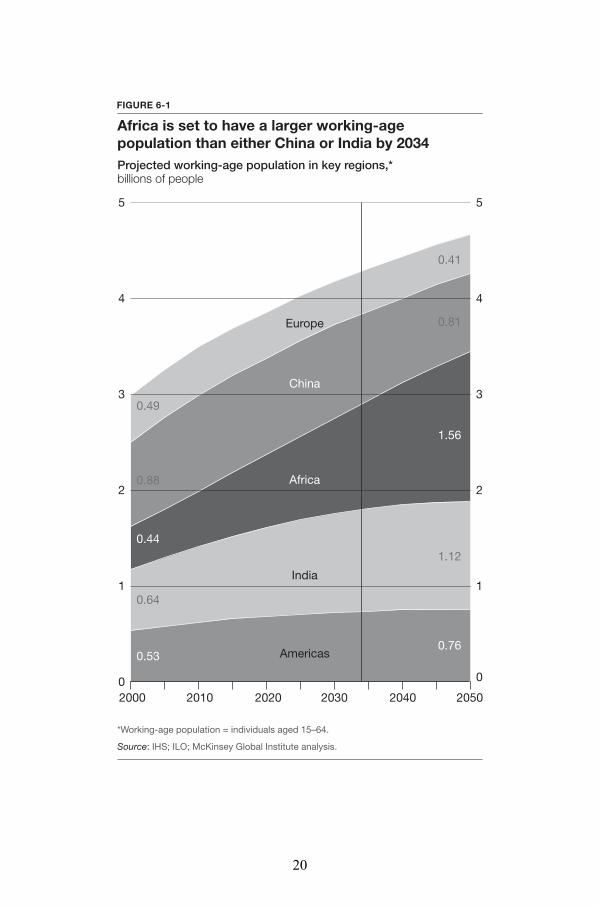
Africa is set to have a larger working-agepopulation than either China or India by 2034
Source: IHS; ILO; McKinsey Global Institute analysis.
Projected working-age population in key regions,*billions of people
*Working-age population = individuals aged 15–64.
0
1
2
3
4
5
0
2000 2010 2020 2030 2040 2050
1
2
3
4
5
Europe
India
Americas
China
Africa
0.53
0.64
0.44
0.88
0.49
0.76
1.12
1.56
0.81
0.41
FIGURE 6-1
20

Chapter_06.indd Page 163 27/08/18 3:48 PM
Africans’ enrollment in tertiary and vocationaleducation is low compared with other regions
Students in secondary education enrolled in vocational programsin African countries, %
Students in secondary education enrolled in vocational programsby region, %
Source: World Bank education indicators; McKinsey Global Institute analysis.
Egypt 22 Rwanda 14 Algeria 8 S. Africa 7
East Asiaand Pacific 18
OECD17
Latin America andthe Caribbean 10
SouthernAsia 1
Africa 8
Students enrolled in tertiary education by region, %
United States 89 Turkey 79 China 30 Africa 12India 25
Morocco 6
FIGURE 6-2
21

Chapter_06.indd Page 168 27/08/18 3:48 PM
High performers2 All others3
High-performing companies are investing heavily indeveloping local talent
Source: McKinsey Insights executive survey on business in Africa, 2017.
What practices does your organization use to source and developtalent in Africa?1 % of respondents
1Respondents who answered “other” or “don’t know” are not shown. Question was askedonly of those who said they have been to at least one country in Africa, that 5% or more oftheir organizations’ current revenue is earned in Africa, and that their organizations operatein at least one African country.2Respondents in high-performing companies, n = 166.3Respondents in all other companies n = 603.
Runs training programs within workforce
Offers internship or apprenticeship programs
Partners with local universities
Brings in employees from offices in other countries
Seeks out talent working for local competitors
Runs programs to support women’s careers
None of the above
Partners with others to run vocational training
4061
3046
1942
3335
1630
1529
1722
283
FIGURE 6-3
Our Africa business survey underlines the importance of training andapprenticeship.
22

Chapter_06.indd Page 173 27/08/18 3:48 PM
A link between gender diversity and profitmargins creates a sound business case for women’s advancement
Women’s representation on the ExCos of African companiesversus EBIT margin deviation from industry average.3
Diversity and EBIT by business quartile,2 %
Representation and EBIT by business quartile, %
Women EBIT
QUARTILE 1
1Earnings before interest and taxes.2A quartile is defined as each of four equal groups into which a population can bedivided according to the distribution of values of a particular variable.Total number of companies in sample = 210. 32010 to 2014; GSMA Mobile Money Deployment Tracker.
Source: Orbis database, 2014; company annual reports and websites.
31
20
Women EBIT
QUARTILE 2
18
2
Women Women
EBIT
QUARTILE 3
9
–6
EBIT
QUARTILE 4
0
–17
Women EBIT
QUARTILE 1
33
14
Women EBIT
QUARTILE 2
17
6
Women Women
EBIT
QUARTILE 3
9
–1
EBIT
QUARTILE 4
1
–18
FIGURE 6-4
Women’s representation on the boards of African companiesversus EBIT1 margin deviation from industry average.
23