afcrl-65- 358 compendium of measured … · compendium of measured rheo-optical properties of hysol...
TRANSCRIPT

AFCRL-65- 358
CO
<
i
COMPENDIUM OF MEASURED RHEO-OPTICAL PROPERTIES OF HYSOL 4485
Ker C. Thomson, Editor
TRUSTEES OF BOSTON COLLEGE Chestnut Hill, Mass. 02167
Contract AF19(628)-212
Scientific Report No. 1
March 1965
Project 8652
Task 865205
Hi ■% m
¥, ^ ^ ^ K
! 6^- €^3
O :
«»
o , - ^J
DDC
H JUN2 2I965
Wk (STEITO El DDCIRA E
I t
Prepared for
AIR FORCE CAMBRIDGE RESEARCH LABORATORIES OFFICE OF AEROSPACE RESEARCH
UNITED STATES AIR FORCE BEDFORD, MASSACHUSETTS
WORK SPONSORED BY ADVANCED RESEARCH PROJECTS AGENCY
PROJECT VELA-UNIFORM
ARPA ORDER NO. 292
Project Code No. 8100 Task 2
\.\J\ZJ

BEST AVAILABLE COPY

Requests for additional copies by Agencies of the Department of Defense, their contractors, and other government agencies should be directed to the:
Defense Documentation Center Cameron Station Alexandria, Virginia 22314
Department of Defense contractors must be estab- lished for DDC services, or have their need-to-know' certified by the cognisant military agency of their project or contract.
All other persons ana organizations should apply to the;
Clearinghouse for Federal Scientific and Technical Information (CFSTI)
Sills Building 5185 Port Royal Road Springfield, Virginia 22151

AFCRL-65~358 WEHTON OHSERVATORY
I ^
COMPENDIUM OF MEASURED RHEO-OPTICAL PROPERTIES OF HYSOL 4485
Ker C. Thomson, Editor
TRUSTEES OF BOSTON COLLEGE Chestnut Hill, Mass. 02167
Contract AF19(628)-212
Scientific Report No. 1
March 1965
Project 8652
Task 865205
Prepared for
AIR FORCE CAMBRIDGE RESEARCH LABORATORIES OFFICE OF AEROSPACE RESEARCH
UNITED STATES AIR FORCE BEDFORD, MASSACHUSETTS
WORK SPONSORED BY ADVANCED RESEARCH PROJECTS AGENCY
PROJECT VELA-UNIFORM
ARPA ORDER NO. 292
Project Code No. 8100 Task 2

WKHTOiN OHHKRVATORY
ABSTRACT
A measuring program was conducted with the aim of determin-
ing the complete rheo-optical characterization of a certain urethane
rubber compound (HYSOL 4485) suitable for dynamic photo-visco-
elastic studies. The shift curve and the master curve at 60oF
are presented for both the Shear Storage Mcdulus and the Shear
Loss Tangent. In determining the shear properties sinusoidal load-
ing of speci.iiens cut as hollow cylinders was used. Using a method
designed originally oy Selway and Brown the dynamic stress optic
coefficient and the complex Youngs Modulus were measured at room
temperature. The following tests were conducted in an atmosphere
maintained at 70oF and 407« R.H. Youngs Modulus in creep was meas-
ured at two stress levels: 20.0 and 41.7 p.s.i. Dynamic stress-
strain curves were determined using Volterra pendulum tests at
two initial velocities 7.02 and 65.5 inches per second; and the
static and dynamic stress optic coefficients were measured.
iii

WKSTON OBSERVATORY
CONTENTS
INTRODUCTION by K. C. Thomson I
MEASUREMENT OF THE DYNAMIC SHEAR MODULUS OF HYSOL 4485 AS A FUNCTION OF FREQUENCY AND TEMPERATURE oy J. H. Baltrukonis and
D. S. Blomquist Catholic University of America 5
DETERMINATION OF THE DYNAMIC YOUNGS MODULUS AND STRESS OPTIC COEFFICIENT OF HYSOL 4485 by D. M. Cunningham
G. W. Brown and C. V. Johnson
University of California 30
DETERMINA1ION OF STATIC AND DYNAMIC PROPERTIES OF HYSOL 4485 by J. Vieira and W. F. Riley
Armour Research Foundation 48
iv
■MT1

WEHTON ( mSEHVATORY
LIST OF FIGURES
Figure No.
1(a) Amplitude and Phase Response of HYSOL 4435 at 7.2 F. 14
1(b) Amplitude and Phase Response of HYSOL 4485 at 20oF. 15
1(c) Amplitude and Phase Response of HYSOL 4485 at 260F. 16
1(d) Amplitude and Phase Response of HYSOL 4485 at 30oF. 17
1(e) Amplitude and Phase Response of HYSOL 4485 at 350F. 18
1(f) Amplitude and Phase Response of HYSOL 4485 at 40oF. 19
1(g) Amplitude and Phase Response of HYSOL 4485 at 480F. 20
1(h) Amplitude and Phase Response of HYSOL 4485 at 60oF. 21
l(i) Amplitude and Phase Response of HYSOL 4485 at 70oF. 22
2 Shear Storage Modulus vs. Frequency for HYSOL 4485. 23
3 Master Curve for Shear Storage Modulus of HYSOL 4485. 24
4 Shift Factor as a Function of Temperature for HYSOL 4485. 25
5 Master Curve for Shear Loss Tangent of HYSOL 4485. 26
I

WEHTON OBSERVATORY
Figure No.
LIST OF FIGDRES (Cont'd)
Pa^e
6 Effect of Length on Shear Modulus 27
7 Influence of Noise on Signal when Measured by a True R.M.S. Circuit 28
8 Various Circuits in the Data Acquisition System. 29
9 Test Specimen. 39
10 Theoretical and Experimental Displacement and Phase Angles for the Second Resonant Frequency. 40
11 Theoretical and Experimental Displacement and Phase Angles for the Third Resonant Frequency. 41
12 Theoretical and Experimental Displacement and Phase Angles for the Fourth Resonant Frequency. 42
13 Theoretical and Experimental Displacement and Phase Angles for the Fifth Resonant Frequency. 43
14 Experimental Fringe Orders for the First and Third Resonant Frequencies. 44
15 Experimental Fringe Orders for the Second Resonant Frequency. 45
16 Experimental Fringe Orders for the Fourth and Fifth Resonant Freqtiencies. 46
17 Mechanical and Optical Frequency Response of HYSOL 4485 from 0 to 650 C.P.S. 47
18 Plot of tfnax versus Fringe Order n for a Disk of HYSOL 4485 Subjected to a Diametral Load. 51
19 Curves Showing the Creep of HYSOL 4485 at a Stress Level of 19.96 psi. 53
vi

WESTON < )B8ERVATORY
LIST OF FIGURES (Cont'd) Figure
No. Page
20 Curves Showing the Creep of HYSOL 4485 at a Stress Level of 41.68 psi. 54
21 Dyn^ic Stress-Strain Curve for HYSOL 4485 at a Loading Rate of 7.02 in/sec. 56
22 Dynamic Stress-Strain Curve for HYSOL 4485 at a Loading Rate of 65.5 in/sec. 57
23 Fringe Order as a Function of Time for HYSOL 4485 Impacted at a velocity of 7.02 in/sec. 59
24 Modulus of Elasticity of HYSOL 4485 as a Function of Frequency of Loading. 61
25 Shear Modulus of HYSOL 4485 as a Function of Frequency of Loading. 62
vii

WESTON OBSERVATORY
LIST OF TABLES
Table No. Page
I Data for Static Photoelastic Stress Fringe Value Determination 63
II Creep Data for 20 psi Study 64
III C^-eep Data for 41.7 psi Study 65
IV Volterra Pendulum Study - V0 s 7.02 in/sec 66
V Volterra Pendulum Study - V0 = 65.5 in/sec 67
VI Sinusoidal Response Tests-Shear Modulus Determinations 68
VII Sinusoidal Response Test - Modulus of Elasticity Determination 69
viii
nesn

VVESTON OBSEHVATOHY
INTRODUCTION
At Cambridge Research Laboratories an optical technique for
following stress w&ve propagation in large transparent sheets has
been developed. The apparatus used is similar to the strobo-
elistic equipment developed by Becker (1) (see also Thomson (2).
It differs from his in using models increased in size by an order
of magnitude and with the time length of the source fun-tion shor-
tened so that the spactal length of the wave packet produced is
less than the smallest dimension of the model and propag3*;ion of
the entire wave can be observed, as discussed in Thomson and Hill
(3). Behind this interest lies the hope that the technique can
be used to model seismic problems of interest. It offers the
advantage over conventional electronic transducer techniques that
not only is the action viewed at particular points as a function
of time it is also viewed throughout all of space and time where-
ever the wave packet exists. With a continuously variable phase
relationship between striking and flashing the operator is able
to study the wave as it propagates and then "lock" on the view-
ing screen any particular phase of the action of special interest
and photograph it. Before the technique can be "tailored'" to
fit particular problems in seismology it is necessary (in most
cases) to have quantitative knowledge of the physical properties
of both the prototype and the model. This compendium is concerned
with the latter problem only.
i j

WESTON OBSERVATORY
The prooerties which are of Interest for a particular material
are the stress and strain optic coefficients, and any two elastic
moduli. Earth materials show properties which are strain rate
dependent so the coefficients and moduli mentioned above should
actually be measured as functions of frequency or time. Another
requirement on materials for optica'", modelling by means of the
repetitive technique is extreme optical sensitivity and low modulus.
The high optical sensitivity is required to enable the stress in
the model to be quantitatively measured at points where it has
dropped to low levels. Low modulus is an advantage as it implies
low wave speed and hence less blurring of the isochromatic fringes
as they propagate under stroboscopic illumination. Unfortunately
most materials which have these characteristics are also temper-
ature sensitive. It is desirable then to measure the stress optic
coefficient, strain optic coefficient and a pair of elastic moduli
as function of both frequency and temperature.
On reference to the literature one suitable material would
appear to be HYSOL 4485. This is a Urethane rubber compound
identified as HYSOL 8705 in older papers published prior to the
product number change by the Hysol Corporation. The manufacturers
specifications i aicate high optical sensitivity, low elastic
modulus and availability in convenient sheets, thus eliminating
the user casting operations associated with many other similar
product.. In addition strain rate dependent physical properties
had been measured for this material in previous studies. This

WESTON OBSERVATORY
suggested viscoelasticity which was of particular interest,
because one of the first seismic modelling problems proposed
for the optical modelling technique was Lambs two dimensional
problem for a visco-elas^ic half space.
A considerable volume of literature exists on the visco-
elastic properties of this material. However, on consideration
of these published observations, and the assumptions inherent
in making them and reducing the resulfs, and the use to which
the data was to be put, it became apparent that so»ie inadequacies
existed. Previous experimeiters have measured ioungs Modulus
(in creep, relaxation, at consta.it strain rate, sinusoidally or
with Dal1istic pendula techniques) and have assumed incompresa-
ibility (i.e., infinite bulk modulus or Poissor.s ratio about
1/2) in order to complete the presentation of the two functions
required for entire specification of the mechanical properties
of any linearly visco-elastic Isotropie material. Attempts to
estimate Poissons ratio from published data suggested that this
ratio was close to 1/2 at very low (creep) frequencies, but that
at higher frequencies it might drop to much lower vulues in possible
violation of the assumptions usually made about it. In order to
provide further experimental Information for specifying the some-
what elusive physical properties of this material, the measuring
pro ram outlined in the following pages was undertaken.
*i

WE8TON OBSERVATORY
Catholic University of America measured the shear modulus
as a function of temperature and frequency by means of dynamic
torsional equipment enclosed in an environmental chamber. The
University of California Institute of Engineering Research meas-
ured the dynamic elastic modulus and dynamic stress optic co-
efficient as functions of frequency. Armour Research Foundation
performed creep tests at two stress steps, Volterra pendulum
tests at two initial velocities, and measured the static stress
optic coefficient, the complex Youngs Modulus and the complex
shear modulus in the frequency interval 100-700 c.p.s. Armour's
measurements were all conducted at 70oF and 40?» relative humidity.
All of the tasks described in this compendium were per-
formed as subcontracts under Air Force Contract AF19(628)-212
with Boston College, Chastnut Hill, Mass.

WESTON OBSKRVATORY
MEASUREMENT OF THE DYNAMIC SHEAR MODULUS OF HYSOL 4485 AS
A FUNCTION OF FREQUENCY AND TEMPERATURE
This report presents the results of the measurement of
the shear storage modulus C and shear loss tangent C'/G' of
HYSOL 4485 supplied by Weston Observatory, Weston, Mass.
A detailed description of the experimental system and
data reduction technique is included in Reference (4). We
shall report herein recent improvements in the experimental
system and the results of these particular measurements, includ-
ing length studies and error analysis. The test is based on
the torsional oscillations of a circular cylindrical sample of
finite length. For these particular tests the specimen was
hollow with dimensions of 1.000 inches outside diameter, 0.500
inches inside diameter by 0.500 inches in length. The measure-
ments reported herein are the results of three runs at selected
temperatures. The data reduction procedure is descrioed in
detail in Reference (4) wherein there is a Fortran listing of
the data reduction computer program.
The results of the measurements are shown in Figs. 1(a)
through l(i), inclusive. Raw data collected at 12 deg. F.,
^^^^•-^"^JP

VVKSTON OBSERVATORY
20 deg. F., 26 de3. F., 26 deg. F., 30 deg. F., 35 deg. F.,
40 deg. F., 48 deg. F., 60 deg. F., and 70 deg. F. are shown
in Figs. 1. The data were plotted and the average curves rep-
resenting the amplitude and phase responses were passed through
the data points as shown. The data for the data reduction pro-
cedure were obtained from these average curves. The reduced
data for the shear modulus are shown in Fig. 2.
Among all materials that satisfy approximately linear visco-
elastic laws at uniform temperature are a group which exhibit
a particularly simple property with change of temperature. This
is a translational shift - no change in shape - of the shear
storage modulus plotted against the logarithm of frequency at
different uniform temperatures. This property leads to an equiv-
alence relation oetween temperature and the log^Q of frequency
which was originally proposed by Leadermann (5) and which has
been called the time-temperature shifting principle. This same
postulate was introduced in a slightly different form by Ferry
(6) and materials exhibiting such behavior have been termed
"thermorheologically simple" by Schwarzl and Staverman (7).
The postulate has been confirmed experimentally for a variety
of visco-elastic materials. It was first applied to expeririental
data in an explicit numerical fashion by Tobolsky and his co-
workers (8). They introduced a shift function and modif. -i the

WESTON OBSERVATORY
shifting principle to account for the proportionality of the
modulus to absolute temperature. Thus, the analytical state-
ment of the time-temperature shifting principle is given by
1 GfCf) - mi*) T T0 o
wherein f denotes the frequency, T and T0 two different absolute
temperatures, G^ and G' the shear storage modulus at the two
different absolute temperatures in question and denotes the
'reduced frequency' given by
£ ■ f af
The shift factor a^ is defined in terms of a shift function
F(T) by means of
F(T) • log10 aj
The shift function F(T) at the absolute temperature T is the
actual amount of shifting required parallel to the log^Q f axis
in order to superimpose the data collected at the absolute tem-
perature T upon that collected at a reference absolute temper-
ature T0.
In Older to test whether or not the HYSOL 4485 sample under
investigation belongs to the class of thennorheologically simple

W ESTON OBSERVATORY
materials and in order to extend the frequency range of the
measurements, the shifting principle was applied to the shear
storage aiodulus data of Fig. 2. The master curve of Fig. 3
is the result. The reference temperature selected was 60 deg. F.
and the shift factor a^ required is plotted as a function of
temperature in Fig. 4.
Using this same shift factor, the master curve for the shear
loss tangent was constructed with the result shown in Fig. 5.
In this case the procedure was somewhat different. The data
reduction procedure yields the shear loss modulus G" as well as
the shear storage modulus G'. Their ratio constitutes the shear
loss tangent.
It is clear that the HYSOL 4485 sample is, indeed, therm-
rheologically simple. Therefore, we have, in effect, extended
the frequency range over which the measurements were made.
A hollow cylindrical sample of HYSOL 4485 was cast. The
cast sample had dimensions of 1.000 inches outside diameter and
0.500 inches inside diameter by 2.000 inches long. The sample
was bonded to two sample holders and tested. The sample was
then reduced in length to 1.500 inches and again tested. This
procedure was repeated for lengths of 1.000 and 0.500. The
results of this test is shown in Fig. 6, wherein the shear stor-
age modulus G1, is plotted for the lengths under investigation.
8

WKSTON OBSERVATORY
DATA ACQUISITION SYSTEM
The function of the data acquisition system is to measure
the accelerations of the input and output bell-cranks and the
phase angle between these accelerations together with the fre-
quency of the applied harmonic oscillations. In order to ac-
complish this purpose piezo-electric crystal accelerometers are
mounted on the two bell-cranks using electrically insulated studs.
The analog voltages are then impedance matched and amplified,
with a gain of ten, using a cathode follower circuit with an
integrated amplifier. The amplified voltages are used with the
automatic vibration exciter for frequency sweeping with auto-
matic level control. During the frequency sweep, the signal
from the input accelerometer is used with the vibration exciter
as a control voltage.
The analog signal from the output accelerometer is recorded
with a Level Recorder using True RMS detection. The frequency
calibrated axis of the Level Recorder can be syncronized with
the frequency of the oscillator thus offering exact amplitude-
frequency identification. This amplification ratio versus fre-
quency plot is used to establish the general nature of the
frequency response. Such information is extremely valuable
during actual testing.
The analog voltages from the two accelerometers ari alter-
nately measured using a frequency analyzer with True RMS detection.

VVRSTON OBSERVATORY
The frequency of the 6% filter in the analyzer is set using the
frequency determined from the previous frequency count. Filter-
ing minimizes extraneous harmonics and cable noise while using
the same analyzer for the two different signals reduces cali-
bration difficulties.
True RMS detection is used in order to minimize the effect
of perturbations of the signal caused by extraneous noise.
At all data points the feedback circuit in the selective
amplifier section of the Frequency Analyzer is switched so it
is rearranged, such that the Analyzer functions as a frequency
rejection amplifier. When set as a frequency r; jection amplifier
any frequency in the test range can oe attenuated by at least
bO db. With this operation a distortion and noise measurement
is obtained. The smallest signal-to-noise ratio acceptable in
this experiemtnt is 30 db. thus assuring a minimum of error, due
to noise, as shown in Fig.
In measuring the phase angle between the two accelerometer
signals we must be careful to account for any phase shifts that
are introduced into the system by the electronic circuitry. We
can avoid the difficulties in such an accounting by assurinr that
the phase shifts are the same in the individual accelerometer
read-out circuits. This function is accomplished by the phase
compensating circuit shown in Fig. 8(b). The voltage level of an
10
=■«■—= i tmm • ■ ii —^—

VVESTON OBSERVATORY
AC signal from the oscillator section of the automatic vibration
exciter control is reduced to the same voltage level as the
amplified accelerfmeter signals. This standard sigral is divided
and passed through th^ individual legs of the acceleroraeter read-
out circuitry which is ultimately used in data acquisition. The
pht.3e angle between the signals in the two legs is measured in
a counter. In general, this phase angle will not be zero oecause
of phase shifts introduced oy the electronic elements in each
leg. Now, one of the variaole filters is adjusted so that the
phase angle is zero, thus assuring that the phase shifts in the two
read-out circuits are identical.
Now, the standard signal from the oscillator is replaced by
the actual amplified accelerometer signals as shown in Fig. 8(c).
The gain of one or the other of the No. 2 amplifiers is
adjusted with an input potentiometer. Equalization is needed
because the counter is amplitude sensitive. Clearly, this gain
adjustment does not affect the phase relationship. The time in-
terval between corresponding points on the two sine waves is then
measured. Triggering circuitry is provided in the counter pre-
viously used for measuring frequency. This circuitry is voltage
dependent, and it is for this reason that the amplitude of the
two accelerometer signals is equalized. It is clear chat the
individual instruments in the phase measuring circuits can only
11

WKHT()N OBSERVATORY
introduce error into the phase angle measurement b> Uarnranic
distortion and not by their gain or attenuation as the amplitude
of the two accelerometer signals have been equalized.
For convenience in the calculation of phase angle the counter
is now switched to trigger at the same amplitude on succeed-
ing sine waves of the same signal. The measured period together
with the measured time interval is u^ed to calculate the phase
angle oetween the accelerometer signals.
ANALYSIS OF ERROR IN DATA ACQUISITION SYSTEM
The vibration control sub-system includes three main items
or equipment: an oscillator, a power control amplifier and two
electromagnetic vibrators. Since these three items are not used
directly in the determination of phase or amplitude measure-
ment we need only concern ourselves with harmonic distortion
and vibrator resonance. Harmonic distortion of the oscillator
and amplifier cotnDinatinn is 0.26% in the 20-2v000 cps range
at raaximam power output. The first resonance of the electromag-
netic vibrator is 3875 cps, well oeyond the 2,000 cps upper limit
of the investigation.
In this test we are only interested in relative movements,
the acceleration ratio between the upper and lower bell-cranks,
thus an absolute acceleration is not needed. A back-to-back
12

WE8TON OHSKRVATORY
calibration is performed on the two read-out acceleroraeters through-
out the frequency range under investigation prior to performing
each test. Such a test has found the acceleroraeters to have a
frequency response of -1/2% in the 20-2000 cps range and a phase
shift of such small magnitude that it cannot be read with a 6-
digit counter. Linearity studies have found the accelerometers
to have a linearity of -1% throughout the frequency raige of the
test.
The cathode follower and integrated amplifier have a distor-
tion of 0.497», linearity of 2.57o and phase shift between channel
of less than 1° throughout the test frequency range.
Since both legs of the phase measuring network are amplitude
equalized we need only concern o rselves with the harmonic dis-
tortion of each element. Harmonic distortion of the amplifiers
has been found to be 0.1%. Harmonic distortion of the filters
has been found to oe 0.68%,.
The accuracy of the counter, both in frequency and time
interval measurement is 1 part in 1000.
The single voltmeter used for measuring the amplitude of the
two accelerometer signals has an accuracy of 0.1%.
The specific equipment used in the data acquisition system
is described in Table 1.
13
i

WERTON OBSERVATORY
saoil?3p ui Q oxliuv ssuiy
Ui V) * o Q. V) UJ o: , . u.
4 UJ • W CVJ < ~
o ?»- iZ Q. 5
5 m 2 CO < ^r
^f UJ Q -I 3 O »~ w
^
2 u. < o
g U Ü
u.
A
6
i y 'otjv^ apniTt1^'

WESTON OBSERVATORY
sooaJop ui D aiiiuy ssBiy
UJ <n T o 0. (0 Ui . c u.
• UJ o «/) CM
A < X K 0. <
O O lO
u. Z 00 < ^r
^ u O -I -D O I- <n —. > «1 x 0. 2 u. < O
6 u m
Si

WESTON OHHEIWATORV
saüjCap ui O oxSuy osuiy
UJ w 2 O Q. (/) UJ a u:
0 s« X H
o 0. < mm
U- o m z 00 < ^j-
^r UJ O -J 3 O 1- <o — >-
2 u. < o
tn
U
{
V) o
u
c c
C:
Ü 'uiiirj spnjii^'

VV FRTv)N . >BQERVATORY
sjoj^op Li □ ox?uy osciy
— U.
o u > u
u
0 'ourH apmn^

WESTON OBSERVATORY
sooiJap ut D 3i?u\r os«q(}
C o fsl c
oc o
o c
ÜJ tn z o Q.
• tn UJ cr u;
* a
6 X i- u. a. <
Q in Z 00 < ^r
^r UJ O -1 3 O K (O
^
2 u. < O
T LSi
"T
-3
6 u
I Ü
u
c I cr
ü 'OTJBX apnjxxduiv

WE8TON OBSERVATOHY
sosa^ap UT Q oxSuy asciy
LO
T
g U o
a u
c
<M
0 'otji^i opran1^
r

WE8TON OBSERVATORY
saaiSap ui D ajSuv asvm
5 fSi fy
O c o
c o
o ÜL
6 u o V)
u & to o •—< u
c
I B
0 oijBy opnjTxauiv

WEHTON OBSERVATORY
saaiSap irr Q siSuv dsvi\d
o o o vO
iZ
o
o r-<
c cn
T3 O g
u o
c tfl r-
»-I
C • < c;
in o
i—(
c u u-. ^
0 _
C ■ r-i
^r
t c u C"
O c K! t-
rj
0 'oij^i apniilüJV i
1

VVfcJHTON rmSETTTTTTTTin
saoi^ap ut D »tSuy assty
u
»-
to o
i—•
u
c
(! 'oLau^i apn^n^w
— f—

WESTON OBSERVATORY
aa
o o a o a
OD
:<
o a («a x <! o o x <ace> o o x
aa a en <]oa ^»
0S 4 oo
^^ ®
— »j r • tl t^ rf rr -C «^
i i t i i il i :
oaoaoooox
,1 i i x
C c
c c
c c Ki
c
r c <r — ~ ~i cr r».
C c. c c c
c c — ■■" E c u c c
w W -^ c or t« > ^
» GO IT. </> ^r 4) 3 ^
o U J b- 3 -»
c r Q O "" o w
cr c c i^
c
L. S
TOR
AG
E
EN
CY
FOR
(M
2
SH
EA
R
FRE
QU
.>— u.
tsu ui sninjKj; OJLUüJS luoqs

VVUUToN (mSETtVXTUm
o o
o0<3 n
r-
LT,
•IN
x o
+ +
^J-; r-j
UJ
o C5 1-
w- (0 f—i
n cc . < tn
rH UJ 00 C O i ^r ^—
FOR
S S
OL
4
»
STE
R
CU
RV
E
DU
LUS
O
F H
Y
< O i-^
FIG
. 3
M
M
!- 1
n
CM r J
(UI/U (,l.'ol .'.M01^!
•»^w?^^^»

WEHTON OBBERVATORY
i 1
c
-.1 -- Terixiraturc, dcrireer. F.
FIG. 4 SHIFT FACTOR AS A FUNCTION OF TEMPERATURE FOR HYSOL 4485.

ie*r**!i-^*rw9¥rrm*r*rr*r
o
o o o o o
a a a
o o
o
o
a a
<] a 8
» DO
o <1
in
P-J X
H
CO
o
< to UJ 00
co ^
c
CE O
>
Ü
-J c <n >-
o
A
(T Z UJ UJ H O CO Z
oc rj
.O/..^ iua'dUEx ss-J]

VVEHTON OBSERVATORY
o o
o a<]0
o Q<X>
o GOO
CP 0 0 O D <3 0
CD 0 0 O <3 0
R) <1 0
O D<IO
O D 0 0 O GO
O DO O <3D
0
O 0 D 0
O D 0 0 • • •
l%j r-, f— O
1 F
c o
o r-
£»
u ü
Ü
u
c g
c *■ § CO
li X I- o z Ui
L.",
c C
U. OC0
•-3 u. o UJ S
(D
O LL
C.r») n>i

FIG. 7
WE8TON OBB.RVATORY
INFLUENCE OF NOISE ON SIGNAL WHEN
MEASURED BY A TRUE RMS. CffTCUIT
SO —
20—
IE O
UJ
ro—
i
0—' 3C 20 10
SIGNAL/NOISE RATIO
ODB
S»—' ■ mm

W'ESTON OBSERVATORY
r.cceleroTCtor
cathode follower and amplifier
a, .Arolitude Measuring Circuit
oscillator
filters counter
b. Phase Cormensating Circuit
acceleronetors filters counter
c. 're^ucncy and Phase 'ieasurin: Circuit in ^.erational iodc
FIG. 8 VARIOUS CIRCUITS IN THE DATA ACQUISITION SYSTEM.

WESTON OBSERVATORY
DETERMINATION OF THE DYNAMIC YOUNGS MODULUS AND
STRESS OPTIC COEFFICIENT OF HY30L 4485
I. Theory
The theory used in this report was that for the longi-
tudinal vibration of a one-dimensional linearly visco-elastic
column excited sinusoidally at one end. There was no deviation
from the solution of Brown and Selway (S) for the equation of
CD
motion
a<r m a U
6 x p. t2
where o z the longitudinal stress
x M the longitudinal displacement
p = the mass density
u = the particle displacement
t - time
On the assumption that HYSOL 4485 is a linearly visco-elastic
material, the stress-strain law for sinusoidally varying
stresses is
g - E,v e i^ (2)
where E'v ■ the dynamic elastic modulus
^ = the phase angle Dy which strain lags stress
30

WE8TON OBSERVATORY
Now the linear visco-elastic equation of motion is
4 x2 c2 a t: (3)
where c •/ E* ■i- P From the solution of equation (3), Brown and Selway obtain
_ o p z /. tan
and
1 f J sinh"1 /__L_) |, in. 1,2,3 (4) |(2m-l)Tr (uo/J
Z'-u L cos c ■
(~?~) , m « I, 2, 3, (5)
(2m-l) rr
where M r mode number
U^ - the driven end displacement amplitude
U0 ■ the free end displacement amplitude
L ■ total length of the specimen
r s a resonant frequency corresponding to m ■ 1, 2, 3, etc.
Equations (4) and (5) were used to calculate f and c from
measured values of UL/U at resonance. The dynamic modulus was
then calculated from
E* = p c2 (6)
II. Stress Equatior.
The displacement expression (solution of equation (3) )
was differentiated with respect to x to obtain the s;rain ex-
pression. The strain expression was substituted into the stress-
31

VVESTON OBSERVATORY
strain law, Eq. (2), to obtain the stress expression
At resonance, we only deal with the amplitude of this expression
and then
4
'7)
Ü,
U,
i i (8)
and
r(x)
6 (x)
= s: in( -i-cos «) cosh (-*sin i ) c z c 2
- cos(-2L- cos «) sinh ( -iL^in 5)
(S)
III. Optical Frequency Response
The dynamic stress optic coefficient, F*, was determined by
taking the ratio of the stress amplitude at the driven end to the
maximum fringe value at the driven end at resonance, or
F* - U^ [r(L)j2 f f6 (L)] (10)
IV. Apparatus and Procedure
Test Specimen
The HYSOL 4A85 specimen used was of dimensions 1/2" x 3/4"
x 10'-, longer and thicker than the one used by Brown and Selway
(6). Twenty-two stations were established with an opaque
black ink coating on all of the odd-numbered space and coverine.
32

WE8TON OBSERVATORY
halt ot the specimen width. A 1/2 x 3/4 x 3/4 epcxv head was
bonded tc tha upper end of the specimen with Eastman 910 cement.
An iron-constantan thermocouple was included in a slight central
depression of the interface for monitoring the specimen tem-
perature.
Birefringence and Displacement Recording Equipment
The physical arrangement of the equipment was identical
with that used oy Brown and Selway (o) with four exceptions:
(a) the light source was replaced by a Spectra Physics Model
130 continuous wave 6"28A laser; (b) quarter wave plates ad-
justed to 6328A were used; (c) a kronhite filter, model 350-A,
was inserted between the photoraultiplier tube and the oscillo-
scope to eliminate troublesome noise, and; (e) no additional
optical components were used. It JLS interesting to note that
the red laser beam resulted in an output of the EMI 95365 photo-
multiplier tube two orders of magnitude greater than that
obtained with the previous green light source. Since only one
laser was available and because it was Impractical to split the
3 millimeter beam into two parts, two series of tests were run;
one for the displacement data and one for the birefringence data.
The Tardy method of rotating the analyzer to obtain max-
imum or minimum light transmission, with the polarizer parallel
i
33

vvggrro nsBEffrAI'üTO
to the principal stress direction, was used to evaluate frac-
tional order fringes.
The phase angle | between the displacement at any point
and the displacement at the driven end was found by referring
the photoraultiplier output to the shaker acceleroraeter, after
inverting the sign of the accelerometer signal.
The phase angle, ^, between stress and strain was calculated
from the experimental values of UL/U0.
The static value of the stress optic coefficient, F, was
determined by applying incremental weights of 0.1 pound, or 0.2b7
p.s.i., and noting the fractional fringe order using the laser
and a vacuum tuoe voltmeter. The time elapsed was one minute
per load increment. Strain was noted on an N-type SR-4 strain
indicator as measured by two very flexible clip gages. These
U-shaped clip gages were hard phosphor bronze and measured 0.020"
thick x 0.30n wide x 2.0" long and stood 1-1/2" from each side
of the HYSOL 4485 specimen. The ends of the clip gages were
bonded to the 1/2" x 3/4" x 6" specimen with Eastman 910 cement
by means of a 0.020" x 3/16" x 3/4" foot. Negligible force was
carried by the clip gage in comparison to that supported by the
specimen. A tension and compression foil resistance strain gage
on each side of the "pure bending" section of each clip gage
constituted the four legs of a Wheatstone bridge.
34

WRSTON OBSERVATORY
V. Results and Discussion
The mechanical behavior of HYSOL A485 was found to be quite
sensitive to a change in temperature. The thermocouple in the
interface between the polyurethane specimen and the epoxy holder
indicated a range of temperatures from 790F to 840F during the
recording of the displacement data. Consistent, smooth displace-
ment curves were obtained. An interface temperature variation
from 8D0F to 103oF was recorded during the recording of photo-
elastic data. Since room temperature did not exceed 90oF, the
high specimen temperature recorded during the fourth and fifth
mode vibration was probably a resulL of using a higher input
power level in order to delineate the low order fringes. The
jump in fringe constant between the third and fourth mode (figure
17) may be attributable to the jump in temperature.
Resonant Frequencies
A determination was made of the experimental phase angle
between driven end and free end displacements (f T) as a function
of frequency. The 'resonant'" frequencies at which this angle was
90°, 270°, 450°, o30o, and 810° constituted the first five res-
onant modes and they occurred at 41, 199, 3A5, 500 and b38 cycles
per second.
Experimental and Theoretical Displacement Data
Figures 10andl3show the experimental (points) and theo-
retical (curves) displacement amplitudes and phase angles for
35

WESTC )N OBSERVATORY
the second to the fifth resonant frequencies. A very close
proximity between the fundamental longitudinal mode and one
of the higher bending modes made it impossible to obtain stable
displacement data at 41 cycles per second. Agreement is gener-
ally good for the other modes. Discrepancies or lack of data
at some locations on the specimen were caused by coupling be-
tween the sometimes present bending mode and the longitudinal
mode. Wave theory indicates that as the frequency increases,
and the wave length decreases, the one-dimensional theory used
here will break down. However, at frequencies up to 638 cycles
per second, this effect was not obser ed. It would therefore
seem that the one-dimensional theory is adequate for the current
response of HYSOL 4485 of dimensions 1/2 x 3/4 x 10" in the
frequency range up to 638 cycles per second.
Experimental Isochromatic Data
The experimental stress fringes are shown in figures 14 to
16 as a function of X/L for the five resonant modes. An upper
and lower set of data are shown; the upper set corresponds to
rotating the analyzer clockwise and the lower set counterclock-
wise. The average of the two sets was taken as the true datum.
No theoretical fringes were predicted since this calculation would
only verify, by a correspondence between the theoretical and
experimental fringes, that we were dealing with a linear visco-
36
WESTON < )H8ERVATORY
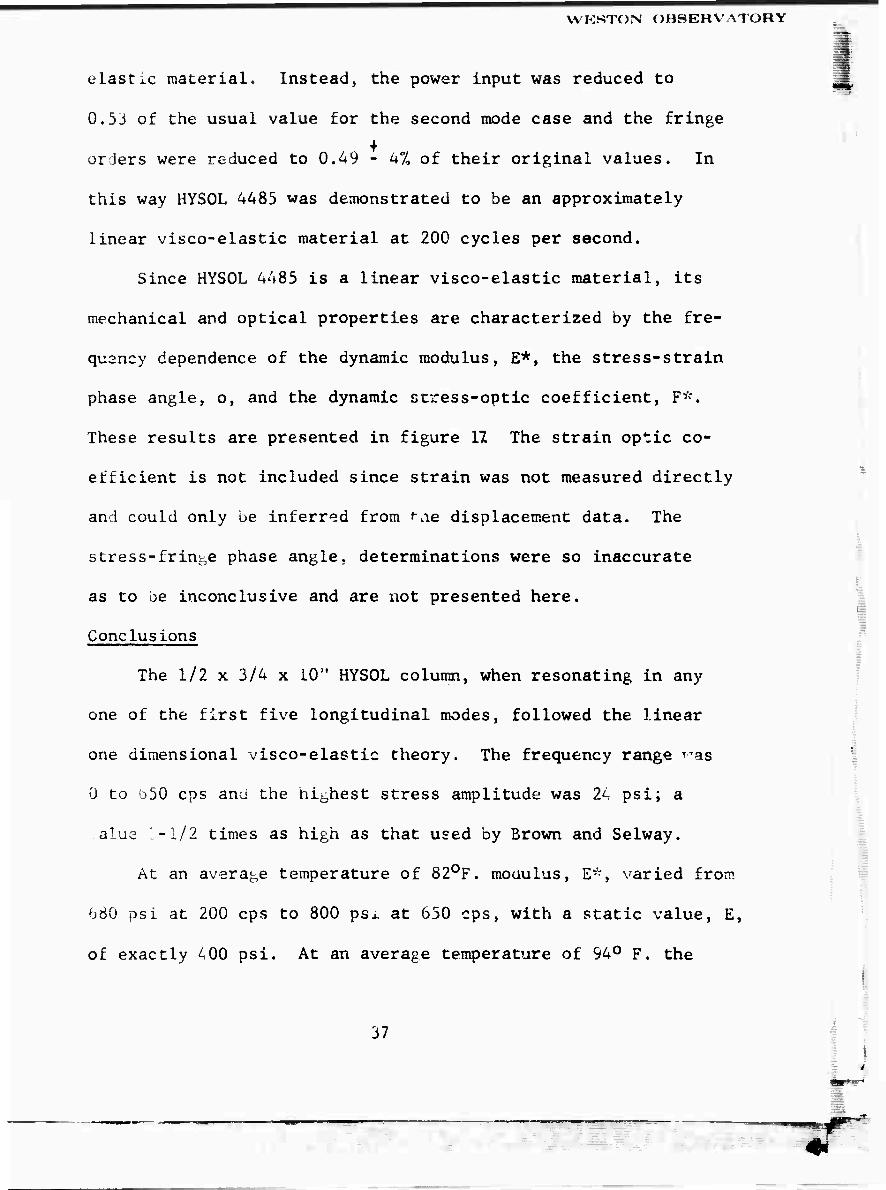
elastic material. Instead, the power input was reduced to
0.53 of the usual value for the second mode case and the fringe
orders were reduced to 0.49 - 4% of their original values. In
this way HYSOL 4485 was demonstrated to be an approximately
linear visco-elastic material at 200 cycles per second.
Since HYSOL 4485 is a linear visco-elastic material, its
mechanical and optical properties are characterized by the fre-
quancy dependence of the dynamic modulus, E*, the stress-strain
phase angle, o, and the dynamic stress-optic coefficient, F*.
These results are presented in figure 11 The strain optic co-
efficient is not included since strain was not measured directly
and could only be inferred from ^ne displacement data. The
stress-fringe phase angle, determinations were so inaccurate
as to be inconclusive and are not presented here.
Conclusions
The 1/2 x 3/4 x 10" HYSOL column, when resonating in any
one of the first five longitudinal modes, followed the linear
one dimensional visco-elastic theory. The frequency range T,as
ü to b50 cps and the hibhest stress amplitude was 24 psi; a
.alue 1,-1/2 times as high as that used by Brown and Selway.
At an average temperature of 820F. modulus, E--, varied from
680 psi at 200 cps to 800 psj. at 650 cps, with a static value, E,
of exactly A00 psi. At an average temperature of 94° F. the
37

VVT:STON OBSERVATORY
stress-optic coefficient, F*, varied from 1.0 to 2.8 psi/finge/
inch. The stress-strain phase angle increased from 9.8° at
200 cps to 12.4° at 650 ^ps.
The very inaccurate stress-fringe phase angles were not
included. However, birefringence did lag both stress and strain.
38
^gsMrrrmß

11 I.. ! I U.I ■ JliBlLA I rt M IPI 1
Driven End
Epoxy Heod
Bonded with Eostmon 910 Cement
Opoque
ron-Conjtoriton Thermocouple
Free End
-J 0.75BU- -Ho.sd"!—
FIG. 9, TEST SPECIMEN.
1

/ = I 0 inches f = 200 cps
FIG. 10. THEORETICAL AND EXPERIMENTAL DISPLACEMENT AND PHASE ANGLES FOR THE SECOND RESONANT FREQUENCY.
fmr

VVEJ-JTON OBSERVATORY
I = !0 inches f = 343 cps
T = 80-83 0F.
450
420
390
- 360
330
300
0 0.1 0.2 0,3 04 0.5 0.6 0.7 x L
0.8 0.9 1.0
FIG. 11. THEORETICAL AND EXPERIMENTAL DISPLACEMENT AND PHASE ANGLES FOR THE THIRD RESONANT FREQUENCY.
r

^^«W^^^^^M9^*B^^^^^^^^^
630
-^ = 10 inches f = 493 cps
T- 83-84 aF. 540
450
^
-270
0.9 1.0
FIG. 12. THEORETICAL AND EXPERIMEOTAL DISPLACEÄOT AND PE43E AKCLES FOR THE FOURTH RESONANT FREQUENCY. ^^

810
-H720
-630
— 540
A50
^
— 360
— 270
-ISO
FIG. 13. THEORETICAL AKD EXPERIMENTAL DISPLACE«!!! AKD PHASE ANGIJIS FOR THE FIFTH RESONANT FREQUENCY.

o
— x -J
CD
x; vJ
c _ U1 a
N.
ro v.5
T O o tl -J
GO
d ■*- D
H
ft.
O tu
W
e s o •
CO w w Ü M
r-« SB
£
H «
W O a. tn
3 oS
jf ^t I^IIB I

WEHTON OBSERVATORY
O O W CO
g
6 §
m
O H
0") O in O in o T 'S- ro rO (\J 00
iD in o
«■II «^BW

\
\
1 U1
• sw 0) u_ \ -C o
o \ 0
o s s. >/l —
o 0 \ 0 a CD
I 0N)
0 u in
O o r- 0)
0 rr o cr>
/ II II
_l 11 0y / 0 >»- 3
t— /
CD
O
— xi_J
\r 0/ -C u c
Ln — — a. CM u rO
ro 9
0) O n ii
3
CO
o
vO

n
900
800
700
600
"> 500 Q.
m LJ
400^-
300
200f
100
0
/
I— / /
/
/
0
T= 80-103 0F.
00 200 300 400 500 FREQUENCY , Cp.S.
-3
J I
o c
Q.
0 600 700
I 4r—
10 in
Q
T=80-I03 "F.
— O- —o-
/
6I-/ I
4
2
01
-/
I J L
o 100 200 300 400 500 FREQUENCY , c.p.s.
600 700
FIG. 17. MECHANICAL AND OPTICAL FREQUENCT RESPONSE OP HfSOL M*85 FRCH 0 TO 650 C.P.S.

WEHTON OBSERVATORY
DETERMINATION OF THE STATIC AND DYNAMIC
PROPERTIES OF HYSOL 4485
I. INTRODUCTION
The research program covered by this report was conduc-
ted to determine the static and dynamic mechanical and optical
properties of a pour of HYSOL 4485 used in the fabrication of
a group of rectangular plates. The plates were cast by Hysol
Corporation for Boston College under Armour Research Foundation
Purchase Order No. 46949. All of the specimens used for the
determinations were cut from material which remained after 12'"
x 12'' test plates were removed from the larger plates provided
by the supplier.
The static properties which were determined include:
a) Photoelastic stress fringe value
b) Modulus of elasticity
c) Poisson's ratio
The dynamic properties which were detarmined include:
a) Modulus of elasticity
b) Shear modulus
c) Photoelastic stress fringe value
The modulus of elasticity and shear modulus were determined for
a limited range of frequencies between 100 and 600 cycles per
48

WEHTON OBSERVATORY
second. Funds available for the program were not sufficient
to permit similar determinations to oe made of the photoelastic
stress fringe value.
II. STATIC PROPERTIES
A. Photoelastic Stress Fringe Value
The static photoelastic material fringe value was obtained
oy subjecting a 3 inch diameter disk of the material to incre-
ments of diametral load and recording the fringe order at the
center of the disk for each increment with a 12 inch diameter
diffused light polariscope. The Tardy method of compensation
was used to establish the fractional fringe orders. The max-
imum shear stress at the center of the disk as presented in a
well known analytical solution is as follows:
.^l - 4~2 z 4P <' max 2 /T t D
where max * maj.iraum shear stress
0 ^,02 * principal stress
P s diametral load
D Z diameter of disk ■
t - thickness of disk
From the static stress-optic law
nf T max i
where n = fringe order at center of disk
49

WESTON OBSERVATORY
f z material stress fringe value in shear
Figure 18 shows the curve obtained by plotting t T" vs.
fringe order. The slope of this curve was taken as the
material iringe value and was found to be 0.486 psi/fringe/
in.
B. Modulus of Elasticity and Poisson's Ratio
The modulus of elasticity and Poisson's ratio (as a
function of time under load) were obtained from creep data
by utilizing the Moire method of analysis. Two specimens were
used for the study. One, which was subjected to a stress
level of approximately 20 psi, had two 1000 line per inch
arrays printed in the axial and transverse directions. An
identical master grid was placed in contact with the model
grid and fixed to the loading fixture, A constant load was
applied to the specimen and the change in the fringe spacing
produced by interference between the two sets of lines were
recorded at different times by taking photographs of the
specimen. At any time t the longitudinal and transverse strains
were computed using
A n
c e ■ i_ _L i A xi N
where
<$ n. 1 s number of fringes/in
6 x1
N ■ line spacing of Moire pattern
e £ . ■ Eulerian strain
50

WESTON OB8EHVATCRY
o m o IO
to OJ OJ
d*
o u. X*

WESTON OBSERVATORY
To obtain Lagrangian strain, i.e., la terms of the original
gage length
o
tL- -H 1 - €e
In determining Young's Modulus, the stress was corrected
for the decrease in cross sectional area. A plot of the Lagran-
gian strains and resulting Modulus of Elasticity and Poisson's
ratio is given in Fig, 19. Figure 20 shows the results of a
creep test at approximately 40 psi stress utilizing 300 line/
inch Moire grids on a separate model.
The results of these tests show that the material displays
slight viscoolastic properties, but for most practical purposes,
it can be considered elastic.
III. Dynamic Properties
The dynamic properties of the HYSOL 4485 material were
determined by using both Volterra pendulum (10) and sinusoidal
response tests.
A. Volterra Pendulum Studies
The dynamic properties are determined in this method by
subjecting a small specimen to the dynamic compression induced
52
^-

WESTON OBSERVATORY RY
AI1011SV13 JO smnaow o o
o o o o
O O O O CVJ —
OiJLVd S.NOSSIOd 10 ^ ro 6 Ö Ö
1 i 1 1 1 1 1
<
i
< >
> h- z Ü i <
O
< z 1- 0) 1-
< —
1 ULU
S O
F E
L
<
< X
UJ
> a: UJ
? > tn z <
cr-o
—
ISS
ON
'S
R
—
o < tr. o o c i H V ^ 2 C
< 1
r
i i
1 1
o o H o < o in GO ^ t
o o «j — g en Q-
1 0>
8^ fe2> 2 uj Q. ü.
5-
Z UJ O
a: -J s u UJ >
UJ
21 UJ UJ
i- H- (0
o CO Z UJ
o « 2-
cn<
0) UJ
ID * ro CVJ o o O o o o O o
(NI/NI) NIVdJLS
o o
O

WB»TON OMBWVATORY
o o o o p o <0 ir>
o o o cvj
OtiVU S.NOSSIOd m
ö ö o] i—r T T—r T
o i- ifi <
UJ
o in
-j
O O
15 (A
u X > (0 O
«A ^ tf) < c i ^m
«1 } O
fr- CL
I 1 1 1
o o o
O ill O UJ
UJ
ol
- Q
o o
00 o o
8 Ö
(NI/NI) NIVdIS
o d
eg o o
»
^r
i CO x CO
Q. U. UJ O
Ct -I U UJ
UJ UJ
SIS
CO UJ >
u o CM
Ö iz

WEHTOiV OBSKHVATOHY
by the impact of two metal bars suspended as ballistic pen-
dulums. An acceleroraeter is mounted on each pendulum to
provide a record of the accelerations during impact. The
test consists of releasing one pendulum from a desired height
and having it strike the specimen which is positioned on the
second pendulum. The second pendulum is initially motionless
in its equilibrium position. The acceleration traces during
impact are recorded by photographing the traces of the accel-
eromcter output voltages on a dual beam oscilloscope. The
curves provide sufficient data for the determination of a dy-
namic stress-strain curve. Curves for the two load levels
(20 and 200 psi) Investigated in this study are shown in Figs.
21 and 22 respectively.
The dynamic photoelastic properties were obtained by taking
high speed photographs of the fringe pattern during impact.
The change in fringe order as a function of time over the initial
period of impact was correlated to the stress in the specimen
over this same time interval to obtain the dynamic material
fringe values in terms of stress.
The speed of the camera wl Ich was used in the study was
determined from timing light traces along the edge of the film
to be approximately 17,000 frames per second.
55

VVESTON OBSERVATORY
32 -
28 -
24 -
en 9:20 & (/) UJ a: * 16 ui
!2 -
8 -
4 -
0.01 0.02 0.03 0.04 TRUE STRAIN (IN/IN)
0.05
FIG. 21 DYNAMIC STRESS-STRAIN CURVE FOR HYSOL 4485 AT A LOADING RATE OF 7.0? IN/SEC
"^pr*»g"

WE8TON OBSERVATOHY
DC\J ( 1 I ... ,
! I
>Ct)
280 —
/ 7 -
240 „
y /o /
-
^.200 _ / 7
if) 0. A 0 /
if)
2 160 —
rJ /
—
hi
I- 120 — ,
/ /
—
80 —
/ 0 /
/
-
40
n / / 1 1 1 1 0.1 0.2 0.3 0.4
TRUE STRAIN (IN/IN) 0.5 0.6
FIG. 22 DYNAMIC STRESS-STRAIN CURVE FOR HYSOL 4485 AT A LOADING RATE OF 65.5 IN/SEC

WESTON OBSERVATORY
This speed was sufficient to evaluate the change in fringe
order at the low stress level, but at the high stress level,
the change in fringe order was too rapid to be evaluated with
this camera. Since no faster speeds can be obtained with
this camera, no photoelastic data was obtained at the 200 psi
level.
From the photographic record of the impact at the 20 psi
level a curve of fringe order as a function of time was plotted.
This curve which is presented in Fig. 23, shows that the fringe
order changes linearly with time over the first millisec of
impact. Since the stress over this period of time was also
determined to be linear with time, the material fringe value
in terms of stress could be determined from the slopes of the
stress-time and fringe-time curves. The value obtained was
f^ ■ 0.833 psi/in-fringe
B. Sinusoidal Response Study
The modulus of elasticity, shear modulus, and phase angle
between stress and strain were determined over a limited range
of frequencies in this phase of the study. The frequency
range could oe extended by using specimens of different size
out the funds available when the work was conducted was not
sufficient to permit this extension of work. The results which
were obtained for the frequency range from 100 to 500 cycles
58
—"^ - —— ■ MB --■—' ■ l,'~' ■' ^"^^■—^»^•-^—'^—^^^■'^■^^MM«—^«^^^^^■^^■■■■■■g'l^P'aP^—»^W—BIIWM

WEHTON OBSERVATORY
^ ro <NJ
H20HO aONtdd

WESTON OBSERVATORY
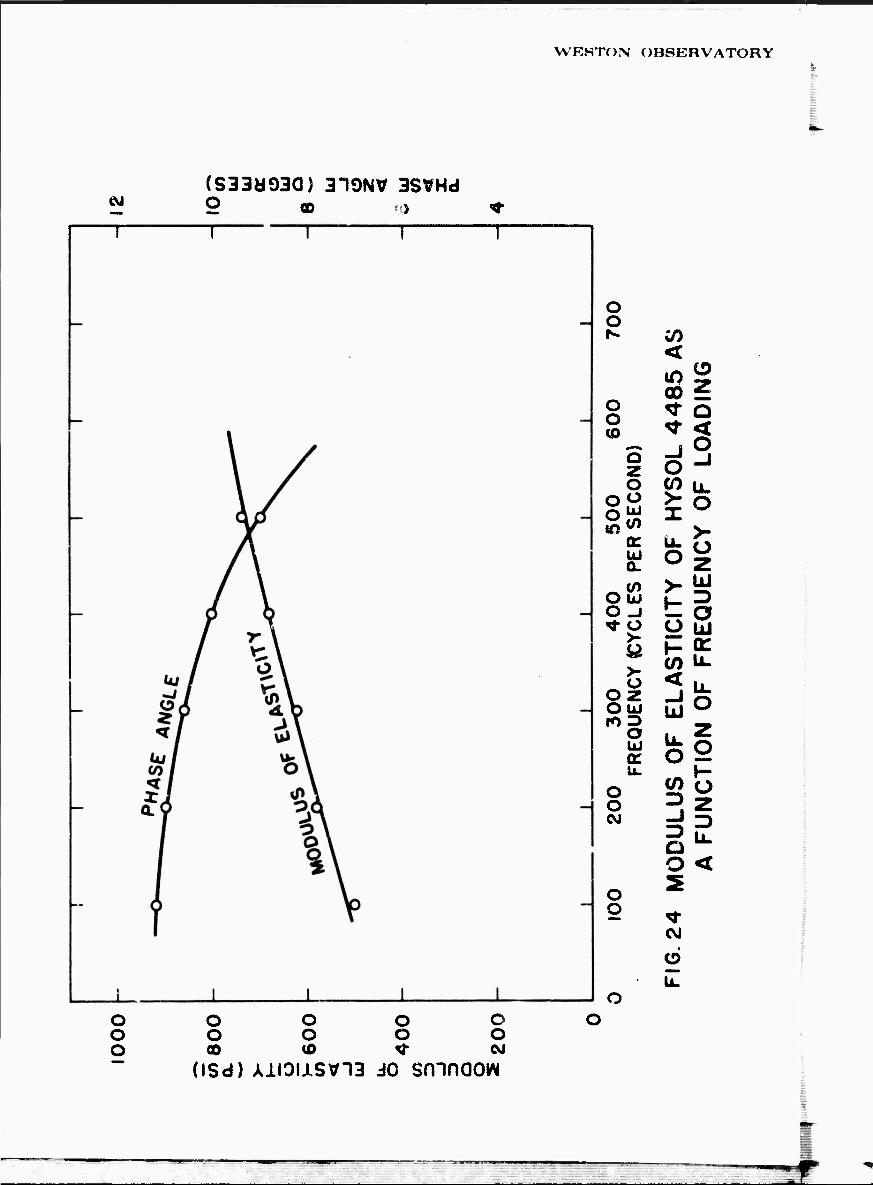
per second are shown in Figs. 24 and 25. The absolute values
of the moduli are shown together with the phase angles. The
real and imaginary components o£ the complex moduli can be
obtained by multiplying hy the cosine and sine of the phase
an^le respectively.
XV. Summary
In the previous sections of this report curves have been
presented which show the static and dynamic properties of a
material known commercially as HYSOL ^485. In all of the work
extreme care has been exercised in order to obtain results
whose accuracy represents the best obtainable within the limits
of current methods and techniques. As a result we feel that
the values presented should vary from the true values by no
more than - 5 percent. A tabulation of values used in plotting
the curves are presented in the taoles which follow:
bC
WEHTON OBSERVATORY
1
(S33d93a) 319NV 3SVHd oo -•> ^
i r o 1
o o
<
00 o
o o CO
^r o ^r <
o z
-j o O
o in u. i o
>- o: u. o z Ui O
(S) >- UJ O lii h- 3 O _l o to o UJ
>- h- Q: (/) u.
>- < ÜL o O UJ UJ IOO o
UJ er o
z o
b. >-
o <n o o 3 gg CNJ -J
a 3 u.
o < s o
o t CsJ
o • u.
o o O o o o o o o o o oo (0 t &i
(ISd) AJLIOIJLSVIS do smnaow

VvESTON OBSERVATOHY
o 1
(S33U03Q) 319NV "iSVHd «D <o <-
Z o O
Ä < o
< Q
u. o
o o O O o o (isd) smnaow
8 csi
«V3HS
8
o >-
co cr -j
O O O 2 a: < UJ X if*
in CVi
o
"■feUH! ^ J=.

VVESTON OBSERVATORY
Table I
DATA FOR STATIC PHOTOELASTIC CTRESS FRINGE VALUE DETERMINATION
Load Fringe Order TTD
0.97 0.41
1.83 0.82
2.67 1.23
3.48 1.64
4.31 2.05
5.13 2.46
6.09 2.86
1 lb
2 lb
3 lb
4 lb
5 lb
6 lb
7 lb
63

^"
WESTON OBSKRV'ATORY
Table II
CREEP DATA FOR 20 PSI STUDY
Time After Loading L
(min) (in/in)
0.1 0.0176 0.3 0.0180 0.5 0.0179 0.7 0.0178 0.9 0.0183 1.0 0.0183 2.6 0.0183 5.0 0.0183
20.0 0.0183 37.8 0.0186
145.4 0.0198 1480.4 0.0199
L
(in/in)
0.0392 0.0392 0.0395 0.0401 0.0400 0.0400 0.0402 0.0402 0.0400 0.0403 0.0408 0.0411
64
W

VVEHTON OBSERVATORY
Table III
CREEP DATA FOR 41.7 PSI STUDY
Time After Loading L *t X y (min) (in/in) (in/in)
0.1 0.0355 0.0738 0.3 0.0357 0.0749 0.5 0.0362 0.0748 0.8 0.0363 0.0748 1.0 0.0363 0.0748 2.0 0.0363 0.0748 5.0 0.0363 0.0748
20.0 0.0363 0.0748 51.5 0.0363 0.0748 188.0 0.0368 0.0750 322.4 0.0368 0.0750 1270.3 0.0373 0.0748
65

WESTON OBSERVATORY
Table IV
VOLTERRA PENDULUM STUDY - V = 7.02 0 in/sec
Time After Impact True Stress True Stress (millisec) (psi) (in/in)
1 5.20 0.0080 2 10.54 0.0139 3 15.22 0.0218 4 19.88 0.0266 5 23.52 0.0325 6 27.16 0.0372 7 29.71 0.0420 8 32.14 0.0430 9 33.17 0.0480
10 33.87 0.0488 11 33.33 0.0488 12 32.42 0.0488 13 30.61 0.0470 14 27.90 0.0440 15 24.45 0.0412 16 22.86 0.0374 17 16.18 0.0315 18 12.49 0.0257 19 7.99 0.0208 20 4.22 0.0149 21 0 0.0080
66
■I *

WEHTON OBSERVATORY
Table V
VOLTERRA PENDULUM STUDY - V ■ 65.5 Ö
In/sec
Time After Impact True Stress True Strain (mllllsec) (PBi) (In/In)
0.75 32.51 0.039 1.50 85.17 0.113 2.25 117.11 0.174 3.00 154.61 0.231 3.75 186.66 0.293 4.50 225.26 0.357 5.25 258.76 0.412 6.00 281.81 0.457 6.75 296.39 0.494 7.50 301.68 0.518 8.25 299.39 0.524 9.00 286.59 0.518 9.75 269.73 0.494
10.50 131.06 0.463 11.25 207.91 0.418 12.00 174.56 0.371 12.75 141.79 0.314 13.50 105.13 0.262 14.25 73.96 0.207 15.00 51.84 0.139 16.00 0 0.077
67

WESTON OBSERVATORY
Table VI
SINUSOIDAL RESPONSE TESTS-SHEAR MODULUS DETERMINATIONS
Frequency (cycles/sec)
Shear Modulus (psi)
Phase Angle (degress.
100 205 8.0
300 220 8.0
500 255 8,0
700 330 7.5
68
EM

WEHTON OBSERVATORY
Table VII
SINUSOIDAL RESPONSE TEST - MODULUS OF
ELASTICITY DETERMINATION
Frequency (cycles/sec)
Modulus of Elastic (psl)
ity Phase Angle (degree)
100 500 11.2
200 580 11.0
300 625 10.6
400 680 10.0
500 740 9.0
69

WRHTON ()HSEHVATORY
APPENDIX: SUhMARY OF VOLTERRA PENDULUH THEORY
Let Fi(t) be the compressive force produced on the spe-
cimen by the impacting pendulum at a time t which is measured
from the instant the impacting pendulum contacts the specimen,
Let F2(t) be the force acting on the impacted pendulum. Sim-
ilarly, let Xi(t) and X2(t) be the horizontal displacements
of the impacting and impacted pendulums respectively mea-
sured trom their initial positions at the instant t * 0.
Let M| and Mn be the masses of the impacting and impacted
pendulums, respectively.
The change in distance between the two pendulums S(t)
is given by:
S(t) « X2(t) - X^t) (Eq. 1)
A double differentiation of Eq. 1 with respect to time
gives: 2
<rx2(t) d\it)
-^ Z T- T— (E^ 2) dt2 dtz dtz
Writinp Newton's Second Law of Motion for the impacting
and impacted pendulums gives the following relations if the
angular movement of the pendulums during impact is small.
F^t) « Mi (Eq. 3)
dt
70
L^

WESTON OBSERVATORY
d X2(t:)
F9(t) M. dt'
(Ec. 4)
d2X1(t) d2X2(t)
Solving Eqs. 3 and 4 for and i-— dt' dt'
and substituting these values in Eq, 2 results in:
F^t) d2S(t) F2(t>
M< M, (Eq- 5)
dt'- l'*2 "1
Assuming that the time required for the forces acting
on both ends of the specimen to become equal is small enough
to be neglected, one may write from Newton's Law of Action
and Reaction
F2(t) = -F^t) (Eq. 6)
Substitution of Eqs. 6 into 5 gives
dt2 F,(t) i-t J.
M. M, (Eq. 7)
Rearrangement of the terms in Eq. 7 gives the force F2(t)
as a function of specimen acceleration:
F2(t) M1M2
d2S(t) M, + M2 dt'
(Eq. 8)
The equation relating the acceleration as measured by the d2X (t)
accelerometer ' with the acceleration of the 1
dt
I
71

WESTON OBSERVATORY
2 . v specimen d S(t) is found by substituting Eq. 4 into dt2
Eq. 7 and simplifying.
d2S(t) _ K
"l - M2 d2x2(t)
2 dt
Ml dt2
(Eq. 9)
Let-Ä (t) be the actual length of the specimen, and then
^£(t) - A 0 - S(t) (Eq. 10)
where^ 0 is the initial length of the specimen and S(t) is
the contraction of the specimen obtained by integrating Eq.
9 twice as shown below:
The first integration gives:
Mi * M9 f d2X9(t) dS(t) 12|2 dt + Ci (Eq. li) dt M! U dt2
where C - U0 the ve1ocity of the impacting pendulum at t ■ 0
Letting U(t) be the velocity of the impacted pendulurr
obtained in the first integration, one obtains for the second
integration
Ml 4 M2 r S(t) ' - j lUt) dt + ü0t 4- C2 (Eq. 12)
where Co = 0 the contraction of the specimen at t = C.
72
^^

WEHTON OBPERVATORV
If it is assumed that during deformation the volume of
the specimen remains constant (since Poisson's ratio is nearly
1/2 for the materials under consideration, this assumption is
justified), it is possible to compute the area A(t) from the
following relationship:
Vo A(t) = _ (Eq. 13)
lit)
where V0 is ehe initial • lume of the specimen. Then, in view
of Eqs. 13 and 4, the true stress «-(t) will hi given by:
Mt) <r(t) =
F2(t)/(t) M
A(t)
d A2(t)
2 dt2 -^ it) (Eqt 1A)
And, the true strain by the formula
<(t) = Log, J: (Eq. 15) X it)
Hence, from equations 14 and 15 the stress and strain can
be computed as a function of time and the dynamic stress-
strain curves can be drawn.
The material fringe value in stress f--(t) is given by:
f, (t) = h[-1 (t) - ^2it)]
2n(t) ( :q. 16)
73
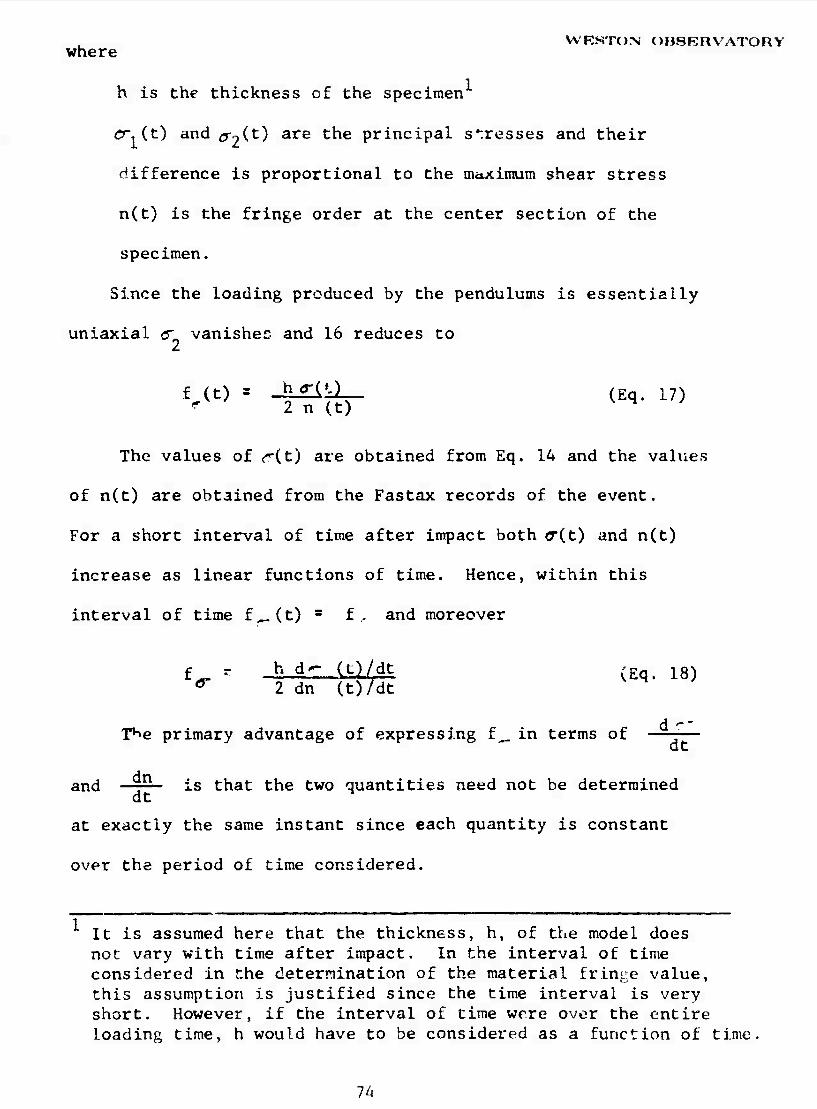
WESTON OBSERVATORY where
h is Che thickness of the specimen
C", (t) and tTj^t) are ^^ principal stresses and their
difference is proportional to the nuucimutn shear stress
n(t) is the fringe order at the center section of the
specimen.
Since the loading produced by the pendulums is essentially
uniaxial <3" vanishes and 16 reduces to 2
£^t) = -rffc- (Eq- 17)
The values of rit) are obtained from Eq. 14 and the values
of n(t) are obtained from the Fastax records of the event.
For a short interval of time after impact both 0"(t) and n(t)
increase as linear functions of time. Hence, within this
interval of time f^Ct) s f, and moreover
f r h d-- <;t)/dt (Eq< 18)
^ 2dn(t)7dt
d "" T^e primary advantage of expressing f^ in terms of dt
and is that the two quantities need not be determined dt ^
at exactly the same instant since each quantity is constant
over the period of time considered.
It is assumed here that the thickness, h, of the model does not vary with time after impact. In the interval of time considered in the determination of the material frinee value, this assumption is justified since the time interval is very short. However, if the interval of time were over the entire loading time, h would have to be considered as a function of time
7/.

WESTON OBSERVATORY
REFERENCES
1. Becker, H., "Equipment for Watching Propagating Stress Waves' , Rev. Sei. Instr., 30» 1-2> (1959).
2. Thomson, K.C., "Full-field Seismic Modelling*", AFCRL- 63-685, (1963).
3. Thomson, K.C. and J. A. Hill, "Seismic Model Impacter ', AFCRL-63-79G, (1963).
A. Baltrukonis, J. H., D. S. Blomquist ai.d E. B. Magrab, 'Measurement of the Complex Shear Modulus of a Linearly Viscoelastic Material", The Catholic university of America, Washington, D.C. 20017, Tech. Rep. N^. 5 to the National Aero- nautics and Space Administration under Research Grant No. NsG-125-61 (Suppl. 3) May 1964.
5. Leaderman, H., 'Elastic and Creep Properties of Fila- mentous Materials , Textile Foundation, Washington, D. C. (1943) p. 175.
6. Ferry, J. D., "Mechanical Properties of Substances of High Molecular Weight VI. Dispersion in Concentrated Polymer Solutions and its Depen- dence on Temperature and Concentration", J. Amer. Chem. Soc, 77, 3746, (1950).
7. Schwarzl, F. and A. J. Staverman, "Time-Temperature Dependence of Linear Viscoelastic Behavior , J. Appl. Phys., 23, 838, (1952).
8. Tobolsky, A. V. and J. R. McLoughlin, ' Elastoviscous Properties of Polyisobutylene V. The Transition Region", J. Polymer Science 8, 543, (1952).
9. Brown, G. W. and D. R. Selway, "Frequency Response of a Photo-Viscoelastic Material", UCRL-7499, Sept. 15, 1963.
10. Volterra, E. and C. S. Barton, 'Impact Testing Machine for Rubber-Like Materials", Proc. SESA, lb, 1, (195«), p. 157.
i i
75 4