aerodynamics for the mars phoenix entry capsulemars pathfinder, and the mars exploration rovers...
TRANSCRIPT

American Institute of Aeronautics and Astronautics
1
____________________________________________ † Aerospace Engineer, Atmospheric Flight & Entry Systems Branch, MS 489, [email protected], Senior Member. * Senior Aerospace Engineer, Atmospheric Flight & Entry Systems Branch, MS 489, [email protected], Associate
Fellow ‡ Aerospace Engineer, Atmospheric Flight & Entry Systems Branch, MS 489, [email protected], Member.
Aerodynamics for the Mars Phoenix Entry Capsule
Karl T. Edquist†, Prasun N. Desai*, and Mark Schoenenberger‡
NASA Langley Research Center, Hampton, Virginia, 23681
Pre-flight aerodynamics data for the Mars Phoenix entry capsule are presented. The aerodynamic coefficients were generated as a function of total angle-of-attack and either Knudsen number, velocity, or Mach number, depending on the flight regime. The database was constructed using continuum flowfield computations and data from the Mars Exploration Rover and Viking programs. Hypersonic and supersonic static coefficients were derived from Navier-Stokes solutions on a pre-flight design trajectory. High-altitude data (free-molecular and transitional regimes) and dynamic pitch damping characteristics were taken from Mars Exploration Rover analysis and testing. Transonic static coefficients from Viking wind tunnel tests were used for capsule aerodynamics under the parachute. Static instabilities were predicted at two points along the reference trajectory and were verified by reconstructed flight data. During the hypersonic instability, the capsule was predicted to trim at angles as high as 2.5 deg with an on-axis center-of-gravity. Trim angles were predicted for off-nominal pitching moment (4.2 deg peak) and a 5 mm off-axis center-of-gravity (4.8 deg peak). Finally, hypersonic static coefficient sensitivities to atmospheric density were predicted to be within uncertainty bounds.
Nomenclature Symbols A reference area, πD2/4 (m2) CA axial force coefficient, FA/q∞A CD drag coefficient, FD/q∞A CL lift coefficient, FL/q∞A Cl rolling moment coefficient, Ml/q∞AD Cm pitching moment coefficient, Mm/q∞ A D Cmq pitch damping coefficient, ∂Cm/∂(qD/2V) CN normal force coefficient, FN/q∞A Cn yawing moment coefficient, Mn/q∞AD Cnr yaw damping coefficient, Mn/q∞AD CY side force coefficient, FY/q∞A D capsule diameter (m) E atmospheric entry h altitude above reference areoid (km) Kn Knudsen number, λ/D L landing L/D lift-to-drag ratio M Mach number m capsule mass (kg) q dynamic pressure, ρV2/2 (Pa) r distance from center of Mars (km) V atmosphere-relative velocity (km/s)
X, Y, Z capsule coordinates from nose (m) α angle-of-attack (deg) αΤ total angle-of-attack, cos-1[cos(α)cos(β)] (deg) β angle-of-sideslip (deg) γ inertial flight-path angle (deg) λ molecular mean free path (m) ρ atmospheric density (kg/m3) σ standard deviation Acronyms CG center-of-gravity DSMC Direct Simulation Monte Carlo EDL entry, descent, and landing FPA flight-path angle (deg) MER Mars Exploration Rovers RCS reaction control system TPS thermal protection system Subscripts
cg center-of-gravity
https://ntrs.nasa.gov/search.jsp?R=20080034648 2020-04-05T13:08:22+00:00Z
American Institute of Aeronautics and Astronautics
2
h horizontal T total v vertical ∞ freestream condition
I. Introduction
The Mars Phoenix spacecraft was launched on August 4th of 2007 and landed successfully on May 25th of 2008. Phoenix was initially conceived and built as the Mars Surveyor 2001 Lander1 as part of the Mars Surveyor program in the 1990's. After failures of the Mars Climate Orbiter2 and Mars Polar Lander3, Surveyor was put in storage. Surveyor was intended to be a duplicate of the Polar Lander spacecraft. The Surveyor 2001 Lander spacecraft was renamed Phoenix for proposal under NASA's first Scout program.4 The Phoenix proposal won acceptance in 2003 and the flight hardware was brought out of storage for updated testing and analysis.
The Phoenix entry, descent, and landing (EDL) system5 was based on the successful systems used for Viking,
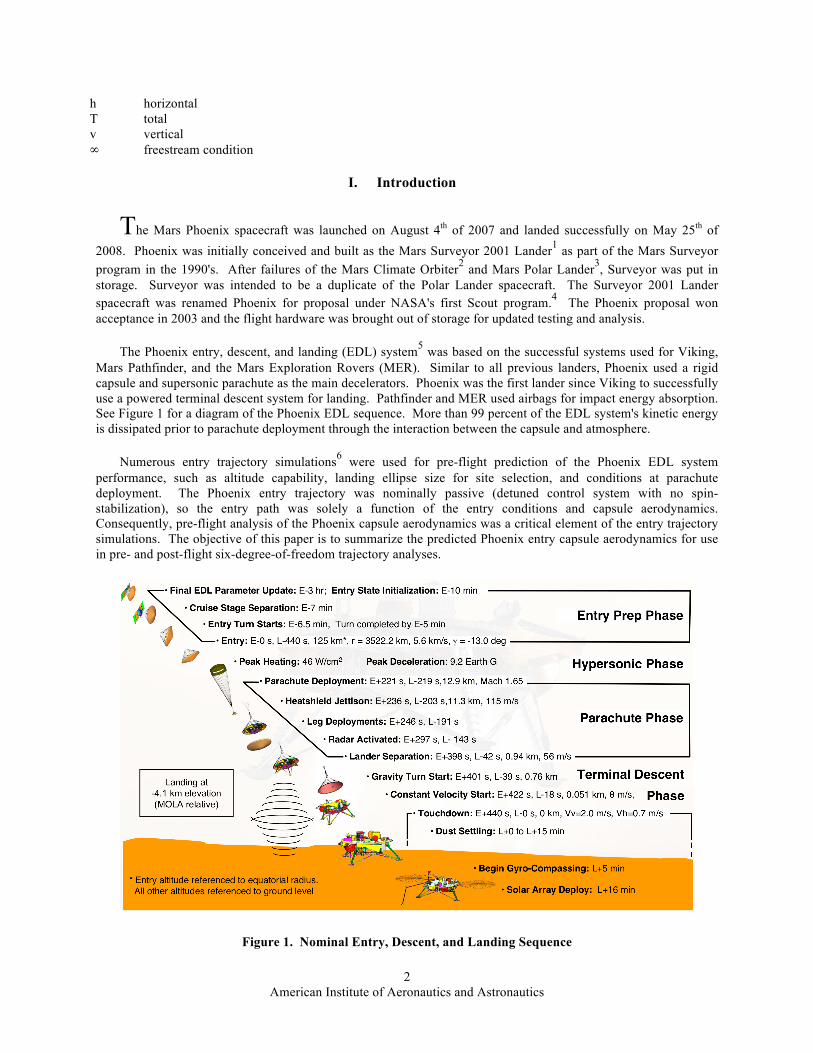
Mars Pathfinder, and the Mars Exploration Rovers (MER). Similar to all previous landers, Phoenix used a rigid capsule and supersonic parachute as the main decelerators. Phoenix was the first lander since Viking to successfully use a powered terminal descent system for landing. Pathfinder and MER used airbags for impact energy absorption. See Figure 1 for a diagram of the Phoenix EDL sequence. More than 99 percent of the EDL system's kinetic energy is dissipated prior to parachute deployment through the interaction between the capsule and atmosphere.
Numerous entry trajectory simulations6 were used for pre-flight prediction of the Phoenix EDL system performance, such as altitude capability, landing ellipse size for site selection, and conditions at parachute deployment. The Phoenix entry trajectory was nominally passive (detuned control system with no spin-stabilization), so the entry path was solely a function of the entry conditions and capsule aerodynamics. Consequently, pre-flight analysis of the Phoenix capsule aerodynamics was a critical element of the entry trajectory simulations. The objective of this paper is to summarize the predicted Phoenix entry capsule aerodynamics for use in pre- and post-flight six-degree-of-freedom trajectory analyses.
Figure 1. Nominal Entry, Descent, and Landing Sequence

American Institute of Aeronautics and Astronautics
3
II. Background The following sections describe the Phoenix entry capsule and reference entry trajectory, reaction control
system (RCS), database structure and methods, and uncertainties used in Monte Carlo trajectory analyses.
A. Entry Capsule Geometry and Design Trajectory The primary decelerator for Phoenix was a rigid
capsule with a 70-degree half-angle sphere-cone forebody (Figure 2). Similar shapes successfully landed payloads for the Viking, Pathfinder, and MER missions. Table 1 compares the Phoenix capsule and entry trajectory to past successful Mars landings. The Phoenix entry capsule diameter was identical to that of Pathfinder and MER. The key characteristics for ballistic entries such as Phoenix are the entry flight-path angle (FPA, similar to Pathfinder), mass (similar to Pathfinder), and velocity (similar to MER).
Blunt body aerodynamics are generally dominated
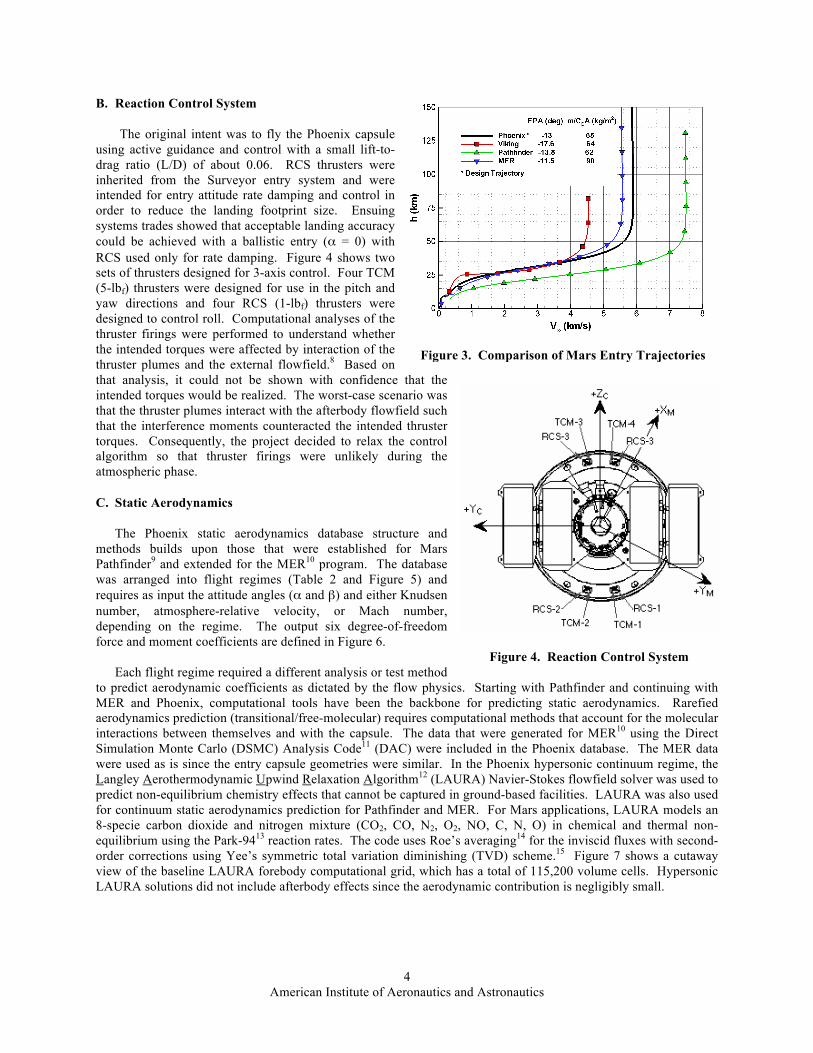
by the forebody shape. Secondary aerodynamic effects arise from the afterbody shape (dynamic pitch damping), and trajectory altitude-velocity profile. More specifically, the entry path creates combinations of velocity and density that may result in small aerodynamics differences when computed with Navier-Stokes codes. The Phoenix reference trajectory is shown in Figure 3 with other Mars entries. The trajectory shown for Phoenix is not the actual flight trajectory, but was used pre-flight to compute aerodynamic coefficients. The design trajectory had a 5.9 km/s entry velocity compared to 5.5 km/s for the actual entry.7 The Phoenix design trajectory is most similar to the MER entries due to similar entry velocity and FPA. Given the similarity of Phoenix to past capsules, existing aerodynamics data were used when available.
Figure 2. Entry Capsule Geometry
Table 1. Comparison of Phoenix to Previous Mars Entries
Viking Pathfinder MER Phoenix
Diameter, m 3.5 2.65 2.65 2.65
Entry Mass (kg) 930 585 840 602 Relative Entry Velocity (km/s) 4.5 7.6 5.5 5.5
Relative Entry FPA (deg) -17.6 -13.8 -11.5 -13.2 m/(CDA) (kg/m2) 64 62 90 65
Xcg/D -0.22 -0.25 -0.25 -0.25 M∞ at Parachute Deployment 1.1 1.6 1.85 1.65
Hypersonic αtrim (deg) -11 0 0 0 Control RCS Damping Spinning Spinning Non-Spinning
American Institute of Aeronautics and Astronautics
4
B. Reaction Control System
The original intent was to fly the Phoenix capsule using active guidance and control with a small lift-to-drag ratio (L/D) of about 0.06. RCS thrusters were inherited from the Surveyor entry system and were intended for entry attitude rate damping and control in order to reduce the landing footprint size. Ensuing systems trades showed that acceptable landing accuracy could be achieved with a ballistic entry (α = 0) with RCS used only for rate damping. Figure 4 shows two sets of thrusters designed for 3-axis control. Four TCM (5-lbf) thrusters were designed for use in the pitch and yaw directions and four RCS (1-lbf) thrusters were designed to control roll. Computational analyses of the thruster firings were performed to understand whether the intended torques were affected by interaction of the thruster plumes and the external flowfield.8 Based on that analysis, it could not be shown with confidence that the intended torques would be realized. The worst-case scenario was that the thruster plumes interact with the afterbody flowfield such that the interference moments counteracted the intended thruster torques. Consequently, the project decided to relax the control algorithm so that thruster firings were unlikely during the atmospheric phase.
C. Static Aerodynamics The Phoenix static aerodynamics database structure and
methods builds upon those that were established for Mars Pathfinder9 and extended for the MER10 program. The database was arranged into flight regimes (Table 2 and Figure 5) and requires as input the attitude angles (α and β) and either Knudsen number, atmosphere-relative velocity, or Mach number, depending on the regime. The output six degree-of-freedom force and moment coefficients are defined in Figure 6.
Each flight regime required a different analysis or test method
to predict aerodynamic coefficients as dictated by the flow physics. Starting with Pathfinder and continuing with MER and Phoenix, computational tools have been the backbone for predicting static aerodynamics. Rarefied aerodynamics prediction (transitional/free-molecular) requires computational methods that account for the molecular interactions between themselves and with the capsule. The data that were generated for MER10 using the Direct Simulation Monte Carlo (DSMC) Analysis Code11 (DAC) were included in the Phoenix database. The MER data were used as is since the entry capsule geometries were similar. In the Phoenix hypersonic continuum regime, the Langley Aerothermodynamic Upwind Relaxation Algorithm12 (LAURA) Navier-Stokes flowfield solver was used to predict non-equilibrium chemistry effects that cannot be captured in ground-based facilities. LAURA was also used for continuum static aerodynamics prediction for Pathfinder and MER. For Mars applications, LAURA models an 8-specie carbon dioxide and nitrogen mixture (CO2, CO, N2, O2, NO, C, N, O) in chemical and thermal non-equilibrium using the Park-9413 reaction rates. The code uses Roe’s averaging14 for the inviscid fluxes with second-order corrections using Yee’s symmetric total variation diminishing (TVD) scheme.15 Figure 7 shows a cutaway view of the baseline LAURA forebody computational grid, which has a total of 115,200 volume cells. Hypersonic LAURA solutions did not include afterbody effects since the aerodynamic contribution is negligibly small.
Figure 3. Comparison of Mars Entry Trajectories
Figure 4. Reaction Control System
American Institute of Aeronautics and Astronautics
5
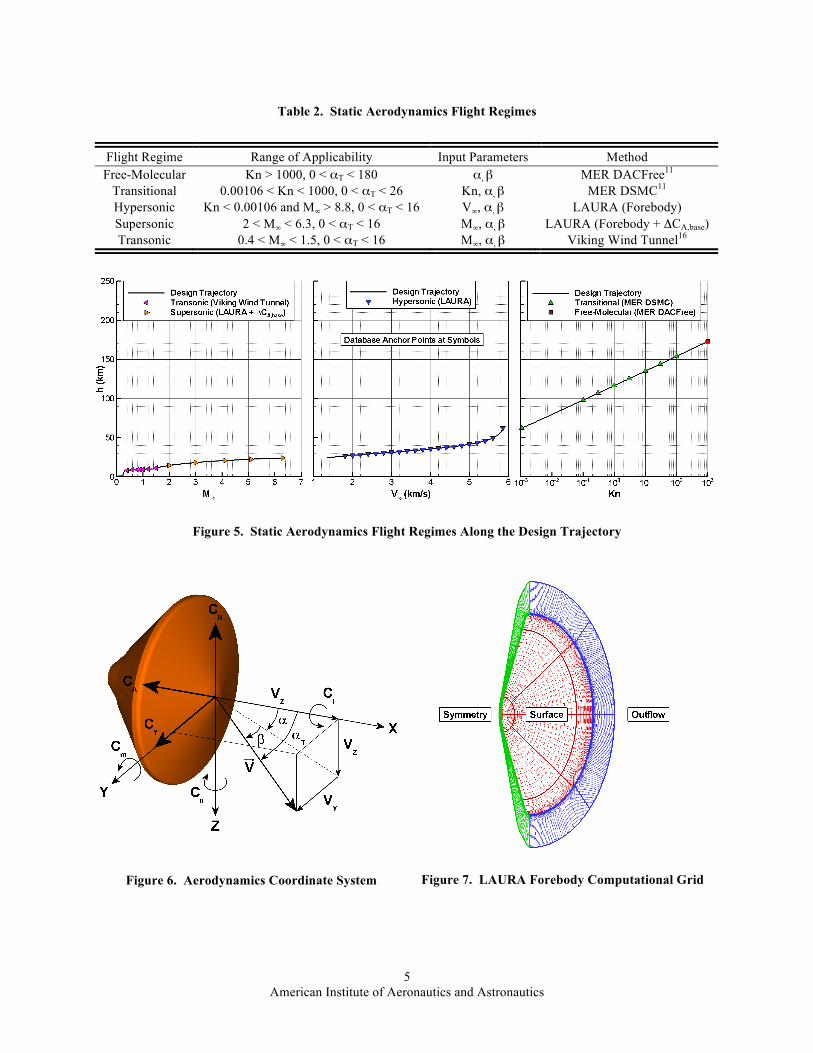
Table 2. Static Aerodynamics Flight Regimes
Flight Regime Range of Applicability Input Parameters Method Free-Molecular Kn > 1000, 0 < αT < 180 α, β MER DACFree11
Transitional 0.00106 < Kn < 1000, 0 < αT < 26 Kn, α, β MER DSMC11 Hypersonic Kn < 0.00106 and M∞ > 8.8, 0 < αT < 16 V∞, α, β LAURA (Forebody) Supersonic 2 < M∞ < 6.3, 0 < αT < 16 M∞, α, β LAURA (Forebody + ΔCA,base) Transonic 0.4 < M∞ < 1.5, 0 < αT < 16 M∞, α, β Viking Wind Tunnel16
Figure 5. Static Aerodynamics Flight Regimes Along the Design Trajectory
Figure 6. Aerodynamics Coordinate System
Figure 7. LAURA Forebody Computational Grid
American Institute of Aeronautics and Astronautics
6
LAURA was also used for Phoenix supersonic aerodynamics. However, it has been observed before that LAURA full-body solutions predict a CA that exceeds Viking test data.10 At low supersonic speeds, computational tools have difficulty predicting the effects of blunt capsule afterbody pressures. This deficiency often results in mis-prediction of base pressures and their contribution to axial force. Consequently, a correction term was developed to estimate the base pressure addition to forebody CA:
(1)
Equation 1 was derived from Viking flight data and was used for Pathfinder and MER10 supersonic CA. No corrections were made for CN and Cm other than through the contribution of CA to the moment coefficient.
The Phoenix supersonic parachute deployment was expected to occur near Mach 1.65. The parachute deployment was designed to open within an envelope of Mach number and dynamic pressure and deployment timing was critical to the successful completion of the EDL sequence.7 In order to continue modeling the capsule aerodynamics under the parachute in trajectory simulations, transonic aerodynamics were needed. Given the lack of confidence in computational tools in the transonic regime, the database from Mach 1.5 to 0.4 was taken directly from Viking wind tunnel data in air16. No corrections were made to the nominal data to account for differences in capsule geometry or atmospheric gas, since parachute aerodynamics would dominate.
The database was structured to take advantage of the Phoenix capsule’s axisymmetric shape. Total angle-of-
attack, αT = cos-1[cos(α)cos(β)], is defined in the plane containing the velocity vector and capsule symmetry axis (Figure 6). Since the capsule was axisymmetric, aerodynamic coefficients were specified in the αT plane and then decomposed into the α and β planes. This approach significantly reduced the number of data points required in the database, since individual combinations of α and β could be simulated with a single αT value. Each of the points along the design trajectory (Figure 5) was populated with data at multiple values of αT using the methods in Table 2. The αT ranges were selected to envelope all possible angle-of-attack excursions that could arise in a six degree-of-freedom trajectory analysis. Aerodynamics between regimes were linearly interpolated using the appropriate independent variables.
D. Dynamic Pitch Damping Different flight regimes were also delineated for Phoenix dynamic pitch damping characteristics. Table 3 and
Figure 9 summarize the flight regimes and prediction methods. Blunt bodies such as the Phoenix capsule are known to be dynamically unstable at supersonic Mach numbers.17 This instability is characterized by pitch amplitude growth at supersonic Mach numbers. The MER program conducted ballistic range testing to determine pitch damping characteristics at supersonic Mach numbers.17 Given the similarity in capsule geometries, the MER dynamic damping data were used in the Phoenix database. Dynamic stability is generally predicted when Cmq (= Cnr) is negative. Newtonian methods were used for MER10 to predict stable hypersonic pitch damping. In regions were no data exist, the Phoenix capsule was assumed to be neutrally stable (Cmq = Cnr = 0).
It was important to understand the magnitude of oscillation growth near parachute deployment because a
successful deployment and inflation was less likely to occur with increasing angle-of-attack. Entry trajectory reconstruction of the Pathfinder18 and MER19 capsules showed dynamic oscillation growth at supersonic Mach numbers prior to parachute deployment. The requirement for Phoenix was that the total angle-of-attack at parachute deployment was less than 10 deg. Flight data reconstruction7 estimated the angle at deployment to be less than 5 deg.

American Institute of Aeronautics and Astronautics
7
E. Uncertainties The assessment of Phoenix entry system performance and robustness was based primarily on Monte Carlo
trajectory simulations6 using the Program to Optimize Simulated Trajectories20 (POST). The analyses included models for navigation, atmosphere, mass properties, and aerodynamics, among others. Each model included nominal data as well as dispersions that reflect the uncertainties inherent in the methods used to generate the data. No direct aerodynamics measurements have been obtained in flight for any past Mars capsules to verify the predictions. Thus, aerodynamics uncertainties for Phoenix were largely based on past experience and engineering judgment.
Table 4 shows the uncertainties that were used for the Phoenix aerodynamic coefficients in each flight regime.
The CA uncertainty, taken directly from MER, is smallest in the hypersonic regime where the forebody surface pressures are dominant. The uncertainty increases at supersonic Mach numbers where afterbody effects are not well modeled and the Viking base pressure correction was used. Other uncertainty magnitudes were changed slightly from values used for MER21. First, pitching (and yawing) moment uncertainty was modeled both as an adder (trim angle shift) and a multiplier (pitching moment slope change). MER analysis only included an adder uncertainty for the moments. The Phoenix moment uncertainties were designed to account for possible aerodynamic shape changed due to asymmetric thermal protection system (TPS) ablation and/or structural deformation. Minimal TPS ablation was expected based on the predicted22 aerothermal environments. Second, the supersonic pitch damping uncertainty was increased for Phoenix given that its parachute deployment Mach number (~1.65) was less than the MER value (~1.8) and the uncertainties in the MER ballistic range data increase with decreasing Mach number. Finally, a rolling moment (Cl) uncertainty was implemented to account for possible small torques during entry, again due to aerodynamic shape change. A rolling moment uncertainty was not needed for Pathfinder or MER since those capsules were spin-stabilized.
Table 3. Dynamic Pitch Damping Flight Regimes
Flight Regime Range of Applicability Input Parameters Method Free-Molecular Kn > 50 N/A No Data (Cmq = Cnr = 0)
Transitional 0.002 < Kn < 50 N/A Bridging Function = f(Kn) Hypersonic Kn < 0.002, M∞ > 5 N/A Newtonian (Cmq = Cnr = -0.338)10 Supersonic 1 < M∞ < 5, 0 < αT < 30 M∞, α, β MER Ballistic Range17 Subsonic M∞ < 1 N/A No Data (Cmq = Cnr = 0)
Figure 8. Dynamic Pitch Damping Flight Regimes Along the Design Trajectory

American Institute of Aeronautics and Astronautics
8
III. Results and Discussion The following sections summarize the statics and dynamics databases, implementation for trajectory analyses,
and sensitivities to aerodynamics uncertainties, LAURA grid resolution, atmospheric density, and radial center-of-gravity (CG) location.
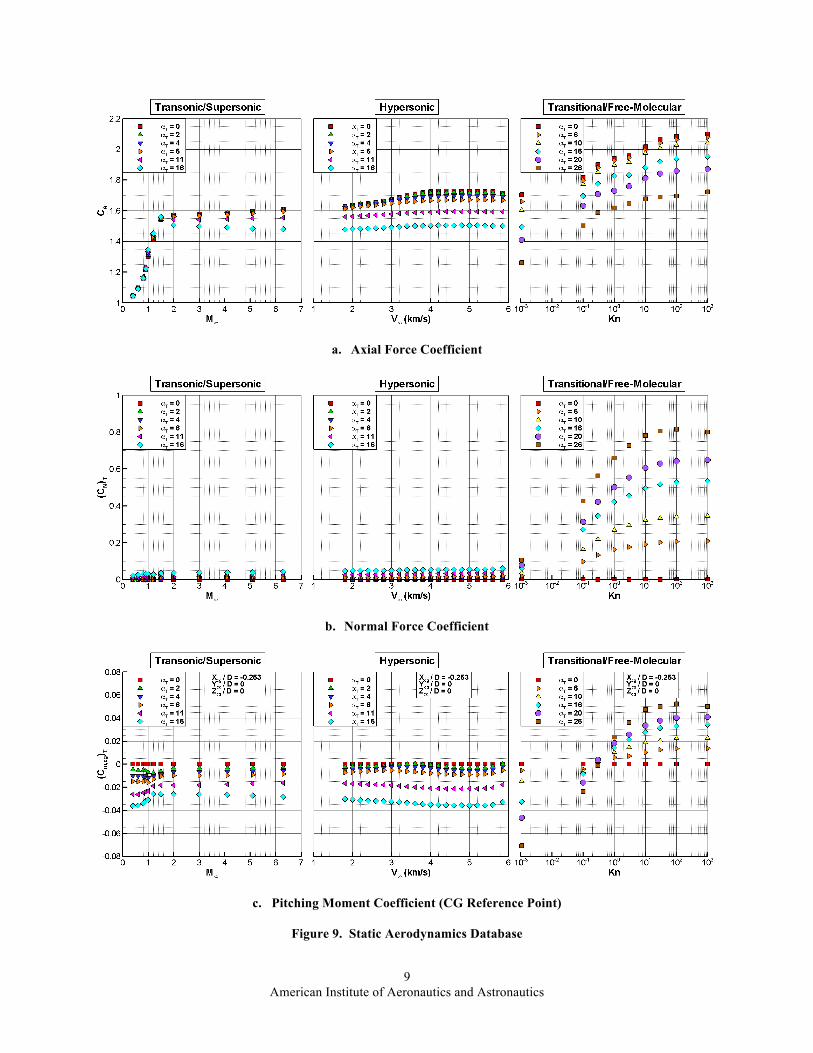
A. Static Aerodynamics Database Figure 9 shows the full static aerodynamics database. The anchor points for axial, normal, and pitching moment
coefficients are shown in each flight regime as a function of the appropriate independent parameters. The normal force and pitching moment coefficients are shown in the αT plane. The database routine decomposes those coefficients into the α (CN, Cm,cg) and β (CY, Cn,cg) planes for six degree-of-freedom trajectory analysis. The axial force coefficient was predicted to decrease continuously as the capsule descended through the rarefied to continuum regimes. The sensitivity of CA to angle-of-attack decreases as the capsule decelerates. Based on Viking wind tunnel data16, CA decreases rapidly through the transonic regime. Those data were used for analysis of the capsule under parachute. Similarly, the normal force coefficient decreases continuously as the capsule decelerates through all regimes. In the continuum regimes, CN is an order of magnitude smaller than CA, and thus contributes negligibly to the static aerodynamics. The pitching moment is shown referenced to the nominal capsule CG location 0.253 diameters behind the nose on the symmetry axis. There are regions in the rarefied (Kn > 0.2) and hypersonic continuum regimes (3.6 km/s) where Cm,cg is positive at positive angles-of-attack. This behavior was observed for Phoenix7, Pathfinder,18 and MER,19 and will be discussed in a later section.
Table 4. Aerodynamics Uncertainties
Statics/Dynamics Flight Regime Coefficient 3σ Uncertainty Distribution CA ±5%
CN, CY ±0.01 Statics Transitional/Free-Molecular Kn > 0.1
Cm, Cn ±0.005 x [1.2 ,0.8] Normal
CA ±3% CN, CY ±0.01 Cm, Cn ±0.002 x [1.2 ,0.8] Statics Hypersonic
Kn < 0.001, M∞ > 10 Cl 1.24 x 10⁻⁶
Normal
CA ±10% CN, CY ±0.01 Cm, Cn ±0.005 x [1.2 ,0.8]
Statics Supersonic 1.5 < M∞ < 5
Cl 1.24 x 10⁻⁶
Normal
CA ±10% CN, CY 1.25 x Supersonic Cm, Cn ±0.005 x [1.2 ,0.8] Statics Transonic
0.4 < M∞ < 1.5 Cl 1.24 x 10⁻⁶
Normal
Dynamics Hypersonic M∞ > 6 Cmq, Cnr ±0.15 Normal
Dynamics Supersonic 1.5 < M∞ < 3 Cmq, Cnr
+ 0.5 x [2.5, 0.5] - 0.5 + [0.1, 0.0] Uniform
Dynamics Transonic 1 < M∞ < 1.5 Cmq, Cnr 1.25 x Supersonic Uniform
American Institute of Aeronautics and Astronautics
9
a. Axial Force Coefficient
b. Normal Force Coefficient
c. Pitching Moment Coefficient (CG Reference Point)
Figure 9. Static Aerodynamics Database

American Institute of Aeronautics and Astronautics
10
B. Dynamic Pitch Damping Database The nominal dynamic pitch damping database was taken directly from the MER database (Figure 10). The
nominal values for Cmq were used as is for Phoenix since the capsule shapes were similar. Neutral stability was assumed in the rarefied regime (Cmq = 0). Newtonian aerodynamics were used in the MER database to predict stable hypersonic pitch damping (Cmq = -0.338). The MER supersonic ballistic range data17 predicted dynamically unstable behavior (Cmq > 0) at the nominal trim α = 0 for Mach numbers less than 3.5. This capsule characteristic causes attitude oscillation growth prior to parachute deployment, which has been observed in Pathfinder18 and MER19 flight data. Phoenix reconstruction analysis7 also showed this oscillation growth.
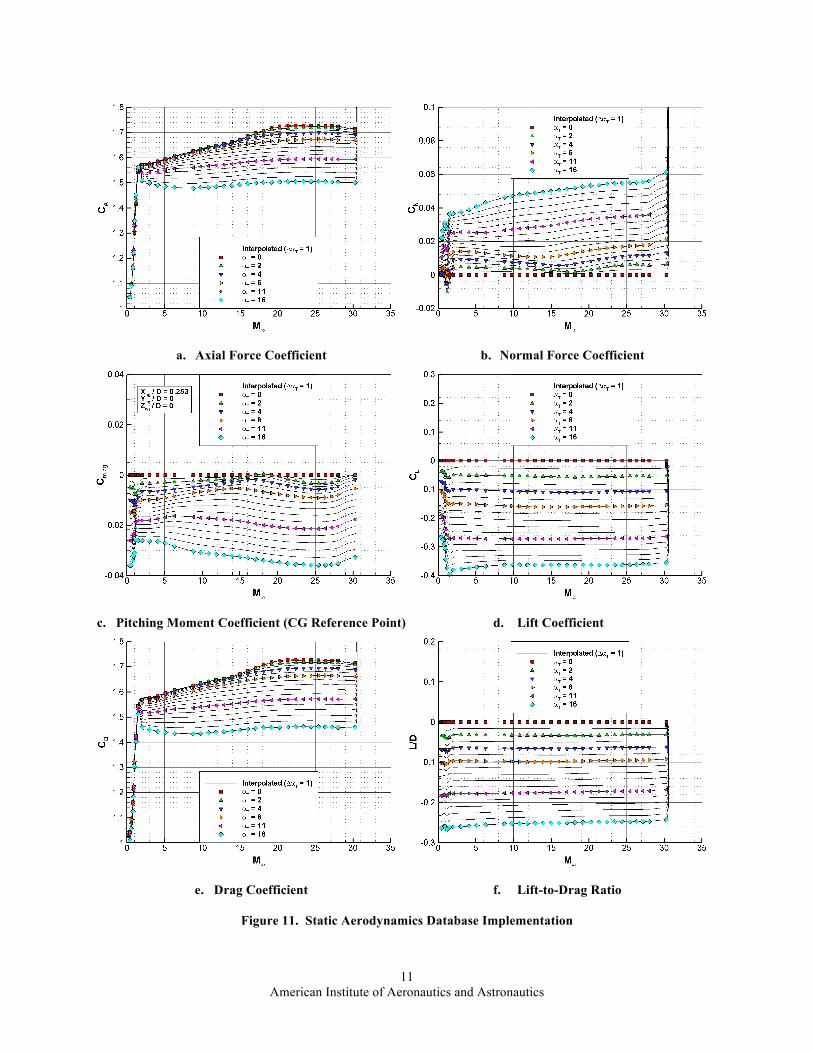
C. Database Implementation The aerodynamics database was implemented as a subroutine with tabulated coefficients as a function of total
angle-of-attack, Knudsen number, atmosphere-relative velocity, and Mach number. The database was integrated into POST to calculate the entry capsule’s flight through the atmosphere. The database returns the appropriate static (Table 2) and dynamic (Table 3) coefficients, depending on the flight regime. Figure 10 shows the entire six degree-of-freedom statics database mapped onto the reference trajectory as a function of Mach number. Anchor data points are shown only for the continuum regimes. Aerodynamic coefficients between anchor data points were obtained through interpolation on αT and either Knudsen number (free-molecular/transitional), relative velocity (hypersonic/supersonic), or Mach number (supersonic/transonic). The gap between Mach 8.8 and 6.3 is the transition between LAURA forebody-only flowfield solutions and forebody solutions with the Viking base pressure correction of CA. The Phoenix entry capsule’s blunt forebody generates negative lift for a positive angle-of-attack. Negative lift occurs because capsule lift (and drag) is dominated by the axial force coefficient (CA >> CN):
€
CL = -CA sinα + CN cosα (2)
€
CD = CA cosα + CN sinα (3) Implementation of the pitch damping database at supersonic Mach numbers is shown in Figure 12. The MER
ballistic range data points are shown for Mach numbers between 1 and 3.5, where the Cmq variation is nearly linear for a given αT. Below Mach 1, neutral stability was assumed (Cmq = 0).
Figure 10. Dynamic Pitch Damping Database
American Institute of Aeronautics and Astronautics
11
a. Axial Force Coefficient
b. Normal Force Coefficient
c. Pitching Moment Coefficient (CG Reference Point)
d. Lift Coefficient
e. Drag Coefficient
f. Lift-to-Drag Ratio
Figure 11. Static Aerodynamics Database Implementation

American Institute of Aeronautics and Astronautics
12
D. Static Pitch Stability
The requirements for a statically stable trim condition are Cm,cg = 0 and ∂Cm,cg/∂α < 0. The nominal Phoenix radial CG location was on the symmetry axis (Ycg = Zcg = 0) with a natural trim angle-of-attack of zero. This condition is generally satisfied for a 70-degree spherically-blunted conical forebody such as the Phoenix entry capsule. However, it has been predicted and observed in previous Mars ballistic entries that there are regions along the flight trajectory where the stable trim point is not at α = 0. This condition, termed bounded static instability, was originally predicted for Pathfinder and observed in the flight data.18 The prediction was based on LAURA non-equilibrium flowfield calculations at hypersonic Mach numbers. The instability arises from the non-equilibrium chemistry effects on the sonic line attachment and its influence on the surface pressure distribution.23 During these instabilities, the pressure distribution does not produce a restoring moment when the angle-of-attack deviates from zero. This instability was also predicted10 and observed19 for the MER capsules since the same physics applied for those entries.
The Phoenix statics database also predicted the bounded instability phenomenon for its entry trajectory. The
velocities at which the instabilities were predicted for Phoenix differ slightly from Pathfinder and MER because the flow physics depend on the specifics of the trajectory velocity-altitude profile. Figure 13 shows hypersonic pitching moment and pitching moment slope based on Phoenix database output. This region of the database was based on LAURA chemically-reacting forebody solutions. At a velocity of 5 km/s, the pitching moment slope at the natural trim point (α = 0) is negative and linear with angle-of-attack. The slope remains negative at 4 km/s, but the curve is non-linear. The slope at α = 0 becomes positive and is still non-linear as the capsule decelerates further to 3.8 km/s. At this velocity, the natural trim point is not at α = 0, but at about α = 2 deg. This instability persists down a velocity near 3.3 km/s. At 3.2 km/s and below, the capsule natural trim point was predicted to return to α = 0 with a linear pitching moment curve. Reference 7 shows the attitude reconstruction of the Phoenix entry that confirms the predicted hypersonic instability.
Figure 12. Dynamic Pitch Damping Database Implementation
a. Pitching Moment Coefficient (CG Reference Point)
b. Pitching Moment Coefficient Slope at α = 0 (CG Reference Point)
Figure 13. Static Pitch Stability in the Hypersonic Flight Regime

American Institute of Aeronautics and Astronautics
13
Figure 14 shows that there are other regions where the capsule was not predicted to trim at α = 0. In the free-molecular regime and part of the transitional regime, the capsule is inherently unstable (Kn > 0.2). This instability was not of concern since the aerodynamic forces were small and the RCS thrusters were designed to keep the capsule pointed in the correct orientation. The first bounded instability was estimated to occur across the boundary between the transitional and hypersonic regimes. The capsule was predicted to return to trim at α = 0 before the second instability region just below 4 km/s and near peak dynamic pressure. The first bounded instability was also predicted for Pathfinder9 and MER10. Reference 7 shows that all instabilities occurred as predicted for the Phoenix entry.
E. Sensitivities Aerodynamic dispersion effects on Phoenix EDL system performance were an important aspect of pre-flight
trajectory analyses. The following sections show trim aerodynamics sensitivities to uncertainties on axial force and pitching moment. Also, additional LAURA results were generated to show sensitivities to grid resolution and atmospheric density. Finally, the effects of an off-axis radial CG location are shown.
1. Static Aerodynamics Uncertainties
The largest aerodynamic contributors to landing
ellipse size are uncertainties on pitching moment and axial force. Figure 15 figure shows ±3σ uncertainty bounds on axial force coefficient at the nominal trim angle. The uncertainties were applied as shown in Table 4 for the various flight regimes. Axial force uncertainty is smallest in the hypersonic flight regime (±3%), where the flow is Newtonian and dominated by the forebody pressure. The uncertainty envelope linearly increases with decreasing Mach number from 10 to 5. Below Mach 5, the uncertainty is fixed at ±10%. The larger supersonic uncertainty reflects the inherent difficulty in predicting afterbody effects on CA. When integrated within POST, a CA uncertainty affects landing ellipse size due to downrange dispersions.
Figure 14. Nominal Trim Angle-of-Attack (with Bounded Static Instabilities) and Freestream Dynamic Pressure
Figure 15. Axial Force Coefficient ±3σ Uncertainties

American Institute of Aeronautics and Astronautics
14
The effects of a +3σ pitching moment uncertainty on trim aerodynamics are shown in Figure 16. The uncertainty was applied as an adder and multiplier as shown in Table 4. The adder shifts up or down the pitching moment curves, and thus shifts the trim angle. The sensitivity to the multiplier is best done through six degree-of-freedom trajectory simulations. The effect of the moment uncertainty on trim angle-of-attack varies across the trajectory, with a peak angle of 4.2 deg occurring near 3.3 km/s. A negative CL is produced at positive trim angles and CD decreases by less than 2 percent from nominal. At the second bounded instability region, the trim L/D magnitude reaches as high as 0.068 with the +3σ uncertainty. Since Phoenix was not spin-stabilized, any lift force would cause a lateral movement of the capsule that was not canceled out by a spinning motion. The highest trim angle was predicted to occur near peak dynamic pressure (Figure 14), so the lift force is highest during this time and contributes to growth of the landing ellipse. At supersonic velocities below 2 km/s (≈ Mach 10), the adder uncertainty linearly increases to a maximum value of 0.005 at Mach 5 (~ 1 km/s) and the trim angle is near 3 deg.
2. Grid Resolution
The supersonic and hypersonic database points were computed using LAURA on the baseline grid shown in
Figure 7. Grid resolution effects were determined by re-computing at select velocities the force and moment coefficients on a grid with twice the resolution in each direction (8 times the number of volume cells). Figure 17
a. Angle-of-Attack
b. Lift Coefficient
c. Drag Coefficient
d. Lift-to-Drag Ratio
Figure 16. Effect of +3σ Pitching Moment Uncertainty on Trim Aerodynamics

American Institute of Aeronautics and Astronautics
15
shows axial and pitching moment coefficients at hypersonic velocities on the two grids. The CA calculated on the fine grid tends to be slightly higher than the CA calculated on the baseline grid. However, the variation for any common velocity and αT combination is less than 0.4 percent. This difference was acceptable because it is much less than the 3 percent hypersonic CA uncertainty (Table 4). At non-zero angles, the fine grid pitching moment coefficients are larger in magnitude (higher static stability) than the coarse grid coefficients by up to 10 percent. These differences in Cm,cg are covered by the pitching moment slope uncertainty of ±20 percent (Table 4). Finally, the fine grid results also show a positive pitching moment coefficient at 3.6 km/s and αT = 2 deg, which is where the second bounded static instability is located. Overall, the differences between the baseline and fine grid results were considered to be comfortably within the uncertainty bounds.
3. Atmospheric Density
The LAURA hypersonic flowfield solutions were computed on a design trajectory with a unique profile (Figure
3). If, on the day of entry, the encountered velocity-altitude profile (i. e. velocity-density profile) was different than the design trajectory, the predicted aerodynamics would not account for density effects since the hypersonic database is a function only of velocity and αT (Table 2). Any changes to the entry velocity, entry FPA, ballistic coefficient, or atmospheric density profile compared to the reference trajectory would result in a different velocity-altitude path. In order to determine the effects of not explicitly accounting for atmospheric density, select LAURA hypersonic solutions were re-computed using dispersed densities from the design trajectory values. A reconstructed density profile was estimated7 using nominal aerodynamics and showed a density variation less than 7 percent from expected values.
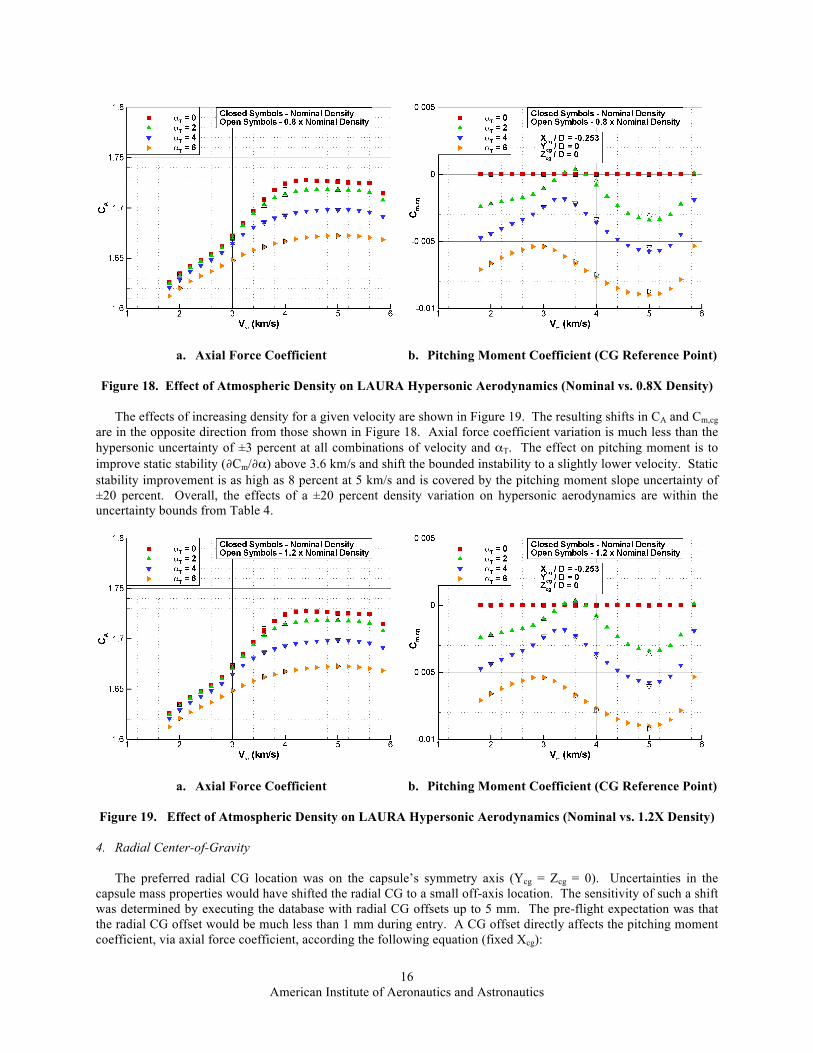
Figure 18 shows the sensitivity of LAURA hypersonic CA and Cm,cg to atmospheric densities that are 20 percent
below the design trajectory values for a given velocity. At velocities between 2 and 5 km/s, the predicted CA is shown to be insensitive to an atmospheric density reduction of 20 percent. At any given velocity and αT combination, CA varies by less than 0.1 percent with density, which is much less than the hypersonic CA uncertainty of ±3 percent. The sensitivity of Cm,cg to density is most noticeable above 3.6 km/s, where the pitching moment coefficient slope (∂Cm/∂α) is still negative and stable, but less stable than the nominal database prediction by up to 10 percent. The ±20 percent pitching moment slope uncertainty covers the variations seen in Figure 18. Finally, the results show that a density decrease would cause the capsule to encounter the second bounded static instability (positive Cm,cg at αT = 2 deg) at a slightly higher velocity than was predicted by the nominal database.
a. Axial Force Coefficient
b. Pitching Moment Coefficient (CG Reference Point)
Figure 17. Effect of Grid Resolution on LAURA Hypersonic Aerodynamics
American Institute of Aeronautics and Astronautics
16
The effects of increasing density for a given velocity are shown in Figure 19. The resulting shifts in CA and Cm,cg
are in the opposite direction from those shown in Figure 18. Axial force coefficient variation is much less than the hypersonic uncertainty of ±3 percent at all combinations of velocity and αT. The effect on pitching moment is to improve static stability (∂Cm/∂α) above 3.6 km/s and shift the bounded instability to a slightly lower velocity. Static stability improvement is as high as 8 percent at 5 km/s and is covered by the pitching moment slope uncertainty of ±20 percent. Overall, the effects of a ±20 percent density variation on hypersonic aerodynamics are within the uncertainty bounds from Table 4.
4. Radial Center-of-Gravity
The preferred radial CG location was on the capsule’s symmetry axis (Ycg = Zcg = 0). Uncertainties in the
capsule mass properties would have shifted the radial CG to a small off-axis location. The sensitivity of such a shift was determined by executing the database with radial CG offsets up to 5 mm. The pre-flight expectation was that the radial CG offset would be much less than 1 mm during entry. A CG offset directly affects the pitching moment coefficient, via axial force coefficient, according the following equation (fixed Xcg):
a. Axial Force Coefficient
b. Pitching Moment Coefficient (CG Reference Point)
Figure 18. Effect of Atmospheric Density on LAURA Hypersonic Aerodynamics (Nominal vs. 0.8X Density)
a. Axial Force Coefficient
b. Pitching Moment Coefficient (CG Reference Point)
Figure 19. Effect of Atmospheric Density on LAURA Hypersonic Aerodynamics (Nominal vs. 1.2X Density)
American Institute of Aeronautics and Astronautics
17
€
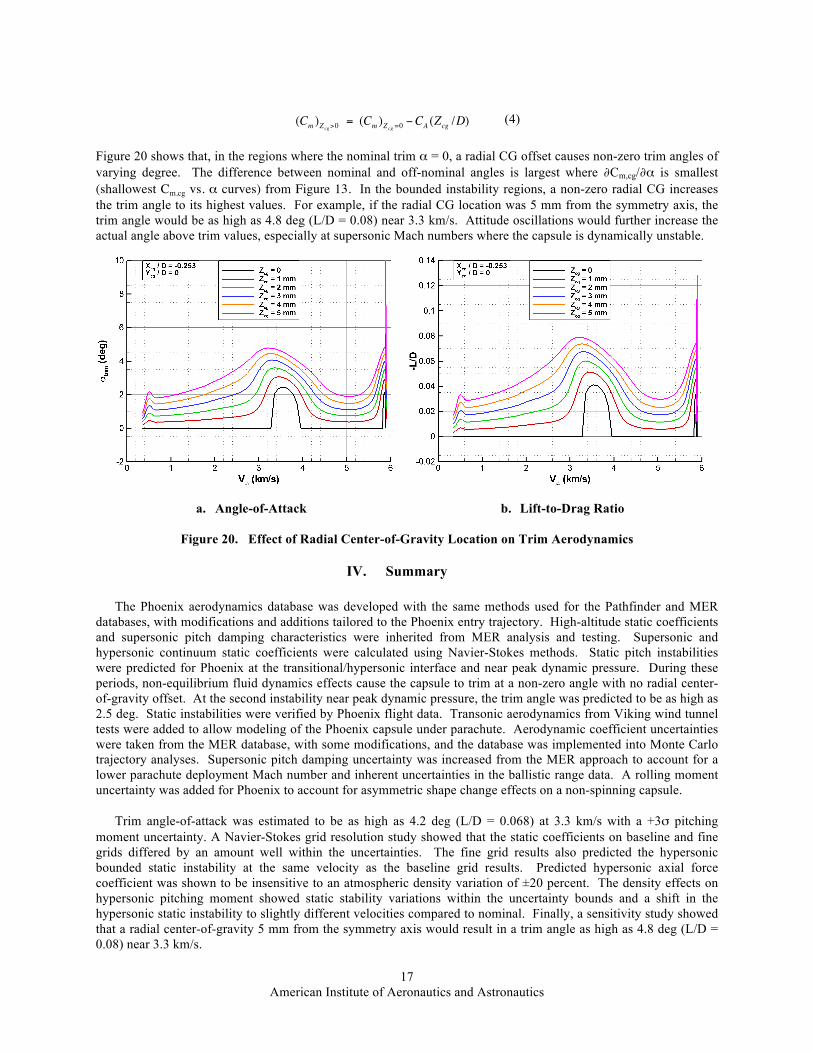
(Cm )Zcg>0 = (Cm )Zcg =0 −CA (Zcg /D) (4) Figure 20 shows that, in the regions where the nominal trim α = 0, a radial CG offset causes non-zero trim angles of varying degree. The difference between nominal and off-nominal angles is largest where ∂Cm,cg/∂α is smallest (shallowest Cm,cg vs. α curves) from Figure 13. In the bounded instability regions, a non-zero radial CG increases the trim angle to its highest values. For example, if the radial CG location was 5 mm from the symmetry axis, the trim angle would be as high as 4.8 deg (L/D = 0.08) near 3.3 km/s. Attitude oscillations would further increase the actual angle above trim values, especially at supersonic Mach numbers where the capsule is dynamically unstable.
IV. Summary The Phoenix aerodynamics database was developed with the same methods used for the Pathfinder and MER
databases, with modifications and additions tailored to the Phoenix entry trajectory. High-altitude static coefficients and supersonic pitch damping characteristics were inherited from MER analysis and testing. Supersonic and hypersonic continuum static coefficients were calculated using Navier-Stokes methods. Static pitch instabilities were predicted for Phoenix at the transitional/hypersonic interface and near peak dynamic pressure. During these periods, non-equilibrium fluid dynamics effects cause the capsule to trim at a non-zero angle with no radial center-of-gravity offset. At the second instability near peak dynamic pressure, the trim angle was predicted to be as high as 2.5 deg. Static instabilities were verified by Phoenix flight data. Transonic aerodynamics from Viking wind tunnel tests were added to allow modeling of the Phoenix capsule under parachute. Aerodynamic coefficient uncertainties were taken from the MER database, with some modifications, and the database was implemented into Monte Carlo trajectory analyses. Supersonic pitch damping uncertainty was increased from the MER approach to account for a lower parachute deployment Mach number and inherent uncertainties in the ballistic range data. A rolling moment uncertainty was added for Phoenix to account for asymmetric shape change effects on a non-spinning capsule.
Trim angle-of-attack was estimated to be as high as 4.2 deg (L/D = 0.068) at 3.3 km/s with a +3σ pitching
moment uncertainty. A Navier-Stokes grid resolution study showed that the static coefficients on baseline and fine grids differed by an amount well within the uncertainties. The fine grid results also predicted the hypersonic bounded static instability at the same velocity as the baseline grid results. Predicted hypersonic axial force coefficient was shown to be insensitive to an atmospheric density variation of ±20 percent. The density effects on hypersonic pitching moment showed static stability variations within the uncertainty bounds and a shift in the hypersonic static instability to slightly different velocities compared to nominal. Finally, a sensitivity study showed that a radial center-of-gravity 5 mm from the symmetry axis would result in a trim angle as high as 4.8 deg (L/D = 0.08) near 3.3 km/s.
a. Angle-of-Attack
b. Lift-to-Drag Ratio
Figure 20. Effect of Radial Center-of-Gravity Location on Trim Aerodynamics

American Institute of Aeronautics and Astronautics
18
References
1 http://nssdc.gsfc.nasa.gov/nmc/masterCatalog.do?sc=MS2001L, “Mars Surveyor 2001 Lander” 2 Stephenson, A. G., et al, “Mars Climate Orbiter Mishap Investigation Board Phase I Report,” November 1, 1999. 3 Cruz, M. I., and Chadwick, C., “A Mars Polar Lander Failure Assessment,” AIAA-2000-4118, AIAA Atmospheric Flight
Mechanics Conference, Denver, Colorado, August 14-17, 2000. 4 Goldstein, B., and Shotwell, R., “Phoenix - The First Mars Scout Mission (A Mid-Term Report),” IAC-06-A3.3.02, 57th
International Astronautical Congress, Valencia, Spain, October 2-6, 2006. 5 Grover, M. R. Cichy, B. D., and Desai, P. N., “Overview of the Mars Phoenix Entry, Descent, and Landing System
Architecture,” AIAA 2008-7218, AIAA Guidance, Navigation, and Control Conference, Honolulu, Hawaii, August 18-21, 2008. 6 Prince, J. L., Desai, P. N., Queen, E. M., and Grover, M. R., “Mars Phoenix Entry, Descent, and Landing Simulation and
Modeling Analysis,” AIAA 2008-7507, AIAA Guidance, Navigation, and Control Conference, Honolulu, Hawaii, August 18-21, 2008.
7 Desai, P. N., Prince, J. L., and Queen, E. M., Cruz, J. R., and Grover, M. R., “Entry, Descent, and Landing Performance of the Mars Phoenix Lander,” AIAA 2008-7346, AIAA Guidance, Navigation, and Control Conference, Honolulu, Hawaii, August 18-21, 2008.
8 Dyakonov, A. D., Glass, C. E., Desai, P. N., and Van Norman, J., “Aerodynamic Interference Effects Due to Reaction Control System for the Mars Phoenix Entry Capsule,” AIAA 2008-7220, AIAA Guidance, Navigation, and Control Conference, Honolulu, Hawaii, August 18-21, 2008.
9 Braun, R. D., Powell, R. W., Engelund, W. C., Gnoffo, P. A., Weilmunster, J. K., and Mitcheltree, R. A., “Mars Pathfinder Six-Degree-of-Freedom Entry Analysis,” Journal of Spacecraft and Rockets, Vol. 32, No. 6, November-December 1995, pp. 993–1000.
10 Schoenenberger, M., Cheatwood, F. M., and Desai, P. N., “Static Aerodynamics of the Mars Exploration Rover Entry Capsule,” AIAA-2005-0056, 43rd AIAA Aerospace Sciences Meeting and Exhibit, Reno, Nevada, January 10-13, 2005.
11 Lebeau, G. J., and Lumkin, F. E., “Application Highlights of the DSMC Analysis Code (DAC) Software for Simulating Rarefied Flows,” Computer Methods in Applied Mechanics and Engineering, Vol. 191, No. 6-7, pp. 595-609, 2001.
12 Cheatwood, F. M. and Gnoffo, P. A., “User’s Manual for the Langley Aerothermodynamic Upwind Algorithm (LAURA),” NASA TM-4674, April 1996.
13 Park, C., Howe, J. T., Jaffe, R. L., and Candler, G. V., “Review of Chemical-Kinetic Problems of Future NASA Missions, II: Mars Entries,” Journal of Thermophysics and Heat Transfer, Vol. 8, No.1, January-March 1994.
14 Roe, P. L., “Approximate Reimann Solvers, Parameter Vectors and Difference Schemes,” Journal of Computational Physics, Vol. 43, No. 2, 1981.
15 Yee, H. C., “On Symmetric and TVD Upwind Schemes,” NASA TM-86842, September 1985. 16 McGhee, R. J., Siemers III, P. M., and Pelt, R. E., “Transonic Aerodynamic Characteristics of the Viking Entry and Lander
Configurations,” NASA TM X-2354, NASA Langley Research Center, September 1971. 17 Schoenenberger, M., Hathaway, W., Yates, L., and Desai, P. N., “Ballistic Range Testing of the Mars Exploration Rover
Entry Capsule,” AIAA-2005-0055, 43rd AIAA Aerospace Sciences Meeting and Exhibit, Reno, Nevada, January 10-13, 2005. 18 Gnoffo, P. A., Braun, R. D., Weilmuenster, K. J., Mitcheltree, R. A., Engelund, W. C., and Powell, R. W., ”Prediction and
Validation of Mars Pathfinder Hypersonic Aerodynamic Data Base,” Journal of Spacecraft and Rockets, Vol. 36, No. 3, May-June 1999.
19 Tolson, R. H., Willcockson, W. H., Desai, P. N., and Thomas, P., “Anomalistic Disturbance Torques During the Entry Phase of the Mars Exploration Rover Missions – A Telemetry and Mars-Surface Investigation,” AAS Paper 06-087, 29th AAS Guidance and Control Conference, Breckenridge, Colorado, February 2006.
20 Brauer, G. L., Cornick, D. E., and Stevenson, R., “Capabilities and Applications of the Program to Optimize Simulated Trajectories (POST),” NASA CR-2770, February 1977.
21 Desai, P. N., Schoenenberger, M., and Cheatwood, F. M., “Mars Exploration Rover Six-Degree-of-Freedom Entry Trajectory Analysis,” Journal of Spacecraft and Rockets, Vol. 32, No. 6, November-December 1995, pp. 1019–1025.
22 McDaniel, R. D., Wright, M. J., and Songer, J. T., “Aeroheating Predictions for Phoenix Entry Vehicle,” AIAA Paper 2008-1279, 46th AIAA Aerospace Sciences Meeting and Exhibit, Reno, Nevada, January 7-10, 2008.
23 Gnoffo, P. A., Weilmuenster, K. J., Braun, R. D., and Cruz, C. I., “Influence of Sonic-Line Location on Mars Pathfinder Probe Aerothermodynamics,” Journal of Spacecraft and Rockets, Vol. 33, No. 2, March-April 1996.