aerodynamic performance of a compact, high work-factor ... · • aerodynamic performance of an...
TRANSCRIPT
National Aeronautics and Space Administration
www.nasa.gov
Aerodynamic Performance of a Compact, High Work-Factor Centrifugal Compressor
at the Stage and Subcomponent LevelEdward P. Braunscheidel & Gerard E. Welch - NASA Glenn Research Center
Gary J. Skoch – Army Research LaboratoryGorazd Medic and Om P. Sharma – United Technologies Research Center
1
50th AIAA/ASME/SAE/ASEE Joint Propulsion ConferenceJuly 28-30, 2014, Cleveland, OH
https://ntrs.nasa.gov/search.jsp?R=20140017398 2020-04-04T01:15:51+00:00Z
National Aeronautics and Space Administration
www.nasa.gov
Aerodynamic Performance of a Compact, High Work-FactorCentrifugal Compressor at the Stage and Subcomponent Level
• Background and Scope• Test Article and Facility Description• Key Instrumentation• Stage and Subcomponent Results• Performance Assessment vs. Pre-test CFD• Summary
2
National Aeronautics and Space Administration
www.nasa.gov
Background and Scope
3
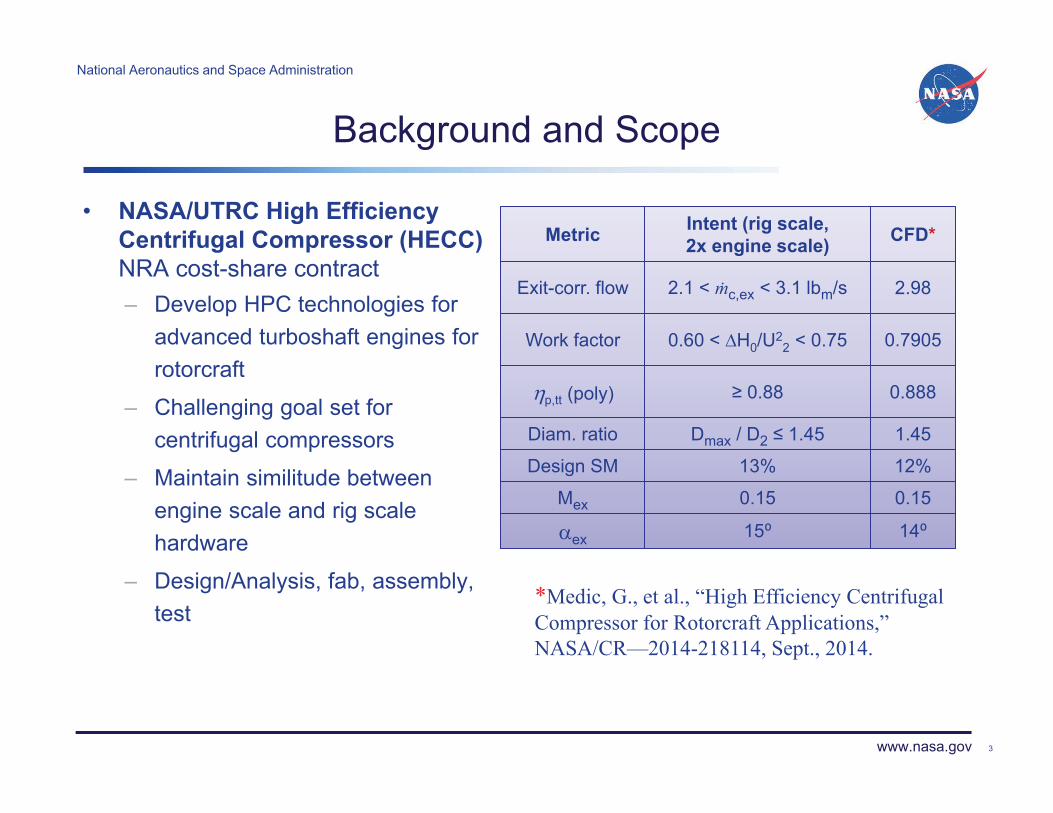
• NASA/UTRC High Efficiency Centrifugal Compressor (HECC) NRA cost-share contract– Develop HPC technologies for
advanced turboshaft engines for rotorcraft
– Challenging goal set for centrifugal compressors
– Maintain similitude between engine scale and rig scale hardware
– Design/Analysis, fab, assembly, test
Metric Intent (rig scale,2x engine scale) CFD*
Exit-corr. flow 2.1 < �c,ex < 3.1 lbm/s 2.98
Work factor 0.60 < �H0/U22 < 0.75 0.7905
�p,tt (poly) � 0.88 0.888
Diam. ratio Dmax / D2 � 1.45 1.45
Design SM 13% 12%
Mex 0.15 0.15
�ex 15� 14�
*Medic, G., et al., “High Efficiency Centrifugal Compressor for Rotorcraft Applications,” NASA/CR—2014-218114, Sept., 2014.
National Aeronautics and Space Administration
www.nasa.gov
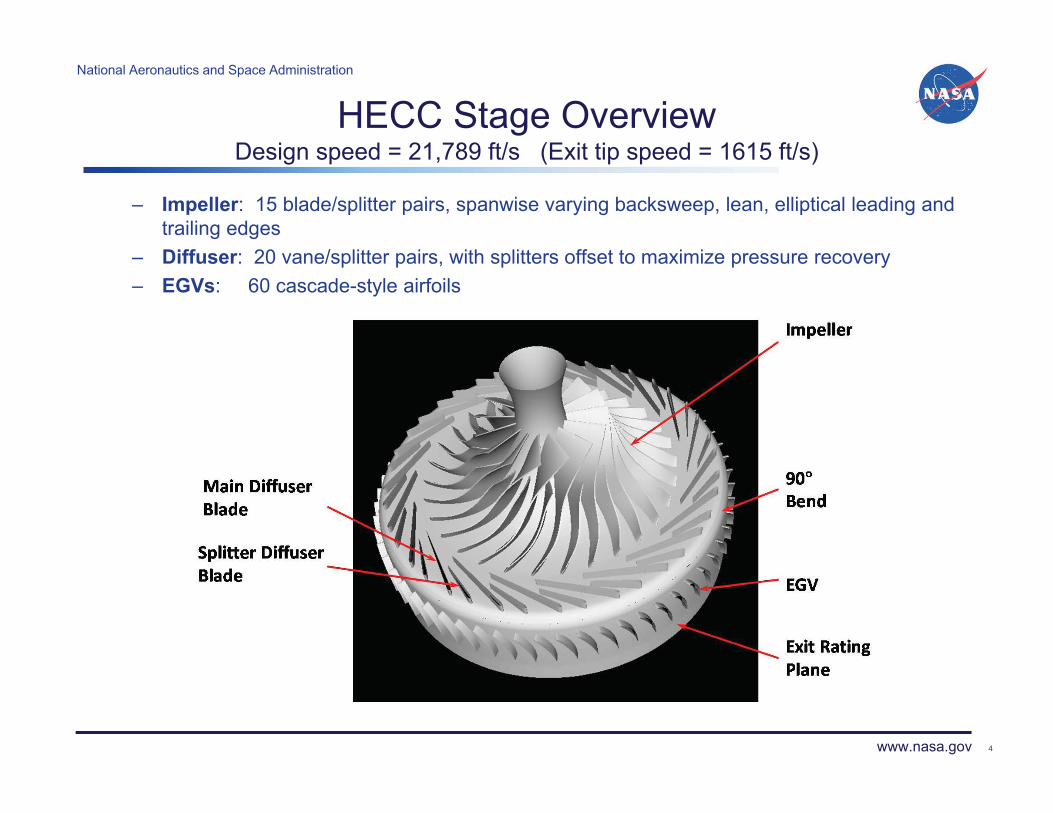
HECC Stage OverviewDesign speed = 21,789 ft/s (Exit tip speed = 1615 ft/s)
4
– Impeller: 15 blade/splitter pairs, spanwise varying backsweep, lean, elliptical leading and trailing edges
– Diffuser: 20 vane/splitter pairs, with splitters offset to maximize pressure recovery– EGVs: 60 cascade-style airfoils
National Aeronautics and Space Administration
www.nasa.gov
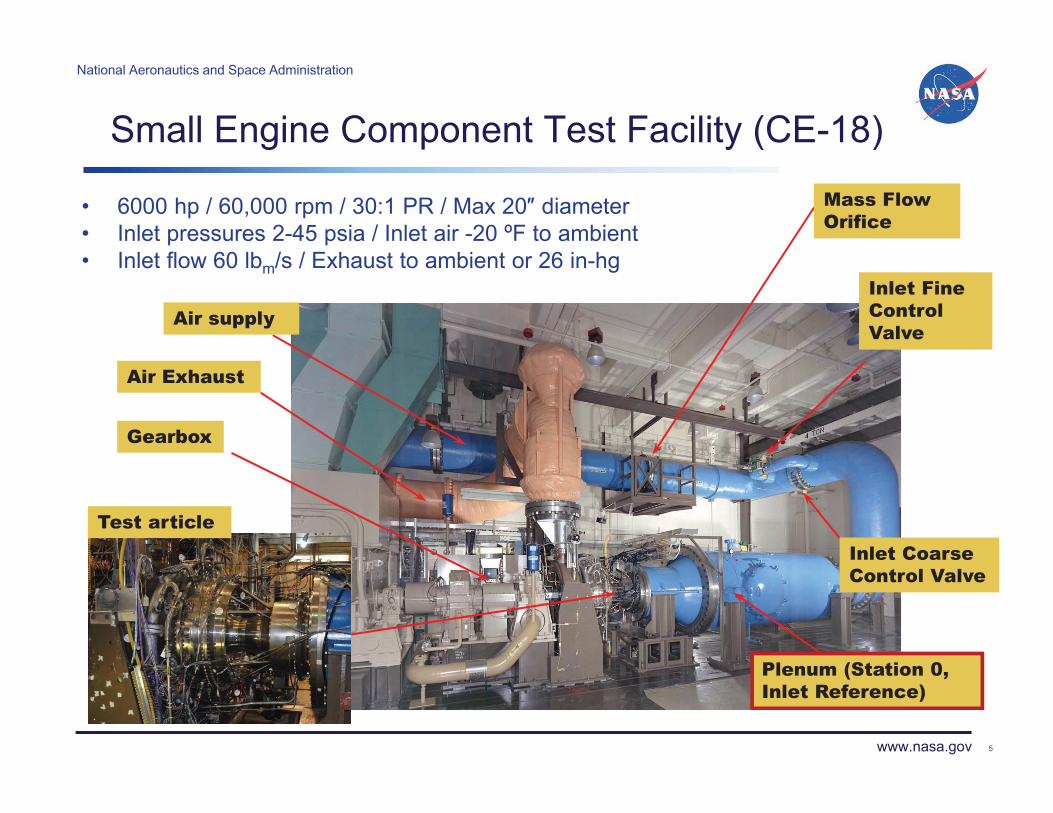
Small Engine Component Test Facility (CE-18)
5
• 6000 hp / 60,000 rpm / 30:1 PR / Max 20� diameter • Inlet pressures 2-45 psia / Inlet air -20 ºF to ambient• Inlet flow 60 lbm/s / Exhaust to ambient or 26 in-hg
Air supply
Air Exhaust
Inlet Fine Control Valve
Plenum (Station 0, Inlet Reference)
Mass Flow Orifice
Test articleInlet Coarse Control Valve
Gearbox
National Aeronautics and Space Administration
www.nasa.gov
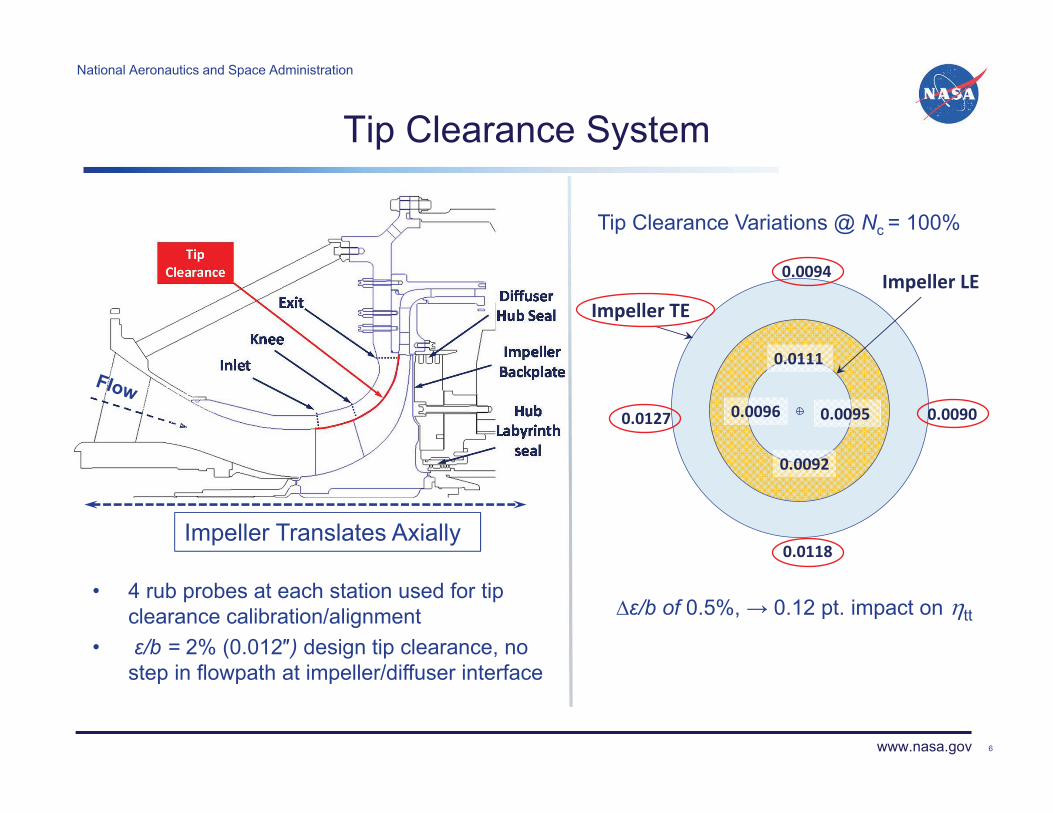
Tip Clearance System
6
��/b of 0.5%, � 0.12 pt. impact on �tt
Impeller Translates Axially
Tip Clearance Variations @ Nc = 100%
• 4 rub probes at each station used for tip clearance calibration/alignment
• �/b = 2% (0.012�) design tip clearance, no step in flowpath at impeller/diffuser interface
0.0094
0.0111
0.0095
0.0118
0.00900.00960.0127
0.0092
Impeller�TEImpeller�LE
National Aeronautics and Space Administration
www.nasa.gov
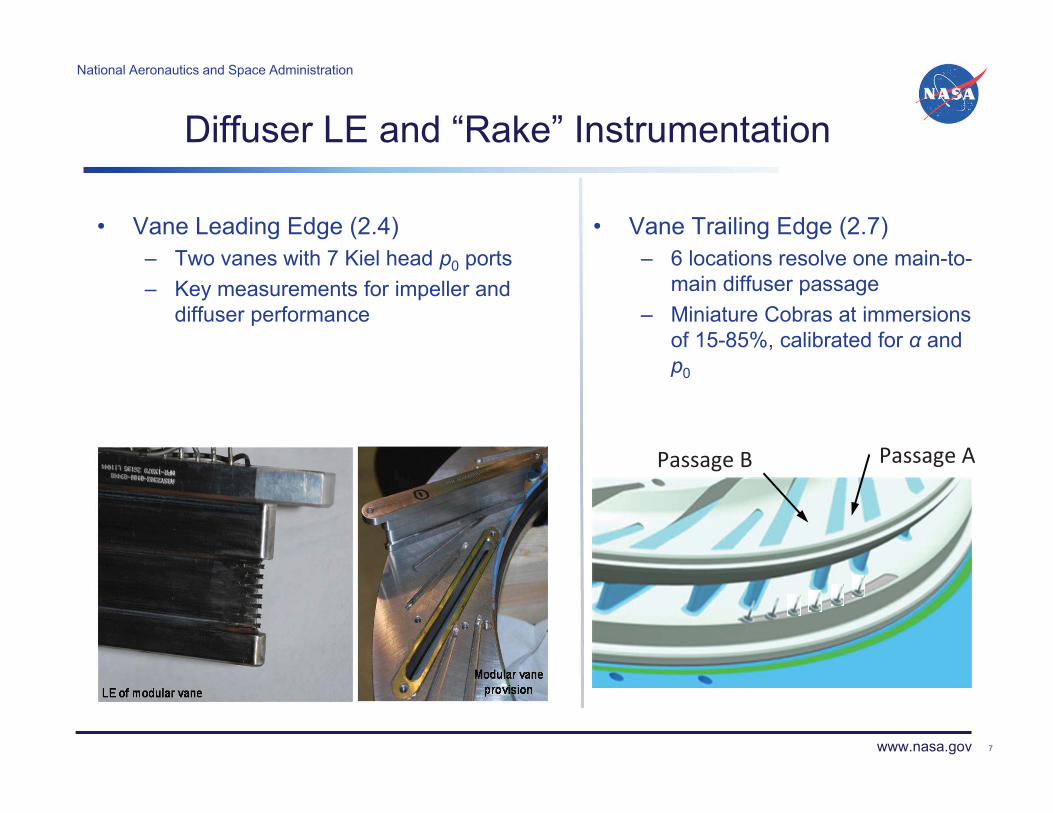
Diffuser LE and “Rake” Instrumentation
• Vane Leading Edge (2.4)– Two vanes with 7 Kiel head p0 ports – Key measurements for impeller and
diffuser performance
7
• Vane Trailing Edge (2.7)– 6 locations resolve one main-to-
main diffuser passage– Miniature Cobras at immersions
of 15-85%, calibrated for � and p0
Passage�APassage�B
National Aeronautics and Space Administration
www.nasa.gov
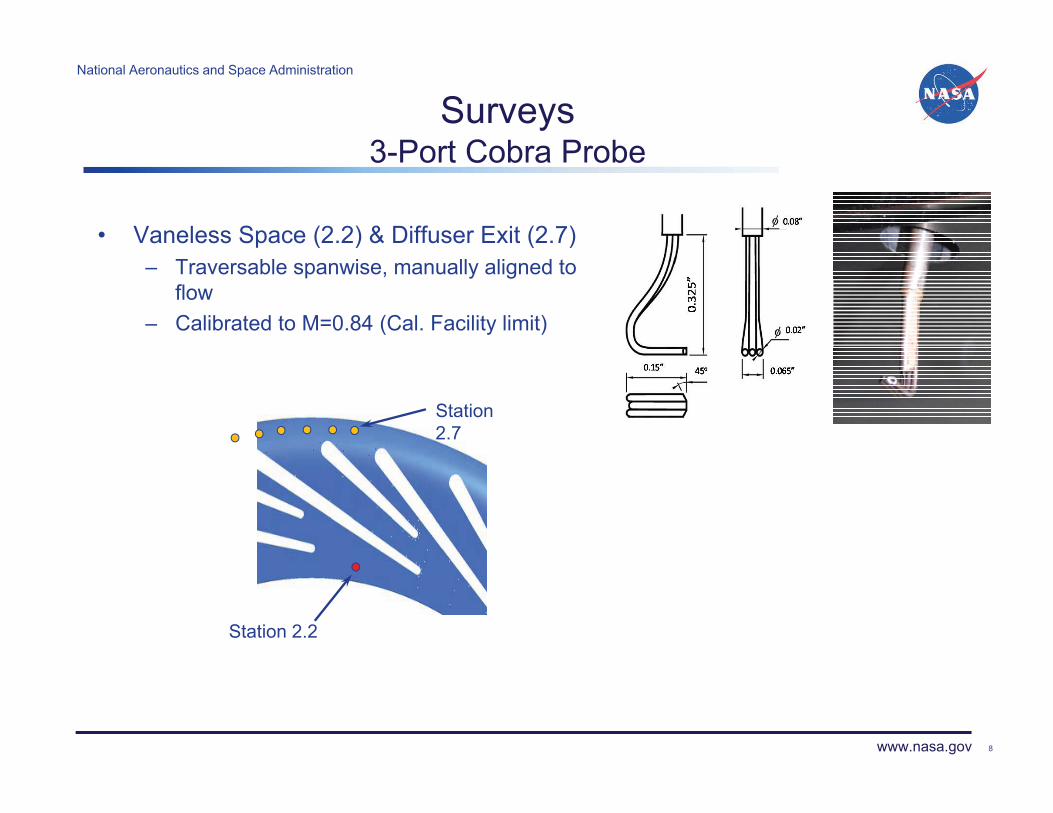
Surveys3-Port Cobra Probe
8
• Vaneless Space (2.2) & Diffuser Exit (2.7)– Traversable spanwise, manually aligned to
flow– Calibrated to M=0.84 (Cal. Facility limit)
Station 2.2
Station 2.7
National Aeronautics and Space Administration
www.nasa.gov
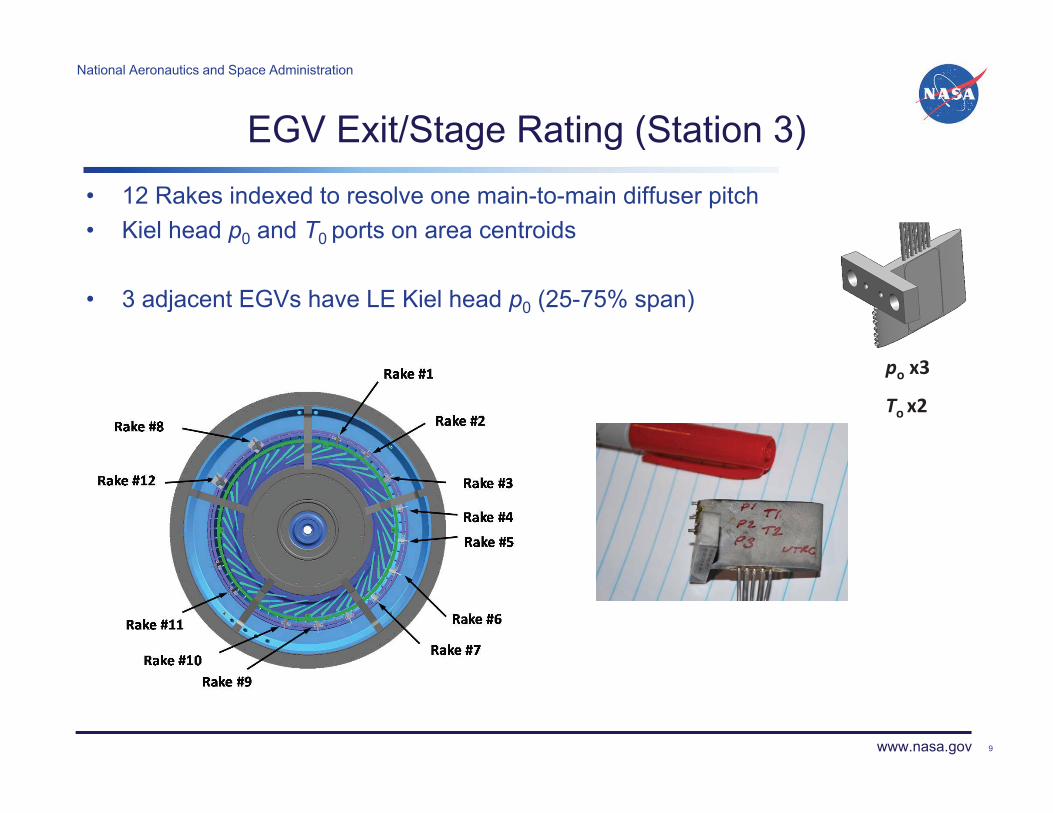
EGV Exit/Stage Rating (Station 3)• 12 Rakes indexed to resolve one main-to-main diffuser pitch• Kiel head p0 and T0 ports on area centroids
• 3 adjacent EGVs have LE Kiel head p0 (25-75% span)
9
po x3
To�x2
National Aeronautics and Space Administration
www.nasa.gov
Stage and Subcomponent Results
• Compressor Maps• Design point performance - comparison of measured vs. predicted• Representative subcomponent measurements at Nc = 100%
10
National Aeronautics and Space Administration
www.nasa.gov
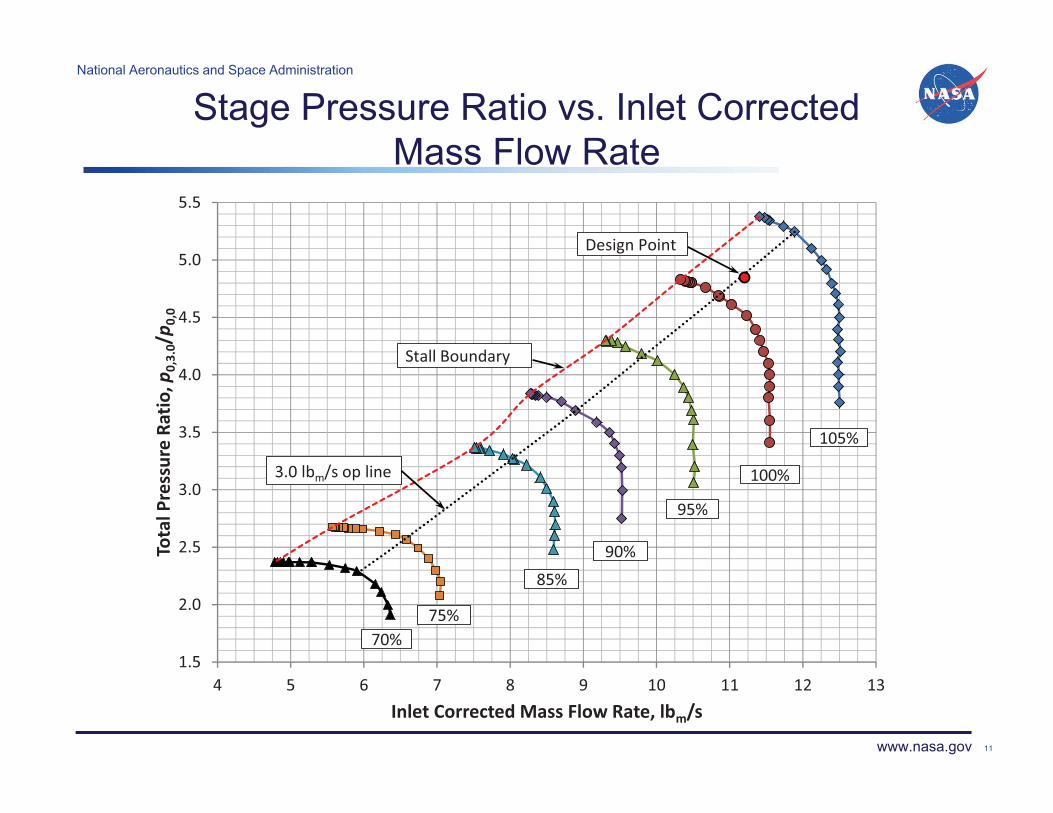
Stage Pressure Ratio vs. Inlet Corrected Mass Flow Rate
11
1.5
2.0
2.5
3.0
3.5
4.0
4.5
5.0
5.5
4 5 6 7 8 9 10 11 12 13
Total�Pressure�Ra
tio,�p
0,3.0/p 0
,0
Inlet�Corrected�Mass�Flow�Rate,�lbm/s
Stall�Boundary
3.0�lbm/s�op�line
Design Point
105%
100%
95%
90%85%
75%70%
National Aeronautics and Space Administration
www.nasa.gov
0.6
0.65
0.7
0.75
0.8
0.85
0.9
0.95
4.0 5.0 6.0 7.0 8.0 9.0 10.0 11.0 12.0 13.0
Efficiency,�%�
Inlet�Corrected�Mass�Flow�Rate,��lbm/s
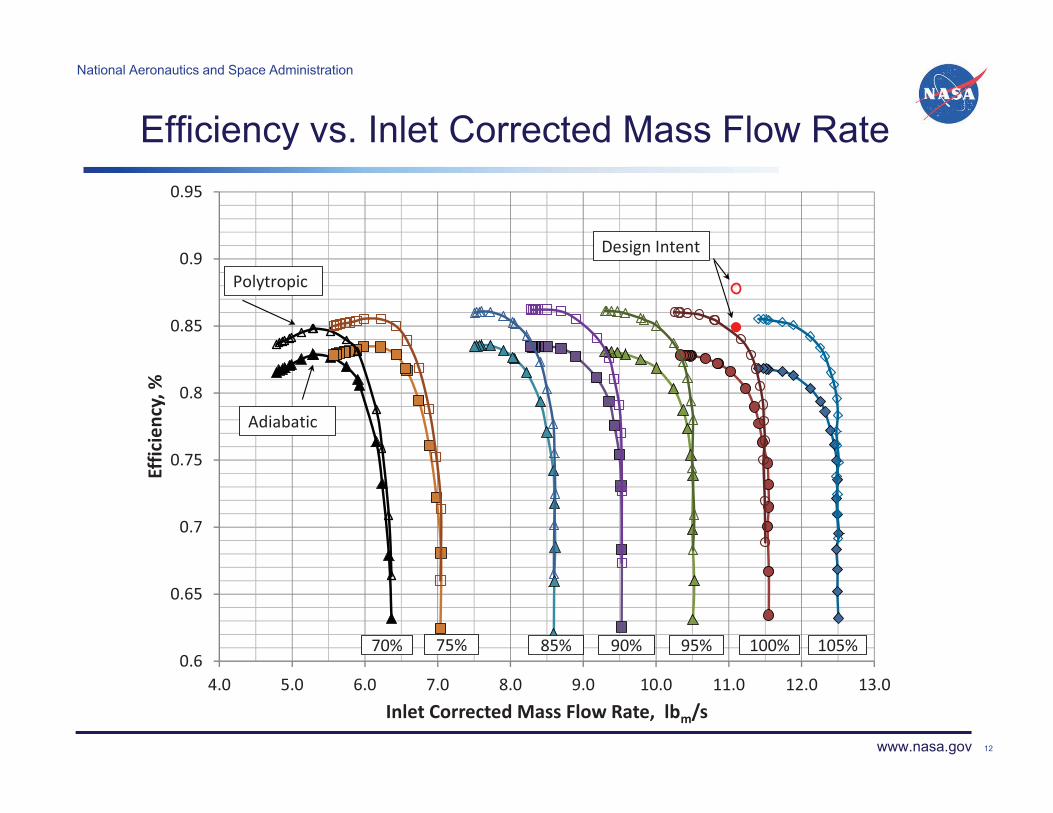
Design Intent
Adiabatic
Polytropic
105%100%95%90%85%75%70%
Efficiency vs. Inlet Corrected Mass Flow Rate
12
National Aeronautics and Space Administration
www.nasa.gov
Metric Design�GoalRig�Scale�
Design�Intent�p0,0=14.7�psia
Rig�Scale��Design�Intent�
p0,0=11�psia
Measuredp0,0=11�psia
Uncertainty�(95%�Confidence)
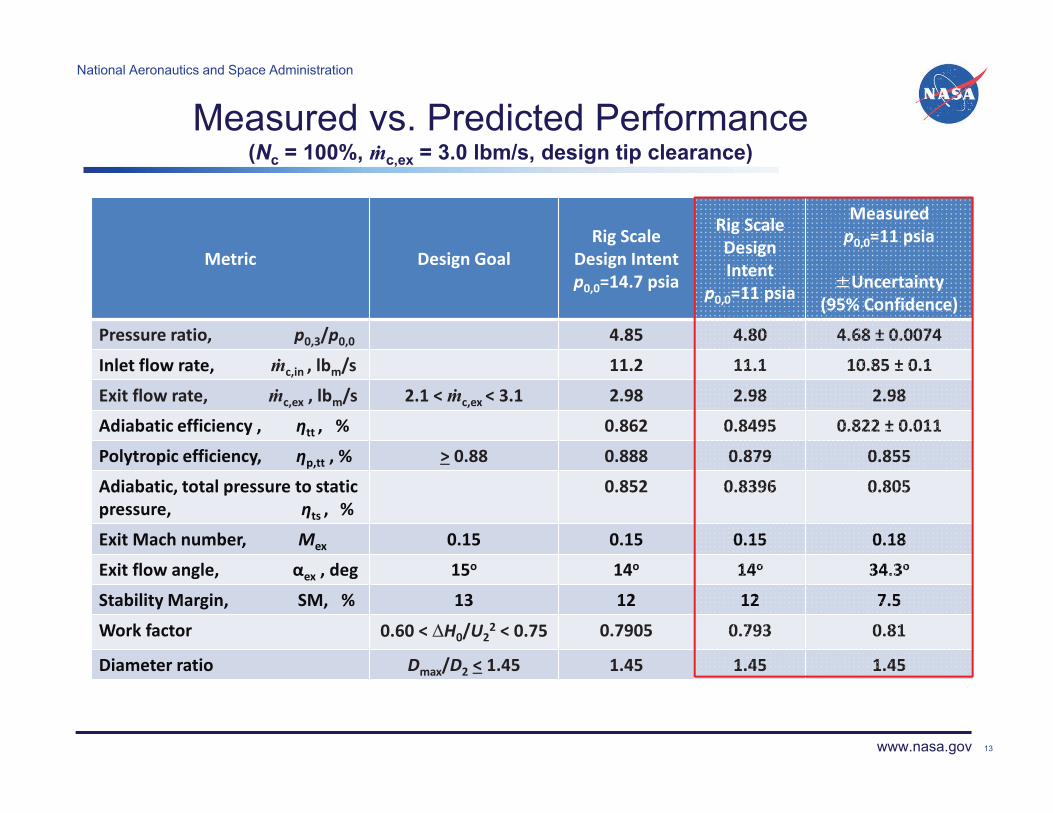
Pressure�ratio,�������������������p0,3/p0,0 4.85 4.80 4.68�± 0.0074
Inlet�flow�rate,��������������c,in ,�lbm/s 11.2 11.1 10.85�± 0.1
Exit flow�rate,���������������c,ex ,�lbm/s 2.1�<��c,ex <�3.1 2.98 2.98 2.98
Adiabatic�efficiency�, �tt ,���% 0.862 0.8495 0.822�± 0.011
Polytropic efficiency, �p,tt ,�% > 0.88 0.888 0.879 0.855
Adiabatic,�total�pressure�to�static�pressure,�������������������������������ts , %
0.852 0.8396 0.805
Exit�Mach�number,������������Mex 0.15 0.15 0.15 0.18
Exit�flow�angle,������������������ex ,�deg 15o 14o 14o 34.3o
Stability�Margin,����������������SM,���% 13 12 12 7.5
Work factor 0.60�<��H0/U22 <�0.75 0.7905 0.793 0.81
Diameter�ratio Dmax/D2 < 1.45 1.45 1.45 1.45
Measured vs. Predicted Performance(Nc = 100%, �c,ex = 3.0 lbm/s, design tip clearance)
13
National Aeronautics and Space Administration
www.nasa.gov
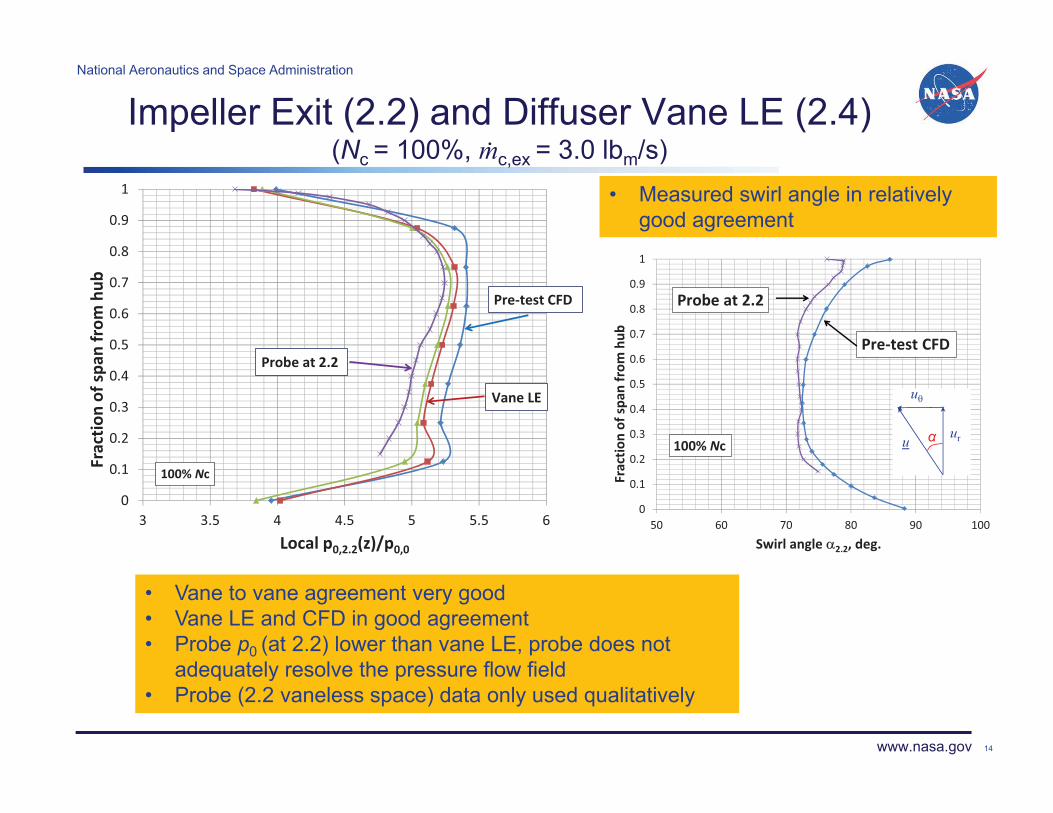
Impeller Exit (2.2) and Diffuser Vane LE (2.4)(Nc = 100%, �c,ex = 3.0 lbm/s)
14
0
0.1
0.2
0.3
0.4
0.5
0.6
0.7
0.8
0.9
1
50 60 70 80 90 100
Fractio
n�of�sp
an�from
�hub
Swirl�angle��2.2,�deg.
100% Nc
Probe�at�2.2
Pre�test�CFD
• Measured swirl angle in relatively good agreement
• Vane to vane agreement very good• Vane LE and CFD in good agreement• Probe p0 (at 2.2) lower than vane LE, probe does not
adequately resolve the pressure flow field • Probe (2.2 vaneless space) data only used qualitatively
ur
u�
�u
0
0.1
0.2
0.3
0.4
0.5
0.6
0.7
0.8
0.9
1
3 3.5 4 4.5 5 5.5 6
Fractio
n�of�sp
an�from
�hub
Local�p0,2.2(z)/p0,0
100% Nc
Probe�at�2.2
Vane�LE�
Pre�test�CFD
National Aeronautics and Space Administration
www.nasa.gov
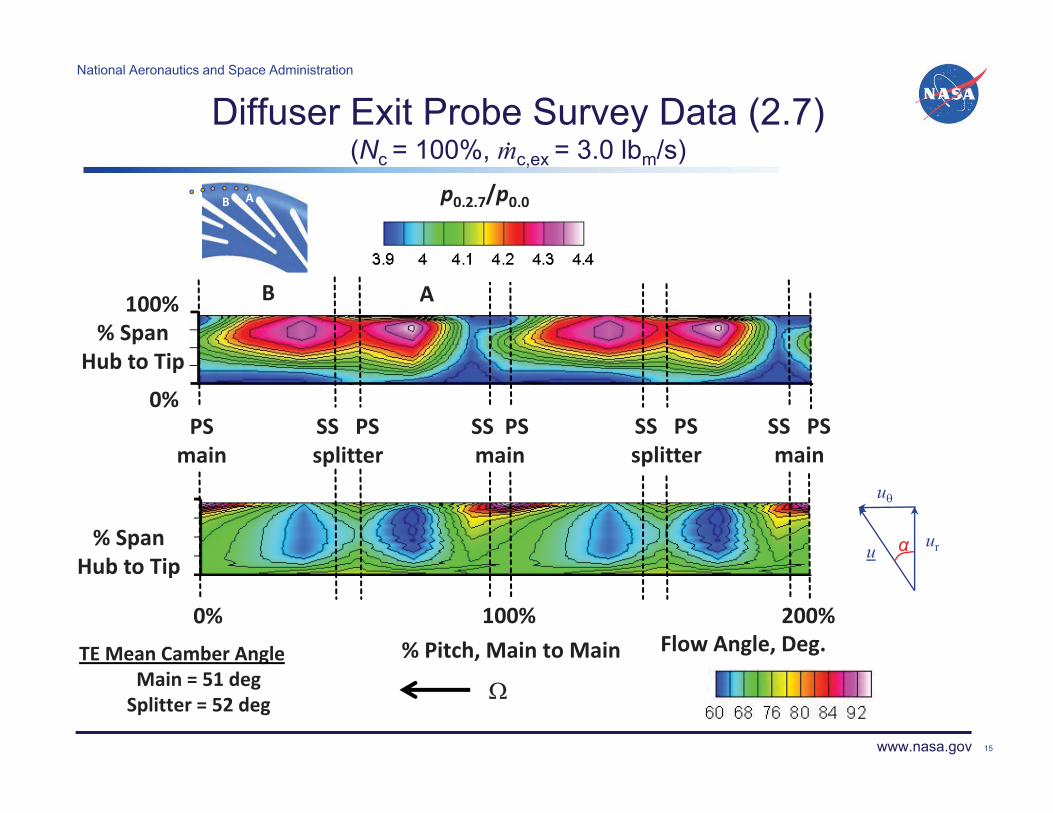
Diffuser Exit Probe Survey Data (2.7)(Nc = 100%, �c,ex = 3.0 lbm/s)
15
�
B
p0,2.7/p0,0
Flow�Angle,�Deg.
SS���PSsplitter
SS��PSmain
PSmain
SS���PSsplitter
SS���PSmain
%�Span�Hub�to�Tip
%�Pitch,�Main�to�Main
%�Span�Hub�to�Tip
A
TE�Mean�Camber�AngleMain�=�51�degSplitter�=�52�deg
0%
100% 200%
100%
0%
ur
u�
�u
AB
National Aeronautics and Space Administration
www.nasa.gov
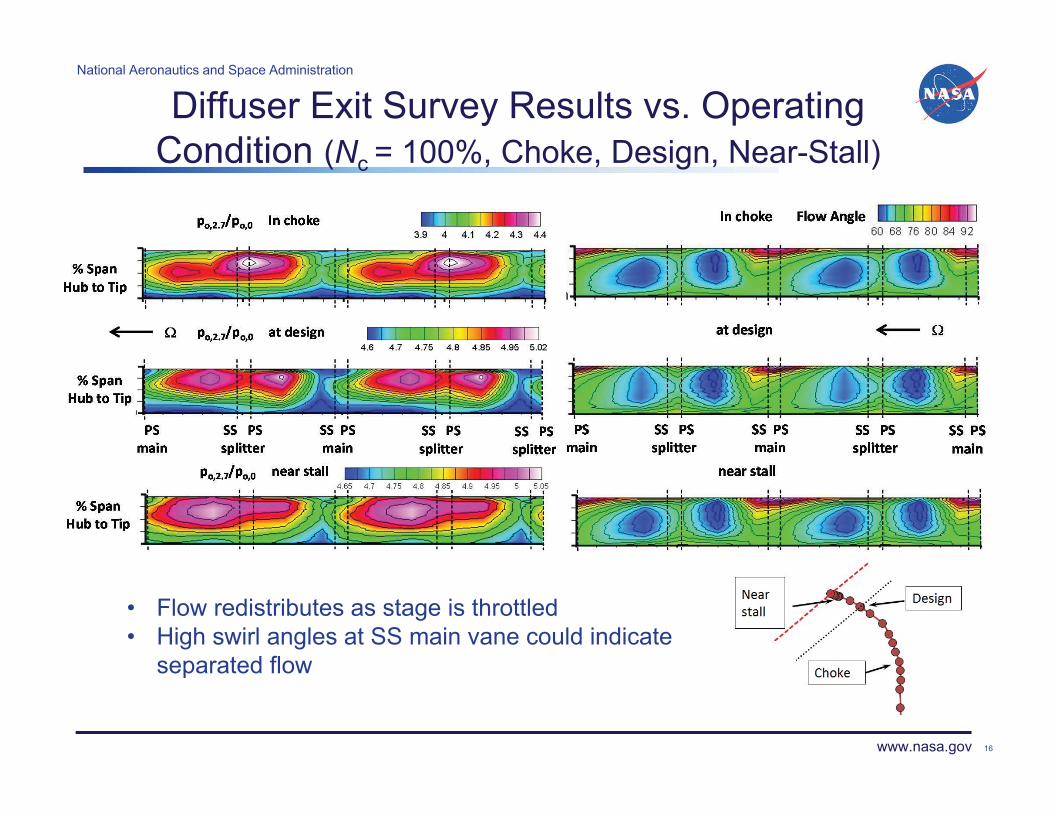
Diffuser Exit Survey Results vs. Operating Condition (Nc = 100%, Choke, Design, Near-Stall)
16
• Flow redistributes as stage is throttled• High swirl angles at SS main vane could indicate
separated flow
National Aeronautics and Space Administration
www.nasa.gov
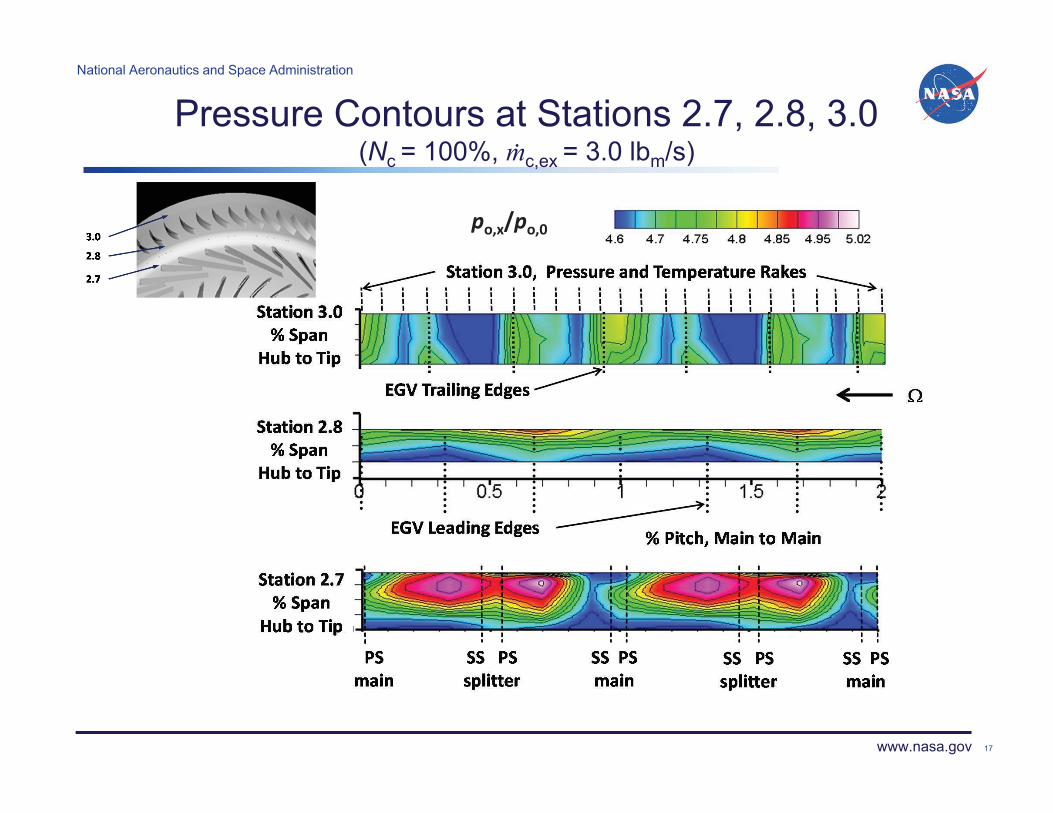
Pressure Contours at Stations 2.7, 2.8, 3.0(Nc = 100%, �c,ex = 3.0 lbm/s)
17
po,x/po,0
National Aeronautics and Space Administration
www.nasa.gov
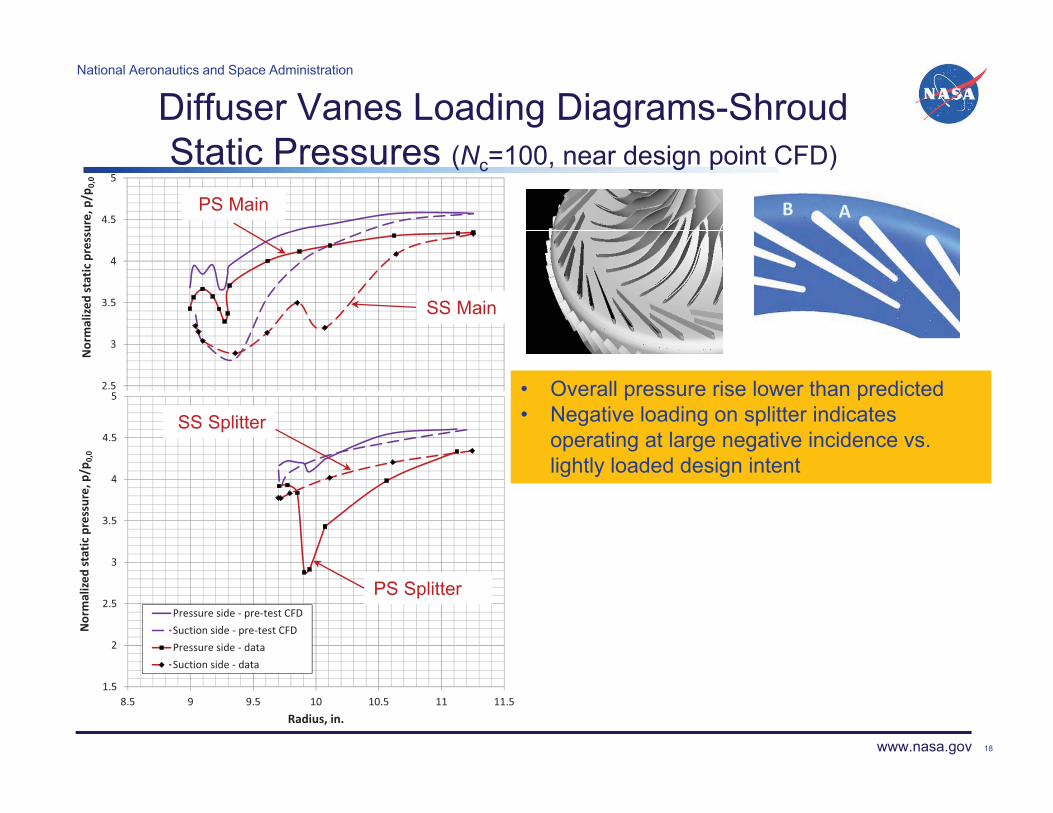
Diffuser Vanes Loading Diagrams-Shroud Static Pressures (Nc=100, near design point CFD)
18
2.5
3
3.5
4
4.5
5
Normalize
d�static�pressure,�p/p
0,0
1.5
2
2.5
3
3.5
4
4.5
5
8.5 9 9.5 10 10.5 11 11.5
Normalize
d�static�pressure,�p/p
0,0
Radius,�in.
Pressure�side���pre�test�CFDSuction�side���pre�test�CFDPressure�side���dataSuction�side���data
AB
SS Main
PS Main
PS Splitter
SS Splitter
• Overall pressure rise lower than predicted• Negative loading on splitter indicates
operating at large negative incidence vs. lightly loaded design intent
National Aeronautics and Space Administration
www.nasa.gov
60
65
70
75
80
85
90
95
10 10.5 11 11.5 12 12.5
Impe
ller�a
nd�stage�efficiency,�%
Inlet�corrected�flow,�lbm/s
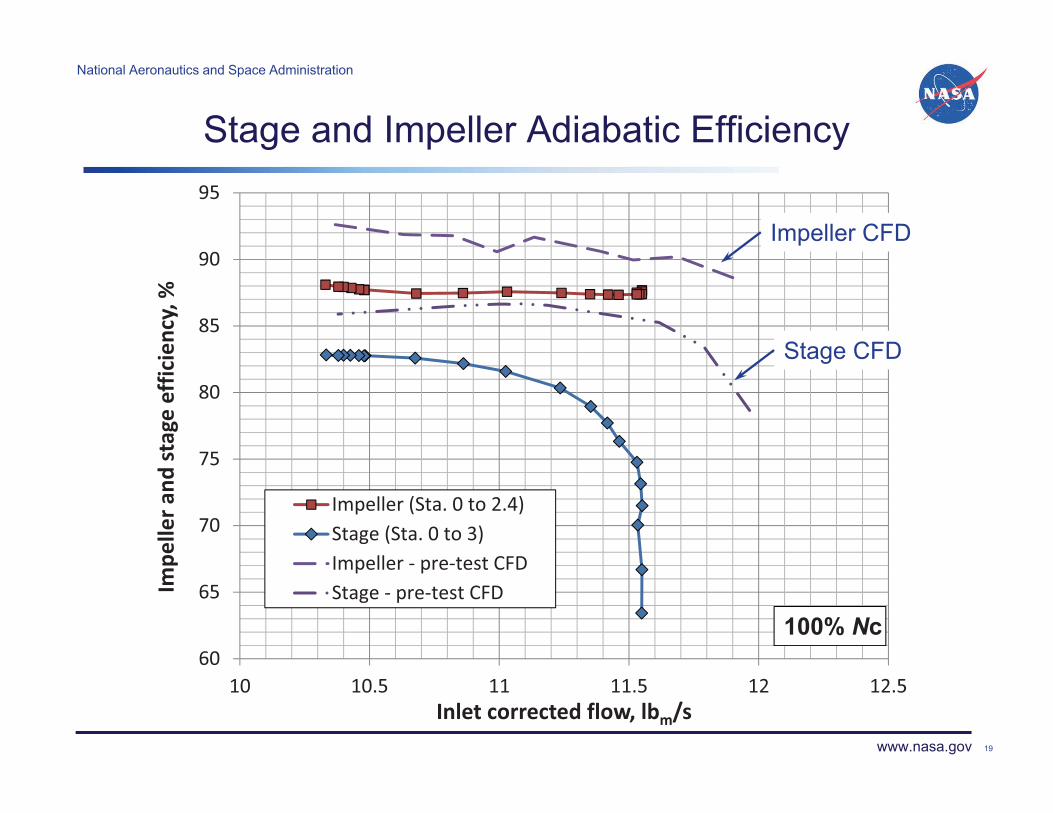
Impeller�(Sta.�0�to�2.4)Stage�(Sta.�0�to�3)Impeller���pre�test�CFDStage���pre�test�CFD
Stage and Impeller Adiabatic Efficiency
19
100% Nc
Impeller CFD
Stage CFD
National Aeronautics and Space Administration
www.nasa.gov
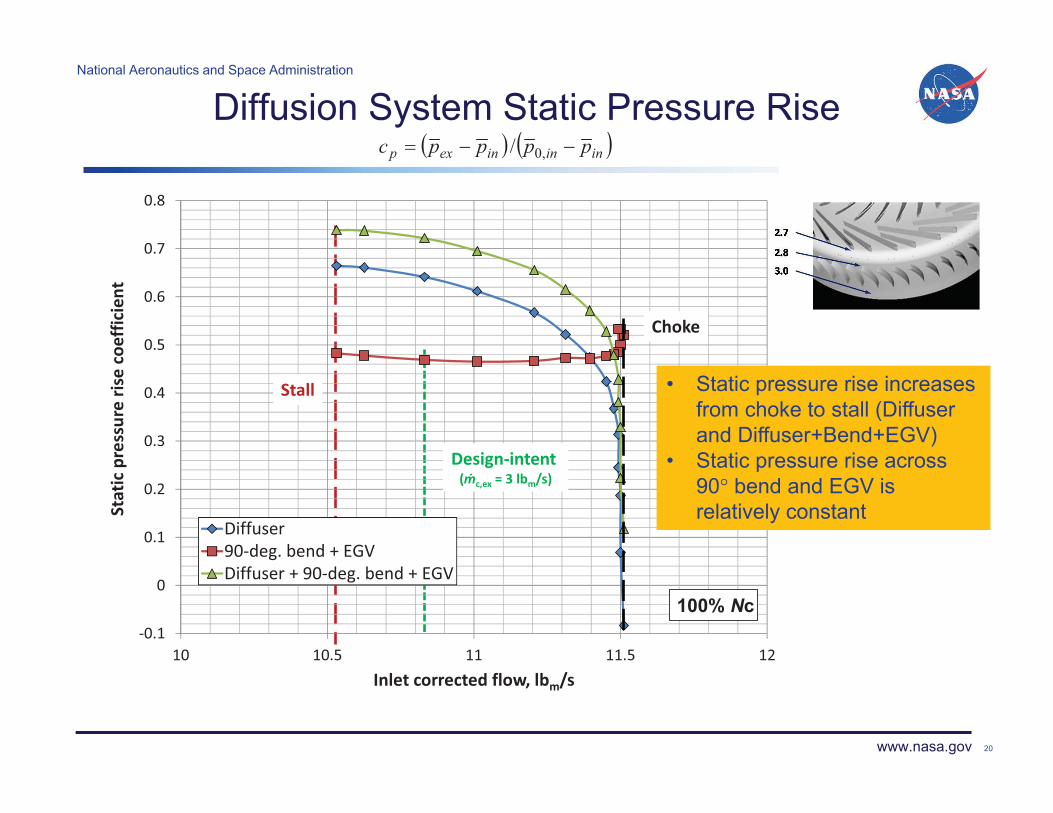
Diffusion System Static Pressure Rise
20
�0.1
0
0.1
0.2
0.3
0.4
0.5
0.6
0.7
0.8
10 10.5 11 11.5 12
Static�pressure�rise�coefficient
Inlet�corrected�flow,�lbm/s
Diffuser90�deg.�bend�+�EGVDiffuser�+�90�deg.�bend�+�EGV
100% Nc
Design�intent�(�c,ex =�3�lbm/s)
Stall
Choke
• Static pressure rise increases from choke to stall (Diffuser and Diffuser+Bend+EGV)
• Static pressure rise across 90� bend and EGV is relatively constant
� � inininexp ppppc � ,0/
National Aeronautics and Space Administration
www.nasa.gov
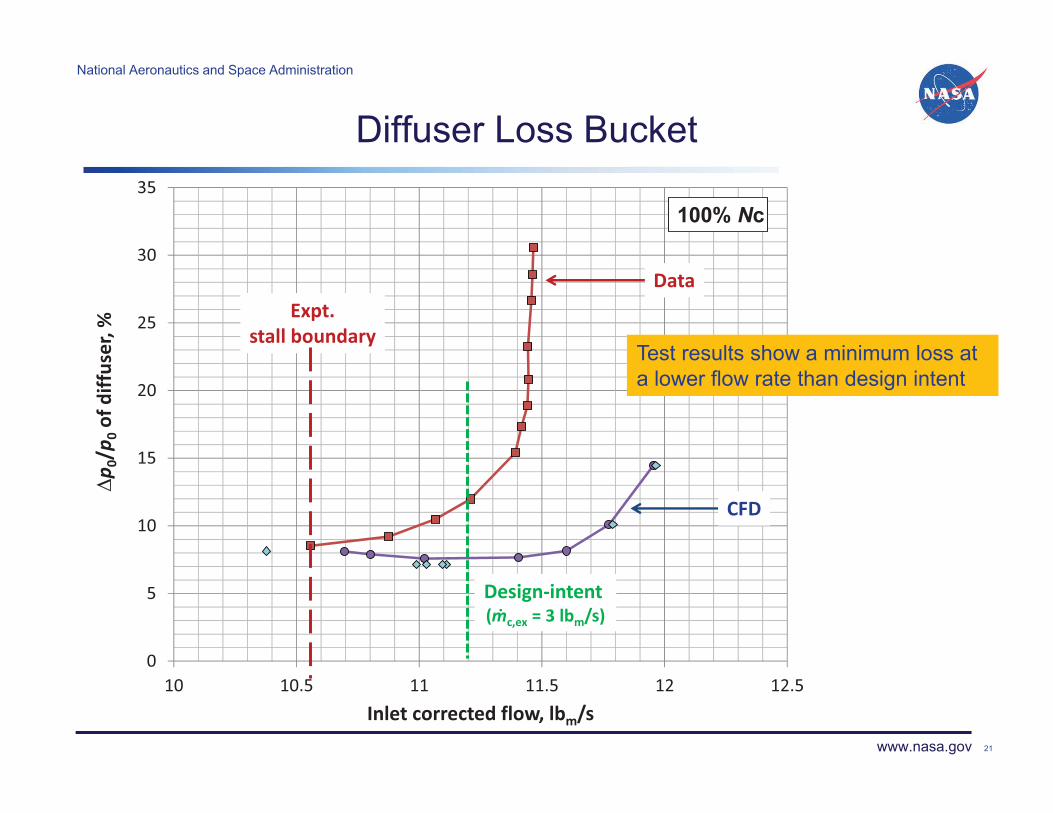
Diffuser Loss Bucket
21
0
5
10
15
20
25
30
35
10 10.5 11 11.5 12 12.5
�p 0/p
0of�diffuser,�%
Inlet�corrected�flow,�lbm/s
Design�intent�(�c,ex =�3�lbm/s)
100% Nc
Expt.stall�boundary
Data
CFD
Test results show a minimum loss at a lower flow rate than design intent
National Aeronautics and Space Administration
www.nasa.gov
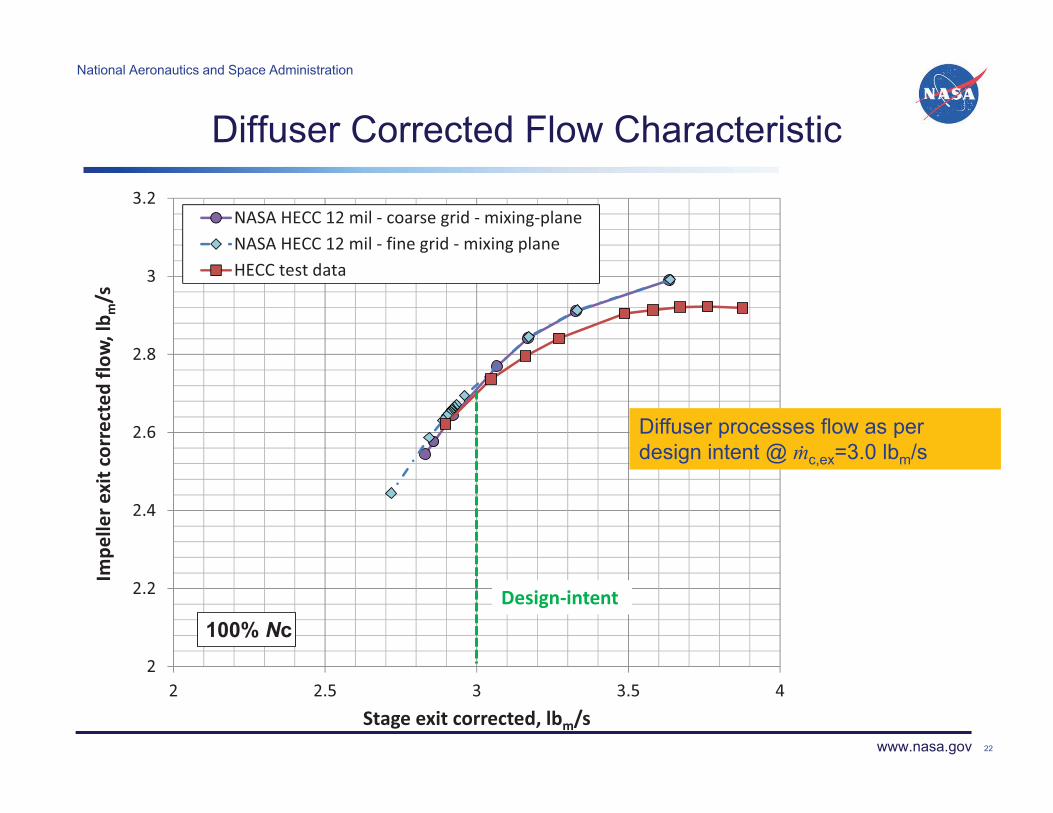
Diffuser Corrected Flow Characteristic
22
2
2.2
2.4
2.6
2.8
3
3.2
2 2.5 3 3.5 4
Impe
ller�e
xit�corrected
�flow
,�lb m
/s
Stage�exit�corrected,�lbm/s
NASA�HECC�12�mil���coarse�grid���mixing�planeNASA�HECC�12�mil���fine�grid���mixing�planeHECC�test�data
Design�intent�100% Nc
Diffuser processes flow as per design intent @ �c,ex=3.0 lbm/s
National Aeronautics and Space Administration
www.nasa.gov
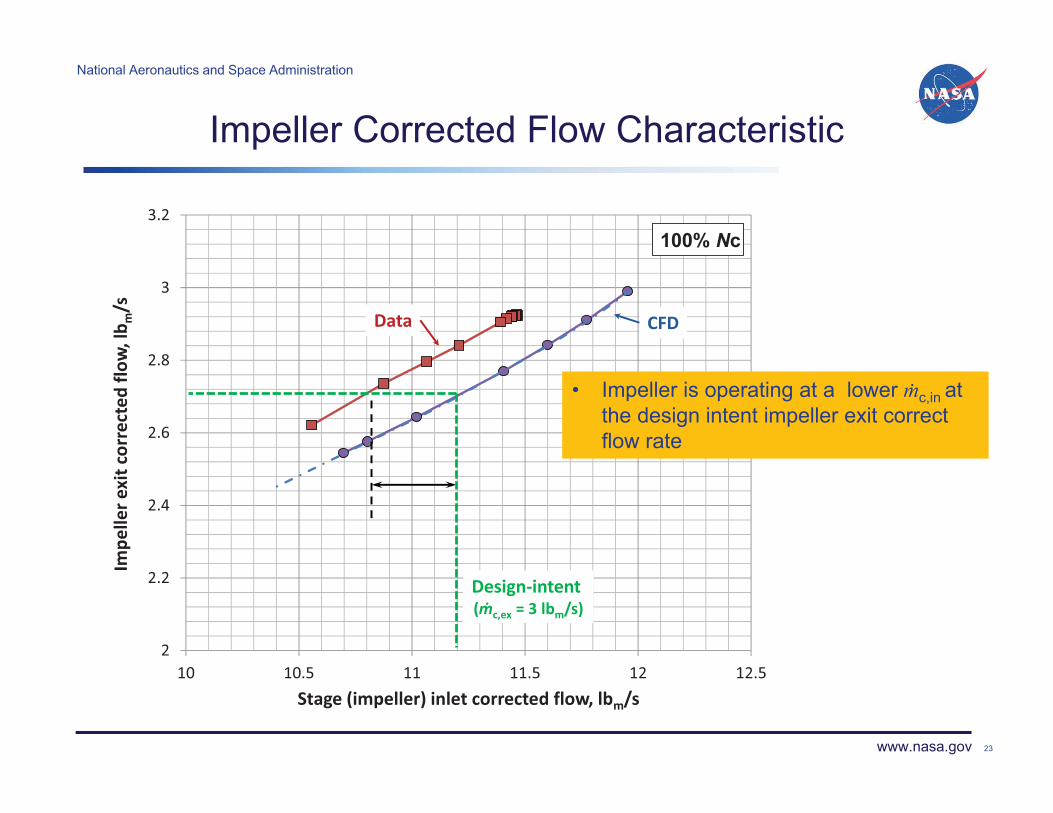
Impeller Corrected Flow Characteristic
23
2
2.2
2.4
2.6
2.8
3
3.2
10 10.5 11 11.5 12 12.5
Impe
ller�e
xit�corrected
�flow
,�lb m
/s
Stage�(impeller)�inlet�corrected�flow,�lbm/s
Data CFD
Design�intent�(�c,ex =�3�lbm/s)
100% Nc
• Impeller is operating at a lower �c,in at the design intent impeller exit correct flow rate
National Aeronautics and Space Administration
www.nasa.gov
Summary
• Aerodynamic performance of an advanced, compact, high work-factor centrifugal compressor stage was presented
• Stage performance and stability were lower than design intent– Adiabatic Efficiency by 2.75 pts., mass flow by 2.25%, and
Stability Margin by 4.5 pts. • Differences in predicted and measured impeller efficiency,
impeller flow characteristics, and diffuser loss buckets were observed.
• Root-cause-analysis of the performance shortfall was initiated within the NRA contract. Analyses continue with intent to guide future design efforts.
24
Comprehensive data sets and geometry to be made publically available
National Aeronautics and Space Administration
www.nasa.gov
Acknowledgements
Drs. Joo JongwookLarry HardinDuane McCormickWilliam CousinsBrian HolleyPaul Van SlootenElizabeth LurieAamir Shabbir
25
Dr. Michael HathawayMark StevensJonathon MitchelJozsef PuskasAdam ReddingDavid HayduRichard Senyitko
Design Review Team