aerodynamic performance of a compact, high work-factor ... · gorazd medic and om p. sharma ......
TRANSCRIPT

Edward P. Braunscheidel and Gerard E. WelchGlenn Research Center, Cleveland, Ohio
Gary J. SkochU.S. Army Research Laboratory, Glenn Research Center, Cleveland, Ohio
Gorazd Medic and Om P. SharmaUnited Technologies Research Center, East Hartford, Connecticut
Aerodynamic Performance of a Compact,High Work-Factor Centrifugal Compressor at the Stage and Subcomponent Level
NASA/TM—2015-218455 (Corrected Copy)
September 2015
AIAA–2014–3632
Corrected Copy issued September 2016.
https://ntrs.nasa.gov/search.jsp?R=20150019738 2018-05-27T16:03:57+00:00Z

NASA STI Program . . . in Profile
Since its founding, NASA has been dedicated to the advancement of aeronautics and space science. The NASA Scientific and Technical Information (STI) program plays a key part in helping NASA maintain this important role.
The NASA STI Program operates under the auspices of the Agency Chief Information Officer. It collects, organizes, provides for archiving, and disseminates NASA’s STI. The NASA STI program provides access to the NASA Aeronautics and Space Database and its public interface, the NASA Technical Reports Server, thus providing one of the largest collections of aeronautical and space science STI in the world. Results are published in both non-NASA channels and by NASA in the NASA STI Report Series, which includes the following report types: • TECHNICAL PUBLICATION. Reports of
completed research or a major significant phase of research that present the results of NASA programs and include extensive data or theoretical analysis. Includes compilations of significant scientific and technical data and information deemed to be of continuing reference value. NASA counterpart of peer-reviewed formal professional papers but has less stringent limitations on manuscript length and extent of graphic presentations.
• TECHNICAL MEMORANDUM. Scientific
and technical findings that are preliminary or of specialized interest, e.g., quick release reports, working papers, and bibliographies that contain minimal annotation. Does not contain extensive analysis.
• CONTRACTOR REPORT. Scientific and
technical findings by NASA-sponsored contractors and grantees.
• CONFERENCE PUBLICATION. Collected papers from scientific and technical conferences, symposia, seminars, or other meetings sponsored or cosponsored by NASA.
• SPECIAL PUBLICATION. Scientific,
technical, or historical information from NASA programs, projects, and missions, often concerned with subjects having substantial public interest.
• TECHNICAL TRANSLATION. English-
language translations of foreign scientific and technical material pertinent to NASA’s mission.
Specialized services also include organizing and publishing research results, distributing specialized research announcements and feeds, providing information desk and personal search support, and enabling data exchange services.
For more information about the NASA STI program, see the following:
• Access the NASA STI program home page at http://www.sti.nasa.gov
• E-mail your question to [email protected] • Phone the NASA STI Information Desk at 757-864-9658 • Write to:
NASA STI Information Desk Mail Stop 148 NASA Langley Research Center Hampton, VA 23681-2199
Edward P. Braunscheidel and Gerard E. WelchGlenn Research Center, Cleveland, Ohio
Gary J. SkochU.S. Army Research Laboratory, Glenn Research Center, Cleveland, Ohio
Gorazd Medic and Om P. SharmaUnited Technologies Research Center, East Hartford, Connecticut
Aerodynamic Performance of a Compact,High Work-Factor Centrifugal Compressor at the Stage and Subcomponent Level
NASA/TM—2015-218455 (Corrected Copy)
September 2015
AIAA–2014–3632
Corrected Copy issued September 2016.
National Aeronautics andSpace Administration
Glenn Research Center Cleveland, Ohio 44135
Prepared for the50th Joint Propulsion Conferencecosponsored by the AIAA, ASME, SAE, and ASEECleveland, Ohio, July 28–30, 2014
Acknowledgments
The effort was conducted under NASA Research Announcement cost-share contract funded by the NASA Fundamental Aeronautics Program, Rotary Wing Project, and the United Technologies Research Center (UTRC). Contributions from UTRC, including Drs. Joo Jongwook, Larry Hardin, Duane McCormick, William Cousins, Brian Holley, Paul Van Slooten, Elizabeth Lurie, Aamir Shabbir, and at NASA Glenn Research Center (GRC), including Dr. Michael Hathaway and Mark Stevens, are gratefully acknowledged. The efforts of the GRC test cell staff including Jonathon Mitchell, Jozsef Puskas, David Haydu, Adam Redding, and Richard Senyitko are greatly appreciated.
Available from
NASA STI Information DeskMail Stop 148NASA Langley Research CenterHampton, VA 23681-2199
National Technical Information Service5301 Shawnee Road
Alexandria, VA 22312
Available electronically at http://www.sti.nasa.gov
This work was sponsored by the Fundamental Aeronautics Program at the NASA Glenn Research Center.
Level of Review: This material has been technically reviewed by technical management.
Corrected Copy
Issued September 2016 for
NASA/TM—2015-218455Aerodynamic Performance of a Compact, High Work-Factor Centrifugal Compressor
at the Stage and Subcomponent LevelEdward P. Braunscheidel, Gerard E. Welch, Gary J. Skoch, Gorazd Medic, and Om P. Sharma
September 2015
Figures 12, 20(b), 21, and 22(b) have been changed.

NASA/TM—2015-218455 (Corrected Copy) 1
Aerodynamic Performance of a Compact, High Work-Factor Centrifugal Compressor at the Stage and Subcomponent Level
Edward P. Braunscheidel and Gerard E. Welch National Aeronautics and Space Administration
Glenn Research Center Cleveland, Ohio 44135
Gary J. Skoch U.S. Army Research Laboratory
Glenn Research Center Cleveland, Ohio 44135
Gorazd Medic and Om P. Sharma United Technologies Research Center
East Hartford, Connecticut 06118
Abstract The measured aerodynamic performance of a compact, high work-factor, single-stage centrifugal
compressor, comprising an impeller, diffuser, 90°-bend, and exit guide vane is reported. Performance levels are based on steady-state total-pressure and total-temperature rake and angularity-probe data acquired at key machine rating planes during recent testing at NASA Glenn Research Center. Aerodynamic performance at the stage level is reported for operation between 70 to 105 percent of design corrected speed, with subcomponent (impeller, diffuser, and exit-guide-vane) flow field measurements presented and discussed at the 100 percent design-speed condition. Individual component losses from measurements are compared with pre-test CFD predictions on a limited basis.
Nomenclature
D impeller trailing edge diameter (in.) M Mach number Nc corrected speed (rpm) R radius (in.)
Re
µ
ρin
in DU 22 , Reynolds number
SM ( )( )
( )( )
⋅−⋅
refc
stallc
stall
ref
mm
pppp
0,03,0
0,03,0
//
1%100 , stability margin (NASA definition)
T0 total temperature U rΩ = tip speed (ft/s) b impeller trailing edge blade height (in.) p0 total pressure p static pressure ṁ mass flow rate (lbm/s) n exponent of Reynolds number correlation u (ur, uθ, uz), velocity (ft/s)
NASA/TM—2015-218455 (Corrected Copy) 2
ε impeller tip-gap (in.) ηtt total-to-total adiabatic efficiency ηp,tt total-to-total polytropic efficiency ηts total-to-static adiabatic efficiency α atan(uθ/ur) or atan(uθ/uz) , yaw angle in degrees Ω angular frequency, (rad/s)
Subscripts / Stations 0, in inlet plenum 1 impeller inlet 2 impeller exit 2.2 probe survey location in vaneless space 2.4 diffuser main blade leading edge 2.5 diffuser main-to-main blade throat 2.6 splitter blade leading edge 2.7 diffuser exit 2.8 EGV inlet / leading edge 3, ex EGV exit / exit rating plane PS pressure side SS suction side c corrected condition max denotes maximum diameter of shroud endwall in 90° bend ref reference condition (Nc = 100 percent, ṁc,ex = 3.0 lbm/s, ε = 0.012 in.) stall condition at stall / stability boundary
1.0 Introduction High pressure compressors of advanced turboshaft engines for rotorcraft applications comprise
centrifugal compressor aft stages that achieve efficient pressure rise at low corrected flows and compact size. A recent collaborative effort between NASA and the United Technology Research Center (UTRC) related to a new centrifugal compressor—the “High Efficiency Centrifugal Compressor (HECC)”—is reported on herein.
The work, conducted under a NASA Research Announcement (NRA) cost-share contract, had intent to identify key technical barriers to advancement of aerodynamic performance of low corrected-flow (e.g., ṁc,ex 0.75 lbm/s engine scale) centrifugal compressor aft stages, and to acquire research-quality flow field data needed to close associated knowledge/data gaps. An aggressive aerodynamic goal set was established by NASA (Ref. 1) for a new state-of-the-art (SOA) centrifugal compressor. The test article was designed, fabricated and instrumented by UTRC (Refs. 2 and 3) under the NRA, and subsequently installed and tested at NASA Glenn Research Center (GRC). If achieved, design-intent aerodynamic performance levels would advance compressor efficiency (> 0.88 ηp,tt) levels at exit-corrected flow, work factor, stability margin, and diffuser compactness levels needed for advanced turboshaft engines (Ref. 1).
UTRC recently documented the NRA effort in a NASA Contractor Report (Ref. 3), which included a detailed assessment of design-intent performance relative to the goal set. The current paper, focused on the experimental rating measurements, is intended to document the HECC performance at the stage (overall map) and subcomponent (impeller, diffuser, 90° bend, and exit guide vane row) levels, with a brief investigation of performance derivatives associated with tip-clearance and Reynolds number

NASA/TM—2015-218455 (Corrected Copy) 3
variations. Reported performance levels are based on steady-state total-pressure and total-temperature rake and total-pressure angularity-probe data acquired at key machine rating planes during testing at the GRC. Aerodynamic performance at the stage level is reported for operation between 70 to 105 percent of design corrected speed, with subcomponent (impeller, diffuser, and exit-guide-vane) performance discussions focusing mainly at 100 percent of design condition.
The requirements and aerodynamic design parameters of the HECC are first described, followed by a description of the experiment, including the test facility, data acquisition system, instrumentation and measurements. Finally a brief discussion related to comparison of design intent and achieved compressor performance is provided.
2.0 High Efficiency Centrifugal Compressor Description 2.1 Requirements
The challenging goal-set for the NRA solicitation of 2008 required high compressor efficiency (> 0.88 ηp,tt) at levels of exit-corrected flow, work factor, stability margin, and diffuser compactness (Dmax/D2) required for advance turboshaft engines for rotorcraft (Ref. 1). In addition to performance requirements, the NRA test article would be sized to enable research data acquisition and compatibility with the existing running gear and facility interfaces of the Small Engine Component Test Facility (CE-18) (Ref. 4) of GRC, where testing was to be conducted. The resultant UTRC test article was designed(Refs. 2 and 3) to leverage existing NASA components – the impeller tip diameter, rotational speed, and inlet hub and shroud radii were fixed at values of the NASA CC3 compressor (Ref. 5). The goal-set corresponding to the 2x engine scale HECC test article is summarized in Table 1.
2.2 HECC Stage Description
The HECC stage shown schematically in Figure 1 comprises a splittered impeller, splittered diffuser, 90° bend, and EGV blade row. The impeller has 15 main-blade/splitter-blade pairs with a spanwise varying backsweep between 32° to 42° from radial, and with –2° axial lean at the leading edge and –29° axial lean at the trailing edge. The impeller blades have elliptical leading edges. Trailing edges are also elliptical which differs from the typically blunter trailing edges of trimmed impellers. The vaned diffuser comprises 20 main/splitter vane pairs with the splitters slightly offset to maximize pressure recovery. The EGV blade row comprises 60 cascade style airfoils. The design speed is Nc = 21,789 rpm, corrected to inlet conditions, resulting in an impeller exit speed of U2 = 1615 ft/s. Key physical features of the compressor are provided in Table 2. A comprehensive summary of the HECC aerodynamic and mechanical design effort is provided in References 2 and 3.
TABLE 1.—GOAL SET FOR 2X-SCALE HECC COMPRESSOR Metric Intent at rig scale
Exit corrected flow rate, ṁc,ex 2.1 < ṁc,ex < 3.1 lbm/s Work factor 0.60 < ∆H0/U 22 < 0.75 Polytropic efficiency, ηp,tt, % ≥ 0.88 Diameter ratio Dmax/D2 ≤ 1.45 Stall Margin, SM, % 13 Exit Mach number, Mex 0.15 Exit flow angle, αex 15°

NASA/TM—2015-218455 (Corrected Copy) 4
Figure 1.—High Efficiency Centrifugal Compressor stage (Ref. 2).
TABLE 2.—HECC DESIGN SUMMARY Value Hub Shroud
Impeller blade inlet diameter, in. 3.19 8.479 Impeller splitter inlet diameter, in. 5.315 9.474 Impeller exit diameter, in. 16.988 16.998 Impeller exit blade height, in. 0.609 Impeller leading edge lean angle, deg. –2Impeller trailing edge lean angle, deg. –29Number of blade/splitter pairs 15 Tip clearance, in. 0.012
Vaned diffuser inlet diameter, in. 18.309 18.309 Vaned diffuser exit diameter, in. 22.398 22.398 Vaned diffuser channel height, in. 0.559 Number of vane/splitter pairs 20 Deswirl (EGV) blade inlet diameter, in. 23.663 24.594 Deswirl (EGV) blade exit diameter, in. 23.737 24.61 Deswirl (EGV) vane axial chord, in. 2.438
3.0 Facility and Compressor Test Rig Description HECC testing was conducted in the NASA Small Engine Components Test Facility (cell CE-18,
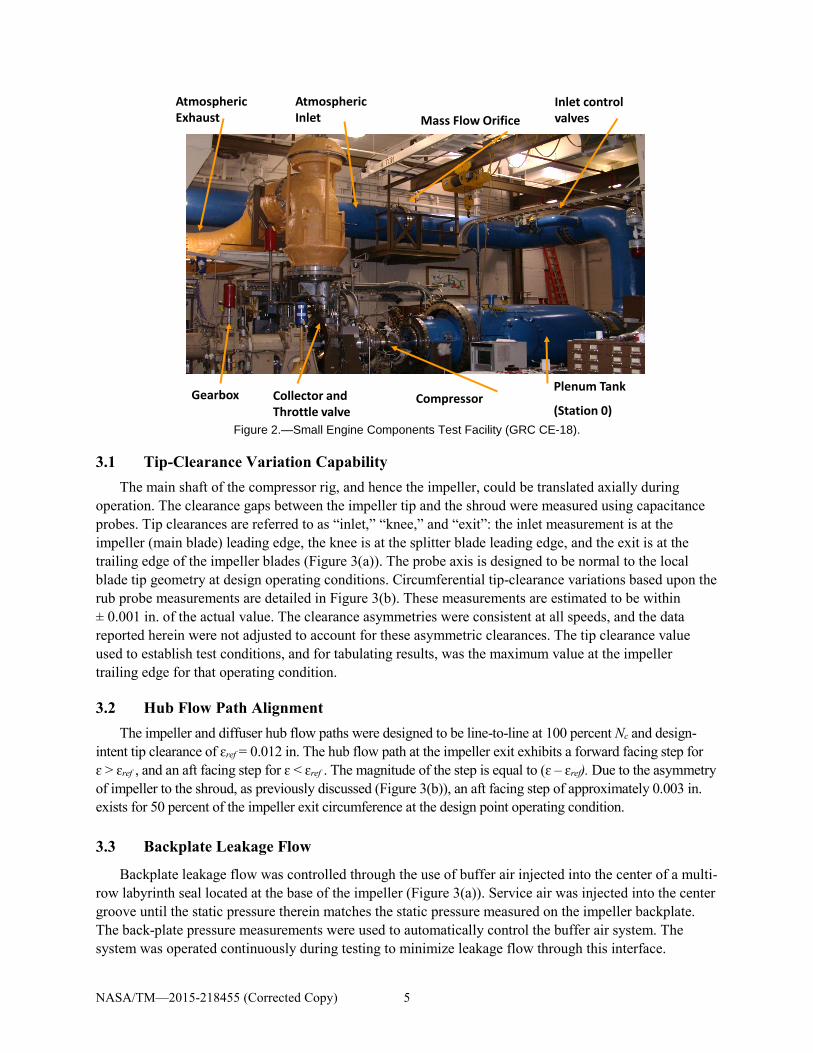
Figure 2) (Ref. 4) located at GRC. The facility was operated with atmospheric intake and exhaust, and an orifice plate was used to determine the physical mass flow rate. Inlet valves located downstream of the orifice are used to set the plenum pressure. To minimize inlet flow field disturbances, the inlet piping has long radius elbows with turning vanes and the plenum tank contains a foreign object protection screen, downstream of which is the compressor inlet reference (Station 0).
The facility throttle valve consists of a circumferentially rotating sleeve valve driven by a hydro-electric actuator with a control system providing extremely fine control of compressor flow rates. A 6,000 hp variable frequency motor drives a dual gearbox configurable for output speeds up to 60,000 rpm. Drive motor speed can held to ± 1 rpm, resulting in a compressor speed uncertainty of ± 17 rpm, due to the drivetrain overall gear ratio.
Impeller
Diffuser
EGV
90° Bend
NASA/TM—2015-218455 (Corrected Copy) 5
Figure 2.—Small Engine Components Test Facility (GRC CE-18).
3.1 Tip-Clearance Variation Capability The main shaft of the compressor rig, and hence the impeller, could be translated axially during
operation. The clearance gaps between the impeller tip and the shroud were measured using capacitance probes. Tip clearances are referred to as “inlet,” “knee,” and “exit”: the inlet measurement is at the impeller (main blade) leading edge, the knee is at the splitter blade leading edge, and the exit is at the trailing edge of the impeller blades (Figure 3(a)). The probe axis is designed to be normal to the local blade tip geometry at design operating conditions. Circumferential tip-clearance variations based upon the rub probe measurements are detailed in Figure 3(b). These measurements are estimated to be within ± 0.001 in. of the actual value. The clearance asymmetries were consistent at all speeds, and the data reported herein were not adjusted to account for these asymmetric clearances. The tip clearance value used to establish test conditions, and for tabulating results, was the maximum value at the impeller trailing edge for that operating condition.
3.2 Hub Flow Path Alignment The impeller and diffuser hub flow paths were designed to be line-to-line at 100 percent Nc and design-
intent tip clearance of ɛref = 0.012 in. The hub flow path at the impeller exit exhibits a forward facing step for ɛ > ɛref , and an aft facing step for ɛ < ɛref . The magnitude of the step is equal to (ɛ – ɛref). Due to the asymmetry of impeller to the shroud, as previously discussed (Figure 3(b)), an aft facing step of approximately 0.003 in. exists for 50 percent of the impeller exit circumference at the design point operating condition.
3.3 Backplate Leakage Flow
Backplate leakage flow was controlled through the use of buffer air injected into the center of a multi-row labyrinth seal located at the base of the impeller (Figure 3(a)). Service air was injected into the center groove until the static pressure therein matches the static pressure measured on the impeller backplate. The back-plate pressure measurements were used to automatically control the buffer air system. The system was operated continuously during testing to minimize leakage flow through this interface.
Mass Flow OrificeAtmospheric Inlet
Collector and Throttle valve
Plenum Tank
(Station 0)Compressor
Inlet controlvalves
Atmospheric Exhaust
Gearbox

NASA/TM—2015-218455 (Corrected Copy) 6
(a) (b) Figure 3.—(a) Tip clearance probe locations and (b) HECC clearance variations (in inches)
4.0 Data Acquisition, Instrumentation, and Test Procedures In this section, the steady-state measurements used for rating the compressor will be summarized, and
detailed subcomponent measurement stations will be identified. Measurement stations with unique instrumentation will be described in greater detail. Brief summaries of the data sets collected and how the stage was operated will be provided, along with estimates of measurement uncertainty.
4.1 Mass Flow Rate and Compressor Operating Speed Compressor mass flow rate was measured by using an orifice (Figure 2), with calculations and
installation based upon the ASME standards (Ref. 6). Uncertainty for the orifice based mass flow measurement system is estimated to be ± 0.1 lbm/s, and day to day repeatability was observed to be ± 0.05 lbm/s. No corrections for humidity were applied to any of the reported data. The relative humidity ranged from 40 to 75 percent during the testing timeframe.
Compressor operating speeds are based on once-per-rev measurements acquired at the compressor shaft near the aft face of the impeller. Compressor speeds are corrected to standard day conditions based upon temperature measurements taken in the plenum tank (Station 0).
4.2 Instrumentation and Measurement Stations Compressor measurement stations are identified in Figure 4. The measurements acquired at each
station are summarized in Table 2. Flow path (rakes and wall static) pressures are collected using a scanning pressure measurement system with an uncertainty of ± 0.07 percent of the transducers full scale. This results in uncertainties for the inlet pressure measurements of ± 0.011 psi, and for exit rakes ± 0.06 psi. Temperature measurements are referenced to an isothermal reference block with an estimated uncertainty of ± 2.3 R for inlet conditions, and ± 2.5 R for stage exit measurements. Uncertainties were based on 2-sigma, 95 percent confidence level.
The data system scans all measurement channels at a sampling rate of 1 Hz. Data reported in this paper are averages of 20 consecutive scans. Prior to collecting data, the rig is verified to have reached thermal equilibrium based on tip-clearance measurements that remain constant over a 15 min time period. Pressure settling time is much quicker than the thermal response of the rig. When small changes are made to the operating condition, a minimum dwell time of 2 min was observed prior to data collection.
0.0094
0.0114
0.0111
0.0095
0.0098
0.0118
0.0088 0.00900.00960.0120.0127
0.0092
Impeller Exit
Knee - Splitter Leading Edge
Inlet - Impeller Leading Edge
Inlet
Knee
Exit
ShroudImpeller Backplate
Hub Labyrinth seal

NASA/TM—2015-218455 (Corrected Copy) 7
Figure 4.—Compressor Measurement Stations
Wall static pressure taps located throughout the machine were checked and verified as they were connected to the pressure measurement system. Details of pressure measurement locations can be found in Reference 3.
4.2.1 Station 0—Inlet Plenum The key machine-level (overall) rating planes are at Stations 0 and 3 (Figure 4). All performance
measurements are referenced to the inlet plenum, Station 0, where redundant thermocouples are averaged to define the T0,0, and four pressure ports equally spaced around the plenum circumference are sampled and averaged to obtain the p0,0 inlet reference conditions.
4.2.2 Station 2.2—Impeller Exit Survey and Related Test Procedure Station 2.2 vaneless space surveys, conducted at a radius ratio (r2.2/r2) of 1.047, were performed using
a three-port cobra probe (Figure 5) which was traversed from shroud to hub and manually nulled to within ± 2° of the actual flow angle based on minimizing the side port pressure differentials. The probe was calibrated in a steady laminar free jet over a range of Mach numbers and flow angles of 0.3 to 0.84 and ± 20°, respectively. Calibration coefficients to correct for flow angle misalignment based on side port pressures, and coefficients to correct for pressure measurements at the misaligned flow angle, were generated and applied based on the approach in Reference 7. Flow angle measurements are typically within ± 1.0° in the laminar jet, and pressure is within ± 0.1 percent of the measured jet total pressure.
When testing with the probe at Station 2.2, a special operational procedure was required. As the probe was traversed from shroud to hub, the additional flow path blockage back-pressured the impeller, which was observed as a decrease in the inlet corrected flow rate. If no throttle change was made, the compressor stage would eventually stall as the blockage increased with increased probe immersion. Since the intent of this measurement was to measure the impeller exit flow at a constant condition, the following approach was implemented. With probe retracted, the operating condition was established, setting inlet corrected flow rate and stage pressure ratio. As the probe was traversed from shroud to hub the throttle was adjusted to maintain the initial inlet corrected mass flow rate. Using this procedure, the static pressures at the impeller exit were constant as the throttle was changed, reflecting that the impeller
Station 0Plenum, Inlet Reference
Station 1Impeller Inlet
Station 2Impeller Exit
Station 2.4Diffuser Main Blade Leading Edge
Station 2.7 Diffuser Exit
Station 2.8 EGV Inlet
Station 3EGV Exit/Rating Plane
Station 2.6 Diffuser Splitter Leading Edge
Station 2.2Vaneless Space Survey

NASA/TM—2015-218455 (Corrected Copy) 8
Figure 5.—Three-port Cobra probe
Figure 6.—Leading edge Kiel head instrumentation on main diffuser vane
operated at the initial set point. The survey measurements were obtained at corrected speed of 85 percent ≤ Nc ≤ 100 percent at the design exit-corrected mass flow rate of 3.0 lbm/s. When testing was performed with probes at Station 2.2, the diffuser exit probes were not installed.
4.2.3 Station 2.4—Leading Edge Instrumented Diffuser Vanes Station 2.4 measurements were obtained from main diffuser blade leading edge Kiel-head total-
pressure ports, located on two identical vanes. Seven pressure ports, on equally space area centroids, span the passage height. Each vane was calibrated for Mach numbers from 0.3 to the calibration facility limit of 0.75, at flow angles from ± 20°. Note that the expected Mach numbers at the diffuser leading edge are > 0.75. Results show that within a range of ± 10° the effect of incidence on the measured vane total pressure relative to the jet pressure is approximately ± 0.25 percent. No corrections to the vane pressure measurements were applied for this report. Details of the modular vane are shown in Figure 6. The instrumented vanes were installed for all test conditions reported herein.
45o
0.32
5”0.02”
0.065”
0.08”
0.15”

NASA/TM—2015-218455 (Corrected Copy) 9
4.2.4 Station 2.7—Diffuser Exit Survey and Related Test Procedure Diffuser exit measurements at Station 2.7 were obtained at a radius ratio of 1.368. Six access locations
span one main-to-main diffuser vane pitch at approximately equal spacing (Figure 7(a)). Two separate measurement techniques were used at Station 2.7: i) Using the probe shown in Figure 5, testing was performed one port at a time at design speed for three throttle settings identified as choke, design, and near stall. The probe was nulled and traversed from hub to shroud. Measurements were normalized to the plenum, and then collected together to obtain a complete mapping of the diffuser exit flow field. ii) All ports were simultaneously sampled using six identical miniature cobra probes which had sensing head sizes that were 50 percent smaller than the probe previously described. The probes were manually set at 15, 25, 50, 75, and 85 percent spanwise locations, with angles being visually aligned with a reference angle on the mounting plug. All data were normalized to the plenum, and then collected to obtain a complete mapping of the diffuser exit flow field. Speed lines from choke to near stall were obtained at 85, 90, 95, and 100 percent of design speed with the six probe technique. All probes were calibrated in a similar manner as previously described at a Mach number of 0.4, and for yaw angles from ± 20°. The accuracies of the yaw angle measurements and immersions are not as consistent as with the actuated probe due to the manual nature of the setup. The yaw angles are estimated to be ± 3° of the reported values. The immersion of the probes is estimated to be within ± 0.02 in. of the reported value, which corresponds to an uncertainty in position of ± 3 percent of span at Station 2.7. The test hardware is shown in Figure 7(b). When testing was performed with probes at Station 2.7, probes at Station 2.2 were not installed.
4.2.5 Station 2.8—EGV Leading Edge Rakes Total-pressure measurements were obtained from three adjacent EGVs with Kiel head leading edge
total-pressure ports. The pressure ports were located at 25, 50 and 75 percent of the inlet span. Three EGVs span one main-to-main diffuser passage. Although no EGV calibrations were performed, the total-pressure port design was consistent with that used for all leading edge instrumentation. This instrumentation was installed for all test conditions.
(a) (b) Figure 7.—(a) Solid model depiction of diffuser exit measurements and (b) Actual hardware
Passage APassage B

NASA/TM—2015-218455 (Corrected Copy) 10
4.2.6 Station 3.0—Machine Exit Rating Rakes The compressor exit rating plane was located at Station 3, approximately 0.13 EGV chords
downstream of the EGV trailing edge. The 12 exit rakes have three Kiel head total-pressure elements, and two Kiel head total-temperature elements each. The pressure elements were located on area centroids at 10, 50, 92 percent of exit passage height, and the temperature elements were also located on area centroids at 30 and 70 percent of exit height. The rakes were calibrated for Mach number and acceptance angle sensitivities. The acceptance angle of the rakes was greater than ± 20°, no correction was applied due to their large acceptance angle. The 12 rakes span one main blade to main blade diffuser passage, and were yawed at 15° from axial to align with the design intent exit swirl angle. The rakes were distributed around the exit circumference as shown in Figure 8. The rakes were installed for all test conditions. Table 3 provides a summary of all Stations with their respective measurements.
Figure 8.—Exit rake (Station 3) locations
TABLE 3.—STATION MEASUREMENT SUMMARY (FIGURE 4)a Station Description Static pressures p0 T0 Flow angle,
α Hub Shroud 0 Inlet/Plenum X X X 1 Impeller Inlet X X 2 Impeller Exit X X 2.2 Vaneless space X X O O 2.4 Diffuser Main Vane X X X 2.5 Diffuser throat X X 2.6 Diffuser Splitter Vane X X 2.7 Diffuser Exit X X O O 2.8 EGV Inlet / Leading Edge X X X 3 EGV Exit / Rake Rating Plane X X X X
a“X” denotes permanently installed instrumentation “O” denotes optional probe type measurements.

NASA/TM—2015-218455 (Corrected Copy) 11
5.0 Aerodynamic Performance Test Results Aerodynamic performance results are provided in this section in terms of overall stage performance,
then impeller, diffuser, and EGV subcomponent performance. Performance data were acquired from choke to stall, Nc = 70, 75, 85, 90, 95, 100 and 105 percent of design speed and as close as possible to the design exit tip clearance of 0.012 in.
Facility thrust load limitations required testing at a suppressed inlet pressure. All data were acquired with the plenum total-pressure (Station 0) set to approximately p0,0 = 11 psia.
The data reduction process for obtaining the one-dimensional (1-D) values used in the performance calculations is first described, followed by discussion of measured stage and subcomponent level performance metrics.
5.1 Performance Calculations/Data Reduction
The 1-D pressures and temperatures at the rating-plane and related machine-level and subcomponent-level metrics reported herein are based on area averages at the rake and annulus levels. A curve fit of gas tables was used for the efficiency calculations. Adiabatic and polytropic efficiencies were determined by comparing the ideal enthalpy rise associated with the measured pressure ratio and enthalpy rise calculated using T0 measurements from the rig. The approach accounts for temperature-dependent fluid property changes. As noted, the performance metrics were not humidity-corrected.
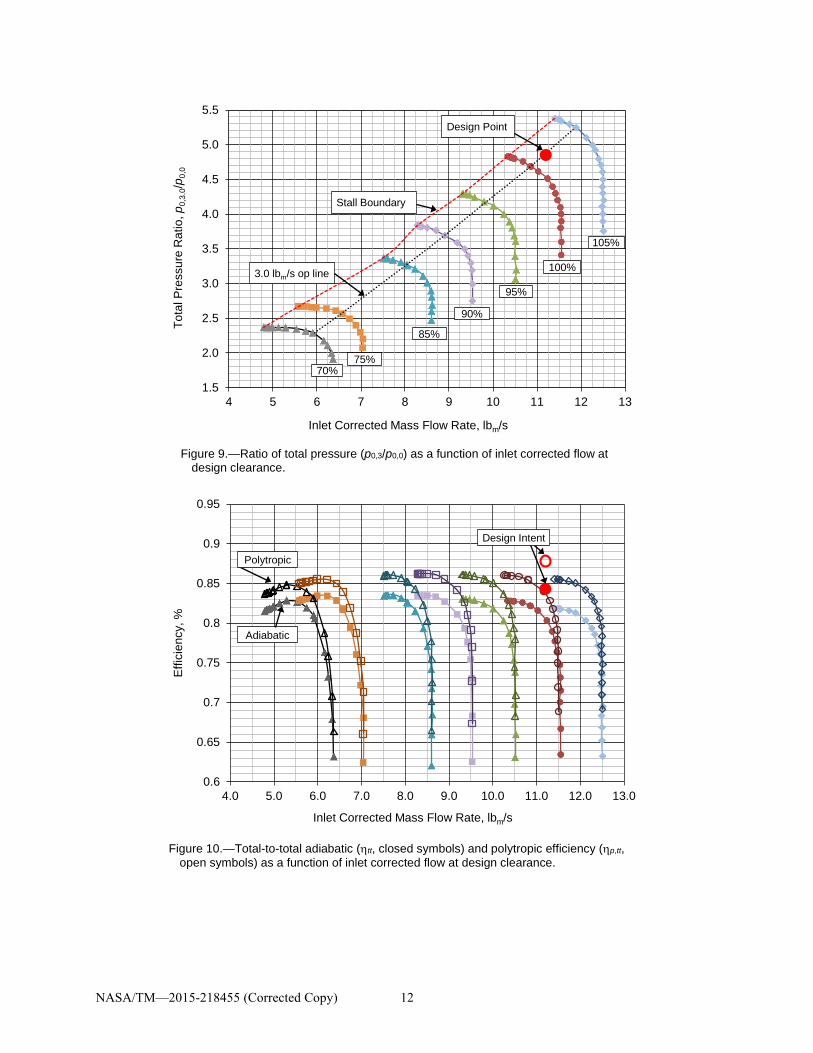
5.2 Stage Performance Overall performance at design clearance for the compressor stage as measured at the p0,0 = 11 psia
suppressed inlet pressure is presented in Figure 9 and Figure 10. The stability boundary and a reference exit-corrected mass flow condition (“throttle line”) of ṁc,ex = 3.0 lbm/s are shown. The data point defining the stability boundary corresponds to the last stable operating condition at that speed. The stability margin for all speeds is provided in Table 4.
At the design condition—that is, ṁc,ex = 3.0 lbm/s exit corrected flow, tip speed of Uc,0 = 1615 ft/s, and a tip clearance of 0.012 in.—the total-to-total pressure ratio was p0,3/p0,0 = 4.68, with a total-to-total adiabatic efficiency of 82.2 percent, polytropic efficiency of 85.5 percent, and SM = 7.5 percent. The achieved stage performance data at the design condition is compared to design-intent performance corrected for p0,0 = 11 psia suppressed-inlet conditions in Table 5. As shown, the compressor adiabatic efficiency (ηtt) is low by 2.75 points, the inlet corrected flow is low by 2.25 percent, and the exit Mach number and swirl, inferred from the exit rating plane measurements and machine flow, are high. The stability margin of the machine is significantly (4.5 points) lower than SM = 12 percent, the rig-scale design intent.
In this section, individual component performance levels for the impeller, diffuser, 90° bend, and EGV are presented, both to illustrate how the stage is performing as function of operating condition and to provide supporting evidence for a determination of where the subcomponent design may be underperforming.
NASA/TM—2015-218455 (Corrected Copy) 12
Figure 9.—Ratio of total pressure (p0,3/p0,0) as a function of inlet corrected flow at design clearance.
Figure 10.—Total-to-total adiabatic (ηtt, closed symbols) and polytropic efficiency (ηp,tt,open symbols) as a function of inlet corrected flow at design clearance.
1.5
2.0
2.5
3.0
3.5
4.0
4.5
5.0
5.5
4 5 6 7 8 9 10 11 12 13
Tota
l Pre
ssur
e R
atio
, p0,
3.0/p
0,0
Inlet Corrected Mass Flow Rate, lbm/s
Stall Boundary
3.0 lbm/s op line
Design Point
105%
100%
95%
90%
85%
75%70%
0.6
0.65
0.7
0.75
0.8
0.85
0.9
0.95
4.0 5.0 6.0 7.0 8.0 9.0 10.0 11.0 12.0 13.0
Effi
cien
cy, %
Inlet Corrected Mass Flow Rate, lbm/s
Adiabatic
Design Intent
Polytropic

NASA/TM—2015-218455 (Corrected Copy) 13
TABLE 4.—SURGE MARGINS AT 0.012 in. CLEARANCE
% Speed Surge margin 105 6.4% 100 7.5%
95 8.2% 90 10.6% 85 9.3% 75 18.4% 70 22.4%
TABLE 5.—MEASURED DESIGN POINT PERFORMANCE COMPARED TO DESIGN-INTENT PERFORMANCE [Nc = 100 percent, 0.012 in. tip clearance, suppressed inlet p0,0 = 11 psia.]
Metric Design Goal Rig scale design intent p0,0=14.7 psia
Rig scale design intent p0,0=11 psia
Measured p0,0=11 psia
(±uncertainty) Pressure ratio, p0,3/p0,0 4.85 4.80 4.68 ± 0.0074 Inlet flow rate, ṁc,in, lbm/s 11.2 11.1 10.85 ± 0.1 Exit flow rate, ṁc,ex, lbm/s 2.1 < ṁc,ex < 3.1 2.98 2.98 2.98 Adiabatic efficiency , ηtt, % 0.862 0.8495 0.822 ± 0.011 Polytropic efficiency, ηp,tt, % > 0.88 0.888 0.879 0.855 Adiabatic, total pressure to static pressure, ηts, % 0.852 0.8396 0.805 Exit Mach number, Mex 0.15 0.15 0.15 0.18 Exit flow angle, αex, deg 15° 14° 14° 34.3° Stability Margin, SM, % 13 12 12 7.5 Work factor 0.60 < ∆H0/U22 < 0.75 0.7905 0.793 0.81 Diameter ratio Dmax/D2 < 1.45 1.45 1.45 1.45
5.3 Impeller—Exit Survey Data and Performance
5.3.1 Spanwise Discharge The impeller performance is estimated using the Station 2.4 total pressure measurements and
Station 3 total temperature measurements. Station 2.2 three-hole probe survey data are acquired as well. A comparison of the spanwise profile of total pressure from the survey probe, instrumented vanes and pre-test CFD (design-intent) is provided in Figure 11(a). Note that reported pre-test CFD was conducted at standard day, rather than suppressed-inlet, conditions. The diffuser instrumented vane data agree well and are in qualitative agreement with the probe data, but the probe pressures are lower than expected. While the Kiel headed vane instrumentation at Station 2.4 was able to resolve a total pressure field which had yaw angle fluctuations, the three-port cobra probe only resolved the actual total pressure when the yaw angle misalignment was close to zero. Even when the probe was nulled, the pressure indicated by the probe center port provided an integrated (average) value that is lower than the local p0, potentially due to the flow angle fluctuations and other unsteady effects. Design-point impeller exit swirl angle, obtained using the three-hole probe at Station 2.2, is provided in Figure 12 along with the corresponding pre-test CFD result. Although in qualitative agreement, the design-intent turning achieved by the impeller is higher than measured. Due to the uncertainties in the cobra probe results, the probe measurements at Station 2.2 were only used for qualitative assessments; that is, their values were not used in detailed component performance analyses.
To assess the impact of speed on impeller discharge, the probe measurements were reduced by the respective spanwise average to obtain the collapse shown in Figure 11(b). Evidently the spanwise profile

NASA/TM—2015-218455 (Corrected Copy) 14
of total-pressure is relatively independent (on a reduced basis) of speed over the range (85 percent ≤ Nc ≤ 100 percent) considered, with the exception of the 85 percent Nc, which appears to be an outlier in this respect (cf. stall boundary in Figure 9).
(a)
(b) Figure 11.—(a) Comparison of design-point total-pressure at impeller exit. (Stations 2.2 and 2.4)
and pre-test CFD; and, (b) Comparison of total-pressure coefficient measured at impeller exit as a function of speed.
0
0.1
0.2
0.3
0.4
0.5
0.6
0.7
0.8
0.9
1
3 3.5 4 4.5 5 5.5 6
Frac
tion
of s
pan
from
hub
Local p0,2.2(z)/p0,0
NRA pre-test CFDModular Vane 1, Station 2.4Modular Vane 2, Station 2.43-hole probe survey data, Station 2.2
100% Nc
0
0.1
0.2
0.3
0.4
0.5
0.6
0.7
0.8
0.9
1
0.6 0.7 0.8 0.9 1 1.1 1.2
Frac
tion
of s
pan
from
hub
Local pressure coefficient, p0,2.2(z)/p0,2.2_average
85% Nc90% Nc95% Nc100% Nc

NASA/TM—2015-218455 (Corrected Copy) 15
Figure 12.—Comparison of measured flow angle from 3-hole probe at Station 2.2 and pre-test CFD at design point (100 percent Nc, ṁc,ex = 3 lbm/s).
Figure 13.—Comparison of impeller and stage adiabatic efficiency (ηTT) at 100 percent Nc as a function of inlet corrected flow from measurements at suppressed inlet conditions and pre-test CFD computed at standard day conditions (i.e., not corrected for suppressed inlet).
5.3.2 Impeller-Alone Efficiency Impeller and overall stage efficiency at 100 percent Nc are provided in Figure 13. The measured
impeller total-to-total adiabatic efficiency is near 87.5 percent throughout the flow range. The impact of diffuser/EGV losses is reflected in the substantial difference (4.5 to 10 points) between the impeller-alone and stage adiabatic efficiencies. Pretest CFD performance levels are provided in Figure 13 for context. Although the pre-test CFD shown was not corrected to account for suppressed inlet operation—refer to Table 5 for expected impact—a considerable shortfall in performance is evident.
0
0.1
0.2
0.3
0.4
0.5
0.6
0.7
0.8
0.9
1
50 60 70 80 90 100
Frac
tion
of s
pan
from
hub
Swirl angle α2.2, deg.
Probe survey data, RR = 1.047Design intent profile
100% Nc
60
65
70
75
80
85
90
95
10 10.5 11 11.5 12 12.5
Impe
ller a
nd s
tage
effi
cien
cy, %
Inlet corrected flow, lbm/s
Impeller (Sta. 0 to 2.4)Stage (Sta. 0 to 3)Impeller - pre-test CFDStage - pre-test CFD
100% Nc

NASA/TM—2015-218455 (Corrected Copy) 16
5.4 Diffuser, 90° Bend, EGV—Survey Data, Vane Loading, and Performance 5.4.1 Diffuser Exit Survey Data
Contours of measured total-pressure and flow angle from the three-hole probe surveys at Station 2.7 are provided in Figure 14 for design point operation conditions (Nc = 100 percent, ṁc,ex = 3 lbm/s). The surveys resolve one main-to-main passage, although two passages are reproduced in Figure 14 for visualization. The approximate positions of the main and splitter vanes are projected onto the contours for reference. Spanwise and pitchwise distortion is evident: the hub region is deficient in total pressure as is the suction side of the main blade (Passage A). A region of high swirl is evident on the shroud (to 20 percent immersion) on the suction side of the main blade, potentially indicative of separated or reversed flow.
The impact of throttle setting on the total-pressure field at diffuser exit is illustrated in Figure 15, where the 100 percent Nc operating conditions at choke, design-point, and near-stall are presented. There is an evident redistribution of the total-pressure with throttle setting, with peak total-pressure rebalancing between Passages A and B. The corresponding swirl levels discharged from the diffuser section change little with throttle setting, though swirl does increase near the suction side (SS) trailing edge of the main vane as stall is approached.
The transport of total pressure through the diffuser/90° bend, and the EGV was visualized using survey (Station 2.7) and rake data (Stations 2.8 and 3.0) in the diffusion system. Example results are provided in Figure 16 for design-point operation (100 percent Nc and ṁc,ex = 3 lbm/s). As evident by comparing the bottom two p0-distributions (Stations 2.7 and 2.8), the low-momentum flow exiting the diffuser near the hub is resolved by EGV rakes at lowest radius. It is also noted that it appears that much of the higher total-pressure flow located near the shroud region is not resolved by the EGV rake. Consequentially, 1-D annulus averaged values for p0 at the EGV inlet (not reported herein) may be underestimated by the rake layout. Better measurement resolution would be needed to quantify the uncertainty of this 1-D annulus average at the EGV leading edge.
Figure 14.—Contours of measured total pressure and flow angle at diffuser exit (Station 2.7) for design-point operation (Nc = 100 percent, ṁc,ex = 3 lbm/s).

NASA/TM—2015-218455 (Corrected Copy) 17
Figure 15.—Contours of measured p0, and flow angle α, at diffuser exit (Sta. 2.7) along design-point speed. (Nc = 100 percent) speedline during choke, design-point, and near-stall operation. (Note: legends are on different scales for p0.)
Figure 16.—Contours of measured p0 (Stations 2.7, 2.8, and, 3.0) for design-point operation (Nc = 100 percent, ṁc,ex = 3 lbm/s) through diffusion system from diffuser exit, to 90° bend, to EGV.
The total-pressure distribution at EGV exit (Station 3.0, Figure 16) is highly nonuniform (pitchwise) and is reflective of the high turning in the EGV and the position of the EGVs relative to the diffuser. Although not quantified, the predicted EGV exit flow field is provided as a pretest CFD line contour inset in Figure 16, which also reflects a high level of pitchwise segregation of total pressure: the rating indicates that one EGV passage is particularly weak. This flow deficiency is traceable to the wake of a main diffuser vane as noted during aerodynamic design (Ref. 2).
5.4.2 Diffuser Vane Loading The loading diagrams for the diffuser main- and splitter-vanes are provided in Figure 17 for near-
design-point operation at inlet corrected flow of ṁc,in = 11 lbm/s. The experimental values are from static taps located around the main and splitter vanes (approximately 0.1 in. from vane surfaces) at the shroud

NASA/TM—2015-218455 (Corrected Copy) 18
endwall; although not reported here, corresponding hub measurements were available as well. Evidently the measured overall pressure rise at the near-design inlet corrected flow was lower than predicted. Note that the negative loading on the splitter vane reflects operation at negative incidence, in strong contrast to the lightly loaded splitter of pre-test CFD. The minimum pressures measured on the splitter pressure-side (near r = 10 in.) reflect higher velocities in Passage A than intended by design. In test, the positive loading on the main vane increases in the region of negative loading on the splitter (9.9 < r (in.) < 11.1).
(a)
(b) Figure 17.—Comparison of predicted and measured loading diagrams (normalized static
pressure versus radius) at the shroud on (a) diffuser main vane and (b) splitter vane, at near design-point operation (11 lbm/s, 100 percent Nc).
1.5
2
2.5
3
3.5
4
4.5
5
8.5 9 9.5 10 10.5 11 11.5
Nor
mal
ized
sta
tic p
ress
ure,
p/p
0,0
Radius, in.
Pressure side - pre-test CFDSuction side - pre-test CFDPressure side - dataSuction side - data 100% Nc
1.5
2
2.5
3
3.5
4
4.5
5
8.5 9 9.5 10 10.5 11 11.5
Nor
mal
ized
sta
tic p
ress
ure,
p/p
0,0
Radius, in.
Pressure side - pre-test CFDSuction side - pre-test CFDPressure side - dataSuction side - data

NASA/TM—2015-218455 (Corrected Copy) 19
5.4.3 Performance The loss and pressure rise coefficients for the diffuser, the 90° bend plus EGV, and the overall
diffusion system (diffuser, 90° bend, EGV) are provided in Figure 18 and Figure 19. The loss and pressure rise coefficients, given area-averaged 1-D inlet (“in”) and exit (“ex”) values, are obtained using
( ) ( )ininexin pppp −−=ω ,0,0,0 / and ( ) ( )inininexp ppppc −−= ,0/ , respectively. The diffuser loss levels(Figure 18) are reduced as the stage is throttled to stall. Note that minimum diffuser loss occurs at a slightly lower exit-corrected flow than the ṁc,ex = 3 lbm/s design-intent. The loss coefficient in the 90° bend plus EGV is relatively constant through choke and throughout much of the speed range. The minimum loss of each subcomponent of the stage does not occur at the same flow rate, partly contributing to the inability of the stage to achieve design-intent performance (see Figure 9 and Figure 10).
(a)
(b)Figure 18.—Total-pressure loss coefficient across diffuser, 90° bend + EGV, diffuser +
bend + EGV, as a function of (a) stage inlet and (b) stage exit corrected flow.
0
0.1
0.2
0.3
0.4
0.5
0.6
0.7
0.8
0.9
10 10.5 11 11.5 12
Loss
coe
ffici
ent
Inlet corrected flow, lbm/s
Diffuser90-deg. bend + EGVDiffuser + 90-deg. bend + EGV
Stall Design Intent(ṁc,ex = 3 lbm/s)
Choke
100% Nc
0
0.1
0.2
0.3
0.4
0.5
0.6
0.7
0.8
0.9
2.5 3 3.5 4 4.5 5
Loss
coe
ffici
ent
Exit corrected flow, lbm/s
Diffuser90-deg. bend + EGVDiffuser + 90-deg. bend + EGV
Stall Design
Choke
100% Nc

NASA/TM—2015-218455 (Corrected Copy) 20
The static pressure rise coefficients of the diffuser and the 90° bend plus EGV system are provided in Figure 19 as a function of inlet- and exit-corrected flow. The static pressure rise coefficient for the 90° bend plus EGV is essentially constant between unchoke and stall.
(a)
(b) Figure 19.—Static pressure rise coefficient across diffuser, 90° bend + EGV, diffuser +
bend + EGV, as a function of (a) stage inlet and (b) stage exit corrected flow.
-0.1
0
0.1
0.2
0.3
0.4
0.5
0.6
0.7
0.8
10 10.5 11 11.5 12
Sta
tic p
ress
ure
rise
coef
ficie
nt
Inlet corrected flow, lbm/s
Diffuser90-deg. bend + EGVDiffuser + 90-deg. bend + EGV
Stall
Design-intent (ṁc,ex = 3 lbm/s)
Choke
100% Nc
-0.1
0
0.1
0.2
0.3
0.4
0.5
0.6
0.7
0.8
2.5 3 3.5 4 4.5 5
Sta
tic p
ress
ure
rise
coef
ficie
nt
Exit corrected flow, lbm/s
Diffuser90-deg. bendEGV
100% Nc
Choke
Stall Design

NASA/TM—2015-218455 (Corrected Copy) 21
6.0 Compressor Sensitivities 6.1 Reynolds Number Sensitivity
As presented in Section 5.0, facility limitations required testing at reduced plenum pressures. Operation at reduced pressure and, hence, Reynolds number, impacted performance detrimentally as noted in Table 5. A Reynolds number, Re sensitivity was conducted at 85 percent Nc by varying plenum pressure between 10 ≤ p0,0 ≤ 13 psia, effecting a 25 percent change in Re. Once the plenum pressure was established, a typical speed line from choke to near stall was run. The effect of Reynolds number on measured stage adiabatic efficiency was evaluated against a power-law correlation of efficiency loss to Reynolds number relationship typically used in compressor testing.
n
refreftt
tt−
=
η−η−
ReRe
11
,
The exponent, n, represents the rate of efficiency loss with Reynolds number for a specific compressor. The reference condition in our case was for a plenum pressure of 13.0, and the compressor operating at an exit corrected flow condition of 3.0 lbm/s. A curve fit of the three tested data points results in n = 0.077 for this machine, typical of previous findings (Ref. 8) and turbulent flow scaling (n = 0.1). It is noted that the pre-test CFD in Table 5 predicted a greater sensitivity (n 0.3).
6.2 Tip-Clearance Sensitivity
Compressor sensitivities to tip-clearance derivatives of flow rates, stage pressure ratio, stage efficiency and overall stability margin were obtained. Tip gaps of ε = 0.012, 0.015 and 0.018 in. corresponding to reduced clearances, ε/b, of 2, 2.5 and 3 percent for this impeller with a trailing edge span of b = 0.609 in. Speed lines from choke to stall were run at 100 percent Nc speed, with the stall point being identified as the last stable operating point that could be obtained. Performance sensitivities were assessed at the exit corrected flow rate of 3.0 lbm/s, and provided in Table 6, with the detailed speed lines documented in Figure 20(a) and (b).
The reduction in efficiency of 0.24 points for a 1 percent change in ε/b is consistent with findings of Skoch et al. (Ref. 8), but the increase in surge margin as the clearance increases is not a typical result. As noted in Reference 3, this SM response with clearance may be reflective of hub endwall weakness in the stability limiting element. For a 1 percent change in ε/b, the pressure rise and inlet corrected mass flow rates respond with reductions of 0.44 and 0.47 points, respectively.
TABLE 6.—TIP CLEARANCE SENSITIVITIES FROM LINER CURVE FIT OF ∆y/y RELATIVE TO ∆ɛ/b
Tip clearance, ɛ/b
Surge margin Adiabatic efficiency
p0,3/p0,0 Inlet corrected
flow 0.02 7.5% 0.822 4.69 10.85 0.025 7.8% 0.821 4.67 10.80 0.03 7.9% 0.819 4.65 10.77
Sensitivities –0.24 –0.44 –0.47

NASA/TM—2015-218455 (Corrected Copy) 22
(a)
(b) Figure 20.—Tip-clearance sensitivity (a) pressure ratio, and (b) adiabatic efficiency.
3.8
4.0
4.2
4.4
4.6
4.8
5.0
10.0 10.5 11.0 11.5 12.0
Pre
ssur
e R
atio
, p 0
,3.0
/p0,
0
Inlet Corrected Flow, lbm/s
Design, ɛ = 0.012", ɛ/b=2.0ɛ = 0.015", ɛ/b=2.5ɛ = 0.018", ɛ/b=3.0
3.0 lbm/s Operating Line
0.72
0.74
0.76
0.78
0.80
0.82
0.84
10.0 10.5 11.0 11.5 12.0
Adi
abat
ic E
ffici
ency
, ηtt
Inlet Corrected Flow, lbm/s
Design, ɛ = 0.012", ɛ/b=2.0ɛ = 0.015", ɛ/b=2.5ɛ = 0.018", ɛ/b=3.0
3.0 lbm/s Operating Line
NASA/TM—2015-218455 (Corrected Copy) 23
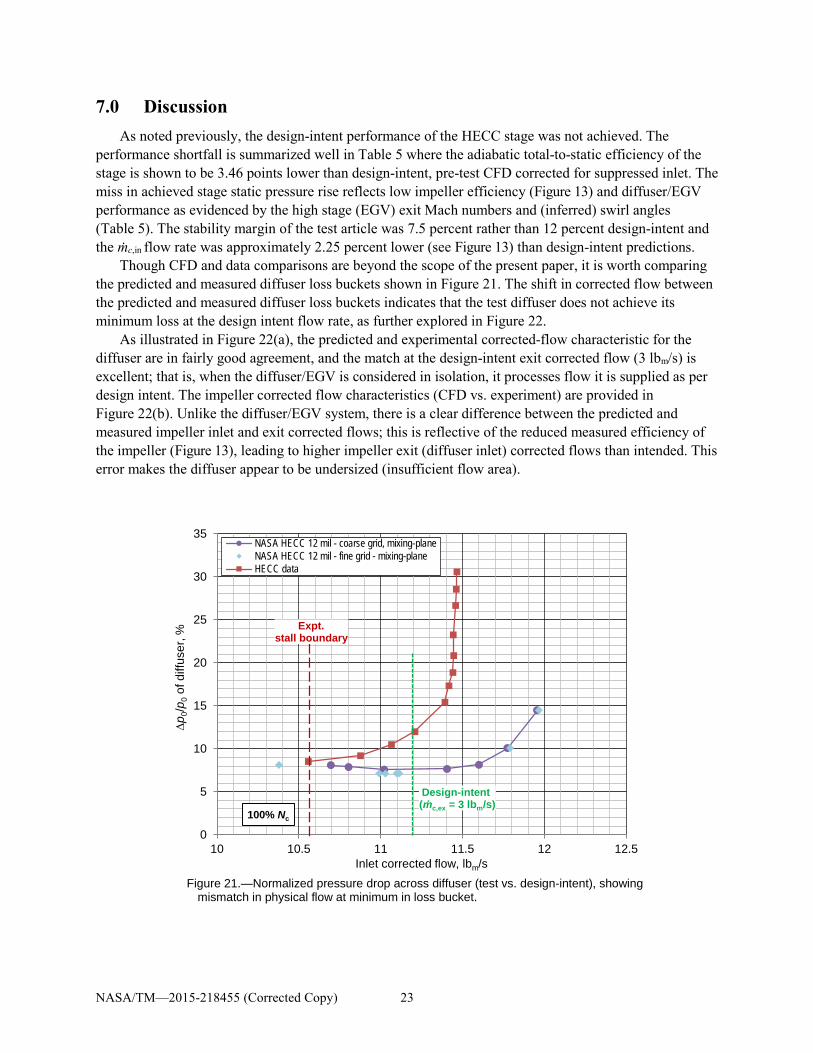
7.0 Discussion As noted previously, the design-intent performance of the HECC stage was not achieved. The
performance shortfall is summarized well in Table 5 where the adiabatic total-to-static efficiency of the stage is shown to be 3.46 points lower than design-intent, pre-test CFD corrected for suppressed inlet. The miss in achieved stage static pressure rise reflects low impeller efficiency (Figure 13) and diffuser/EGV performance as evidenced by the high stage (EGV) exit Mach numbers and (inferred) swirl angles (Table 5). The stability margin of the test article was 7.5 percent rather than 12 percent design-intent and the ṁc,in flow rate was approximately 2.25 percent lower (see Figure 13) than design-intent predictions.
Though CFD and data comparisons are beyond the scope of the present paper, it is worth comparing the predicted and measured diffuser loss buckets shown in Figure 21. The shift in corrected flow between the predicted and measured diffuser loss buckets indicates that the test diffuser does not achieve its minimum loss at the design intent flow rate, as further explored in Figure 22.
As illustrated in Figure 22(a), the predicted and experimental corrected-flow characteristic for the diffuser are in fairly good agreement, and the match at the design-intent exit corrected flow (3 lbm/s) is excellent; that is, when the diffuser/EGV is considered in isolation, it processes flow it is supplied as per design intent. The impeller corrected flow characteristics (CFD vs. experiment) are provided in Figure 22(b). Unlike the diffuser/EGV system, there is a clear difference between the predicted and measured impeller inlet and exit corrected flows; this is reflective of the reduced measured efficiency of the impeller (Figure 13), leading to higher impeller exit (diffuser inlet) corrected flows than intended. This error makes the diffuser appear to be undersized (insufficient flow area).
Figure 21.—Normalized pressure drop across diffuser (test vs. design-intent), showing mismatch in physical flow at minimum in loss bucket.
0
5
10
15
20
25
30
35
10 10.5 11 11.5 12 12.5
∆p 0
/p0
of d
iffus
er, %
Inlet corrected flow, lbm/s
NASA HECC 12 mil - coarse grid, mixing-planeNASA HECC 12 mil - fine grid - mixing-planeHECC data
Design-intent (ṁc,ex = 3 lbm/s)
100% Nc
Expt.stall boundary

NASA/TM—2015-218455 (Corrected Copy) 24
(a)
(b) Figure 22.—(a) Diffuser corrected flows and (b) Impeller corrected flow, showing a mismatch
in impeller and diffuser corrected flow capacity.
2
2.2
2.4
2.6
2.8
3
3.2
2 2.5 3 3.5 4
Impe
ller e
xit c
orre
cted
flow
, lb m
/s
Stage exit corrected, lbm/s
NASA HECC 12 mil - coarse grid - mixing-planeNASA HECC 12 mil - fine grid - mixing planeHECC test data
Design-intent100% Nc
2
2.2
2.4
2.6
2.8
3
3.2
10 10.5 11 11.5 12 12.5
Impe
ller e
xit c
orre
cted
flow
, lb m
/s
Stage (impeller) inlet corrected flow, lbm/s
NASA HECC 12 mil - coarse grid - mixing-planeNASA HECC 12 mil - fine grid - mixing-planeHECC test data
Design-intent (ṁc,ex = 3 lbm/s)100% Nc

NASA/TM—2015-218455 (Corrected Copy) 25
8.0 Summary The aerodynamic performance of a new centrifugal compressor stage, designed to meet a high
performance goal set consistent with future turboshaft engine needs, was established by experimental testing. The experimental results presented are associated with an openly available geometry (Ref. 3). In addition to providing future insight into technical challenges associated with compact, highly loaded centrifugal compressors, the dataset is intended to contribute value to the turbomachinery community in terms of computational/modeling tools assessment and development.
The stage and subcomponent performance levels were described. The achieved performance and stability was found to be lower than design-intent. Detailed root-cause-analysis of the performance shortfall was initiated within the NRA contract (Ref. 3) under which the work was conducted. These analyses continue, with intent to inform future design efforts.
References 1. Welch, G. E., Hathaway, M. D., Skoch, G. J., and Snyder, C. A., “Rotary-Wing Relevant Compressor
Aero Research and Technology Development Activities at Glenn Research Center,” Proc. AHS Int.65th Annual Forum, May, 2009; also NASA/TM—2012-217280, Mar. 2012.
2. Lurie, E. A., Van Slooten, P. R., Medic, G. Mulugeta, J. M., Holley, B. M., Feng, J., Sharma, O. P.,and Ni, R. “Design of a High Efficiency Compact Centrifugal Compressor for RotorcraftApplications,” AHS Int. 67th Annual Forum, May 2011.
3. Medic, G., Sharma, O., Jongwook, J., Hardin, L. W., McCormick, D. C., Cousins, W. T., Lurie, E. A.,Shabbir, A., Holley, B. M., and Van Slooten, P. R., “High Efficiency Centrifugal Compressor forRotorcraft Applications,” NASA/CR—2014-218114, Nov. 2014.
4. Brokopp, R. A. and Gronski, R. S., “Small Engine Components Test Facility Compressor TestingCell,” AIAA-92-3980, July, 1992; also NASA TM-105685, 1992.
5. McCain, T. F., and Holbrook, G. J., “Coordinates for a High Performance 4:1 Pressure RatioCompressor,” NASA CR-204134, July 1997
6. ASME, “PTC 19.5-2004 Performance Test Codes,” 20057. Giel, P.W., Thurman, D. R., Lopez, I., Boyle, R. J., Van Fossen, G. J., Jett, T. A., Camperchioli, W.
P., and La, H., “Three Dimensional Flow Field Measurements in a Transonic Turbine Cascade,”ASME 96-GT-113, June 1992
8. Skoch, G. J., Moore, R. D., “Performance of Two 10-lb/sec Centrifugal Compressors With DifferentBlade and Shroud Thicknesses Operating Over a Range of Reynolds Numbers,” AIAA 87-1745, July1987.


