aeolian features and processes - explore nature - national park
TRANSCRIPT

INTRODUCTION
Aeolian processes, involving erosion, transportation, and deposition of sediment by the wind, occur in a variety of envi-ronments, including the coastal zone, cold and hot deserts, and agricultural fi elds. Common features of these environments are a sparse or nonexistent vegetation cover, a supply of fi ne sedi-ment (clay, silt, and sand), and strong winds. Aeolian processes are responsible for the emission and/or mobilization of dust and the formation of areas of sand dunes. They largely depend on other geologic agents, such as rivers and waves, to supply sedi-ment for transport.
Areas of sand dunes occur in inland and coastal settings, where they often provide a distinctive environment that pro-vides habitats for endemic and rare or threatened species. In both coastal and inland settings, dune migration and sand encroach-ment may impact neighboring ecosystems and resources, as well as infrastructure.
Transport of fi ne sediment by wind may cause dust storms, events in which visibility is reduced to less than 1 km by blowing dust. Dust storms impact air quality in their immediate vicinity as well as in areas downwind. Deposition of dust may have a signifi cant effect on the composition and nature of soils in arid regions and beyond. Far-traveled dust from distant sources may have a signifi cant effect on soil chemistry and nutrient status (e.g., Farmer, 1993).
Aeolian Processes, Landforms, and Deposits
This section provides a brief introduction to aeolian pro-cesses and landforms and their deposits. For more detailed infor-mation and an in-depth discussion of the topic, see Lancaster (1995) for desert dunes, and Nordstrom et al. (1990) for coastal dunes. Goudie and Middleton (2006) provide an excellent review of desert dust processes, while Goudie et al. (1999) provide a good short overview of aeolian processes in general.
Transport of Particles by WindMovement of particles by the wind takes place by a combina-
tion of direct wind shear stress and atmospheric turbulence. There are three modes of sediment transport by wind: creep or repta-tion; saltation, and suspension (Fig. 1). The mode of transport depends primarily on the ratio between particle settling veloc-ity, and hence particle size, and wind shear stress and turbulence intensity. Very small particles (<20 microns) are transported in suspension (tens of km or greater) and are kept aloft by turbulent eddies in the wind. True suspension occurs when the particle set-tling velocity is very small compared to the turbulence intensity of the wind. Larger particles (20–70 microns) undergo short-term suspension for distances of tens to hundreds of meters; material of sand size (70–1000 microns) is transported mainly in a series of short hops (saltation), in which the vertical component of wind velocity (turbulence) has a minimal effect on particle trajecto-ries. Material coarser than 500 microns in diameter (coarse sand) is transported on surface by reptation and creep. The modes of transport are interdependent: saltating sand particles eject silt- and
1
The Geological Society of America2009
Aeolian features and processes
Nicholas LancasterDivision of Earth and Ecosystem Sciences, Desert Research Institute, Reno, Nevada 89512, USA
Lancaster, N., 2009, Aeolian features and processes, in Young, R., and Norby, L., Geological Monitoring: Boulder, Colorado, Geological Society of America, p. 1–25, doi: 10.1130/2009.monitoring(01). For permission to copy, contact [email protected]. ©2009 The Geological Society of America. All rights reserved.
Figure 1. Modes of sediment transport by the wind (after Pye, 1987).

2 Lancaster
clay-sized particles into the wind and impact coarse grains that are rolled along the bed.
Grains begin to move and sediment is entrained by the wind when fl uid forces (lift, drag, moment) exceed the effects of the weight of the particle, and any cohesion between adjacent par-ticles as a result of moisture, salts, or soil crusts. The threshold wind speed at which grains begin to move is strongly dependent
on particle size (Fig. 2A). For quartz sand, the minimum thresh-old velocity is associated with fi ne sand (~100 microns diameter). The mass fl ux or transport rate of sand has been determined by numerous laboratory wind tunnel and fi eld studies to be propor-tional to the cube of wind shear velocity above a threshold value (Fig. 2B). For any wind shear velocity, there is a potential rate of sand transport or transport capacity, which is only reached when
.01 0.1 1.0 2.0 3.00
20
40
60
Grain diameter (mm)
u * (cm
/sec
)
Fluid
Thres
hold
Impac
t Thre
shold
A
5 10 50 100 5000.01
0.05
0.10
0.50
1.00
5.0
10.0
u* (cm/sec)
Sedi
men
t flu
x q(
gm/c
m/s
ec)
3 2 1
Belly 1964; 0.3 mmKawamura 1951; 0.25 mmBagnold 1941; 0.25 mmWilliams 1964;
1. spheres2. sand3. crushed quartzite
B
••• •••
•••• ••••• ••
••••
••••••••• •••• •••
••
•••••
•••
••••• ••
••
•��
��
�����
�
�
Shear velocity (m s-1)
Ver
tical
dus
t flu
x (µ
g m
2 s-
1 )
• �Yukon Texas Australia Mali
0.1 1.0 2.0
106
105
104
103
102
10
1
10-1
10-2
F = 4.46 x 105
u*
4
F = 1.40 x 104
u*
4
F = 7.21 x 103 u*
4
F = 1.94 x 103 u*
4
C
Figure 2. Transport of sediment by the wind: (A) Relation between threshold wind shear velocity and particle size (from (Bagnold, 1941). (B) Mass fl ux of sand as a function of wind shear velocity (from Lancaster, 1995). Data from laboratory wind tunnel experiments. (C) Relations between horizontal fl ux of sand-sized particles and vertical fl ux of dust (from Nickling et al., 1999). Data from fi eld experiments. Figure from Lancaster (2005).

Aeolian features and processes 3
the availability of sediment is unrestricted (e.g., most loose sand surfaces). In these conditions, the wind is saturated with respect to transport capacity.
Very fi ne grains (silt and clay size) are inherently resistant to entrainment, yet are readily transported by the wind. Recent studies have shown the critical role of impacting sand grains in the mobilization of silt- and clay-size particles and demonstrated the close relations between the horizontal fl ux of sand-size par-ticles and the vertical fl ux of fi ne particles. In these situations, the horizontal mass transport rate is directly related to shear velocity (Fig. 2B), so dust emissions scale to the fourth power of wind shear velocity (Fig. 2C). Where there is a limited supply of par-ticles able to abrade soil clods or playa crusts, dust emissions are limited by the supply of particles rather than the wind shear velocity, and the vertical fl ux of dust is almost independent of wind shear velocity.
Wind ErosionErosion by wind involves two linked processes: abrasion
(mechanical wearing of coherent materials, including playa crusts and clods created by tillage) and defl ation (removal of loose material). Considerable attention has been devoted to the processes and rates of wind erosion because of their impact on agriculture, especially in semi-arid regions, and the implications of dust emissions for air quality. Wind erosion abrades crops, removes organic matter, nutrients and fertilizer, and changes soil texture. The products of wind erosion (especially dust particles) impact air quality, atmospheric radiative properties, and human health, causing respiratory illnesses. Rates of wind erosion vary widely and for a given wind shear velocity are dependent on soil or sediment texture and the degree of crusting and cohesion. The highest emission rates for fi ne-grained sediment are associated with soils of loamy texture, especially those that have been dis-turbed by vehicular traffi c and/or animals.
Aeolian DepositsAeolian deposits include sand seas and dune fi elds, deposits
of silt (loess), and fi ne-grained material that forms a signifi cant component of desert margin and other soils.
Aeolian deposits—silt and clay size. Deposits of wind-transported, silt-sized quartz particles, termed loess, cover as much as 10% of Earth’s land surface. Loess deposits are wide-spread in areas of northern China, southern central Asia, central Europe, Argentina, Alaska, and the central United States. Much of the material was thought to be derived from silt particles pro-duced by glacial grinding and supplied to aeolian processes by glacial outwash (“glacial loess”), but other processes, including frost shattering, salt weathering, reduction in size during trans-port by rivers, and aeolian abrasion are important, especially in the formation of “desert loess.”
Silt- and clay-sized material of aeolian origin is also an impor-tant component of many desert margin soils. Deposition of silt plays a role in the formation of many stone pavement surfaces in desert regions (desert pavement). These surfaces are characterized
by a surface layer of gravel or larger clasts (particles) that overlie fi ne-grained materials. Detailed studies of these surfaces show that the surface layer of gravel rests on a layer of soil-modifi ed dust that may be a meter or more thick and mantles bedrock or materials deposited by other processes (e.g., alluvial sediments). The dust is trapped by the clasts and deposited between them. The fi ne material is incorporated into the mantle by the shrinking and swelling of clay minerals so that the clasts remain at the surface as they infl ate over periods of thousands of years.
Aeolian deposits—sand dunes. Aeolian dunes form part of a hierarchical system of self-organizing bedforms which com-prises: (1) wind ripples (spacing 0.1–1 m); (2) individual simple dunes or superimposed dunes on compound and complex dunes (spacing 50–500 m); and (3) compound and complex (mega-) dunes or draa (spacing more than 500 m). Dunes occur wherever there is a suffi cient supply of sand-sized sediment, winds to transport that sediment, and conditions that promote deposition of the transported sediment. These requirements are satisfi ed in two main environments: (1) coastal areas with sandy beaches and onshore winds; and (2) desert areas. Most dunes occur in con-tiguous areas of aeolian deposits called sand seas (>100 km2) or dune fi elds.
Wind ripples (Fig. 3) typically have a wavelength of 0.05–0.2 m and an amplitude of 0.005–0.010 m. They are ubiquitous on sand surfaces, except those undergoing very rapid erosion or deposition, and form because a fl at sand surface over which sand transport by saltation and reptation occurs is dynamically unstable.
Aeolian dunes occur in a self-organized pattern that depends on the wind regime (especially its directional variability) and the supply of sand. Sand dunes occur in four main morphologic types (Fig. 4): Crescentic (transverse), linear, star, and para-bolic. The simplest dunes form in areas characterized by a narrow
Figure 3. Wind ripples, Gran Desierto, Mexico. Wind direction from left to right.

4 Lancaster
range of wind directions. In the absence of vegetation, crescen-tic dunes will be the dominant form. Isolated crescentic dunes or barchans occur in areas of limited sand supply, and coalesce laterally to form crescentic or barchanoid ridges as sand supply increases (Figs. 5A and 5B). Linear dunes are characterized by their length (often more than 20 km) sinuous crestline, parallel-ism, and regular spacing (Figs. 5C and 5D). They form in areas of bimodal or wide unimodal wind regimes. Star dunes have a pyra-midal shape, with three or four sinuous sharp-crested arms radiat-ing from a central peak and multiple avalanche faces (Fig. 5E). Star dunes occur in multidirectional or complex wind regimes and are the largest dunes in many sand seas, reaching heights of more than 300 m. Parabolic dunes (Fig. 5F) are characterized by a U or V shape with a “nose” of active sand and two partly veg-etated arms that trail upwind. They are common in many coastal dune fi elds and semi-arid inland areas, and they often develop from localized blowouts in vegetated sand surfaces. Other impor-tant dune types include nebkhas, or hummock dunes, anchored by vegetation (common in many coastal dune fi elds); lunettes (often composed of sand-sized clay pellets) that form downwind of small playas; and a variety of topographically controlled dunes (climbing and falling dunes, echo dunes).
Relations between dune types and wind regimes indicate that the main control of dune type is the direction of the wind (Fig. 6). Grain size, vegetation cover, and sediment supply play subordinate roles in desert areas. In semi-arid and coastal areas, vegetation cover plays a major role in aeolian dynamics.
STRESSORS AND POSSIBLE CHANGES
The state of an aeolian geomorphic system is controlled by the supply of sediment of a size suitable for transport by the
wind; the mobility of the supplied sediment, which is controlled by wind conditions; and the availability of sediment for transport, determined by vegetation cover and soil moisture (Kocurek and Lancaster, 1999). Changes in these external drivers can be the result of climate or human impacts. Climate change and variabil-ity affects the mobility of sediment through variations in wind strength; vegetation cover and soil moisture are directly infl u-enced by the amount of precipitation; the supply of sediment may be affected by changes in wave energy, beach sediment bud-gets, or river discharge. Changes to aeolian systems that can be attributed to the effects of climate variability on annual to decadal time scales include changes in the magnitude and frequency of dust storms (Middleton, 1989), sand transport rates (Lancaster and Helm, 2000), and activation or stabilization of areas of sand dunes (Wolfe, 1997). Such changes are a good indication of the response of a landscape to drought periods. In addition, human impacts may affect vegetation cover by grazing pressure or tram-pling by animals or people, and increase sediment availability of soils due to disturbance by animals or off-road vehicles. Humans can also directly or indirectly affect sediment supply from rivers or the coastal zone.
VITAL SIGNS
Three main groups of vital signs for aeolian features and processes have been identifi ed. First, rates of sediment movement by the wind give an indication of the magnitude and frequency of aeolian transport events in an area, as well as changes in time and space in response to stressors. Measurements or estimates of rates of sediment transport (sand and/or dust) by the wind provide information on the quantity of sediment transported in this manner and therefore the likely contribution of wind action to erosion and deposition. Second, dune fi eld dynamics provide information on how areas of dunes are responding to external and internal stressors, including disturbance, changes in sediment supply, and climate change and variability. Lastly, dune dynam-ics provide information on how individual dunes or groups of dunes are responding to stressors.
The level of effort and cost for each monitoring method are summarized in Table 1.
VITAL SIGN 1: FREQUENCY AND MAGNITUDE OF DUST STORMS
The magnitude and frequency of dust storms is an index of rates of wind erosion in the immediate vicinity of a defi ned loca-tion. Reduction of visibility by blowing dust may also indicate an infl ux of dust from neighboring upwind sources. In addition to the methods described below, some information may also be obtained from the visibility monitoring programs maintained by the Air Resources Division of the National Park Service and its coopera-tors, available at http://www2.nature.nps.gov/air/monitoring/.
Crescentic Linear
Star Parabolic
Figure 4. Major dune types (after McKee, 1979b).

A
B
C
D
E
FFigure 5. Satellite images and aerial photographs of major dune types: (A) barchans and crescentic dunes, Namib Sand Sea; (B) compound crescentic dunes (Liwa, United Arab Emirates); (C) parabolic dunes, Casper, Wyoming; (D) simple linear dunes (Kalahari Desert); (E) complex linear dunes (Namib Sand Sea); (F) star dunes (Gran Desierto, Mexico). Figure from Lancaster (2005).

6 Lancaster
Monitoring Methods
Level 1: Visual Observation of Dust StormsDust storms (Fig. 7) are defi ned as severe weather condi-
tions in which visibility is reduced to 1 km or less by blowing dust. The frequency of dust storms is measured by the number of such events in a given time period. The magnitude of dust storms can be assessed by the duration of such conditions. Dust events (also known as dust haze) are conditions when visibility is reduced to 11.3 km or less by dust suspended in the air. Blowing dust is a situation where dust is raised to a height of 2 m or more by strong winds, but does not reduce visibility to less than 1 km. Figure 8 provides an example of visibility reduction as a result of a dust storm.
First order meteorological stations may record these con-ditions as part of their normal schedule of hourly observations. Such data have been used to assess the frequency of dust storms in relation to climatic parameters, such as annual and seasonal precipitation (e.g., Bach et al., 1996; Brazel, 1989; Goudie, 1983; Goudie and Middleton, 1992; MacKinnon et al., 1990; Middle-ton, 1989). In many areas, dust storm frequency increases in the period following years of lower than average rainfall, although direct correlation between drought conditions and dust storm fre-quency is not always evident.
Equipment required. No equipment is required.Complexity. The complexity of this method is very low; it
can be conducted by a single observerCost. The cost is very low. No instrumentation is required,
except for wind speed measurements.
Methodology. Monitoring of dust storms can be undertaken at selected locations where dust storms are known to occur and suitable landmarks exist for visibility determinations. Landmarks at 1 km and 11.3 km distance from the observation point should be identifi ed, and the time and date of dust conditions should be recorded, as well as any relevant meteorological conditions (such as wind speed) and site conditions (such as vegetation cover). The number of dust events and their duration should be recorded on a monthly and annual basis and compared to rainfall and ante-cedent vegetation conditions.
Timing. Timing is event driven.
Level 2: Camera Stations (Still and Video)Remotely activated camera stations can be used to image the
time, location, and characteristics of dust plumes.Equipment required. A camera station is required.Cost. The cost is moderate—around $3,000 to $4,000 per
station. (All amounts listed herein are U.S. dollars.)Complexity. Stations are moderately complex to set up and
maintain. Technical assistance is required for set up.Methodology. Video cameras can be used as they are at
Owens Lake, California, by the Great Basin Unifi ed Air Pol-lution Control District, but their resolution and data capacity are limited. For real-time images see http://www.gbuapcd.org/dustcam.htm. Digital still camera stations have been used to monitor dust storms in the Mojave National Preserve since 2000 (Tigges et al., 2001). The stations automatically acquire digital color images of dust storms, with the cameras triggered by wind speeds above a predetermined threshold. The images are used to
Figure 6. Relations between dune types and wind regimes. Figure from Lancaster (2005).
Crescentic Ridges
BarchanLinear
Star 50
40
30
20
10
00 0.1 0.2 0.3 0.4 0.5 0.6 0.7 0.8 0.9
Directional variability of wind regime (RDP / DP)
Eq
uiv
ale
nt
sa
nd
thic
kn
es
s (m
)CrescenticLinearStar
Namib Sand Sea
Fryberger (1979)

TA
BLE
1. V
ITA
L S
IGN
S: A
EO
LIA
N P
RO
CE
SS
ES
AN
D F
EA
TU
RE
S
robaL tso
C sdeen lacinhce
T esitrepx
E
sdoh teM
r ot acidnI
Vita
l sig
n 1:
Fre
quen
cy a
nd
mag
nitu
de o
f dus
t sto
rms
Leve
l 1: V
isua
l obs
erva
tion
of d
ust
nosrep 1
woL eno
N reetnulov/
AC
S s
mro ts
cS
)oediv dna lli ts( sno it at s a rema
C : 2 leve Lie
ntis
t/SC
A
Nee
ded
for
set u
p M
ediu
m
1 pe
rson
nosrep 1 hgi
H pu tes rof dedee
N tsitneic
S srosnes yt ilib isi
V :3 leveL
Vita
l sig
n 2:
Rat
e of
dus
t dep
ositi
on
Leve
l 1:
nosrep 1
woL eno
N reetnulov/
AC
S spart tsu
D
Vita
l sig
n 3:
Rat
e of
san
d tr
ansp
ort
Leve
l 1: E
stim
ate
nosrep 1
woL eno
N
AC
S/tsitneicS
atad dniw
morf etar
elpoep 2 ro 1
woL eno
N reetnul ov/
AC
S sekats no isarb
A :1 lev eL
elpoep 2 ro 1
muideM
pu tes rof dedeeN
A
CS/tsitneic
S s part d na
S :2 le ve L Leve
l 3: E
lect
roni
c sa
nd tr
ansp
ort s
enso
rs (
e,g.
, Sen
sit)
S
cien
tist
Nee
ded
for
set u
p H
igh
1 pe
rson
Vita
l sig
n 4:
Win
d er
osio
n ra
te
Leve
l 1: L
ower
ing
of a
ffect
ed s
urfa
ces
(ero
sion
pin
s)
SC
A/v
olun
teer
N
one
Low
1
or 2
peo
ple
Leve
l 2/3
: Dus
t con
cent
ratio
n m
easu
rem
ent
nosrep 1 hgi
H pu tes rof dedee
N tsitneic
S s
Vita
l sig
n 5:
Cha
nges
in to
tal a
rea
occu
pied
by
sand
dun
es
nosrep 1
woL eno
N r eetn ulov/
AC
S pa
m cihpargo pot no aera hctekS :1 leve L
tneicS
yevruS
SP
G : 2 leveLis
t/SC
A
GP
S
Low
1
or 2
peo
ple
Leve
l 2/3
: Aer
ial p
hoto
grap
hs a
nd/o
r sa
telli
te im
ages
S
cien
tist
GIS
req
uire
d M
oder
ate
1 pe
rson
Vita
l sig
n 6:
Are
a of
sta
biliz
ed a
nd
activ
e du
nes
Leve
l 1: D
elin
eate
are
as o
n to
pogr
aphi
c m
ap
Sci
entis
t/SC
A
Non
e Lo
w
1 pe
rson
woL
SP
G
AC
S /tsitne icS
yevruS
SP
G :2 leveL Leve
l 3: A
eria
l pho
togr
aphs
and
/or
sate
llite
imag
es
Sci
entis
t G
IS
Mod
erat
e 1
pers
on
Vita
l sig
n 7:
Dun
e m
orph
olog
y an
d m
orph
omet
ry
Leve
l 1: D
escr
ibe
maj
or d
une
type
s an
d th
eir
char
acte
ristic
s S
cien
tist/S
CA
N
one
Low
1
pers
on n os rep 1
hg ih o t eta redoM
SI
G tsi tnei c
S s ega
mi etilletas ro shpargo tohp laireA :2 leveL
cS
sl ed om no ita ve le lat igi
D :3 leveL
ient
ist
GIS
M
oder
ate
to lo
w
1 pe
rson
Vita
l sig
n 8:
Dun
e fie
ld s
edim
ent
stat
e (s
uppl
y, a
vaila
bilit
y, m
obili
ty)
Leve
l 1/2
: Ide
ntify
and
des
crib
e so
urce
s of
sed
imen
t usi
ng
exis
ting
geol
ogic
and
sed
imen
tary
info
rmat
ion
Sci
entis
t/SC
A
Non
e Lo
w
1 pe
rson
Leve
l 3: S
atel
lite
imag
e pr
oces
sing
and
mod
elin
g S
cien
tist
GIS
H
igh
1 pe
rson
Vita
l sig
n 9:
Rat
es o
f dun
e m
igra
tion
Leve
l 1: F
i el poep 2 ro 1
wo L
enoN
ree tnu lov /A
CS
yevrus dle
t ne icS
yevruS
SP
G :2 leveLis
t/SC
A
GP
S
Low
1
or 2
peo
ple nosrep 1
wol ot etaredo
M
SIG
tsitneicS
se gam i eti lletas ro sh pa rg oto hp l air e
A : 3 le ve L
Vita
l sig
n 10
: Ero
sion
and
dep
ositi
on
patte
rns
on d
unes
elpoe p 2 ro 1
woL
enoN
re etn ulo v/A
CS
yhpargot ohp taepeR :1 leve L
nosrep 1
woL eno
N reetnulov/
AC
S sni p no isor
E :1 le veL
S/tsitneicS
yevr us cihpa rgpoT :3 leve L
CA
S
urve
ying
/GP
S
Mod
erat
e 1
or 2
peo
ple
N
ote:
GP
S—
Glo
bal P
ositi
onin
g S
yste
m; S
CA
—S
tude
nt C
onse
rvat
ion
Ass
ocia
tion.

Figure 7. Dust Storm, Iraq.
Figure 8. Reduced visibility from major dust storm in West Texas, 15 December 2003. Compare with normal clear day (inset). Photographs by Jeff Lee, Texas Tech University.

Aeolian features and processes 9
identify the locations from which dust particles become airborne, the direction and intensity of the dust event, and the meteorologi-cal conditions at the time, in conjunction with Climate Impact Meteorological (CLIM-MET) sites (http://climchange.cr.usgs.gov/info/sw/clim-met/) in the area. The system is placed on top of a mountain to provide views to sites of dust emission at dis-tances of 9–20 km. This system is made up of several off-the-shelf components, and several components that were designed and built in-house. Together they perform the task of automati-cally recording digital images from an unmanned remote loca-tion, with recording triggered by wind speed sensors, controlled by a data logger. Images are recorded on a compact fl ash card with date and time information, for subsequent correlation of images and meteorological data.
The number of dust events and their duration should be recorded on a monthly and annual basis and compared to rainfall and antecedent vegetation conditions.
Timing. Timing is event driven.
Level 3: Visibility SensorsAutomated sensors can be used to estimate the reduction in
visibility due to blowing dust, and therefore provide information on the timing, magnitude, and frequency of dust events.
Equipment required. A visibility sensor and a data logger are needed. The instrument should be co-located with other mete-orological instruments, including anemometers, to establish the conditions for dust generation and transport.
Complexity. This method requires technical assistance to set up; it is simple to maintain thereafter.
Cost. This method is expensive. Sensors cost $10,000 (Vais-ala), plus $2,000 to $3,000 for setting up the station.
Methodology. A variety of visibility sensing devices measure visibility automatically using the forward scattering of infrared light in air over a range of 10–50,000 m. Normally used at airports and other locations at which visibility measurements are made for safety monitoring, such instruments are commercially available, automated, and self contained. Applications specifi c to dust moni-toring are rare, but a visibility sensor has been deployed in asso-ciation with a U.S. Geological Survey/Desert Research Institute Desert Winds site at Jornada Experimental Range, New Mexico, for several years, and has routinely collected information on vis-ibility reduction resulting from increased dust content in the air.
Timing. The number of dust events and their duration should be recorded on a monthly and annual basis and compared to rain-fall and antecedent vegetation conditions.
VITAL SIGN 2: RATE OF DUST DEPOSITION
The rate of dust deposition can indicate the rate of wind erosion in areas that are upwind of a specifi c site. Wind-blown dust may be derived from local sources, such as playas (dry or ephemerally fl ooded lake beds), and/or more distant sources, like far-traveled dust from the Sahara and Asia. The rate of dust depo-sition is measured as mass/area/time.
Wind-blown dust is an important long-term contributor of fi ne material and ions to soils in arid regions and adjacent areas, where it also affects water quality and human health.
Deposition of dust may have a signifi cant effect on the composition and nature of soils in arid regions and beyond. Far-traveled dust may have a signifi cant effect on soil chemistry and nutrient status (Farmer, 1993). Rates of dust deposition can be measured using a variety of active and passive samplers (Goos-sens and Offer, 2000).
Monitoring Methods
Level 1: Dust TrapsA convenient and practical method of passive sampling
of atmospheric dust deposition has been developed by Marith Reheis of the U.S. Geological Survey (USGS) (Reheis, 1997, 2003; Reheis and Kihl, 1995) and utilized in extensive networks for sampling dust input to soils in the southwestern United States. Similar techniques have been used to monitor dust deposition rates in the Dry Valleys of Antarctica (Lancaster, 2002).
Equipment required. A dust trap and fi eld and laboratory supplies for cleaning the dust trap and collecting samples are needed.
Complexity. The complexity is low.Cost. The cost is low. Each trap costs less than $50 to set up.Methodology. The method consists of installing a simple,
robust passive dust trap, which is cleaned and emptied periodi-cally. The trap is a coated angel-food cake pan painted black on the outside and mounted on a post ~2 m above the ground (Fig. 9). Glass marbles rest on a circular piece of metal mesh that is fi tted into the pan 3–4 cm below the rim. The 2-m height elimi-nates most saltating sand-sized particles. The marbles simulate the effect of a gravelly surface and prevent dust that has fi ltered or washed into the bottom of the pan from being blown away. The dust traps are fi tted with two metal straps looped in an inverted basket shape, and the top surfaces of the straps are coated with a sticky material to discourage birds from roosting. At the cho-sen monitoring interval, the deposited particles are removed by rinsing the pan, the screen, and the marbles in de-ionized water into a 1 L plastic bottle (see Reheis [2003] for full details of trap construction and fi eld procedures).
In the laboratory, the sample is slowly dried at ~35 °C in large evaporating dishes or beakers; coarse organic material is also removed during this process. The mineral matter remaining can then be weighed. Subsequent physical and chemical analyses on dust samples include: (1) moisture content, (2) organic mat-ter, (3) soluble salts, (4) total carbonate (calcite plus dolomite), and (5) grain size. Other chemical analyses such as phosphorus fractions, strontium and other isotopes, elemental and mineral-ogical composition, and magnetic properties can be performed on selected samples, depending on sample size and monitoring or research needs.
Following the defi nitions of Reheis and Kihl (1995), total aeolian fl ux is defi ned as the rate of deposition of material in

10 Lancaster
grams per square meter per year (g m–2yr–1). This can be divided into two components: “dust” fl ux, which comprises material <50 µm in diameter (silt and clay size), and “sand,” which is material >50 µm in diameter. The rate of aeolian deposition is calculated as follows: aeolian deposition rate (g m–2yr–1) = mass of dust retained on fi lter (g) * 1/area of dust pan (m2) * time exposed (yr).
Timing. Measurement frequency should be annual or semi-annual (to distinguish seasonal changes in dust fl ux).
VITAL SIGN 3: RATE OF SAND TRANSPORT
The rate of sand transport on sandy surfaces is an indicator of the activity of aeolian processes in an area. Rates of sand trans-port in relation to wind speed have been determined empirically in wind tunnel studies (Lancaster, 1995). Measurements of sand transport rates in natural settings are much less common (except perhaps in coastal areas), and long-term monitoring studies of sand transport rates are rare.
Monitoring Methods
Level 1: Estimate Sand Transport from Available Climatological Data
Providing that quality wind data are available, sand trans-port rates may be estimated from wind speed data measured at
meteorological stations using one of a number of empirical and theoretical equations (see reviews in Pye and Tsoar, 1990; Sarre, 1987). These rates are, however, potential rates, because actual sand transport rates may be reduced by the availability of suitable sediment for transport, presence of vegetation or other elements, surface moisture, crusting, and cohesion of the surface.
Equipment required. This method requires access to pre-existing wind records.
Complexity. The complexity is low.Cost. The cost is low.Methodology. One of the most widely used equations for
estimating potential sand transport from wind data is the one developed by the USGS (Fryberger, 1979), with modifi cations and cautions discussed by Bullard (1997). The “Fryberger method” also provides classifi cation schemes for characterizing the energy and directional variability of wind regimes. The method has been widely used to characterize aeolian sand transporting conditions (e.g., Sweet et al., 1988).
The Fryberger method only considers winds above a thresh-old velocity for sand movement and weights these winds in rec-ognition of the fact that stronger winds are proportionately more effective in transporting sand than weaker winds. Thus:
q ∝V 2 V −Vt( )/100
where q is the rate of sand transport, V is the wind velocity at 10 m height and V
t is the impact threshold for transport measured
at 10 m. This weighting equation is then calculated for all wind speed categories above the threshold and applied to the percent-age frequency of these wind speed categories so that:
Q ∝V 2(V −Vt )t
where Q is the rate of sand drift (expressed in vector units), and t is the percentage frequency of winds in that wind speed category.
The total Q for each wind direction and the total for a station are obtained by summation to give the sand “drift potential,” or DP; and the vector sum or resultant sand drift (RDP) magnitude and direction are obtained by vectoral summation. The DP is a measure of the total wind energy of a location, whereas the ratio between RDP and DP is a measure of the directional vari-ability of the wind regime, which has been widely noted as a major control of the type of sand dune in an area (Fig. 6). Full details of the methods are contained in Fryberger (1979). The original method was based on the use of wind speeds recorded in knots. Bullard (1997) cautions the user and provides infor-mation on the use of the weighting factors for winds recorded in other units. Saqqa and Saqqa (2007) provide a simple com-puter program for estimating sand transport potential. Figure 10 shows an example of a “sand rose” calculated using the Fry-berger method, as well as an example of monthly changes in drift potential.
Timing. This method should be performed annually or monthly.
Figure 9. U.S. Geological Survey Reheis Dust Trap. Photo by Marith Reheis, USGS.

Aeolian features and processes 11
Level 1: Abrasion StakesAn estimate of the rate of wind transport of sand from dif-
ferent directions can be derived from observations of the removal of layers of paint from wooden or aluminum stakes, as used in Pangnirtung National Park, Baffi n Island, Canada (McKenna Neuman and Gilbert, 1986).
Equipment required. 1–2-m-high aluminum or wooden poles are needed.
Complexity. The complexity of this method is low.Cost. The cost of this method is low.Methodology. The poles should be set up in areas known to
experience sand transport. Each pole is painted with eight layers of exterior enamel paint of different colors. Exposure of paint of different colors at different heights and orientation on the stake gives a relative estimate of the intensity of sand transport by dif-ferent wind directions. This method will work best when sand transport is at a high intensity and thus able to scour paint off the poles.
Timing. Timing should be annual or seasonal.
Level 2: Sand TrapsA wide variety of sand traps have been developed to measure
rates of sand transport in laboratory and fi eld settings. See Goos-sens et al. (2000) and Nickling and McKenna Neuman (1997) for a review of different trap designs.
Equipment required. Sand traps, a balance for weighing sand, and collection bags are needed.
Complexity. The complexity is low to moderate.Cost. The cost is low. Each Fryrear trap costs approximately
$80 (see below).Methodology. Long-term monitoring of sand transport rates
using traps requires that the traps be robust and self-orienting into winds from different directions. Although many different types of traps have been developed, few can withstand long-term exposure and maintain collection effi ciency. An effi cient and robust passive sand trap was designed by the U.S. Department of Agriculture (Fryrear, 1986) (Fig. 11). (See http://www.fryreardustsamplers.com/BSNE.html.) This type of trap has been used extensively for time-integrated measurements of sand-size particles moving in saltation in harsh environments (Gillette et al., 1997b; Gillette, 1999; Gillette and Chen, 2001) and for long-term monitoring (Lancaster and Helm, 2000; Tigges et al., 1999). These passive collectors maintain a collection effi ciency of ~90% for a wide range of wind speeds (Shao et al., 1993).
The traps can be exposed at a single height (typically 10 cm) or at multiple heights (spaced logarithmically, as in Fig. 11). They may be emptied of sand at any desired interval, taking care that the trap is not fi lled completely, and the contents weighed. The total horizontal fl ux of sand can be calculated using the approach of Gillette and Chen (2001). The sand traps should be co-located with wind speed and direction sensors.
Timing. Timing should be weekly or monthly, depending on the rates of sand transport to be expected.
0
5
10
15
20
25
Jan Feb Mar Apr May Jun Jly Aug Sep Oct Nov Dec
B
A
Figure 10. (A) Example of a “sand rose” developed using the Fry-berger (1979) method. (B) Monthly variations in drift potential, Palm Springs, California.
Figure 11. The Big Spring Number Eight sand trap (from http://www.fryreardustsamplers.com/bsne.html).

12 Lancaster
Level 3: Electronic Sand Transport SensorsElectronic sand transport sensors have been developed to
allow remote monitoring of sand transport rates in conjunction with measurements of wind speed and other parameters. The devices operate on a piezo-electric principle, in which sand grains impact a protected crystal, which sends a signal recording the number and kinetic energy of grain impacts (Gillette and Stockton, 1986). One device is the Sensit™ (http://www.sensit.com/). In practice, the kinetic energy signal from this device has been diffi cult to inter-pret. The particle count signal is calibrated by the manufacturer or in a wind tunnel with a known mass fl ux of sand.
Equipment required. A sand transport sensor, data logger, anemometer, and wind vane are needed.
Complexity. The complexity is moderate to high. Technical knowledge is needed to install and maintain devices and inter-pret data.
Cost. The cost is moderate to high; Sensits are about $2,000 each, Safi res about $700 each. A data logger and associated instrumentation (e.g., anemometer and wind vane) are required, adding a further $2,000–$3,000 to the cost.
Methodology. The Sensit device has been widely used for sand transport monitoring (Fig. 12). Examples include the
USGS Desert Winds (Tigges et al., 1999) and CLIMET programs (http://climchange.cr.usgs.gov/info/sw/clim-met/) and the Great Basin Unifi ed Air Pollution Control District at Owens Lake, California. Sensits should be co-located with anemometers and wind vanes to ensure sand transport is monitored in conjunction with relevant wind data. A newly developed alternative to the Sensit are the Saltation Flux Impact Responders (Safi res). Baas (2004) evaluated the performance of these piezoelectric crystal type instruments. He found that the Safi re presents a minimal obstruction to the wind fl ow and provides high-frequency omni-directional measurements at a relatively low cost compared with other piezoelectric type sensors. Although Safi res have been used in coastal dune settings in the Netherlands (Arens, 1997), they have not been used for long-term monitoring.
Timing. Data should be downloaded monthly.
VITAL SIGN 4: WIND EROSION RATE
The action of wind on exposed sediments and friable rock formations causes erosion (abrasion) and entrainment of sedi-ment and soil particles. Wind erosion physically removes the lighter, less dense soil constituents such as organic matter, clays, and silts. Thus it removes the most fertile part of the soil and low-ers soil productivity (Leys, 1999). The rate of wind erosion of a given area is a direct measure of the loss of the surface soil and its contained nutrients, seeds, and soil materials. In addition to lowering of the surface, some authors have noted changes in soil texture as a result of wind erosion. Although these mainly apply to agricultural fi elds, some coarsening of natural surfaces may occur as a result of wind erosion.
Monitoring Methods
Level 1: Lowering of Affected SurfacesEquipment required. Erosion pins (e.g., rebar) and a mea-
suring tape are needed.Cost. The cost is low.Complexity. The complexity level is low.Methodology. The rate of lowering of affected surfaces, such
as sand sheets, playa surfaces, and alluvial fl ats may be moni-tored using erosion pins at strategically located sites. Monitoring of erosion using erosion pins can be as simple as using lengths of rebar hammered into the ground and measuring the exposure of the pin relative to the ground surface at regular intervals. Such methods have been used to monitor wind erosion rates at Jornada Experimental Range and Owens Lake (Fig. 13). When placing the pins, care should be taken to choose a representative sample of the area. Multiple pins per site are useful to estimate local vari-ability in rates. The resolution of this method is relatively low; it is diffi cult to measure surface changes of less than 10 mm.
In addition, qualitative estimates of wind erosion can be made via the degree of exposure of roots and creation of residual pedestals of soil by wind erosion.
Timing. Timing should be monthly or annually.
Figure 12. Sensit sand transport sensor at Owens Lake, California. Senor is mounted so that height of crystal above surface can be adjusted if surface changes.

Aeolian features and processes 13
Level 2 and 3: Measurements of Dust Concentration Downwind of Affected Area
Measurements of dust concentration in the air downwind of an eroding area can provide information on the mass of fi ne material eroded from that area.
Equipment required. Dust concentration measuring devices (e.g., DustTrak) are needed.
Cost. Costs are very high. MiniVol is $3,500; DustTrak is $3,000 to $4,000; TEOM is $25,000 or more.
Complexity. The complexity level is high to very high. Skilled technical support is required to install and maintain TEOM instru-ments. DustTrak can be operated with minimal training.
Methodology. The vertical profi le of dust concentration above the surface is a measure of the amount of fi ne particulate matter being emitted from a surface (the vertical fl ux of dust). Typically, dust concentration shows an exponential decrease in height above the emitting surface, due to dispersion of the dust by atmospheric turbulence. The gradient (slope) of the profi le is pro-portional to the rate of emission. Measurements of concentration profi les require sophisticated instrumentation and are a research, rather than a monitoring, technique. They apply only to the con-ditions being studied (Gillette et al., 1997a; Gillette et al., 1997b; Nickling et al., 1999).
An estimate of dust emission rates can be obtained via mea-surements of particle concentrations downwind of the eroding area. Such measurements are made using one of a wide variety of devices used to measure ambient air quality and are usually tar-geted toward a specifi c particle size (e.g., PM10, or 10 µm). Such devices employ a pump, which draws air at a precisely calibrated rate through a fi lter, on which the dust collects for subsequent weighing and analysis. Typical examples of these devices are
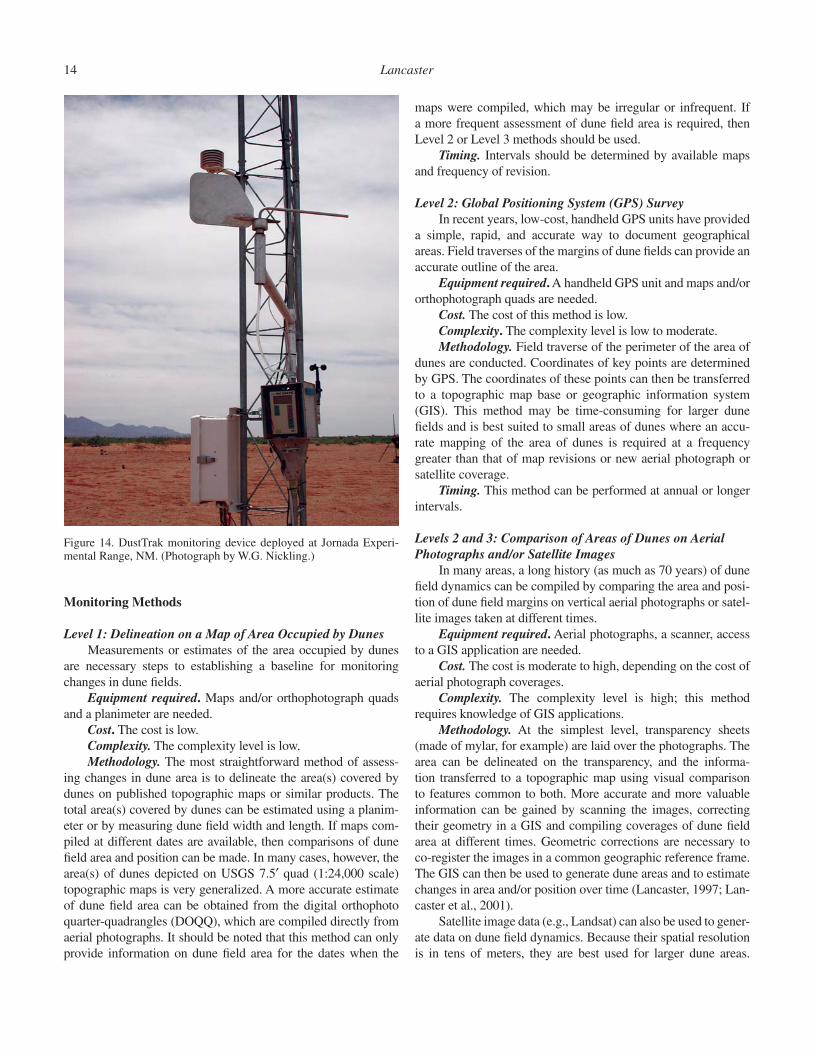
the HiVoL and MiniVol samplers used to collect dust to ensure compliance with federal (Environmental Protection Agency) and state air quality standards (Chow, 1995). Newer devices include the DustTrak (Fig. 14), which employs a laser beam to measure dust concentrations in a chamber within the instrument (http://www.tsi.com/Product.aspx?Pid=11). The TEOM, Tapered Ele-ment Oscillating Microbalance, (http://www.rpco.com/products/ambprod/amb1400/index.htm) is another, more costly device, and it is the only real-time particulate monitor that directly and continuously measures the mass of particulates collected on a fi l-ter and provides continuous particulate concentration data. Such devices can be installed in critical areas (such as Owens Lake, California). They also provide information on the magnitude and frequency of dust storms via changes in dust concentration over time.
Timing. Timing should be event based, or data can be down-loaded weekly.
VITAL SIGN 5: CHANGES IN TOTAL AREA OCCUPIED BY SAND DUNES
The total area occupied by sand dunes is an indication of the long-term supply of sediment to an area. Changes in the total area and location covered by dunes will, over time, refl ect the long-term sediment budget of an area, as well as the degree to which the dune fi eld as a whole is migrating. Decreases in the area cov-ered by dunes as well as the size of dunes (see below) refl ect a negative sediment budget in which sediment is being lost from the dune fi eld faster than it is supplied. Conversely, an increase in dune size or area of dunes may indicate a positive sediment budget in which the supply of sediment exceeds losses.
Figure 13. Erosion pins for monitoring dune dynamics, Namib Desert.
14 Lancaster
Monitoring Methods
Level 1: Delineation on a Map of Area Occupied by DunesMeasurements or estimates of the area occupied by dunes
are necessary steps to establishing a baseline for monitoring changes in dune fi elds.
Equipment required. Maps and/or orthophotograph quads and a planimeter are needed.
Cost. The cost is low.Complexity. The complexity level is low.Methodology. The most straightforward method of assess-
ing changes in dune area is to delineate the area(s) covered by dunes on published topographic maps or similar products. The total area(s) covered by dunes can be estimated using a planim-eter or by measuring dune fi eld width and length. If maps com-piled at different dates are available, then comparisons of dune fi eld area and position can be made. In many cases, however, the area(s) of dunes depicted on USGS 7.5′ quad (1:24,000 scale) topographic maps is very generalized. A more accurate estimate of dune fi eld area can be obtained from the digital orthophoto quarter-quadrangles (DOQQ), which are compiled directly from aerial photographs. It should be noted that this method can only provide information on dune fi eld area for the dates when the
maps were compiled, which may be irregular or infrequent. If a more frequent assessment of dune fi eld area is required, then Level 2 or Level 3 methods should be used.
Timing. Intervals should be determined by available maps and frequency of revision.
Level 2: Global Positioning System (GPS) SurveyIn recent years, low-cost, handheld GPS units have provided
a simple, rapid, and accurate way to document geographical areas. Field traverses of the margins of dune fi elds can provide an accurate outline of the area.
Equipment required. A handheld GPS unit and maps and/or orthophotograph quads are needed.
Cost. The cost of this method is low.Complexity. The complexity level is low to moderate.Methodology. Field traverse of the perimeter of the area of
dunes are conducted. Coordinates of key points are determined by GPS. The coordinates of these points can then be transferred to a topographic map base or geographic information system (GIS). This method may be time-consuming for larger dune fi elds and is best suited to small areas of dunes where an accu-rate mapping of the area of dunes is required at a frequency greater than that of map revisions or new aerial photograph or satellite coverage.
Timing. This method can be performed at annual or longer intervals.
Levels 2 and 3: Comparison of Areas of Dunes on Aerial Photographs and/or Satellite Images
In many areas, a long history (as much as 70 years) of dune fi eld dynamics can be compiled by comparing the area and posi-tion of dune fi eld margins on vertical aerial photographs or satel-lite images taken at different times.
Equipment required. Aerial photographs, a scanner, access to a GIS application are needed.
Cost. The cost is moderate to high, depending on the cost of aerial photograph coverages.
Complexity. The complexity level is high; this method requires knowledge of GIS applications.
Methodology. At the simplest level, transparency sheets (made of mylar, for example) are laid over the photographs. The area can be delineated on the transparency, and the informa-tion transferred to a topographic map using visual comparison to features common to both. More accurate and more valuable information can be gained by scanning the images, correcting their geometry in a GIS and compiling coverages of dune fi eld area at different times. Geometric corrections are necessary to co-register the images in a common geographic reference frame. The GIS can then be used to generate dune areas and to estimate changes in area and/or position over time (Lancaster, 1997; Lan-caster et al., 2001).
Satellite image data (e.g., Landsat) can also be used to gener-ate data on dune fi eld dynamics. Because their spatial resolution is in tens of meters, they are best used for larger dune areas.
Figure 14. DustTrak monitoring device deployed at Jornada Experi-mental Range, NM. (Photograph by W.G. Nickling.)

Aeolian features and processes 15
High-resolution satellite image data are available, but these data are expensive and have a limited temporal and spatial availability. Landsat satellite data are also only available back to 1973, so information from this source is only relevant to the past 30 years or so. Despite these limitations, satellite data have been used to provide a long-term view of the dynamics of some dune fi elds, such as Great Sand Dunes (Janke, 2002; Marîn et al., 2005).
Timing. Intervals should be determined by dates of aerial photograph coverages.
VITAL SIGN 6: AREA OF STABILIZED AND ACTIVE DUNES
The active area of dunes, bare sand surfaces or migrating (mobile) dunes, compared to the inactive area (stabilized by vegetation) is a valuable indicator of the response of both inland and coastal dunes to changes in sediment supply and mobility. In coastal dune areas, the primary control of dune activity is the sup-ply of sediment, because many coastal dunes are located in areas where the climate permits growth of vegetation. Thus, many coastal dunes are very active close to the supply of sediment at the coast and become progressively less active inland as sediment supply decreases.
In inland dune areas, the primary control of dune activ-ity is climatic. Dune mobility can be characterized by the ratio between wind energy (W) and the effective precipitation (P/PE) (Lancaster and Helm, 2000). Thus, dunes can be active in areas that are characterized by windy conditions, although precipita-tion can be quite high. The relations between wind energy and effective precipitation for dune areas in the western United States are shown in Figure 15.
Monitoring Methods
Level 1: Delineation of Area Occupied by Active and Inactive Dunes on Topographic Maps
Equipment required. Aerial photographs and topographic maps are needed.
Cost. Costs are low to moderate, depending on the cost of aerial photograph coverages.
Complexity. The complexity level is moderate.Methodology. The areas covered by active and vegetation-
stabilized dunes can be interpreted from aerial photographs or fi eld survey and transferred to a topographic map base. On most aerial photographs, bright tones indicate bare (active) sand, whereas progressively darker tones indicate vegetation-stabilized dunes and sand surfaces. Field checking is desirable to develop accurate classifi cation of areas. These methods have been used to map areas of active and inactive dunes in many areas (Forman et al., 2006; Lancaster, 1997; Paisley et al., 1991)
In some cases, historical records of dune conditions devel-oped by land surveys and explorations can be a valuable source of information on very long-term trends (Muhs and Holli-day, 1995).
Timing. Timing should be determined by the dates of aerial photograph coverages.
Level 2: GPS SurveyEquipment required. A handheld GPS unit is required.Cost. The cost of this method is low.Complexity. The complexity level is low to moderate (assum-
ing that a GPS unit is available).Methodology. Field traverses of the margins of active and
inactive dune areas can provide an accurate outline of the area of dunes in different states, once the coordinates of key points are determined by GPS survey transferred to a topographic map base. This method may be time-consuming for larger dune fi elds and is best suited to small areas of dunes where an accurate map-ping of the area of dunes is required at a frequency greater than that of map revisions or new aerial photograph coverage.
Timing. Intervals should be annual or decadal.
Levels 2 and 3: Comparison of Aerial Photographs and/or Satellite Images
Equipment required. Aerial photographs or satellite images and access to GIS application are needed.
Cost. The cost of this method is moderate, depending on the cost of aerial photograph coverages and satellite images.
Complexity. This method is highly complex; it requires knowledge of GIS applications and image analysis.
Figure 15. Dune mobility index values for locations in the western United States compiled from data provided by author and D. Muhs (U.S. Geological Survey).

16 Lancaster
Methodology. In many areas, a long history (as much as 60 years) of dune fi eld dynamics can be compiled by comparing the area and position of areas of active and inactive dunes on verti-cal aerial photographs. At the simplest level, transparency sheets (made of mylar, for example) are laid over the photographs. The area can be delineated on the transparency, and the information transferred to a topographic map using visual comparison to fea-tures common to both. More accurate and more valuable infor-mation can be gained by scanning the images, correcting their geometry in a GIS and compiling coverages of dune fi eld area at different times. Geometric corrections are necessary to co-register the images in a common geographic reference frame. The GIS can then be used to generate dune areas and to estimate changes in area and/or position over time. Satellite image data can also be classifi ed to develop information on vegetation and land cover characteristics and to determine changes in the area of active and inactive dunes. For example, Janke (2002) was able to show that dune grasses were being replaced by semi-desert scrub on the west side of Great Sand Dunes, thereby reducing sand mobility.
Timing. Intervals are determined by dates of aerial photo-graph and/or satellite image coverages.
VITAL SIGN 7: DUNE MORPHOLOGY AND MORPHOMETRY
Dunes occur in a variety of morphological types in self-organized patterns as a response to the wind regime (especially its directional variability) and the supply of sand. Parabolic dunes and nebkhas are controlled by the presence of vegetation. Sand dunes occur in four main morphologic types (Figs. 5 and 6; Table 2): Crescentic (transverse), linear, star, and parabolic. The type of dune is therefore an indicator of the characteristics of the wind regime and the amount of sand available for dune construction. Changes in dune morphology over time can pro-vide valuable information about the long-term response of the dune fi eld to climate and sediment supply. For example, a change from parabolic to crescentic dunes could indicate a reduction in vegetation cover, whereas development of parabolic dunes from crescentic types is indicative of increased vegetation cover, as in coastal areas of Israel (Tsoar and Blumberg, 2002). Changes in dune size are a clear indication of increases or decreases in sedi-ment supply and changes in sediment budgets.
Monitoring Methods
Level 1: Describe Major Dune Types and Their Characteristics
Equipment needed. Maps, aerial photographs, and satellite images of the dune area are needed, as well as access to any pre-viously published work.
Cost. The cost of this method is low.Complexity. The level of complexity is low.Methodology. Identifi cation and description of the major
dune types occurring in a dune fi eld is a necessary fi rst step to
understanding the dynamics of a dune system. The different dune types present should be identifi ed using well-accepted clas-sifi cation schemes (e.g., McKee, 1979a) (Fig. 5, Table 2), and described in terms of their height, width, and spacing. There are numerous studies of dune morphology done in this way (see Lan-caster, 1995, for examples), but many dune fi elds in the United States have not been systematically described.
Timing. This method should be used as needed. Most dune types do not change signifi cantly over time periods of years to decades, and many have remained similar for thousands of years.
Level 2: Map Dune Types and Their Distribution using Aerial Photographs or Satellite Images
Equipment required. Maps, aerial photographs, and satellite images of the dune area are needed.
Cost. Costs are moderate to high, depending on the cost of aerial photograph coverages or satellite images.
Complexity. The complexity level is moderate to high; this method requires knowledge of GIS applications.
Methodology. The goal at this level is to accurately map the different dune types using aerial photographs or satellite images,
R e l a t i v e S e d i m e n t T h i c k n e s s
TRANSVERSE
Barchans Crescentic ridges
Compoundcrescentic dunes
LINEAR
Simple - Straight - Sinuous
CompoundLinear dunes
ComplexLinear dunes
STARWin
d r
eg
ime
co
mp
lex
ity
ZIBARSSANDSHEETS
coarse sand
NEBKHAS PARABOLIC DUNES
vegetationanchored
LUNETTESsource bordering
FALLING DUNES
CLIMBING DUNES
topographicinfluence
Dunes Draas, Mega-dunes
REVERSING
Dome dunes
ECHO DUNES
BLOWOUTDUNES
TABLE 2. MORPHOLOGICAL CLASSIFICATION OF DUNES
Note: Modified from Lancaster (1995).

Aeolian features and processes 17
using a classifi cation scheme as above. In this way, the area occu-pied by different dune types can be estimated, and changes in dune distribution and/or morphology can be assessed using sequential aerial photograph series. There are numerous examples of the application of these techniques (Andrews, 1981; Lancaster, 1990, 1993; McKee and Moiola, 1975; Sweet et al., 1988).
Timing. Intervals are determined by dates of aerial photo-graph coverages.
Level 3: Use Digital Elevation Models (DEMs) to Estimate Dune Size and Sediment Volumes
Equipment required. Computing resources and GIS appli-cations are needed.
Cost. Costs are low to moderate, depending on the cost of image data.
Complexity. This method is highly complex; it requires knowledge of GIS applications and data processing.
Methodology. DEMs can be used to estimate dune size, spacing, and sediment volume using GIS software. With these data, it is possible to accurately monitor changes in sand volume that may be occurring as a result of changes in sediment supply. Data may include online digital data (e.g., http://seamless.usgs.gov/) or high-resolution LIDAR (light detection and ranging) data, which may be available from state or local governments, or specifi cally commissioned.
Timing. Intervals are determined by the dates of DEM or LIDAR coverages.
VITAL SIGN 8: DUNE FIELD SEDIMENT STATE
Dune fi elds form part of the well-defi ned regional- and local-scale sediment transport systems in which sand is moved by wind from source areas (e.g., distal fl uvial deposits, sandy beaches) via transport pathways to depositional sinks. Dune fi elds accumulate downwind of source zones at points where wind speed and direc-tional variability change, so that the infl ux of sand exceeds out-fl ux, resulting in deposition and growth of a dune fi eld. Over long periods of time (decades to centuries and longer) the dynamics of the system are determined by changes in the supply of sediment of a size suitable for transport by the wind; the availability of this sediment for transport, determined by vegetation cover and soil moisture; and the mobility of this sediment, controlled by wind strength. The interactions between these variables can be evalu-ated in terms of the state of the aeolian system and the limiting factors identifi ed (Kocurek and Lancaster, 1999). Monitoring of the current and past sediment state of a dune fi eld is an aid to understanding how it is responding to stressors.
Monitoring Methods
Level 1 and 2: Identify and Describe the Sources, Transport Pathways, and Depositional Sinks of the System
Equipment required. Maps, aerial photographs, and pub-lished reports are needed.
Cost. The cost is moderate to low, depending on the cost of image data. Google Earth is also a good source of data.
Complexity. The complexity level is moderate to high. Some expert knowledge may be required for interpretation of data.
Methodology. Monitoring of basic parameters and how they change over time is essential to assessing the state of any system. A regional survey of the primary and secondary sources of sediment, the transport pathways, and the sinks for sediment (depositional areas) is also valuable for addressing impacts on the system. For example, knowledge of these parameters in the Coachella Valley, California, was a necessary prerequisite for developing a habitat conservation plan for the Coachella fringe-toed lizard (Griffi ths et al., 2002).
The sources of sediment, transport pathways and sediment sinks can be identifi ed from published literature and maps, fi eld survey, and aerial photographs, supplemented by mineralogical analyses of sand. Good examples of this approach are Griffi ths et al. (2002) and Sharp, (1966).
Timing. This method should be used at decadal intervals.
Level 3: Use Remote Sensing Data to Identify and Track Sand Sources, Transport Pathways and Sinks
Especially in large, complex dune fi elds, it may be diffi cult to assess sand sources, transport pathways, and sinks using published studies and limited fi eld surveys. Recent advances in both remote sensing technologies and methods of analysis allow the identifi -cation and monitoring of aeolian systems remotely, thus saving many months of fi eld research. These approaches were pioneered in the Gran Desierto of Mexico (Blount and Lancaster, 1990; Blount et al., 1990), and have been followed by more detailed studies of sand sources for Kelso dunes, California (Ramsey et al., 1999) and the Coachella Valley, California (Katra et al., 2009).
Equipment required. Satellite image data, computing resources, and image analysis software are needed.
Cost. Costs are moderate, assuming image data are available.Complexity. This method is highly complex; expert knowl-
edge is required for image analysis and interpretation.Methodology. Primary minerals have distinctive charac-
teristics that can be identifi ed in multispectral image data (such as Landsat). This approach uses spectral information on the sub-pixel scale to identify mineral composition and the relative abundance of different primary minerals. Formerly, this was a research technique, but some available image analysis software applications (such as ENVI) include these techniques as part of their suite of image analysis routines. Care should be taken with interpretation of results.
Timing. This method should be performed at decadal intervals.
VITAL SIGN 9: RATES OF DUNE MIGRATION
The rate of dune migration is inversely proportional to dune height and directly proportional to wind speed and sand trans-port rates. Monitoring rates of dune migration provides valuable

18 Lancaster
and easily understood information on the dynamics of the aeolian system. If the potential exists for dunes to move into areas of concern (by crossing roads or migrating into critical habitats, for example), then monitoring of migration rates can provide valu-able information for resource management. There is a long history of studies of dune migration rates and several well-established methodologies, as discussed below.
Monitoring Methods
Level 1: Field Survey of Dune Position Over TimeEquipment required. Marker stakes and a tape measure
are needed.Cost. The cost is very low.Complexity. The complexity level is low.Methodology. Where dunes are well defi ned, rates of migra-
tion may be monitored by comparing their position relative to fi xed markers, such as stakes driven into the ground. These markers may be placed around the perimeter of isolated dunes or adjacent to the lee face of transverse or parabolic dunes. The position of the dune can be compared to the original stake positions and rates of change determined on a seasonal or annual basis. Such methods have been used at White Sands, New Mexico (McKee and Douglass, 1971), and in Namibia (Bristow and Lancaster, 2004), and elsewhere. The disadvantage of fi eld surveys is the need to continually revisit the monitored dune over the years, and the probability that monitoring stakes may be buried or left behind as the dune advances.
Timing. This should be done annually.
Level 2: GPS Survey of Dune PositionsEquipment required. A differential GPS unit is needed.Cost. Costs are low, providing that a GPS unit is available.Complexity. This method is moderately complex; training in
use of GPS units is required.Methodology. Dune migration rates can be determined and
monitored very easily with high-precision GPS surveys using a differential GPS unit. Using this methodology, the coordinates (latitude and longitude or UTM coordinates) of the leading edge of a dune (usually the base of a slip face) can be determined with a precision of less than 1 m, which is more than suffi cient for annual surveys of dune migration rates. The coordinates for the position of the dune in successive years can then be compared to determine any advance. This methodology has been used to determine dune migration rates in Egypt (Stokes et al., 1999). The outline of the dune can be also surveyed using this method, providing a record of changes in dune morphology over time.
Timing. This should be done annually.
Level 3: Comparison of Dunes on Aerial Photographs or Satellite Images of Different Dates
Equipment required. Aerial photographs and topographic maps are needed.
Cost. Costs are low to moderate, except for computing resources.
Complexity. This method is highly complex; it requires spe-cialist knowledge of GIS and data processing.
Methodology. In this method, the position of dunes at different times is compared using aerial photographs taken at selected intervals. At the simplest level, transparency sheets (made of mylar, for example) are laid over the photographs. The area can be delineated on the transparency, and the infor-mation transferred to a topographic map using visual compari-son to features common to both. The change in position of the dunes can then be measured on the map and divided by the number of years between the aerial photograph coverages to provide an estimate of dune migration rates. This method has been used extensively in southern California (Haff and Presti, 1995; Long and Sharp, 1964; Sweet et al., 1988) and else-where (Finkel, 1959; Hastenrath, 1967; and Slattery, 1990). It works best when the dunes are well-defi ned and moving fairly rapidly. In general, dune migration rates vary inversely with dune size.
More precise and more valuable information can be gained by scanning the images, correcting their geometry in a GIS and compiling coverages of the position of the dunes at different times. The GIS can then be used to generate maps of dunes at different times and to estimate migration rates. This methodol-ogy was used to examine dune and dune fi eld migration rates in the Christmas Valley, Oregon, in support of management of this area by the Bureau of Land Management (Lancaster et al., 2001), and at Great Sand Dunes, where changes in dune migration rates were compared to climate data (Marîn et al., 2005).
Timing. Intervals are determined by the dates of the aerial photographs.
VITAL SIGN 10: EROSION AND DEPOSITION PATTERNS ON DUNES
The pattern of erosion and deposition on dunes provides a record of the response of the dune to airfl ow patterns and vegeta-tion. Valuable information on the dynamics of the dunes and their response to changes in climate and vegetation can be generated in this way.
Monitoring Methods
Level 1: Repeat PhotographyMany changes in the topography and morphology of dunes
are complex, and require careful, quantitative topographic sur-vey. A qualitative monitoring of seasonal, annual, or multi-annual changes in dunes can be achieved using repeat photography from fi xed camera stations (Livingstone, 1987).
Equipment required. A digital camera and a GPS unit are needed.
Cost. The cost of this method is low.Complexity. The complexity level is low.Methodology. Critical areas of dunes, such as advancing
dune fronts, are identifi ed, and a camera station with an unob-

Aeolian features and processes 19
structed view is established. The camera station is permanently marked and its GPS location recorded. Clear information is needed on the date and time of the photographs, the camera sys-tem and focal length of lens used. Photographs or panoramas are repeated on a regular basis.
Timing. This method should be repeated annually.
Level 2: Erosion PinsTransect lines or grids of erosion pins can be set up across
dunes to measure erosion and deposition patterns at certain points on the dunes (Fig. 13). These patterns can then be compared to winds and, if relevant, vegetation cover. This method has been used to monitor changes on a dune in Namibia for over 20 years (Livingstone, 1989, 1993, 2003). Other examples include studies of coastal dune systems (e.g., Arens et al., 2004; Gares, 1990; Gares and Nordstrom, 1995; Jungerius and Verheggen, 1981).
Equipment required. Erosion pins (or stakes) and tape measure(s) are needed.
Cost. The cost is low (after initial set up).Complexity. The complexity level is low to moderate.Methodology. Grids or transects of erosion pins are set up
across the dune using pins at intervals of 5 or 10 m (or at criti-cal points, such as the base of the slip face). If possible, posi-tions of pins should be surveyed. Measurements from tip of pin to surface should be recorded, as well as the height (exposure) of pin. Changes in the exposure of the erosion pins (less exposure = deposition; increased exposure = erosion) provide a record of dune dynamics.
Timing. This method can be used weekly, monthly, or annu-ally. Shorter intervals provide more precise information and are easier to relate to winds and vegetation conditions.
Level 3: Topographic SurveyDetailed topographic surveys, with a contour interval of
1 m or less can provide very useful data for monitoring dune changes and dune dynamics. These techniques have been used to assess dune changes in several studies, in Oman (Warren, 1988), Namibia (Livingstone, 2003; Ward and von Brunn, 1985); and in coastal blowout dunes in the Netherlands (Arens, 1997; Arens et al., 2004).
Equipment required. Survey instruments (total station) or a differential GPS unit are needed.
Cost. The cost is moderate, assuming that equipment can be borrowed or rented.
Complexity. The level of complexity is moderate to high. Training in surveying is required; analysis of results requires a GIS expert.
Methodology. This type of survey can be carried out using a total station, which downloads coordinates to a computer for subsequent plotting in a contouring and mapping program such as Surfer. If a differential GPS unit is available, then similar, but slightly less precise, data can be generated from a detailed GPS topographic survey. Either type of survey can generate data for a digital elevation model, or DEM. Changes can be assessed quan-
titatively by comparing digital elevation models for different time periods, generating information on areas where changes have occurred and on the volumes and rates of erosion and deposition in these areas.
Timing. This data can be generated at seasonal to annual intervals.
SUMMARY AND RECOMMENDATIONS FOR MONITORING OF VITAL SIGNS
This section provides a statement of the most effective meth-ods for monitoring of the vital signs identifi ed for aeolian pro-cesses and landforms.
Vital Sign 1: Frequency and Magnitude of Dust Storms
Providing that personnel are available to record visibility reduction caused by blowing dust, visual observation and record-ing is the preferred and most cost effective method for monitoring of dust events. In cases where the site is remote, then automated camera systems are the preferred methodology.
Vital Sign 2: Rate of Dust Deposition
The USGS dust trap method is reliable and simple, and pro-vides a valuable record of dust deposition over periods of years to decades.
Vital Sign 3: Rate of Sand Transport
Estimation of potential sand transport rates from wind data is a necessary fi rst step for monitoring of sand transport rates. This also provides data that can be compared with other areas. Long-term fi eld monitoring of transport rates using the Big Spring Number Eight (BSNE) trap provides a valuable record, if the site(s) are carefully chosen.
Vital Sign 4: Wind Erosion Rate
Use of erosion pins and other topographic data can provide a good documentation of wind erosion rates for specifi c areas.
Vital Sign 5: Changes in Total Area Occupied by Sand Dunes
Although more complex and expensive, a GIS approach is far superior to other methods for estimation of dune fi eld changes, providing quantitative data that can be used in conjunction with climate records to understand long-term aeolian dynamics.
Vital Sign 6: Area of Stabilized and Active Dunes
Mapping of active and stabilized dunes using satellite image data is an excellent method. When used in combination with a

20 Lancaster
GIS, this approach is far superior to other methods for estima-tion of dune fi eld changes, providing quantitative data that can be used in conjunction with climate records to understand long-term aeolian dynamics.
Vital Sign 7: Dune Morphology and Morphometry
Use of aerial photographs and/or satellite images is the preferred method for describing dune morphology and docu-menting any changes that may occur. Although more complex and expensive, a GIS approach is far superior to other methods, providing quantitative data to understand long-term aeolian dynamics.
Vital Sign 8: Dune Field Sediment State
Valuable data on sediment state can be obtained using a descriptive approach, with limited analyses of samples for bulk mineralogy.
Vital Sign 9: Rates of Dune Migration
Rates of dune migration are best determined using repeated GPS surveys, or if a long-term historical record is needed, by comparison of dune positions on aerial photographs or satellite images. In either case, a GIS approach for data recording and synthesis is desirable.
Vital Sign 10: Erosion and Deposition Patterns on Dunes
Repeat photography and simple fi eld surveys can provide valuable information and are simple to set up and repeat.
STUDY DESIGN
General Principles
Any study design should consider the goals of the moni-toring, and therefore what process or landform will be stud-ied, why it should be monitored, and for how long. Short-term observations of change are useful, but long-term monitoring is very valuable, though it involves a long-term commitment of resources. The personnel and other resources available will largely determine the methods employed. In general, simple methods regularly applied will yield good results. As far as possible, monitoring programs should strive for quantitative and reproducible results. All data gathered should be assessed critically after two or three measurement intervals to deter-mine: (1) whether changes can be detected; and (2) whether the data can be explained and understood using knowledge of the process or landform being monitored. Adjustments to the monitoring program then can be made as needed, but radical changes should be avoided. It is always useful to have an out-side “expert” to act as a consultant.
An Example Program to Monitor Movement of Small- to Moderate-Size Inland Dunes
Monitoring of the rates of movement of inland dunes can provide a sensitive overall assessment of the activity of an aeolian sand system and its response to natural and anthropogenic stres-sors. An ideal program will combine both short-term (months to years) and long-term (years to decades) monitoring of dune migration rates. Migration rates should be compared to climatic data on all time scales.
Major Project Milestones1. Determine resources available for monitoring and select
appropriate methods to be used. As discussed above, the best techniques for short-term monitoring are fi eld sur-vey using fi xed markers or a differential GPS survey; for long-term measurements, use aerial photographs or satel-lite images taken on different dates.
2. Ensure that relevant hourly wind speed and direction data are available for the monitoring site. Upgrade existing weather stations or install new equipment for the moni-toring program.
3. For short-term measurements: select dunes to be moni-tored. Dunes should be selected to be representative of the size and morphological type found in the study area. If dune types vary signifi cantly, then choose measure-ment sites for each type. Ensure that monitoring sites are easy to access and not likely to be disturbed by animals or people. Set up fi xed points and benchmarks. Allocate resources for monthly or seasonal measurements.
4. For long-term monitoring: Acquire baseline image data and incorporate into a GIS system.
5. For short-term monitoring: make monthly or seasonal measurements and enter these data into a database. Pro-duce graphics showing changes over time.
6. For long-term monitoring: compare dunes on images acquired annually. Produce maps of changes from year to year.
7. After one year, assess short-term monitoring data (if data are collected monthly). Compare rates of movement to wind and other climate data. Determine trends. Are there seasonal differences in migration rates? Do these relate to variations in wind speed and/or direction over the year? Determine optimal timing of measurements and adjust program accordingly. It may be that dune movement is slow enough that annual or seasonal measurements are suffi cient. Report results to scientifi c and management communities. Provide public outreach.
8. After 5 years, assess long-term monitoring data on migra-tion rates by comparing image data from different years. Determine trends, if any. Are there inter-annual differ-ences in migration rates? Do these relate to variations in wind speed and/or direction, or to changes in precipita-tion (and therefore vegetation cover)? Report results to scientifi c and management communities.

Aeolian features and processes 21
CASE STUDIES
There are relatively few long-term monitoring studies of aeo-lian processes and landforms, in part because of the remote nature of many desert regions, and in part because of the perception that geomorphic change is slow in deserts. Good examples include the USGS Desert Winds project (now in part administered by the Desert Research Institute), the USGS dust trap–monitoring study in the southwestern United States, and a decades-long monitor-ing of cross-sectional and morphologic change on a Namibian linear dune. Common to the latter two projects is a relatively sim-ple and robust methodology. This simplicity ensures that ongoing costs of monitoring are low, using a clearly targeted process or landform and a dedicated principal investigator, who has main-tained the monitoring network over many years. Many of the problems encountered by the Desert Winds project stem from the overabundance of data collected and the lack of a clearly defi ned purpose for the monitoring.
Long-Term Monitoring of Sand Transport and Climatic Parameters: The Desert Winds Project
The Desert Winds Project was set up by the USGS in the early 1970s and was designed to permit remote monitoring of aeolian processes (McCauley et al., 1984). Goals of the monitoring net-work were: (1) to provide a long-term database for understanding the range of environmental conditions that can be expected to occur normally in arid and semiarid areas of the desert southwest; (2) to acquire baseline data to assess changes in the desert such as changes in vegetation, migration of sand, and increased dust storms that may occur due to climate change in desert regions; and (3) to acquire data for fi eld-checking remotely sensed image data of various surfaces, so that regional models can be devel-oped for monitoring land surface changes over time.
Each station was equipped with anemometers at three heights (1.2, 2.7, and 6.1 m), a wind vane at 6.1 m, temperature and humidity sensors at 1.2 and 6.1 m, and a tipping bucket rain gauge. Transport of sediment by wind is monitored by BSNE sand traps (Fryrear, 1986) mounted at 0.05 or 0.15 m, 0.50 m, and 1.0 m, together with a Sensit piezo-electric sand transport sensor at 0.05 or 0.15 m above the surface. Full details of the instrumentation and operation of the stations are given in Tigges et al. (1999). With the exception of the BSNE traps, all sensors are scanned at one-second intervals with 6-minute averages of the anemometer, wind vane, and Sensit readings, together with 12-minute average temperature, as well as hourly humidity, and precipitation. Data were uploaded via the GOES satellite each hour until the mid 1990s, when the original equipment was replaced by data loggers, which are downloaded on a monthly basis. Currently, only two of the original stations are operating: Gold Spring, Arizona, and Jornada, New Mexico. In addition to the meteorological data, there is repeat photography for the sites at a series of marked camera stations, which provides an indica-tion of changes in vegetation cover over time.
Some preliminary results of the project are discussed in Breed and Reheis (1999), but most of the data have never been analyzed in a systematic fashion. An example of the application of this unique monitoring network to understanding variability of sand transport rates in relation to climatic parameters is docu-mented in (Lancaster and Helm, 2000). The data on long-term variations in sand transport rates provide a record of the response of sand transport rates to external stressors, including drought periods and changes in the composition of vegetation commu-nities over a period of two decades at Gold Spring and Jornada (Fig. 16). The Gold Spring data show the effects of heavy rainfall on vegetation cover and sand transport rates in the period 1992–1993 and subsequent droughts, while the Jornada data show an order of magnitude increase in sand fl ux since the mid 1990s, likely as a result of the change from a grassland to a mesquite-dominated landscape.
Dust Deposition in the Southwestern United States
This is a good example of a monitoring project that provides quantitative information on an important geologic process, as well as data that lead to a greater understanding of how the pro-cess responds to stressors. The project is ongoing and is designed to monitor dust deposition rates in areas of the Great Basin and Mojave deserts of the southwestern United States. Goals of the project are to determine the rate and composition of dust inputs to soils, and to relate dust accumulation to climatic patterns, especially the amount and seasonal distribution of rainfall, as it affects different dust source areas, including playas and alluvial areas. Results of the project are summarized in Reheis, (1997, 2003, 2006) and Reheis and Kihl (1995). The methodology used is briefl y described above under Vital Sign 2, and discussed in detail in Reheis (1999, 2003).
Thirty-fi ve dust trap sites in the eastern Mojave Desert and southern Great Basin have been monitored since 1984. Rates of deposition of silt and clay, clay, carbonate, and soluble salts have been determined on an annual or two-year basis, and compared to data on annual and seasonal precipitation at nearby weather stations (Fig. 17). Additional data on the chemical and mineral composition of the deposited dust were also generated.
The data show that generation and accumulation of dust is affected by the amount and seasonal distribution of rainfall. However, different source types (alluvium, dry playas, and wet playas) respond in different ways. A major factor in determining dust generation is the condition of surface sediments, especially their moisture content. For example, the fl ux of silt and clay and soluble salt increased following the El Niño events of 1987–1988 and 1997–1998 at sites close to playas with a shallow depth to groundwater. In this case, evaporative concentration of salts dis-rupted surface crusts and increased the susceptibility of surface sediment to wind erosion. The silt and clay fl ux increased during drought periods at sites downwind of alluvial sources and playas with deeper groundwater. This was the result of reduced vege-tation cover on alluvial sediments, and local runoff events that

Figure 16. Changes in sand fl ux over time at Gold Spring and Jornada Desert Winds sites. Sand fl ux measured using Big Spring Number Eight traps.
Figure 17. Changes in dust fl ux in the Mojave and Great Basin deserts (after Reheis, 2006). (A) Dust fl ux and precipitation at northern sites. (B) Dust fl ux and precipitation at southern sites.
Northern sites
0
2
4
6
8
10
12
14
16
1982 1983 1984 1985 1986 1987 1988 1989 1990 1991 1992 1993 1994 1995 1996 1997 1998 1999 2000
Du
st f
lux
(g/m
2/yr
)
0
5
10
15
20
25
30
Ave
rag
e p
reci
pit
atio
n (
cm)
Silt-clay fluxClay fluxSoluble salt fluxCarbonate fluxAverage precip
Southern sites
0
2
4
6
8
10
12
14
16
1982 1983 1984 1985 1986 1987 1988 1989 1990 1991 1992 1993 1994 1995 1996 1997 1998 1999 2000
End of sample year
Du
st f
lux
(g/m
2/yr
)
0
5
10
15
20
25
30
Ave
rag
e p
reci
pit
atio
n (
cm)
Silt-clay fluxClay fluxSalt fluxCarbonate fluxSouthern precip
A
B

Aeolian features and processes 23
delivered fresh sediment to playa margins and the distal portions of alluvial fans (Reheis, 2003, 2006). Reheis (2006) also noted geographical differences in the response of dust sources to pre-cipitation variability, with a greater range of dust fl uxes noted in southern (mostly Mojave Desert) sites.
Topographic Change on a Namibian Linear Dune
Most long-term studies of desert dunes have concentrated on monitoring rates of movement of small crescentic or barchan dunes via comparison of the position of dunes on aerial photo-graphs taken at different time intervals. Studies of the dynamics of individual dunes are relatively rare. This project has monitored surface topographic change on a large linear dune in the central Namib Desert since 1980. Erosion pins were set up in 1980 and monitored weekly for the fi rst four years (Livingstone, 1989). Subsequently, the dune was resurveyed in 1993, providing infor-mation on dune change over a decade (Livingstone, 1993), and again in 2001 (Livingstone, 2003). Methods used varied over the period of monitoring, from direct measurement of erosion pins in the intensive phase to use of a total station in 2001. Some of the erosion pins placed in 1980 survived to provide fi xed points for subsequent surveys. Results of the intensive monitoring showed that the crest region of the dunes is the most active. The crest-lines migrate over a lateral distance of as much as 14 m over a 12-month period, but with little net change over periods of years due to changes in seasonal wind directions. On the dune stud-ied by Livingstone, the crest area changed from a relatively high single crest in the 1980s to a slightly lower double crest form in the 1990s, and then back to single crest form by 2001, regaining
much of its original height (Fig. 18). The lower, or plinth, areas of the dune showed little change over the period of study. Living-stone (2003) attributed the changes in dune crest characteristics to changes in the relative magnitude and frequency of strong east-erly winter winds, which increased in the late 1980s. The studies also suggested that these large dunes are not migrating because no lateral movement was detected. More recent studies show, however, that the rate of lateral migration of these dunes over periods of hundreds to thousands of years is only 0.13 m/year (Bristow et al., 2007), so the net migration over the period studied by Livingstone would have been ~0.25 m, and therefore diffi cult to detect.
REFERENCES CITED
Andrews, S., 1981, Sedimentology of Great Sand Dunes, Colorado, in Etheridge, F.P., and Flores, R.M., eds., Recent and Ancient Non Marine Depositional Environments: models for exploration: Tulsa, Oklahoma, Society of Eco-nomic Paleontologists and Mineralogists, p. 279–291.
Arens, S.M., 1997, Transport rates and volume changes in a coastal foredune on a Dutch Wadden island: Journal of Coastal Conservation, v. 3, p. 49–56.
Arens, S.M., Slings, Q., and de Vries, C.N., 2004, Mobility of a remobilised parabolic dune in Kennemerland, The Netherlands: Geomorphology, v. 59, no. 1–4, p. 175–188, doi: 10.1016/j.geomorph.2003.09.014.
Baas, A.C.W., 2004, Evaluation of saltation fl ux impact responders (Saffi res) for measuring instantaneous aeolian sand transport intensity: Geomorphol-ogy, v. 59, no. 1-4, p. 99–118, doi: 10.1016/j.geomorph.2003.09.009.
Bach, A.J., Brazel, A.J., and Lancaster, N., 1996, Temporal and spatial aspects of blowing dust in the Mojave and Colorado Deserts of Southern Califor-nia: Physical Geography, v. 17, no. 4, p. 329–353.
Bagnold, R.A., 1941, The physics of blown sand and desert dunes: London, Chapman and Hall, 265 p.
Belly, Y., 1964, Sand movement by wind: U.S. Army Corps of Engineers, Coastal Engineering Research Center, Technical Memo, Addendum III, 24 p.
200119931982
1980
2001
19911993
500 100 150 200 250 300 350 400 450 500 550 600 m
80
60
40
20
0
m
500 100 150 200 250 300 350 400 450 500 550 600 m
80
60
40
20
0
m
Figure 18. Changes in linear dune morphology (simplifi ed from Livingstone, 2003).

24 Lancaster
Blount, G., and Lancaster, N., 1990, Development of the Gran Desierto Sand Sea: Geology, v. 18, p. 724–728, doi: 10.1130/0091-7613(1990)018<0724:DOTGDS>2.3.CO;2.
Blount, G., Smith, M.O., Adams, J.B., Greeley, R., and Christensen, P.R., 1990, Regional aeolian dynamics and sand mixing in the Gran Desierto: evidence from Landsat Thematic Mapper images: Journal of Geophysical Research, v. 95, no. B10, p. 15463–15482, doi: 10.1029/JB095iB10p15463.
Brazel, A.J., 1989, Dust and climate in the American Southwest, in Leinen, M., and Sarnthein, M., eds., Palaeoclimatology and Palaeometeorology: mod-ern and past patterns of global atmospheric transport: Dordrecht/Boston/London, Kluwer, p. 65–96.
Breed, C.S., and Reheis, M.C., 1999, Desert Winds: Monitoring wind-related surface processes in Arizona, New Mexico, and California, U.S. Geologi-cal Survey Professional Paper: Washington, D.C., U.S. Government Print-ing Offi ce, p. 153.
Bristow, C.S., Duller, G.A.T., and Lancaster, N., 2007, Age and dynamics of linear dunes in the Namib Desert: Geology, v. 35, p. 555–558, doi: 10.1130/G23369A.1.
Bristow, C.S., and Lancaster, N., 2004, Movement of a small slipfaceless dome dune in the Namib Sand Sea, Namibia: Geomorphology, v. 59, p. 189–196, doi: 10.1016/j.geomorph.2003.09.015.
Bullard, J.E., 1997, A note on the use of the “Fryberger method” for evaluating potential sand transport by wind: Journal of Sedimentary Research, v. 67, no. 3, p. 499–501.
Chow, J.C., 1995, Measurement methods to determine compliance with ambi-ent air quality standards for suspended particles: Journal of the Air & Waste Management Association, v. 45, p. 320–382.
Farmer, A.M., 1993, The effects of dust on vegetation—a review: Environmen-tal Pollution, v. 79, p. 63–75, doi: 10.1016/0269-7491(93)90179-R.
Finkel, H.J., 1959, The barchans of Southern Peru: The Journal of Geology, v. 67, p. 614–647.
Forman, S.L., Spaeth, M., Marin, L., Pierson, J., Gómez, J., Bunch, F., and Valdez, A., 2006, Episodic Late Holocene dune movements on the sand sheet area, Great Sand Dunes National Park and Preserve, San Luis Val-ley, Colorado, USA: Quaternary Research, v. 66, no. 1, p. 97–108, doi: 10.1016/j.yqres.2005.12.003.
Fryberger, S.G., 1979, Dune forms and wind regimes, in McKee, E.D., ed., A Study of Global Sand Seas: U.S. Geological Survey, Professional Paper 1052, p. 137–170.
Fryrear, D.W., 1986, A fi eld dust sampler: Journal of Soil and Water Conserva-tion, v. 41, p. 117–120.
Gares, P.A., 1990, Eolian processes and dune changes at developed and unde-veloped sites, Island Beach, New Jersey, in Nordstrom, K.F., Psuty, N.P., and Carter, R.W.G., eds., Coastal dunes: form and process: Chichester, John Wiley and Sons, p. 361–380.
Gares, P.A., and Nordstrom, K.F., 1995, A cyclic model of foredune blowout evolution for a leeward coast: Island Beach, New Jersey: Annals of the Association of American Geographers, Association of American Geogra-phers, v. 85, no. 1, p. 1–20.
Gillette, D.A., 1999, Physics of aeolian movement emphasizing changing of the aerodynamic roughness height by saltating grains (the Owens effect), in Goudie, A.S., Livingstone, I., and Stokes, S., eds., Aeolian environments, sediments, and landforms: Chichester, New York, John Wiley and Sons, p. 129–142.
Gillette, D.A., and Chen, W., 2001, Particle production and aeolian transport from a “supply limited” source area in the Chihuahuan desert, New Mexico, United States: Journal of Geophysical Research, v. 106, no. D6, p. 5267–5278.
Gillette, D.A., Fryrear, D.W., Xiao, J.B., Stockton, P., Ono, D., Helm, P.J., Gill, T.E., and Ley, T., 1997a, Large-scale variability of wind erosion mass fl ux rates at Owens Lake: 1. Vertical profi les of horizontal mass fl uxes of wind-eroded particles with a diameter greater than 50 µm: Jour-nal of Geophysical Research, v. 102, no. D22, p. 25,977–25,987, doi: 10.1029/97JD00961.
Gillette, D.A., Hardebeck, E., and Parker, J., 1997b, Large-scale variability of wind erosion mass fl ux rates at Owens Lake: 2. Role of roughness change, particle limitation, change of threshold friction velocity and the Owen effect: Journal of Geophysical Research, v. 102, no. D22, p. 25,989–25,998, doi: 10.1029/97JD00960.
Gillette, D.A., and Stockton, P.H., 1986, Mass momentum and kinetic energy fl uxes of saltating particles, in Nickling, W.G., ed., Aeolian Geomorphol-ogy: Boston, London, Sydney, Allen and Unwin, p. 35–56.
Goossens, D., Offer, D., and London, G., 2000, Wind tunnel and fi eld calibra-tion of fi ve aeolian sand traps: Geomorphology, v. 35, no. 3–4, p. 233–252, doi: 10.1016/S0169-555X(00)00041-6.
Goossens, D., and Offer, Z.Y., 2000, Wind tunnel and fi eld calibration of six aeolian dust samplers: Atmospheric Environment, v. 34, p. 1043–1057, doi: 10.1016/S1352-2310(99)00376-3.
Goudie, A.S., Livingstone, I., and Stokes, S., 1999, Aeolian Environments, Sediments, and Landforms: Chichester, John Wiley and Sons, p. 325.
Goudie, A.S., and Middleton, N.J., 2006, Desert Dust in the Global System: Berlin, Heidelburg, New York, Springer, 287 p.
Goudie, A.S., 1983, Dust storms in space and time: Progress in Physical Geog-raphy, v. 7, p. 502–529, doi: 10.1177/030913338300700402.
Goudie, A.S., and Middleton, N.J., 1992, The changing frequency of dust storms through time: Climatic Change, v. 20, p. 197–225, doi: 10.1007/BF00139839.
Griffi ths, P.G., Webb, R.H., Lancaster, N., Kaehler, C.A., and Lundstrom, S.C., 2002, Long-term sand supply to Coachella Valley fringe-toed lizard (Uma inornata) habitat in the northern Coachella Valley, California: , Washing-ton, D.C., U.S. Geological Survey Water-Resources Investigations Report 02-4013, 50 p.
Haff, P.K., and Presti, D.E., 1995, Barchan dunes of the Salton Sea region, California, in Tchakerian, V. P., ed., Desert Aeolian Processes: New York, Chapman and Hall, p. 153–178.
Hastenrath, S.L., 1967, The barchans of the Arequipa region, Southern Peru: Zeitschrift fur Geomorphologie, v. 11, p. 300–311.
Janke, J.R., 2002, An analysis of the current stability of the dune fi eld at Great Sand Dunes National Monument using temporal TM imagery (1984–1998): Remote Sensing of Environment, v. 83, p. 488–497, doi: 10.1016/S0034-4257(02)00065-2.
Jungerius, P.D., and Verheggen, A.J.T., 1981, The development of blowouts in “De Blink,” a coastal dune area near Noordwijkerhout, the Netherlands: Earth Surface Processes and Landforms, v. 6, p. 375–396, doi: 10.1002/esp.3290060316.
Katra, I., Scheidt, S., and Lancaster, N., 2009, Changes in active eolian sand at northern Coachella Valley, California: Geomorphology, v. 105, p. 277–290, doi: 10.1016/j.geomorph.2008.10.004.
Kawamura, R., 1951, Study of sand movement by wind: Tokyo, Japan, Institute of Science and Technology, Tokyo, Report 5, 3-4, p. 95–112.
Kocurek, G., and Lancaster, N., 1999, Aeolian sediment states: theory and Mojave Desert Kelso Dune fi eld example: Sedimentology, v. 46, no. 3, p. 505–516, doi: 10.1046/j.1365-3091.1999.00227.x.
Lancaster, N., 1990, Dune morphology and chronology, Kelso Dunes, Mojave Desert, California: Geological Society of America Abstracts with Pro-grams, v. 22, p. A86.
Lancaster, N., 1993, Development of Kelso Dunes, Mojave Desert, California: National Geographic: Research & Exploration, v. 9, no. 4, p. 444–459.
Lancaster, N., 1995, Geomorphology of Desert Dunes: London, Routledge, 290 p.
Lancaster, N., 1997, Response of eolian geomorphic systems to minor climatic change: examples from the southern California deserts: Geomorphology, v. 19, p. 333–347, doi: 10.1016/S0169-555X(97)00018-4.
Lancaster, N., 2002, Flux of aeolian sediment in the McMurdo Dry Valleys, Antarctica: a preliminary assessment: Arctic, Antarctic, and Alpine Research, v. 34, no. 3, p. 318–323, doi: 10.2307/1552490.
Lancaster, N., 2005, Aeolian erosion, transport and deposition, in Selley, R.C., Robin, L., Cocks, M., and Plimer, I.R., eds., Encyclopedia of Geology: Oxford, Elsevier, p. 612–627.
Lancaster, N., Corbett, E.J., and Cupp, K., 2001, Decadal scale dynamics of the Christmas Valley sand dunes, Lake County, Oregon: Geological Society of America Abstracts with Programs, v. 33, no. 6, p. A-438.
Lancaster, N., and Helm, P., 2000, A test of a climatic index of dune mobil-ity using measurements from the southwestern United States: Earth Sur-face Processes and Landforms, v. 25, no. 2, p. 197–208, doi: 10.1002/(SICI)1096-9837(200002)25:2<197::AID-ESP82>3.0.CO;2-H.
Leys, J.F., 1999, Wind erosion on agricultural land, in Goudie, A.S., Living-stone, I., and Stokes, S., eds., Aeolian Environments, Sediments, and Landforms: Chichester, New York, John Wiley and Sons, p. 143–166.
Livingstone, I., 1987, Photographic evidence of seasonal change in a secondary form on a “complex” linear dune: Madoqua, v. 15, no. 3, p. 237–241.
Livingstone, I., 1989, Monitoring surface change on a Namib linear dune: Earth Surface Processes and Landforms, v. 14, p. 317–332, doi: 10.1002/esp.3290140407.

Aeolian features and processes 25
Livingstone, I., 1993, A decade of surface change on a Namib linear dune: Earth Surface Processes and Landforms, v. 18, no. 7, p. 661–664, doi: 10.1002/esp.3290180708.
Livingstone, I., 2003, A twenty-one-year record of surface change on a Namib linear dune: Earth Surface Processes and Landforms, v. 28, no. 9, p. 1025–1031, doi: 10.1002/esp.1000.
Long, J.T., and Sharp, R.P., 1964, Barchan dune movement in Imperial Valley, California: Geological Society of America Bulletin, v. 75, p. 149–156, doi: 10.1130/0016-7606(1964)75[149:BMIIVC]2.0.CO;2.
MacKinnon, D.J., Elder, D.A., Helm, P.J., Tuesink, M.F., and Nist, C.A., 1990, A method of evaluating effects of antecedent precipitation on duststorms and its application to Yuma, Arizona, 1981–1988: Climatic Change, v. 17, p. 331–360, doi: 10.1007/BF00138374.
Marîn, L., Forman, S.L., Valdez, A., and Bunch, F., 2005, Twentieth century dune migration at the Great Sand Dunes National Park and Preserve, Col-orado, relation to drought variability: Geomorphology, v. 70, p. 163–183, doi: 10.1016/j.geomorph.2005.04.014.
McCauley, J.F., Breed, C.S., Helm, P.J., Billingsley, G.H., MacKinnon, D.J., Grolier, M.J., and McCauley, C.K., 1984, Remote monitoring of pro-cesses that shape desert surfaces: the Desert Winds project: U.S. Geologi-cal Survey, 1634.
McKee, E.D., 1979a, A Study of Global Sand Seas: U.S. Geological Survey Professional Paper, 1052.
McKee, E.D., 1979b, Introduction to a Study of Global Sand Seas, in McKee, E.D., ed., A Study of Global Sand Seas: U.S. Geological Survey Profes-sional Paper, 1052, p. 3–19.
McKee, E.D., and Douglass, J.R., 1971, Growth and movement of dunes at White Sands National Monument, New Mexico: U.S. Geological Survey Professional Paper, 750-D.
McKee, E.D., and Moiola, R.J., 1975, Geometry and growth of the White Sands Dune Field: New Mexico: U.S. Geological Survey Journal of Research, v. 8, no. 3, p. 59–66.
McKenna Neuman, C., and Gilbert, R., 1986, Aeolian processes and landforms in glaciofl uvial environments of southeastern Baffi n Island, N.W.T., Can-ada, in Nickling, W.G., ed., Aeolian Geomorphology: Boston, London, Sydney, Allen and Unwin, p. 213–235.
Middleton, N.J., 1989, Climatic controls on the frequency, magnitude and dis-tribution of dust storms: examples from India/Pakistan, Mauritania and Mongolia, in Leinen, M., and Sarnthein, M., eds., Palaeoclimatology and palaeometeorology: modern and past patterns of global atmospheric transport: Dordrecht/Boston/London, Kluwer, p. 97–132.
Muhs, D.R., and Holliday, V.T., 1995, Evidence of Active Dune Sand on the Great Plains in the 19th Century from Accounts of Early Explorers: Qua-ternary Research, v. 43, p. 198–208, doi: 10.1006/qres.1995.1020.
Nickling, W.G., and McKenna Neuman, C., 1997, Wind tunnel evaluation of a wedge-shaped aeolian sediment trap: Geomorphology, v. 18, no. 3–4, p. 333–346, doi: 10.1016/S0169-555X(96)00040-2.
Nickling, W.G., McTainsh, G.H., and Leys, J.F., 1999, Dust emissions from the Channel Country of western Queensland, Australia: Zeistchrift für Geo-morphologie, v. Supplement-Bd. 116, p. 1–17.
Nordstrom, K., Psuty, N., and Carter, B., 1990, Coastal dunes: Form and Pro-cess: Chichester, John Wiley and Sons, 392 p.
Paisley, E.C.I., Lancaster, N., Gaddis, L., and Greeley, R., 1991, Discrimina-tion of active and inactive sands by remote sensing: Kelso Dunes, Mojave Desert, California: Remote Sensing of Environment, v. 37, p. 153–166, doi: 10.1016/0034-4257(91)90078-K.
Pye, K., 1987, Aeolian dust and dust deposits: London, Academic Press, 334 p.
Pye, K., and Tsoar, H., 1990, Aeolian sand and sand dunes: London, Unwin Hyman, 396 p.
Ramsey, M.S., Christensen, P.R., Lancaster, N., and Howard, D.A., 1999, Iden-tifi cation of sand sources and transport pathways at the Kelso Dunes, California using thermal infrared remote sensing: Geological Society of America Bulletin, v. 111, p. 646–662, doi: 10.1130/0016-7606(1999)111<0646:IOSSAT>2.3.CO;2.
Reheis, M.C., 1997, Dust deposition downwind of Owens (dry) lake, 1991–1994: preliminary fi ndings: Journal of Geophysical Research, v. 102, no. D22, p. 25,999–26,008, doi: 10.1029/97JD01967.
Reheis, M.C., 1999, Dust deposition and its effects on soils—A progress report, in Breed, C.S., and Reheis, M.C., eds., Desert Winds: Monitoring wind-related surface processes in Arizona, New Mexico, and California: Wash-ington D.C., U.S. Government Printing Offi ce, U.S. Geological Survey Professional Paper 1598, p. 123–134.
Reheis, M.C., 2003, Dust deposition in Nevada, California, and Utah, 1984–2002: U.S. Geological Survey, Open-File Report 03-138.
Reheis, M.C., 2006, A 16-year record of eolian dust in Southern Nevada and California, USA: Controls on dust generation and accumulation: Journal of Arid Environments, no. 67, p. 488–520.
Reheis, M.C., and Kihl, R., 1995, Dust deposition in southern Nevada and Cali-fornia, 1984–1989: Relations to climate, source areas, and source lithol-ogy: Journal of Geophysical Research, v. 100, no. D5, p. 8893–8918, doi: 10.1029/94JD03245.
Saqqa, W. A., and Saqqa, A. W., 2007, A computer program (WDTSRP) designed for computation of sand drift potential (DP) and plotting sand roses: Earth Surface Processes and Landforms.
Sarre, R.D., 1987, Aeolian sand transport: Progress in Physical Geography, v. 11, p. 157–182, doi: 10.1177/030913338701100201.
Shao, Y., McTainsh, G.H., Leys, J.F., and Raupach, M.R., 1993, Effi ciencies of sediment samplers for wind erosion measurement: Australian Journal of Soil Research, v. 31, no. 4, p. 519–532, doi: 10.1071/SR9930519.
Sharp, R.P., 1966, Kelso Dunes, Mohave Desert, California: Geological Society of America Bulletin, v. 77, p. 1045–1074, doi: 10.1130/0016-7606(1966)77[1045:KDMDC]2.0.CO;2.
Slattery, M.C., 1990, Barchan migration on the Kuiseb River Delta, Namibia: The South African Geographical Journal, v. 72, p. 5–10.
Stokes, S., Goudie, A.S., Ballard, J., Gifford, C., Samieh, S., Embabi, N., and El-Rashidi, O.A., 1999, Accurate dune displacement and morphometric data using kinematic GPS: Zeistchrift für Geomorphologie Supplement-bände, v. 11, p. 195–214.
Sweet, M.L., Nielson, J., Havholm, K., and Farralley, J., 1988, Algodones dune fi eld of southeastern California: case history of a migrating modern dune fi eld: Sedimentology, v. 35, no. 6, p. 939–952, doi: 10.1111/j.1365-3091.1988.tb01739.x.
Tigges, R., Breed, C.S., and Helm, P.J., 1999, Design and Operations of Geomet Stations of the Desert Winds Project, in Breed, C.S., and Reheis, M.C., eds., Desert Winds: Monitoring wind-related surface processes in Arizona, New Mexico, and California: U.S. Geological Survey Profes-sional Paper 1598: Washington D.C., U.S. Government Printing Offi ce, p. 135–153.
Tigges, R.K., Sides, S., and Ohms, M., 2001, Automated Remote Digital Imag-ing System (ARDIS): Applications for Monitoring Dust Emissions in the Mojave Desert, California: U.S. Geological Survey, Open-File Report 01-0230.
Tsoar, H., and Blumberg, D.G., 2002, Formation of parabolic dunes from barchan and transverse dunes along Israel’s Mediterranean coast: Earth Surface Processes and Landforms, v. 27, p. 1147–1161, doi: 10.1002/esp.417.
Ward, J.D., and von Brunn, V., 1985, Sand dynamics along the Kuiseb River, in Huntley, B.J., ed., The Kuiseb Environment: the development of a moni-toring baseline: Pretoria, Foundation for Research Development, CSIR, p. 51–72.
Warren, A., 1988, The dynamics of dune networks in the Wahiba Sands: Journal of Oman Studies, Special Volume 3.
Williams, G., 1964, Some aspects of the eolian saltation load: Sedimentology, v. 3, p. 257–287.
Wolfe, S.A., 1997, Impact of increased aridity on sand dune activity in the Canadian Prairies: Journal of Arid Environments, v. 36, p. 421–432, doi: 10.1006/jare.1996.0236.
MANUSCRIPT ACCEPTED BY THE SOCIETY 19 FEBRUARY 2009
Printed in the USA
