aem accepts, published online ahead of print on 13...
TRANSCRIPT

1
Dissection of the transcriptional regulator GlpR, the promoter 1
elements, and the post-transcriptional processing involved in the 2
fructose-induced activation of the phosphoenolpyruvate-dependent 3
sugar phosphotransferase system in Haloferax mediterranei 4
5
6
Lei Cai1,2, Shuangfeng Cai1,2, Dahe Zhao1, Jinhua Wu1,2, Lei Wang1, 7
Xiaoqing Liu1,2, Ming Li1,2, Jing Hou1,2, Jian Zhou1, Jingfang Liu1, Jing 8
Han1, Hua Xiang1,* 9
10
1State Key Laboratory of Microbial Resources, Institute of Microbiology, Chinese Academy of 11
Sciences, Beijing 100101, China, 2University of Chinese Academy of Sciences, Beijing 100049, 12
China 13
14
15
*To whom correspondence should be addressed. Tel: +86 10 6480 7472; Fax: +86 10 6480 7472; 16
E-mail: [email protected] 17
18
19
Running Title: PTS regulation in haloarchaea 20
21
22
AEM Accepts, published online ahead of print on 13 December 2013Appl. Environ. Microbiol. doi:10.1128/AEM.03372-13Copyright © 2013, American Society for Microbiology. All Rights Reserved.
on June 16, 2018 by guesthttp://aem
.asm.org/
Dow
nloaded from

2
Abstract 23
Among all known archaeal strains, the phosphoenolpyruvate-dependent 24
phosphotransferase system (PTS) for fructose utilization is primarily used by 25
haloarchaea that thrive in hypersaline environments, whereas the molecular details of 26
the regulation of the archaeal PTS under fructose induction remain unclear. In this 27
study, we present a comprehensive examination of the regulatory mechanism of the 28
fructose-PTS (HFX_1559-HFX_1563) in the haloarchaeon Haloferax mediterranei. 29
With gene knockout-complementation, microarray analysis and ChIP-qPCR, we 30
revealed that GlpR (HFX_1565) is the indispensable activator, which specifically 31
binds to the PTS promoter (PPTS) during fructose induction. Further promoter 32
scanning mutation indicated that three sites located at the upstream of the H. 33
mediterranei PPTS, which are conserved in most haloarchaeal PPTS, are found to be 34
involved in this induction. Interestingly, two PTS transcripts (named T8 and T17) with 35
different 5’ UTR lengths were observed, and the promoter or 5’ UTR swap 36
experiments indicated that the shorter 5’ UTR was most likely generated from the 37
longer one. Notably, the translation efficiency of the transcript with this shorter 5’ 38
UTR was significantly higher, and the ratio of T8 (with the shorter 5’ UTR) to T17 39
increased during fructose induction, implying that a post-transcriptional mechanism is 40
also involved in PTS activation. With these insights into the molecular regulation of 41
the haloarchaeal PTS, we have proposed a working model of haloarchaea in response 42
to environmental fructose. 43
44
on June 16, 2018 by guesthttp://aem
.asm.org/
Dow
nloaded from

3
Introduction 45
The phosphoenolpyruvate (PEP)-dependent sugar phosphotransferase system (PTS) 46
uses PEP as the phosphoryl donor to phosphorylate sugars for transport into cells 47
(1-2). A typical PTS contains five proteins, PtsI (or EI), HPr, PtsA, PtsB and PtsC. 48
Phosphotransfer from PEP to sugar is mediated by these five proteins in a cascade, 49
and the PtsC component at the end of the cascade couples phosphorylation with the 50
translocation of the specific sugars (3-4). The PTS is an important apparatus for sugar 51
uptake and degradation in bacteria, and most bacteria are shown to possess at least 52
one complete PTS (4). The PTS of bacteria can sense the primary metabolic or 53
environmental signal and turn on the uptake system (5-6). In response to the 54
environmental signal, the derivatives of sugars always serve as positive or negative 55
effectors, while the global or specific transcriptional regulators, in cooperation with 56
cAMP or primary metabolites, are involved in the complicated regulation of PTS via 57
direct binding to the promoter regions of PTS genes (2, 7). 58
In contrast to bacteria, the research of archaeal PTS has just received attention in 59
the past few years. The first report that archaea have PTS genes was published in 60
2006 based on the genome sequencing of the haloarchaeon Haloquadratum walsbyi 61
(8). Recent studies of the haloarchaeal genome sequences have indicated that many 62
haloarchaea may contain PTS genes (8-11), and 6 out of 24 haloarchaeal genomes 63
have a complete fructose-specific PTS gene cluster, including Haloterrigena 64
turkmenica, Halalkalicoccus jeotgali, Haloarcula hispanica, Haloarcula marismortui, 65
Haloferax volcanii and Haloferax mediterranei (11). Recently, a functional 66
on June 16, 2018 by guesthttp://aem
.asm.org/
Dow
nloaded from

4
fructose-specific PTS has been identified in H. volcanii using genetic methods, and 67
fructose is shown to be able to up-regulate the transcription of this PTS gene cluster 68
(12), with the molecular details of the fructose-induced PTS activation remain unclear 69
in archaea. Interestingly, earlier research in H. volcanii indicates that a DeoR family 70
transcriptional regulator, GlpR, represses the expression of fructose and glucose 71
metabolic enzymes (2-keto-3-deoxy-D-gluconate kinase (KDGK) and 72
phosphofructokinase (PFK)) at the transcriptional level in H. volcanii when cells were 73
grown on glycerol (13). In addition, it was reported that glpR is cotranscribed with the 74
downstream phosphofructokinase gene (fruK) (13). The PTS gene cluster is located 75
just adjacent to glpR-fruK. As a putative transcriptional regulator which usually acts 76
as a transcriptional regulator in sugar metabolism in bacteria (14-15), GlpR is 77
probably involved in the transcriptional regulation of the PTS cluster. However, so far 78
as we know, the relationship between the GlpR and the PTS activation has not yet 79
been established in haloarchaea. 80
Recently, the genome of H. mediterranei was completely sequenced by our 81
laboratory (16). A genome-wide in silico analysis showed that the arrangement of 82
fructose metabolism-related genes, including the PTS system in H. mediterranei, is 83
identical to that of H. volcanii. However, in contrast to H. volcanii, H. mediterranei 84
can synthesize biodegradable polymers such as polyhydroxyalkanoates (PHA) from 85
many cheap carbon resources (17-19). Studying the regulation mechanism of PTS in 86
H. mediterranei is useful not only to compare the different gene regulation strategies 87
between bacteria and archaea, but can also result in a deeper understanding of the 88
on June 16, 2018 by guesthttp://aem
.asm.org/
Dow
nloaded from

5
carbon sensing and utilization of this specific haloarchaeal PHA producer. In the 89
present study, a comprehensive investigation of the regulatory mechanism of the PTS 90
was performed in H. mediterranei. We demonstrated that GlpR is an indispensable 91
activator of the PTS gene cluster upon fructose induction via direct binding to the PTS 92
promoter region (PPTS). Interestingly, we also revealed an additional 93
post-transcriptional mechanism which could increase the translation efficiency of PTS 94
transcripts. Together, our results helped elucidate the complex and delicate 95
mechanisms of fructose-PTS regulation in the domain of archaea. 96
97
Materials and Methods 98
Strains and growth conditions. The strains used in this study are listed in Table S1. 99
Escherichia coli JM109 was used as the host for the cloning experiments (Novagen, 100
Madison, WI, USA) and was grown in Luria-Bertani medium at 37°C (20). Unless 101
otherwise noted, H. mediterranei DF50 (21) and the gene knockout mutants were 102
cultivated at 37°C in nutrient-rich AS-168L medium (22), and H. mediterranei strains 103
harboring expression plasmids were cultivated in AS-168SYL medium (AS-168L 104
without yeast extract) (22). The chemically defined medium (CDM, consisting of the 105
followings (per liter): 150 g NaCl, 20 g MgSO4 · 7H2O, 2 g KCl, 50 mg FeSO4 · 7H2O, 106
0.36 mg MnCl2 · 4H2O, 5 g NH4Cl, 15 g PIPES, pH 7.2) with different concentrations 107
of fructose or glucose was used to verify the utilization of the carbon source by H. 108
mediterranei mutant strains. When required, ampicillin, uracil and 5-FOA were added 109
to the media at a final concentration of 100 mg/L, 50 mg/L and 250 mg/L, 110
on June 16, 2018 by guesthttp://aem
.asm.org/
Dow
nloaded from

6
respectively. 111
Gene knockout and complementation. In-frame deletion and complementation 112
strains were generated according to previously published protocols (21, 23). All the 113
primers used in this study are listed in Table S2, and the plasmids are listed in Table 114
S1. The transformation of H. mediterranei was performed according to the 115
polyethylene glycol-mediated spheroplast transformation method (24). The plasmid 116
sequences and mutant strains were verified by PCR and DNA sequencing. 117
RNA extraction, qRT-PCR and circularized RNA (CR)-RT-PCR. H. 118
mediterranei DF50 cells and the gene knockout mutants were cultured at 37°C in 119
AS-168L medium. When the OD600 reached 1.5, glucose or fructose was added to the 120
medium to a final concentration of 50 mM, and the cells were incubated for 45 min. 121
The sugar-induced cells (3 ml) were then immediately collected for RNA extraction 122
using TRIzol reagent (Invitrogen, Carlsbad, CA, USA) according to the 123
manufacturer’s instructions. An equal volume of TBSL buffer (consisting of the 124
followings (per liter): 150 g NaCl, 20 g KCl, 5 g MgSO4 · 7H2O, 100 mM Tris-HCl, 125
pH 7.1) (22) was added to the cells in the control group. To remove DNA 126
contamination, DNase I (Promega, Madison, WI, USA) digestion was performed on 1 127
μg of diluted RNA. 128
The specific primer pairs in Table S2 of the target DNA regions and suitable 129
concentrations of the cDNA templates or genomic DNA were used for quantitative 130
PCR (qPCR). The amplification and detection of target regions were performed on a 131
Rotor-Gene® Q real-time cycler (Qiagen, Valencia, CA) under a standard three-step 132
on June 16, 2018 by guesthttp://aem
.asm.org/
Dow
nloaded from

7
PCR procedure [including initial denaturation at 95 °C for 10 min followed by 40 133
cycles of denaturation at 95 °C for 30 s, annealing at 55 °C for 30 s and synthesis at 134
72 °C for 30 s. A melting curve was generated by linear heating from 70°C to 95°C 135
over 25 minutes]. For the synthesis of the cDNA, 200 ng of DNase I-treated total 136
RNA was reverse transcribed via random hexamer primers by using the Moloney 137
murine leukemia virus RTase (M-MLV-RT; Promega, Madison, WI, USA). DNase 138
I-treated RNA (without reverse transcription) was used to check for genomic DNA 139
contamination. 140
CR-RT-PCR (25-26) was used to determine the 5’ UTR of the PTS gene cluster. 141
RNA circularization was carried out as described (25). Self-ligated RNA was reverse 142
transcribed via random hexamer primers as described above. The cDNA was first 143
amplified with a gene-specific primer pair, cRT1F and cRT1R, and a second PCR was 144
performed to enhance the specificity by using an inner primer pair, cRT2F-cRT2R. 145
The products of the second PCR were cloned into the TA vector pUCm-T (Sangon 146
Biotech, Shanghai, China) according to the standard procedures, and 15 clones from 147
each RNA sample were analyzed by sequencing. 148
Constructs used for the transformation of H. mediterranei. For analysis of the 149
promoter activity in vivo, a plasmid-based transcriptional reporter system using a 150
soluble-modified red-shifted GFP (smRSGFP) (27) was constructed as previously 151
described (28). All the plasmids used to transform H. mediterranei cells were derived 152
from pWL502, and the details of their constructions are shown in the “Supplemental 153
material”. The plasmids pL117, pPR and pPF were used to analyze the wild-type 154
on June 16, 2018 by guesthttp://aem
.asm.org/
Dow
nloaded from

8
promoter activity of PTS (PPTS), glpR (PglpR) and fba (Pfba), respectively. To dissect the 155
regulatory region of the PPTS, the 5’ flanking deletion mutants of the PPTS (named 156
pL93, pL77, pL56, pL24 and pGFP-0) and the scanning site-directed mutants (from 157
pM+1216 to pM7975) were transformed into H. mediterranei DF50 to detect the 158
mutated promoter activity. The activities of GlpR and myc-tagged GlpR were 159
determined by introducing the plasmids pL117CR and pL117Rm into the H. 160
mediterranei DF50 ΔglpR strain, respectively. In the promoter or 5’ UTR swap 161
experiment, pHSP, pUTR-M, pT8 and pT17 were generated by constructing fusions 162
between the promoter or 5’ UTR regions of the hsp5 (amplified from the plasmid 163
pSCM307 (29)) and PTS gene cluster. 164
Analysis of the smRSGFP fusion reporter system. The fluorescence intensity 165
of each smRSGFP-fusion reporter plasmid-harboring strain was measured using a 166
Synergy H4 hybrid microplate reader (BioTek Instruments Inc; Winooski, VT, USA). 167
The excitation wavelength was set to 488 nm, and the emission wavelength was 509 168
nm (27). All strains were incubated at 37°C in AS-168SYL medium until the OD600 169
reached 1.5; 90 μL of each culture was then transferred to the black polystyrene 170
96-well plates (Costar-3916; Corning, NY, USA). In most cases, 10 μL of a fructose 171
or glucose stock solution was added to the designated induction wells on the 96-well 172
plates to a final concentration of 50 mM. For the metabolic intermediate F-1-P 173
(fructose-1-phosphate) induction tests, the final concentrations of F-1-P and fructose 174
were reduced to 2 mM. In each assay, 10 μL of TBSL buffer was used as a negative 175
control for basal fluorescence intensity. All of the plates were incubated at 37°C for 8 176
on June 16, 2018 by guesthttp://aem
.asm.org/
Dow
nloaded from

9
hours before they were measured. 177
Primer extension. The H. mediterranei strains harboring different plasmids were 178
used in the primer extension assay with a specific primer based on the sequence of gfp. 179
Primer extension reactions were performed using 5 μg of total RNA and 3 pmol of the 180
5'-biotin-labeled primer gfpRbio (Table S2) with the reverse transcription protocol 181
described above. The extension products were analyzed on an 8% acrylamide 182
sequencing gel. A Chemiluminescent Nucleic Acid Detection Module Kit 183
(Pierce-Thermo Scientific, Rockford, IL) was used for biotin detection. 184
Immunoprecipitation. The interaction between GlpR and the promoter region 185
was analyzed by the ChIP assay. A Myc-tagged GlpR was expressed using the pRm 186
plasmid (Table S1) in the H. mediterranei ΔglpR. Cells were harvested at the 187
mid-logarithmic phase (OD600=1.5) with or without fructose induction. The ChIP 188
experiments were performed according to the previously described protocol (30-31). 189
The enrichment of genomic fragments was analyzed by qPCR with the input DNA 190
samples as controls. The primers used are listed in Table S2. The PCR and 191
thermocycling conditions were the same as described above for qRT-PCR. Each ChIP 192
assay had five biological replicates. In each ChIP sample, the enrichment of 193
GlpR-Myc interacting with each locus was calculated compared to the input sample 194
using relative quantitation. 195
Microarray assay and deep sequencing. The RNA samples used for qRT-PCR 196
from DF50 cells with or without fructose induction were subjected to microarray 197
analysis. Oligonucleotide microarrays (8×15K) were designed and manufactured by 198
on June 16, 2018 by guesthttp://aem
.asm.org/
Dow
nloaded from

10
Capital Bio and Agilent Technologies (http://www.agilent.com) based on the whole 199
genomic sequence of H. mediterranei. The microarray was carried out as previously 200
described (32). Each assay was repeated three times. The resulting data were analyzed 201
by Significance Analysis of Microarrays (SAM) software version 2.23b (33). The 202
same protocols used for the microarray assays were also performed on the total RNA 203
samples from the mutant ΔglpR strain with or without fructose induction. The deep 204
sequencing of the transcriptome of H. mediterranei was performed on HiSeq 205
Sequencing Systems (Illumina HiSeq 2000) at the Beijing Institute of Genomics of 206
Chinese Academy of Sciences. 207
Accession numbers. The microarray data are deposited in the NCBI GEO 208
library under the accession number GSE41134. 209
Prediction of RNA secondary structures. The program ‘Sfold’ (34-35) was 210
used for the prediction of putative secondary structures of RNA 211
(http://sfold.wadsworth.org). 212
213
Results 214
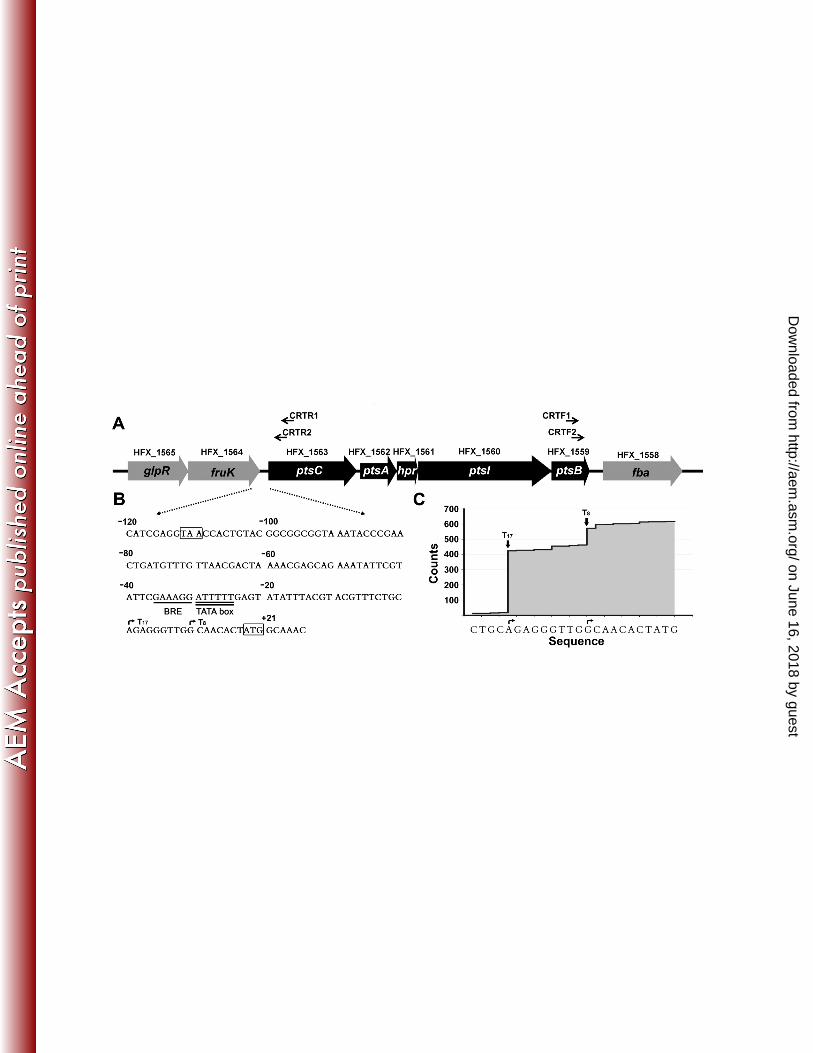
GlpR is essential for the activation of the PTS promoter by fructose. In H. 215
mediterranei, the PTS genes (HFX_1559-HFX_1563) were organized in an operon 216
corresponding to a polycistronic transcript (Fig. 1A). The functional involvement of 217
the PTS in fructose utilization was confirmed via genetic methods that were used in H. 218
volcanii (21) (Fig. S1 and S2). The DNA sequence of the intergenic region between 219
fruK and ptsC was listed in Fig. 1B. Deep sequencing of the total RNA of H. 220
on June 16, 2018 by guesthttp://aem
.asm.org/
Dow
nloaded from

11
mediterranei DF50 indicated that there were two transcripts with a 17-nt or 8-nt 5' 221
untranslated region (UTR), respectively. The start site (A) (+1) of the longer transcript 222
(T17) is 9-nt away from the start site (G) (+10) of the shorter transcript (T8) (Fig. 1B 223
and 1C), and these start sites were confirmed by CR-RT-PCR. However, only one 224
typical promoter containing a putative TFIIB-recognition element (BRE) (-36 225
GAAAGG -31) and a putative TATA box (-30 ATTTTT -25) was found (Fig. 1B). 226
In silico analysis showed that the DeoR family transcriptional regulator, GlpR, is 227
highly conserved in haloarchaea (>60% identity), but it is more distantly related to its 228
homologs in other archaea and bacteria (<45% identity) in comparison. The protein 229
sequence multiple alignment analysis by BLASTP indicated that approximately 70 of 230
the 255 amino acids in the N-terminus of GlpR form a putative HTH motif, and the 231
remaining amino acids near the C-terminus form a DeoR-type regulator C-terminal 232
sensor domain. To determine whether the transcription of the PTS gene cluster is 233
regulated by GlpR, the H. mediterranei DF50 and the ΔglpR strain were analyzed by 234
microarray assays with or without fructose induction (GEO accession number: 235
GSE41134). The transcriptional fold changes of the PTS gene cluster and neighboring 236
genes (HFX_1558-1565) are listed in Table 1. It was shown that the PTS gene cluster 237
and the glpR-fruK operon, which were highly up-regulated by fructose in H. 238
mediterranei DF50, were not inducible in the ΔglpR strain. In addition, the 239
transcription of fba was not significantly changed in either group (Table 1). These 240
results strongly suggested that GlpR is an indispensable regulator in fructose-induced 241
PTS activation in H. mediterranei. 242
on June 16, 2018 by guesthttp://aem
.asm.org/
Dow
nloaded from

12
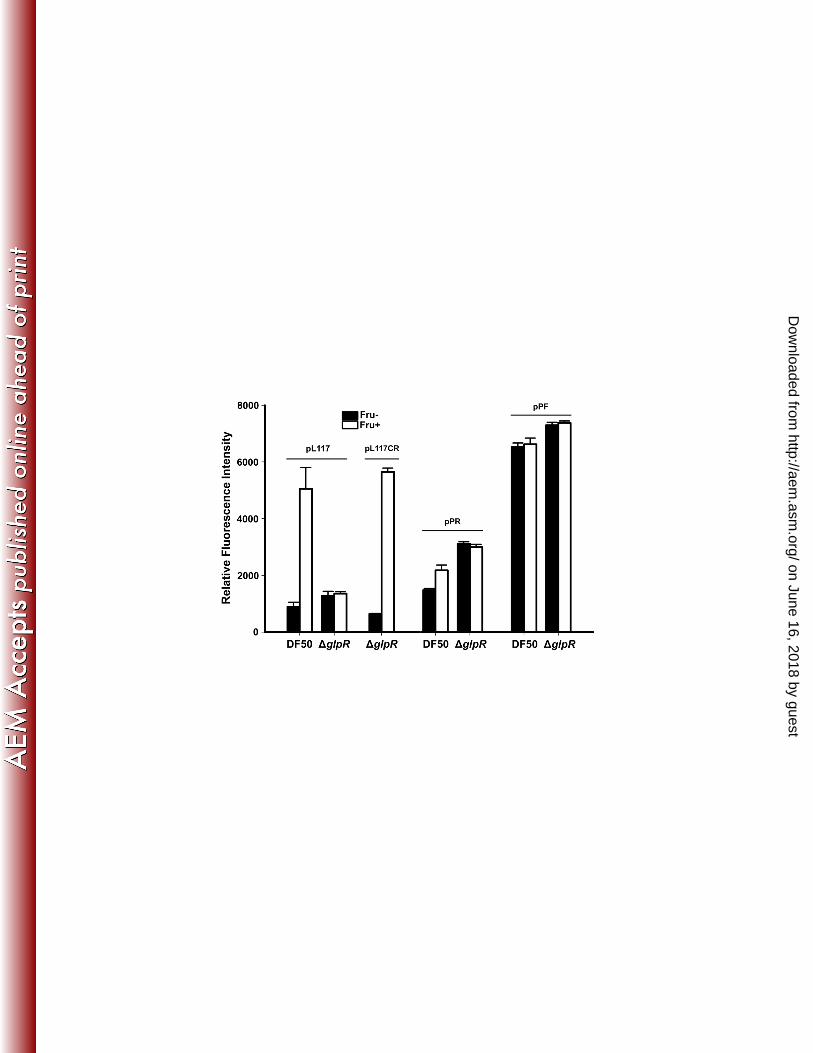
To confirm the regulation of PTS by GlpR in vivo and to conveniently investigate 243
the PTS promoter, the ΔglpR strain harboring different GFP-based reporter plasmids 244
was investigated; the DF50 strain served as a positive control. It was shown that 245
whether induced by fructose or not, the fluorescence intensity of the ΔglpR strain 246
harboring pL117, which expressed smRSGFP under the wild-type PTS promoter (134 247
bp upstream of translation start codon of ptsC), was much closer to the basal 248
fluorescence intensity of the DF50 harboring pL117 (without fructose induction) (Fig. 249
2). The ΔglpR strain harboring pL117CR showed that the activation of the PPTS by 250
fructose was restored through the expression of GlpR (using its native promoter, PglpR) 251
in the ΔglpR strain (Fig. 2). Furthermore, the transcriptional activity of PglpR was also 252
analyzed via the reporter plasmid pPR, which expresses smRSGFP using PglpR. The 253
fluorescence intensity of the PglpR-fusion reporter system increased slightly 254
(approximately 1.5-fold) when DF50 cells were induced by fructose but did not 255
change when ΔglpR cells were tested (Fig. 2). In contrast, regardless of fructose 256
induction, the fluorescence intensity was similar between DF50(pPF) and ΔglpR(pPF) 257
transformants (both expressing smRSGFP with the Pfba promoter) (Fig. 2). These 258
results confirmed that GlpR is essential for the fructose-induced transcriptional 259
activation of the PTS and the glpR-fruK gene clusters, and it may act as a positive 260
regulator for fructose-induced PTS expression. This finding is quite interesting, as 261
GlpR has been previously identified as a global repressor that inhibits the activities of 262
KDGK and PFK in H. volcanii when cells were cultured in a glycerol-based medium 263
(13). The different functions of GlpR are likely attributable to the different carbon 264
on June 16, 2018 by guesthttp://aem
.asm.org/
Dow
nloaded from

13
sources (fructose vs. glycerol) being used, and/or on different promoters. 265
GlpR binds directly to the PPTS during the fructose induction. To determine 266
whether the activation of gene expression by GlpR occurs via a direct binding to the 267
promoter sequence, a ChIP assay coupled with qPCR analysis was performed in the 268
ΔglpR strain harboring pRm (a Myc-tagged GlpR expression plasmid) with or without 269
fructose induction. The recombinant GlpR-Myc (expressed by pL117Rm) was 270
revealed to be able to restore the activity of wild-type GlpR in the ΔglpR strain (data 271
not shown). Three DNA loci (FPTS, Fiic, and FphaE) were investigated for their 272
interaction with GlpR, with the F16S locus (a fragment of the 16S rRNA gene) used as 273
an internal control for data normalization. The FPTS (119 bp) represented the fragment 274
of the PPTS region (-92 to +27 bp upstream of the PTS gene cluster), Fiic (125 bp) 275
represented the intragenic region of ptsC located approximately 550 bp to 650 bp 276
downstream of FPTS. The FphaE (189 bp) locus containing the promoter region of phaE 277
(which encodes a subunit of polyhydroxyalkanoate synthase in H. mediterranei (19)) 278
was tested as a negative control because the expression level of phaE did not change 279
in the microarray experiment when the cells were treated with fructose (data not 280
shown). After the induction by fructose, the FPTS locus exhibited a 2-fold enrichment 281
of binding to GlpR-Myc over the negative control locus FphaE, but the enrichment of 282
the FPTS and FphaE loci were similar to each other in the absence of fructose induction 283
(Fig. 3). As expected, the fold enrichment of the Fiic locus remained unchanged and 284
was similar to that of locus FphaE, with or without fructose induction (Fig. 3). These 285
results demonstrated that GlpR could directly bind to the PPTS when H. mediterranei 286
on June 16, 2018 by guesthttp://aem
.asm.org/
Dow
nloaded from

14
cells are treated with fructose, but the interaction between GlpR and PPTS was not 287
apparent without fructose induction. The significantly increasing binding ability 288
between GlpR and PPTS under fructose induction indicated again that GlpR is an 289
activator of PTS transcription. 290
Three regions within the PPTS account for the fructose induction. The above 291
results demonstrated that GlpR acts as a positive regulator for the induction of the 292
PTS gene cluster by fructose via direct binding to the PPTS. To experimentally analyze 293
the cis-acting elements of the PPTS, 5’ flanking deletion and site-directed mutagenesis 294
analysis of the PPTS were carried out based on the smRSGFP-fusion reporter system of 295
plasmid pL117. The fluorescence intensity of H. mediterranei DF50 transformants 296
harboring deletions or site-directed mutagenesis constructs were measured with or 297
without fructose induction (Fig. 4). 298
The wild-type PTS promoter in pL117 and the deletion mutants in pL93, pL77 299
and pL56 exhibited similar basal transcription activities when cells were grown in 300
AS-168SYL medium (data not shown). However, in the presence of fructose, the 301
pL56 mutant completely lost the ability to respond to the fructose induction. The 302
pL93 and pL77 mutants showed a 2- to 3-fold increase in fluorescence intensity after 303
the fructose induction. When the putative BRE and TATA box of PPTS were deleted 304
(pL24), the transcription activities of both the basal and fructose-inducing conditions 305
were almost undetectable (Fig. 4A). These results revealed that the pL77 mutant still 306
contains the main cis-acting elements that respond to the fructose induction. Thus, the 307
promoter region from -79 bp to +16 bp of pL117 was analyzed using site-directed 308
on June 16, 2018 by guesthttp://aem
.asm.org/
Dow
nloaded from

15
scanning mutagenesis to pinpoint the essential regions that account for the fructose 309
induction. The resulting constructs were named pM7975 to pM+1216, in which the 310
numbers indicate the mutation region. For example, pM7975 indicates mutagenesis 311
from -79 bp to -75 bp relative to the TSS of the PPTS, and pM+1216 indicates 312
mutagenesis from +12 bp to +16 bp. These plasmids were transformed into H. 313
mediterranei DF50 to generate the reporter strains M7975 to M+1216 for the 314
detection of fluorescence intensity. 315
It was observed that mutations in the putative BRE (-36 to -31 bp) and TATA box 316
(-30 to -25 bp) regions (M3935, M3430 and M2925) and the -10 region (M1410) led 317
to a complete loss of transcriptional activity. Only three mutants, M7975, M6864 and 318
M2420, have the same response to fructose induction as the pL117 transformant, and 319
a 1.5- to 2-fold induction was detected in mutants M6360, M5553, M4440 and M1915 320
(Fig. 4B). It is noteworthy that the basal fluorescence intensity of M1915 rose to a 321
very high level (19 times that of DF50 harboring pL117). However, the fluorescence 322
intensity of M1915 was still induced by fructose, and thus the region from -19 to -15 323
bp might not be directly involved in fructose activation. The GlpR seemed unrelated 324
to any inhibition at the region from -19 to -15, since the fluorescence intensity of the 325
ΔglpR strain harboring pL117 (with or without fructose induction) was similar to the 326
basal intensity of DF50 cells harboring pL117 (without fructose induction) (Fig. 2). 327
These results showed that the knockout of the GlpR can not enhance the PPTS activity 328
to as high of a level as that detected in the PPTS mutated plasmid pM1915. We 329
speculate that either the site from -19 to -15 bp is required for the binding of an 330
on June 16, 2018 by guesthttp://aem
.asm.org/
Dow
nloaded from

16
unknown inhibitor or the mutation from -19 to -15 bp changes the promoter 331
architecture, both of which may lead to a higher activity of the mutated promoter 332
under basal conditions. 333
Notably, the fructose induction did not significantly change the transcriptional 334
levels of the mutants M7469, M5957, M5755 and M5351 to M4745 (the fold change 335
for each was no more than 1.1), indicating that the corresponding regions in these 336
mutants are important for the fructose-induced up-regulation of the PTS. These results 337
revealed that the promoter regions I (-74 bp to -69 bp), II (-59 bp to -56 bp), and III 338
(-52 bp to -45 bp) are particularly important for the fructose induction in H. 339
mediterranei, and mutations in these three regions made the PPTS lose its ability to 340
respond to the fructose induction (Fig. 4B). This phenomenon of which was similar to 341
that was observed in the ΔglpR mutant strain harboring pL117 (Fig. 2), indicating that 342
the regions I, II, and III were essential for the cellular responses to fructose induction 343
and were likely to be the binding sites of GlpR under fructose induction. Interestingly, 344
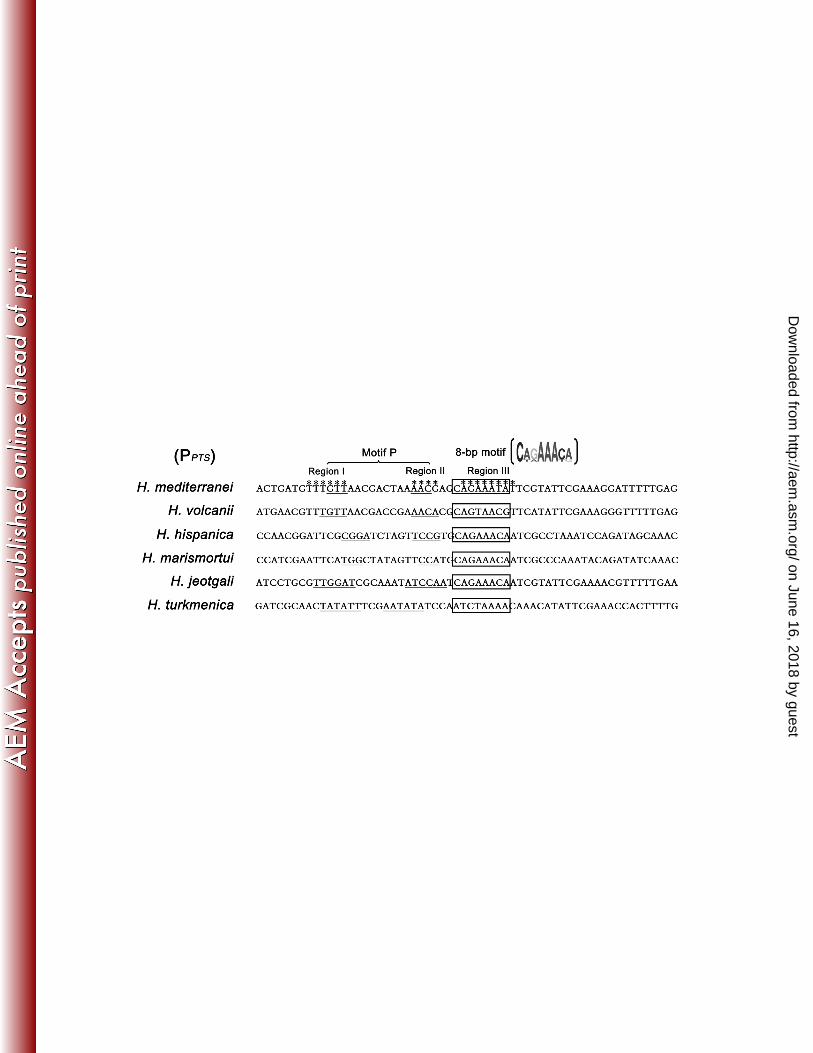
after analyzing the PPTS of all six haloarchaea that possess the PTS gene cluster, an 345
conserved 8-bp motif, which overlapped with seven base pairs of region III, was 346
identified (Fig. 5). In addition, a palindromic DNA sequence pattern belonging to 347
regions I and II, named motif P (short for ‘palindromic’) in this study, was also at the 348
upstream of the 8-bp motif (Fig. 5), implying that the regulatory mechanism of PTS 349
revealed in H. mediterranei may be shared by other haloarchaea. 350
It is noteworthy that the basal fluorescence intensity of mutant M+911 was more 351
than 2.4 folds increasing to that of the pL117 transformant, and both the basal and 352
on June 16, 2018 by guesthttp://aem
.asm.org/
Dow
nloaded from

17
induced fluorescence intensities in the mutants M+38 and M+1216 decreased to a 353
very low level in these strains (Fig. 4B). These results suggest that the mutations in 354
the 5’ UTR altered either the mRNA stability or the translation efficiency of the PTS 355
gene transcripts. 356
Generation of the PTS transcript with the shorter 5’ UTR due to 357
post-transcriptional processing. The results of scanning mutagenesis showed that 358
only one TATA box, BRE and -10 elements were identified in the PTS operon (Fig. 359
4B), which indicated that there is only one promoter for PTS transcription. However, 360
two transcripts with 5’ UTRs of different lengths (17 nt and 8 nt) were observed 361
among the PTS transcripts (Fig. 1B and 1C), and the 5’ UTR of the PTS gene cluster 362
was found to be important for their expression (Fig. 4B). To investigate how the two 363
transcripts containing 5’ UTRs of different lengths were produced and whether they 364
were involved in the PTS activation, the feature and function of this 5’ UTR region 365
were further analyzed. 366
First, RNA folding and the general features of the 17-nt 5’ UTR were predicted 367
using ‘Sfold’ software, and a stem-loop structure was indicated. The start site (G) 368
(+10) of the 8-nt 5’ UTR was located at the loop region (Fig. 6A). DF50 strains 369
harboring different plasmids were used to conveniently characterize the 5’ UTR at 370
both the transcriptional and translational levels (Fig. 6B). In a primer extension assay, 371
when the nucleotides in the +3 to +11 bp region (M+911 and M+38) of the 5’ UTR 372
were mutated, the small extension product was hardly detectable (Fig. 6B). Therefore, 373
the production of the shorter gfp transcripts likely depends on the sequence or 374
on June 16, 2018 by guesthttp://aem
.asm.org/
Dow
nloaded from

18
structure of the 5’ UTR (same as the 5’ UTR of PTS transcripts) of the mRNA. 375
To test this hypothesis, four other promoter- or 5’ UTR-swapped constructs were 376
generated as shown in Fig. 7A. The plasmids, pT8, pT17, and pHSP contained the 377
hsp5 promoter from Halobacterium sp. NRC-1 (Phsp5) (36) and different 5’ UTR 378
regions either from PTS (pT8 and pT17) or hsp5 (pHSP), respectively, whereas 379
pUTR-M (containing the PTS promoter and the 5’UTR of hsp5) was constructed in a 380
manner similar to that of pHSP by only replacing the Phsp5 with the PPTS. The results 381
showed that the two constructs that contained the 17-nt 5’ UTR, pT17 and the positive 382
control (PC) pL117 could both produce two transcripts (corresponding to T8 and T17 of 383
the PTS transcripts, and named T8G and T17G thereafter for the gfp transcripts) with 384
different 5’ UTRs (Fig. 7B), despite the fact that the transcription of these constructs 385
was controlled by different promoters (Phsp5 and PPTS, respectively). On the contrary, 386
only one transcript was generated from pHSP or pT8 as expected (Fig. 7B), and the 387
PTS promoter (PPTS) combined with the hsp5 5’ UTR sequence (pUTR-M) was also 388
unable to generate the shorter transcript. These results indicated that the production of 389
the transcript with shorter 5’ UTR was only related to the sequence of the longer 5’ 390
UTR, but not to the promoter, and therefore indicated a potential post-transcriptional 391
processing of PTS transcripts. 392
Physiological significance of the generation of the shorter 5’ UTR. To 393
understand the physiological significance of the production of two transcripts 394
containing 5’ UTRs of different lengths, the translation efficiency of these two 395
transcripts was investigated. The relative amounts of gfp transcripts (detected by 396
on June 16, 2018 by guesthttp://aem
.asm.org/
Dow
nloaded from

19
qRT-PCR) and their translation activity (measured by fluorescence intensity) were 397
determined using DF50 strains harboring pT8 or pT17 (Fig. 8A). There was no 398
significant difference in the amount of gfp transcripts between DF50 strains harboring 399
pT8 or pT17 as evaluated by the Student’s t test, but the GFP expression from the 400
shorter transcript in the DF50 strain harboring pT8 was over 6-fold higher than the 401
GFP expression from the mixture of two transcripts in the DF50 strain harboring pT17 402
(Fig. 8A). These results indicated that the translation efficiency of the shorter 403
transcript was much higher than that of the longer transcript. 404
Further research was performed to find a correlation between the fructose 405
induction and the production of the two transcripts. The primer extension products of 406
the DF50 and ΔglpR strains harboring pL117 with or without fructose induction 407
were analyzed. The results showed that the amount of the two transcripts increased 408
as a result of the fructose induction in the DF50 strain, and the ratio of the shorter 409
transcript to that of the longer transcript was also increased (Fig. 8B). To confirm 410
this result quantitatively, CR-RT-PCR was performed on the DF50 and ΔglpR strains 411
with or without fructose induction. The ratio of clone counts of the PTS transcript 412
with the 8-nt 5’UTR to that of the 17-nt 5’ UTR was doubled (from 14% to 31%) 413
when DF50 cells were induced by fructose (Table 2). The ratios of T8 to T17 counts 414
in the ΔglpR strain with or without induction were similar to each other and much 415
closer to the non-induced ratio in the DF50 strain (Table 2). These results indicate 416
that the translation efficiency of the PTS genes would be enhanced when the cells 417
were induced by fructose due to the increased proportion of the shorter transcript. 418
on June 16, 2018 by guesthttp://aem
.asm.org/
Dow
nloaded from

20
F-1-P may acts as a positive intracellular effector. During PTS regulation, the 419
derivatives of sugars always serve as positive or negative effectors to enhance or 420
repress the activity of regulators. F-1-P was shown to act as an important intracellular 421
effector for the transcriptional regulation of PTS in many bacteria (2, 14-15, 37). To 422
investigate the function of F-1-P during PTS regulation, the smRSGFP-fusion reporter 423
assay was performed with the pL117 transformant of H. mediterranei. In the fruK 424
knockout mutant containing pL117, whether induced by fructose or not, the 425
fluorescence intensity both increased to a very high level (more than 20 times higher 426
than that in DF50) and the induced expression of PTS by fructose disappeared (Table 427
3). In H. volcanii, it has been revealed that fructose is transported through PTS, which 428
would generate F-1-P, after which it is further phosphorylated by 1-PFK (encoded by 429
fruK) (12). The high level of gfp expression in H. mediterranei ΔfruK may be caused 430
by the accumulation of F-1-P when 1-PFK is inactivated, which implies that F-1-P 431
may enhance the expression of PTS as an intracellular effector as observed in bacteria. 432
This hypothesis is also supported by detecting the fluorescence intensity of H. 433
mediterranei DF50 cells harboring pL117 when adding F-1-P to the culture medium 434
(Fig. S3). Either Fructose or F-1-P induction significantly increased the fluorescence 435
intensity, whereas the other derivative of fructose, fructose-1,6-bisphosphate 436
(F-1,6-2P), decreased the fluorescence intensity (Fig. S3). 437
438
Discussion 439
During the fructose induction, GlpR is shown to be an indispensable activator for 440
on June 16, 2018 by guesthttp://aem
.asm.org/
Dow
nloaded from

21
the up-regulation of the fructose-specific PTS gene cluster (Table 1, Fig. 2) through 441
the direct binding to PPTS in H. mediterranei (Fig. 3). Therefore, GlpR is essential for 442
the cellular responses to the fructose induction. Interestingly, in H. volcanii, GlpR has 443
been shown to be a global regulator by repressing the transcription of the key 444
enzymes, including KDGK and PFK, when using glycerol as the carbon resource (13). 445
It seemed that the function of GlpR was decided by the environmental carbon sources. 446
Through the regulator GlpR, glycerol represses sugar metabolism and fructose 447
activates PTS expression. Previous reports suggest that the DeoR-type proteins always 448
contain several highly conserved regions, one of which is the second helix of the 449
helix-turn-helix (HTH) DNA-binding motif in the N-terminus (38). The other 450
conserved regions are involved in oligomerization or inducer binding (in many cases, 451
the inducer is a phosphorylated sugar). As one of the DeoR-type proteins, it makes 452
sense that GlpR could be activated through the interaction of its C-terminal sensor 453
domain with the fructose effector F-1-P in H. mediterranei. The activated GlpR (or 454
GlpR accompanied by unknown regulators) could then bind to the promoter region 455
through the N-terminal DNA binding motif to increase the transcriptional activity of 456
PPTS. This mode of action of GlpR was supported by the study of another DeoR-type 457
transcriptional regulator, SugR, in Corynebacterium glutamicum (15, 39-41). 458
Although the molecular details of the activation by GlpR require further investigation, 459
one hypothesis based on other transcription activation models in archaea (42-44) is 460
that the activated GlpR recruits general transcription factors (TFBs and TBPs) to bind 461
to the TATA box or BRE to enhance transcription. 462
on June 16, 2018 by guesthttp://aem
.asm.org/
Dow
nloaded from

22
According to a previous report, the possible binding sites of the GlpR as a 463
repressor are located at the BRE or downstream of the TATA box by in silico 464
searching for the inverted repeat sequence (13). However, this kind of binding site 465
that was reported for H. volcanii GlpR was not observed in the PTS promoter region 466
in H. mediterranei. Instead, an upstream sequence (including regions I, II and III) of 467
PPTS was indicated as the possible binding site of GlpR by the mutation scanning 468
experiment (Fig. 4B). This finding showed a positional similarity with the UAS 469
(upstream activator sequence, from -52 bp to -39 bp) of the bop gene in 470
Halobacterium NRC-1 (44-46). The conserved motifs (motif P and the 8-bp motif) in 471
promoter regions I, II and III of the PTS implied that the mechanism of PTS 472
regulation by GlpR is similar in haloarchaea (Fig. 5). 473
It is noteworthy that the shorter PTS transcript would be generated through the 474
post-transcriptional processing in H. mediterranei (Fig. 7). This type of expression 475
seemed to be different from its bacterial counterpart. Multiple TSSs were reported in 476
the PTS genes of E. coli, which resulted from multi-core promoters upstream of the 477
coding sequence of the PTS genes and were influenced by DNA supercoiling and the 478
transcription factor CRP (47), but the translation efficiency of different transcript 479
patterns was not very clear. Further analysis of the 5’ UTR sequences of T8G and T17G 480
indicated that the relatively more efficient translation of T8G was probably due to the 481
presence of the shorter 5’ UTR (Fig. 8A). This hypothesis that the length of 5’ UTR 482
affects the translation efficiency of mRNA has also been reported in other haloarchaea. 483
In Halobacterium salinarum, leaderless mRNAs showed a higher translation activity 484
on June 16, 2018 by guesthttp://aem
.asm.org/
Dow
nloaded from

23
than mRNAs with the SD-sequence (48). On the other hand, the predicted stem-loop 485
structure in T17 (Fig. 6A) might also inhibit the reorganization or binding of the 486
ribosome and hence repress the translation. It can be speculated that when induced by 487
fructose, the translation efficiency of the PTS mRNA could be enhanced by increasing 488
the ratio of T8 to T17 (Table 2). The relatively higher proportion of T17 in the 489
non-fructose conditions implied a constitutively low level of expression of the PTS. 490
The fructose-specific PTS of haloarchaea was regarded to be acquired from 491
bacteria by horizontal gene transfer (HGT) during evolution (12, 49). As a “gift from 492
the neighbors”, the haloarchaeal PTS was capable of also “borrowing” the regulatory 493
mechanism from bacteria at the transcriptional level. Furthermore, to acclimate to 494
nutrient fluctuations in a competitive extreme hyper-saline environment, the 495
haloarchaea evolved their own mechanisms to control the PTS at the 496
post-transcriptional and translational levels. Based on the results in this study and 497
previous reports, we propose a working model for the PTS regulation in haloarchaea 498
(Fig. 9). In this model, fructose is transported into the cell and phosphorylated to 499
F-1-P via PTS, and further catalyzed to F-1,6-2P by 1-PFK. GlpR (or a combination 500
of GlpR and other unknown regulators) up-regulates the transcription of this PTS 501
gene cluster after the induction by fructose via direct binding to the PPTS, most 502
probably at the three conserved regions. F-1-P may act as the intracellular inducer, 503
while F-1,6-2P as the negative effector, to be involved in this transcriptional 504
regulation of the PTS gene expression. A post-transcriptional processing of the PTS 505
transcripts at the 5’ UTR, which increases the translational efficiency, is also involved 506
on June 16, 2018 by guesthttp://aem
.asm.org/
Dow
nloaded from

24
in the PTS activation upon fructose induction (Fig. 9). 507
In conclusion, the activation at the both transcriptional and translational levels 508
would make the haloarchaeal PTS more efficient in response to environmental 509
fructose. Although the working model has explained the main mechanisms of the PTS 510
regulation in haloarchaea, further study is warranted to determine whether other 511
transcriptional regulators are involved in the regulation of PTS expression and to 512
elucidate the mechanism of post-transcriptional processing. Such studies would help 513
towards a comprehensive understanding of the PTS regulation in haloarchaea. 514
515
516
517
ACKNOWLEDGMENTS 518
We thank Prof. Julie A. Maupin-Furlow (University of Florida, USA) for providing us 519
with the plasmid pJAM1020. This work was supported by grants from the National 520
Natural Science Foundation of China (31330001, 30925001, and 31271334) and the 521
Chinese Academy of Sciences (KSCX2-EW-G-2-4). 522
523
524
REFERENCES 525
1. Postma PW, Lengeler JW, Jacobson GR. 1993. Phosphoenolpyruvate:carbohydrate 526
phosphotransferase systems of bacteria. Microbiol Rev 57:543-594. 527
2. Deutscher J, Francke C, Postma PW. 2006. How phosphotransferase system-related protein 528
phosphorylation regulates carbohydrate metabolism in bacteria. Microbiol Mol Biol Rev 529
70:939-1031. 530
3. Kotrba P, Inui M, Yukawa H. 2001. Bacterial phosphotransferase system (PTS) in 531
on June 16, 2018 by guesthttp://aem
.asm.org/
Dow
nloaded from

25
carbohydrate uptake and control of carbon metabolism. J Biosci Bioeng 92:502-517. 532
4. Barabote RD, Saier MH, Jr. 2005. Comparative genomic analyses of the bacterial 533
phosphotransferase system. Microbiol Mol Biol Rev 69:608-634. 534
5. Stock AM, Robinson VL, Goudreau PN. 2000. Two-component signal transduction. Annu 535
Rev Biochem 69:183-215. 536
6. Lengeler JW, Jahreis K. 2009. Bacterial PEP-dependent carbohydrate: phosphotransferase 537
systems couple sensing and global control mechanisms. Contrib Microbiol 16:65-87. 538
7. Saier MH, Jr., Ramseier TM. 1996. The catabolite repressor/activator (Cra) protein of 539
enteric bacteria. J Bacteriol 178:3411-3417. 540
8. Bolhuis H, Palm P, Wende A, Falb M, Rampp M, Rodriguez-Valera F, Pfeiffer F, 541
Oesterhelt D. 2006. The genome of the square archaeon Haloquadratum walsbyi : life at the 542
limits of water activity. BMC Genomics 7:169. 543
9. Hartman AL, Norais C, Badger JH, Delmas S, Haldenby S, Madupu R, Robinson J, 544
Khouri H, Ren QH, Lowe TM, Maupin-Furlow J, Pohlschroder M, Daniels C, Pfeiffer F, 545
Allers T, Eisen JA. 2010. The complete genome sequence of Haloferax volcanii DS2, a 546
model archaeon. PLoS ONE 5: e9605. 547
10. Comas I, González-Candelas F, Zúñiga M. 2008. Unraveling the evolutionary history of the 548
phosphoryl-transfer chain of the phosphoenolpyruvate:phosphotransferase system through 549
phylogenetic analyses and genome context. BMC Evol Biol 8:147. 550
11. Cai L, Zhao D, Hou J, Wu J, Cai S, Dassarma P, Xiang H. 2012. Cellular and organellar 551
membrane-associated proteins in haloarchaea: perspectives on the physiological significance 552
and biotechnological applications. Sci China Life Sci 55:404-414. 553
12. Pickl A, Johnsen U, Schönheit P. 2012. Fructose degradation in the Haloarchaeon Haloferax 554
volcanii involves a bacterial type phosphoenolpyruvate-dependent phosphotransferase system, 555
fructose-1-phosphate kinase, and class II fructose-1,6-bisphosphate aldolase. J Bacteriol 556
194:3088-3097. 557
13. Rawls KS, Yacovone SK, Maupin-Furlow JA. 2010. GlpR represses fructose and glucose 558
metabolic enzymes at the level of transcription in the haloarchaeon Haloferax volcanii. J 559
Bacteriol 192:6251-6260. 560
14. Barrière C, Veiga-da-Cunha M, Pons N, Guédon E, van Hijum SA, Kok J, Kuipers OP, 561
Ehrlich DS, Renault P. 2005. Fructose utilization in Lactococcus lactis as a model for 562
low-GC gram-positive bacteria: its regulator, signal, and DNA-binding site. J Bacteriol 563
187:3752-3761. 564
15. Teramoto H, Inui M, Yukawa H. 2011. Transcriptional regulators of multiple genes involved 565
in carbon metabolism in Corynebacterium glutamicum. J Biotechnol 154:114-125. 566
16. Han J, Zhang F, Hou J, Liu X, Li M, Liu H, Cai L, Zhang B, Chen Y, Zhou J, Hu S, 567
Xiang H. 2012. Complete genome sequence of the metabolically versatile halophilic archaeon 568
Haloferax mediterranei, a poly(3-hydroxybutyrate-co-3-hydroxyvalerate) producer. J 569
Bacteriol 194:4463-4464. 570
17. Lillo JG, Rodriguezvalera F. 1990. Effects of culture conditions on Poly(β-Hydroxybutyric 571
Acid) production by Haloferax Mediterranei. Appl Environ Microbiol 56:2517-2521. 572
18. Koller M, Hesse P, Bona R, Kutschera C, Atlić A, Braunegg G. 2007. Potential of various 573
archae- and eubacterial strains as industrial polyhydroxyalkanoate producers from whey. 574
Macromol Biosci 7:218-226. 575
on June 16, 2018 by guesthttp://aem
.asm.org/
Dow
nloaded from
26
19. Lu QH, Han J, Zhou LG, Zhou J, Xiang H. 2008. Genetic and biochemical characterization 576
of the poly(3-hydroxybutyrate-co-3-hydroxyvalerate) synthase in Haloferax mediterranei. J 577
Bacteriol 190:4173-4180. 578
20. Sambrook J, Russell DW. 2001. Molecular cloning: a laboratory manual, 3rd edition. Cold 579
Spring Harbor Laboratory Press, Cold Spring Harbor, N.Y. 580
21. Liu H, Han J, Liu X, Zhou J, Xiang H. 2011. Development of pyrF-based gene knockout 581
systems for genome-wide manipulation of the archaea Haloferax mediterranei and Haloarcula 582
hispanica. J Genet Genomics 38:261-269. 583
22. Cai S, Cai L, Liu H, Liu X, Han J, Zhou J, Xiang H. 2012. Identification of the 584
haloarchaeal phasin (PhaP) that functions in polyhydroxyalkanoate accumulation and granule 585
formation in Haloferax mediterranei. Appl Environ Microbiol 78:1946-1952. 586
23. Krebs MP, Mollaaghababa R, Khorana HG. 1993. Gene replacement in Halobacterium 587
halobium and expression of bacteriorhodopsin mutants. Proc. Natl. Acad. Sci. U. S. A. 588
90:1987-1991. 589
24. Cline SW, Lam WL, Charlebois RL, Schalkwyk LC, Doolittle WF. 1989. Transformation 590
methods for halophilic archaebacteria. Can J Microbiol 35:148-152. 591
25. Kuhn J, Binder S. 2002. RT-PCR analysis of 5' to 3'-end-ligated mRNAs identifies the 592
extremities of cox2 transcripts in pea mitochondria. Nucleic Acids Res 30:439-446. 593
26. Brenneis M, Hering O, Lange C, Soppa J. 2007. Experimental characterization of cis-acting 594
elements important for translation and transcription in halophilic archaea. PLoS Genet 3: 595
e229. 596
27. Reuter CJ, Maupin-Furlow JA. 2004. Analysis of proteasome-dependent proteolysis in 597
Haloferax volcanii cells, using short-lived green fluorescent proteins. Appl Environ Microbiol 598
70:7530-7538. 599
28. Koide T, Reiss DJ, Bare JC, Pang WL, Facciotti MT, Schmid AK, Pan M, Marzolf B, 600
Van PT, Lo FY, Pratap A, Deutsch EW, Peterson A, Martin D, Baliga NS. 2009. 601
Prevalence of transcription promoters within archaeal operons and coding sequences. Mol 602
Syst Biol 5:285. 603
29. Miao D, Sun C, Xiang H. 2009. Construction and application of a novel shuttle expression 604
vector based on haloarchaeal plasmid pSCM201. Wei Sheng Wu Xue Bao 49:1040-1047. 605
30. Wilbanks EG, Larsen DJ, Neches RY, Yao AI, Wu CY, Kjolby RA, Facciotti MT. 2012. A 606
workflow for genome-wide mapping of archaeal transcription factors with ChIP-seq. Nucleic 607
Acids Res 40: e74. 608
31. Facciotti MT, Reiss DJ, Pan M, Kaur A, Vuthoori M, Bonneau R, Shannon P, Srivastava 609
A, Donohoe SM, Hood LE, Baliga NS. 2007. General transcription factor specified global 610
gene regulation in archaea. Proc. Natl. Acad. Sci. U. S. A. 104:4630-4635. 611
32. Cao FL, Liu HH, Wang YH, Liu Y, Zhang XY, Zhao JQ, Sun YM, Zhou J, Zhang L. 612
2010. An optimized RNA amplification method for prokaryotic expression profiling analysis. 613
Appl Microbiol Biotechnol 87:343-352. 614
33. Tusher VG, Tibshirani R, Chu G. 2001. Significance analysis of microarrays applied to the 615
ionizing radiation response. Proc. Natl. Acad. Sci. U. S. A. 98:5116-5121. 616
34. Ding Y, Lawrence CE. 2003. A statistical sampling algorithm for RNA secondary structure 617
prediction. Nucleic Acids Res 31:7280-7301. 618
35. Ding Y, Chan CY, Lawrence CE. 2005. RNA secondary structure prediction by centroids in 619
on June 16, 2018 by guesthttp://aem
.asm.org/
Dow
nloaded from

27
a Boltzmann weighted ensemble. RNA 11:1157-1166. 620
36. Lu Q, Han J, Zhou L, Coker JA, DasSarma P, DasSarma S, Xiang H. 2008. Dissection of 621
the regulatory mechanism of a heat-shock responsive promoter in Haloarchaea: a new 622
paradigm for general transcription factor directed archaeal gene regulation. Nucleic Acids Res 623
36:3031-3042. 624
37. Chavarria M, Fuhrer T, Sauer U, Pfluger-Grau K, de Lorenzo V. 2012. Cra regulates the 625
cross-talk between the two branches of the phosphoenolpyruvate : phosphotransferase system 626
of Pseudomonas putida. Environ Microbiol 15: 121–132. 627
38. Pérez-Rueda E, Collado-Vides J. 2000. The repertoire of DNA-binding transcriptional 628
regulators in Escherichia coli K-12. Nucleic Acids Res 28:1838-1847. 629
39. Gaigalat L, Schlüter JP, Hartmann M, Mormann S, Tauch A, Puhler A, Kalinöwski J. 630
2007. The DeoR-type transcriptional regulator SugR acts as a repressor for genes encoding the 631
phosphoenolpyruvate:sugar phosphotransferase system (PTS) in Corynebacterium glutamicum. 632
BMC Mol Biol 8:104. 633
40. Engels V, Wendisch VF. 2007. The DeoR-type regulator SugR represses expression of ptsG 634
in Corynebacterium glutamicum. J Bacteriol 189:2955-2966. 635
41. Tanaka Y, Okai N, Teramoto H, Inui M, Yukawa H. 2008. Regulation of the expression of 636
phosphoenolpyruvate: carbohydrate phosphotransferase system (PTS) genes in 637
Corynebacterium glutamicum R. Microbiology 154:264-274. 638
42. Peng N, Xia Q, Chen Z, Liang YX, She Q. 2009. An upstream activation element exerting 639
differential transcriptional activation on an archaeal promoter. Mol Microbiol 74:928-939. 640
43. Peng N, Ao XA, Liang YX, She QX. 2011. Archaeal promoter architecture and mechanism of 641
gene activation. Biochem Soc T 39:99-103. 642
44. Baliga NS, Kennedy SP, Ng WV, Hood L, DasSarma S. 2001. Genomic and genetic 643
dissection of an archaeal regulon. Proc. Natl. Acad. Sci. U. S. A. 98:2521-2525. 644
45. Gropp F, Gropp R, Betlach MC. 1995. Effects of upstream deletions on light- and 645
oxygen-regulated bacterio-opsin gene expression in Halobacterium halobium. Mol Microbiol 646
16:357-364. 647
46. Yang CF, Kim JM, Molinari E, DasSarma S. 1996. Genetic and topological analyses of the 648
bop promoter of Halobacterium halobium: stimulation by DNA supercoiling and non-B-DNA 649
structure. J Bacteriol 178:840-845. 650
47. Ryu S, Garges S. 1994. Promoter switch in the Escherichia coli pts operon. J Biol Chem 651
269:4767-4772. 652
48. Sartorius-Neef S, Pfeifer F. 2004. In vivo studies on putative Shine-Dalgarno sequences of 653
the halophilic archaeon Halobacterium salinarum. Mol Microbiol 51:579-588. 654
49. Anderson I, Rodriguez J, Susanti D, Porat I, Reich C, Ulrich LE, Elkins JG, Mavromatis 655
K, Lykidis A, Kim E, Thompson LS, Nolan M, Land M, Copeland A, Lapidus A, Lucas S, 656
Detter C, Zhulin IB, Olsen GJ, Whitman W, Mukhopadhyay B, Bristow J, Kyrpides N. 657
2008. Genome sequence of Thermofilum pendens reveals an exceptional loss of biosynthetic 658
pathways without genome reduction. J Bacteriol 190:2957-2965. 659
660
661
662
on June 16, 2018 by guesthttp://aem
.asm.org/
Dow
nloaded from

28
Tables 663
664
TABLE 1 A comparative analysis of the transcriptional levels between H. mediterranei DF50 665
and ΔglpR groups of the most relevant genes (HFX_1558 to HFX_1565) during the fructose 666
induction using a microarray assay (GEO accession numbers: GSE41134) 667
668
Gene ID Annotation
DF50 ΔglpR
Fold
Change
q-value
(%)
Fold
Change
q-value
(%)
HFX_1558 Fructose-1,6-bisphosphate aldolase 0.82±0.14 4.23 0.86±0.11 10.58
HFX_1559 PTS IIB component 29.74±7.31 0 0.92±0.02 12.77
HFX_1560 PTS enzyme I 34.97±14.17 0 0.88±0.03 7.85
HFX_1561 PTS protein HPr 31.3±12.77 0 0.85±0.17 13.33
HFX_1562 PTS IIA component 40.37±16.45 0 0.94±0 20.2
HFX_1563 PTS IIC component 31.97±4.33 0 1.11±0.08 17.89
HFX_1564 1-phosphofructokinase 17.33±5.74 0 0.91±0.12 21.9
HFX_1565 GlpR family regulator 21.07±2.42 0 - -
669
670
671
TABLE 2 The statistical results of shorter and longer PTS transcripts in DF50 and 672
ΔglpR strains with (+) or without (-) fructose induction. 673
674
Transcript
DF50 ΔglpR
- + - +
8-nt counts 5 8 2 2
17-nt counts 36 26 14 20
Ratio
(8-nt: 17-nt) 14% 31% 14% 10%
675
on June 16, 2018 by guesthttp://aem
.asm.org/
Dow
nloaded from

29
676
677
TABLE 3 Expression of the smRSGFP-fusion reporter gene in H. mediterranei 678
strains with or without fructose induction*. 679
Expt. no. Relevant host
genotype
Relevant
plasmid
Fluorescence intensity Fold
change Non-
induced
Fructose
induced
1 DF50 pL117
896±158 5052±753 5.64
2 fruK- 22108±570 19652±612 0.89
* At least three independent experiments were carried out, and each experiment consisted of three replicates. 680
681
682
683
684
on June 16, 2018 by guesthttp://aem
.asm.org/
Dow
nloaded from

30
Figures 685
FIG 1. Map of the PTS gene cluster, the promoter sequence and the analysis of PTS 686
transcripts. (A) Genetic organization of the H. mediterranei PTS gene cluster and 687
neighboring genes. glpR (HFX_1565) encodes a protein homologous to a DeoR 688
family transcriptional regulator, and fruK (HFX_1564) encodes the 689
1-phosphofructokinase; ptsC, ptsA, hpr, ptsI, and ptsB (HFX_1563-1559) encode a 690
complete PTS; and fba (HFX_1558) is a fructose-1,6-bisphosphate aldolase. The 691
primers used for CR-RT-PCR are indicated with arrows. (B) The promoter sequence 692
of the PTS gene cluster is shown. The stop codon TAA of the upstream gene fruK and 693
the start codon ATG of ptsC are boxed. The start site (indicated by an arrow) of the 694
two transcripts containing different length 5’ UTRs was determined by CR-RT-PCR. 695
The putative TATA box and BRE are indicated by single and double underlines, 696
respectively. (C) The statistical results of mRNA deep sequencing. The counts (Y-axis) 697
of corresponding nucleotides (X-axis) of 24-bp sequence of the PPTS are presented. 698
The positions with the most significant increases in sequencing counts are marked by 699
arrows, which indicate the two start sites of PTS transcripts. 700
701
FIG 2. The GFP expression profiles of the DF50 and ΔglpR strains harboring 702
smRSGFP-based reporter plasmids with or without fructose induction. The plasmids 703
pL117, pPR and pPF were constructed to express smRSGFP with the promoter PPTS, 704
PglpR and Pfba, respectively. Another construct, pL117CR was transformed into the 705
ΔglpR strain to expresses GlpR (using its native promoter, PglpR) and smRSGFP (using 706
on June 16, 2018 by guesthttp://aem
.asm.org/
Dow
nloaded from

31
PPTS). The fluorescence intensity was detected as described. Fructose was added into 707
the cell cultures to a final concentration of 50 mM (Fru+). TBSL buffer was used as a 708
negative control (Fru-). At least three independent experiments were carried out, and 709
each experiment consisted of three replicates. 710
711
FIG 3. ChIP-qPCR data suggest that GlpR binds to DNA directly. The relative 712
enrichment ratio of a 119-bp region of the PPTS (FPTS) immunoprecipitated (IP) by 713
GlpR-Myc compared to randomly sheared chromosomal DNA (input samples) using a 714
145-bp region in 16S rRNA (F16S) as an internal control to normalize the data. 715
Enrichments are also compared for a 125-bp coding region (Fiic) of the ptsC gene, and 716
a 189-bp promoter region (FphaE) of phaE, that was not regulated by the fructose 717
induction in the microarray data. Cell samples for the ChIP assay were harvested 718
under growth conditions with (Fru) or without (CK) fructose induction. 719
720
FIG 4. Deletion analysis and site-directed mutagenesis of the PPTS region. (A) 721
Schematic representations (not to scale) of constructs pL117, pL93, pL77, pL56 and 722
pL24 are shown. The 117-bp PPTS and truncated 5’ flanking sequence promoter 723
mutants (solid lines, -93-+17 bp to -24-+17 bp) were fused with the smRSgfp reporter 724
gene (gray arrow). (B) Site-directed mutagenesis from -79 to +16 bp of the PPTS. The 725
DNA sequence of wild-type PPTS is shown at the top (pL117). The two transcripts of 726
the reporter gene with 5’ UTR start respectively from +1 and +10, which are the same 727
as what were observed in the PTS transcripts, were identified by CR-RT-PCR. The 728
mutated nucleotides of different mutants (M7975 to M+1216) are shown below the 729
on June 16, 2018 by guesthttp://aem
.asm.org/
Dow
nloaded from

32
wild-type promoter sequence. The basal (non-induced) and fructose-induced 730
transcriptional activities of these promoters revealed by fluorescence intensity were 731
detected using a microplate reader. The basal transcriptional activities are expressed 732
as a percentage of the pL117 activity (set to 100%), and the fructose-induced fold 733
changes are calculated using the fluorescence intensity. Mutants that cannot respond 734
to fructose are indicated with an asterisk, and the mutants with a fluorescence 735
intensity that was hardly detectable are marked by a dash. The significant fold change 736
in strains M+38 and M+1216, marked with a rhombus, were caused by the large 737
decreases in the basal fluorescence intensity. At least three independent experiments 738
were carried out, and each experiment consisted of three replicates. 739
740
FIG 5. Multiple alignments of promoter sequences of the PPTS in the haloarchaea 741
which contain at least one complete PTS. Bases marked with asterisks are the 742
sequences of region I, II and III. A palindromic DNA sequence (underlined, motif P) 743
and an 8-bp sequence (boxed) are indicated. These sequences were found to be 744
conserved via the alignment of the PPTS in all promoter regions of haloarchaeal PTS. 745
746
FIG 6. The mutagenesis analysis of the 5’ UTR of PTS transcripts. (A) The in 747
silico-predicted secondary structure of the 17-nt 5’ UTR of mRNA, ΔG°37 = -2.50. 748
The designed mutation regions are marked with lines. (B) The electrophoretic analysis 749
of the primer extension products of gfp in strains M+911, M+38 and M1+2 after the 750
induction by fructose. DF50 cells harboring pGFP-0 was used as a negative control 751
(NC), and DF50 cells harboring pL117 was used as a positive control (PC). The 59-nt 752
on June 16, 2018 by guesthttp://aem
.asm.org/
Dow
nloaded from

33
and 41-nt oligonucleotides were used as molecular markers. The non-specific 753
products appearing in the NC are indicated with (a) and (b), and the two primer 754
extension products, which corresponding to the transcript with 17-nt (T17G) or 8-nt5’ 755
UTR (T8G), are indicated with arrows. 756
757
FIG 7. Primer extension assay for identifying the different transcripts generated by 758
Phsp5-directed or PPTS-directed reporter genes. (A) The different sequences of four 759
constructs (pT8, pT17, pHSP and pUTR-M) are shown. The TSS (G) of Phsp5 or the 760
TSS (A) of PPTS in four constructs is marked with asterisks, and the different length 5’ 761
UTR of each construct is underlined. The sequence of the extension primer is boxed, 762
and the expected size of the extension products is indicated in parentheses. The 763
difference between pT8, pT17, and pHSP is the downstream sequence of the TSS (G), 764
which is the 8-nt (pT8) or 17-nt (pT17) 5’ UTR sequences of PTS, or the 5’ UTR 765
sequences of the wild-type hsp5 (pHSP), respectively. The only difference between 766
pHSP and pUTR-M is that the Phsp5 promoter is replaced by the PPTS in pUTR-M. (B) 767
The primer extension products of pT8, pT17, pHSP (T56), and pUTR-M were 768
analyzed by electrophoresis. The primer extension products with same size are 769
indicated with arrows (T56, T17G or T8G). 770
771
FIG 8. Functional characterization of the in vivo generation of the shorter 5’ UTR in 772
H. mediterranei using a reporter gene. (A) The relative level of transcription activity 773
and the translation efficiency of gfp transcripts in DF50 strains harboring pT8 or pT17 774
on June 16, 2018 by guesthttp://aem
.asm.org/
Dow
nloaded from

34
were determined via qRT-PCR and a fluorescence reporter assay. The levels of gfp 775
transcription and the fluorescence intensity in strain DF50 harboring pT17 were both 776
assigned a value of 1. At least three independent experiments were carried out, and 777
each experiment consisted of three replicates. The statistical significance of the 778
difference between the DF50 strains harboring pT8 or pT17 was analyzed using the 779
Student’s t test. (B) The electrophoretic analysis of the primer extension products of 780
gfp in DF50(pL117) and ΔglpR(pL117) strains with (+) or without (-) fructose 781
induction. Major transcripts are indicated on the left of the panel as described in Fig. 782
6. 783
784
FIG 9. A working model of the regulation of PTS expression and fructose utilization in 785
H. mediterranei. CM, cytoplasmic membrane; 1-PFK, 1-phosphofructokinase; F-1-P, 786
fructose-1-phosphate; F-1,6-2P, fructose-1,6-bisphosphate; TIC, transcriptional 787
initiation complex. 788
on June 16, 2018 by guesthttp://aem
.asm.org/
Dow
nloaded from