advisor’s alpha · framework, an advisor’s alpha (that is, added value) is more aptly...
TRANSCRIPT
Connect with Vanguard > vanguard.com
Executive summary. How do sophisticated advisors construct portfolios? Typically, they use some form of asset allocation process to determine the most suitable portfolio for their clients’ particular goals. Some focus on traditional investments; others split traditional asset classes into sub-asset classes; still others add alternative investments. Regardless of the mix, these processes share a common objective—to obtain the highest return for a given level of expected risk. Index funds are often employed in allocations, but probably more often an advisor selects actively managed investments in an attempt to enhance performance, thereby validating the advisor’s fees.
Outperforming the broad market has historically been very difficult, both in absolute terms and in tax- and risk-adjusted frameworks. Where adding value is the goal, advisors may be better served by changing their performance benchmark from the market’s return to the returns that investors might achieve on their own, without professional guidance. A financial advisor has a greater probability of adding value, or alpha, through relationship-oriented services, such as providing cogent wealth management and financial planning strategies, discipline, and guidance, rather than by trying to outperform the market.
Vanguard research April 2013
Advisor’s alpha
Authors
Donald G. Bennyhoff, CFA
Francis M. Kinniry Jr., CFA
2
1 For more information, see Philips (2012).
Investment performance can be deconstructed into three parts: the portions of return attributable to the market (that is, beta), to market-timing, and to security selection. The latter two are specific to active management. By definition, if a portfolio is to perform differently from a market benchmark (before expenses), the portfolio must look differ-ent from that benchmark. Historically, many investment advisors have sought to add value through the two active portions of return—market-timing and security selection—despite the mounting data suggesting that these efforts will help neither their clients nor themselves in the long run. Over longer time horizons, active management often fails to outperform market benchmarks.1
In the past, the passive portion of investment performance—the beta return—was viewed by many as leading only to “average” returns and requiring no investment skill. Today, ironically, the capturing of beta has become a cornerstone for leading financial advisors, who routinely incorporate index funds or exchange-traded funds (ETFs) into their recommend-ed portfolios. This transition has been facilitated by at least two factors. First, the “democratization of indexing” via ETFs brought a plethora of index-oriented investment opportunities to anyone with a brokerage account. Second, a move toward fee-based, holistic investment guidance took hold among many advisors. In our view, it is these disciplined advisors who are best positioned to add value to their client relationships.
Over the last 15 years, compensation in the investment industry has shifted markedly from commission-based, transaction-oriented sales toward fee-based asset management. According to research by Cogent (2012), 56% of advisors’ aggregate compensation in 2012 came from asset-based fees, and by 2014 that figure is expected to increase to 64%. The benefits of this shift for clients and advisors alike suggest that the trend is likely to continue. From the client’s perspective, asset-based fees largely remove concern about potential conflicts of interest in the advisor’s recommendations, and in some cases they obligate the advisor to act as a fiduciary. From the advisor’s perspective, asset-based compensation can promote stronger client relationships and more reliable income streams. The advisor can spend more time with clients, knowing that compensation does not depend on whether or not a transaction occurs.
This transition, however, has not been devoid of obstacles.
What is ‘advisor’s alpha’?
For some clients, paying fees regardless of whether transactions occur may seem like “money for nothing.” This is viewing the advisor’s value proposition through only one portion of the cost-benefit lens. The benefit and wisdom of not allowing near-term market actions to result in the abandon-ment of a well-thought-out investment strategy can be underappreciated in the moment.
Notes on risk: All investments are subject to risk, including possible loss of principal. Investments in bonds are subject to interest rate, credit, and inflation risk. Prices of mid- and small-cap stocks often fluctuate more than those of large-company stocks. Investments in stocks issued by non-U.S. companies are subject to risks including country/regional risk and currency risk. These risks are especially high in emerging markets. Although income from a municipal bond fund is exempt from federal tax, you may owe taxes on any capital gains realized through the fund’s trading or through your own redemption of shares. For some investors, a portion of the fund’s income may be subject to state and local taxes, as well as to the federal alternative minimum tax. Consider consulting a tax advisor regarding your individual situation.
The analysis conclusions shown are based on aggregate data. Individual funds or advisors may have performance better or worse than the averages presented.
2 See Cerulli Quantitative Update: Advisor Metrics 2012 (p. 173).
3
The confusion can grow if the advisor has based his or her value proposition on an ability to deliver better returns for the client, as many do. But better returns relative to what? For many advisors and clients, the answer would be “better than the market,” but a more pragmatic answer for both parties might be “better than investors would most likely do if they didn’t work with a professional advisor.” In this framework, an advisor’s alpha (that is, added value) is more aptly demonstrated by the ability to effectively act as a wealth manager, financial planner, and behavioral coach—providing discipline and reason to clients who are often undisciplined and emotional—than by efforts to beat the market.
Outperforming the market is difficult
The movement away from transaction-based compensation does not necessarily suggest that advisors are becoming more oriented toward passive management. In a Cerulli report from 2012, advisors allocated approximately 70% of clients’ assets to actively managed products, and more than 43% of advisors surveyed believed that top active managers could consistently outperform indexes.2
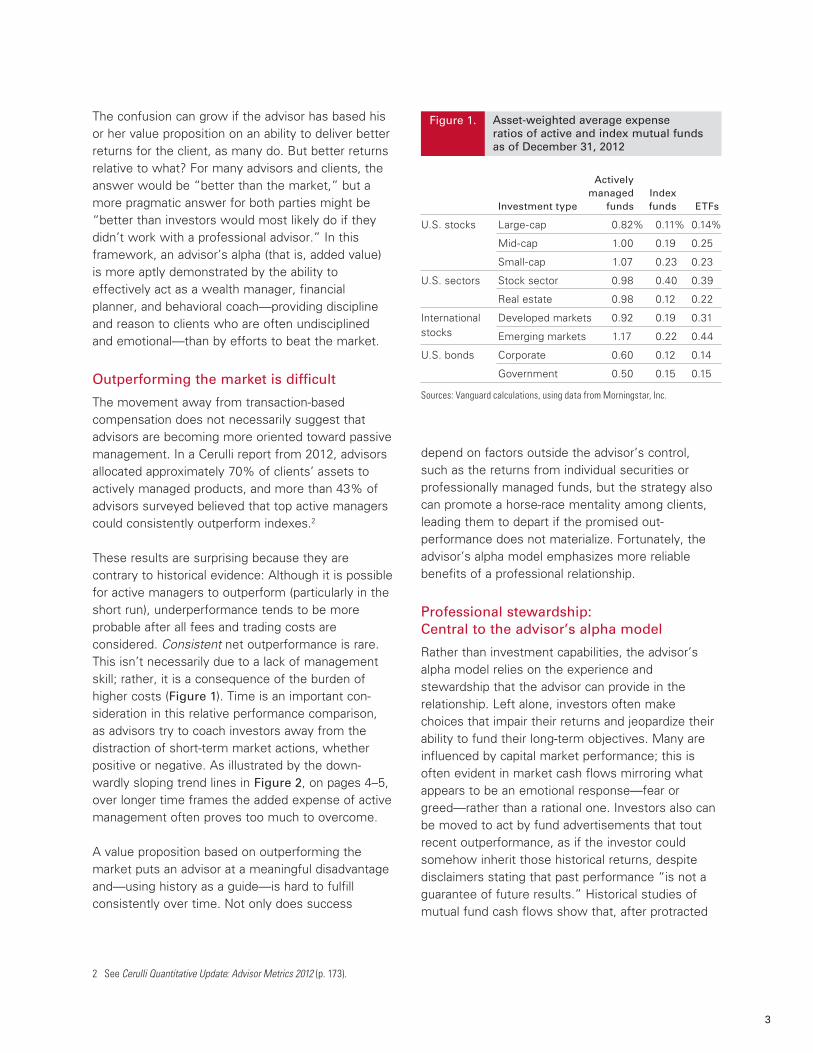
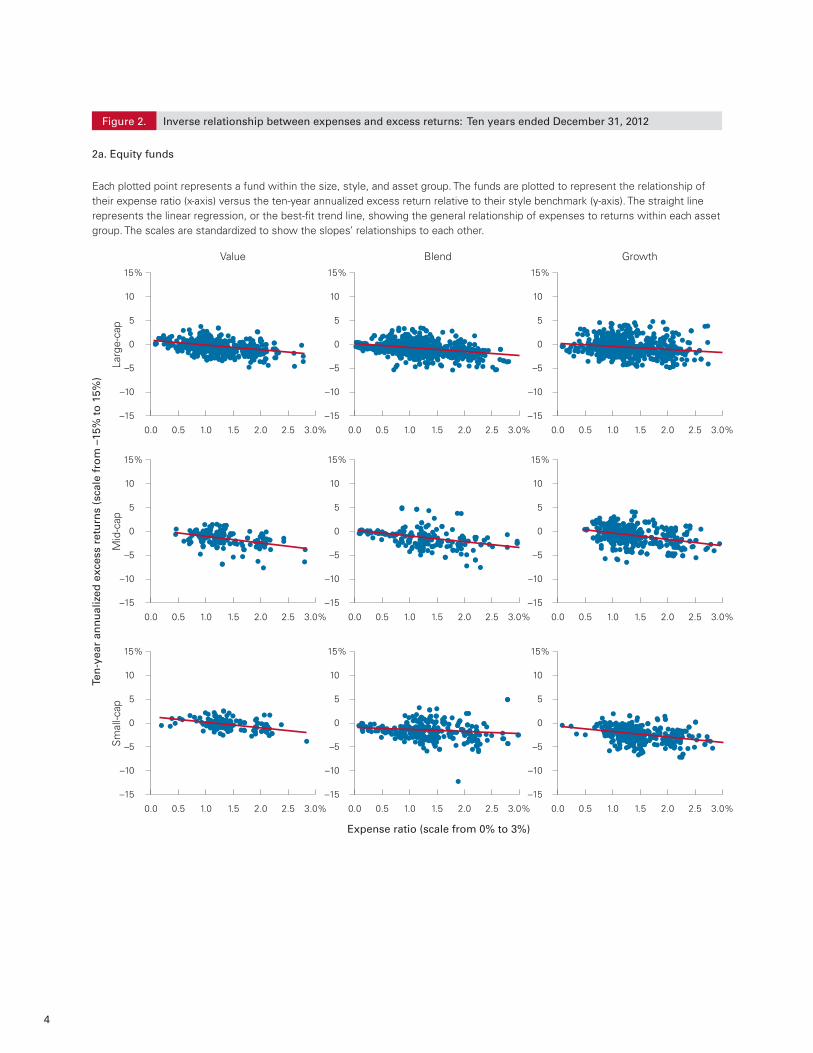
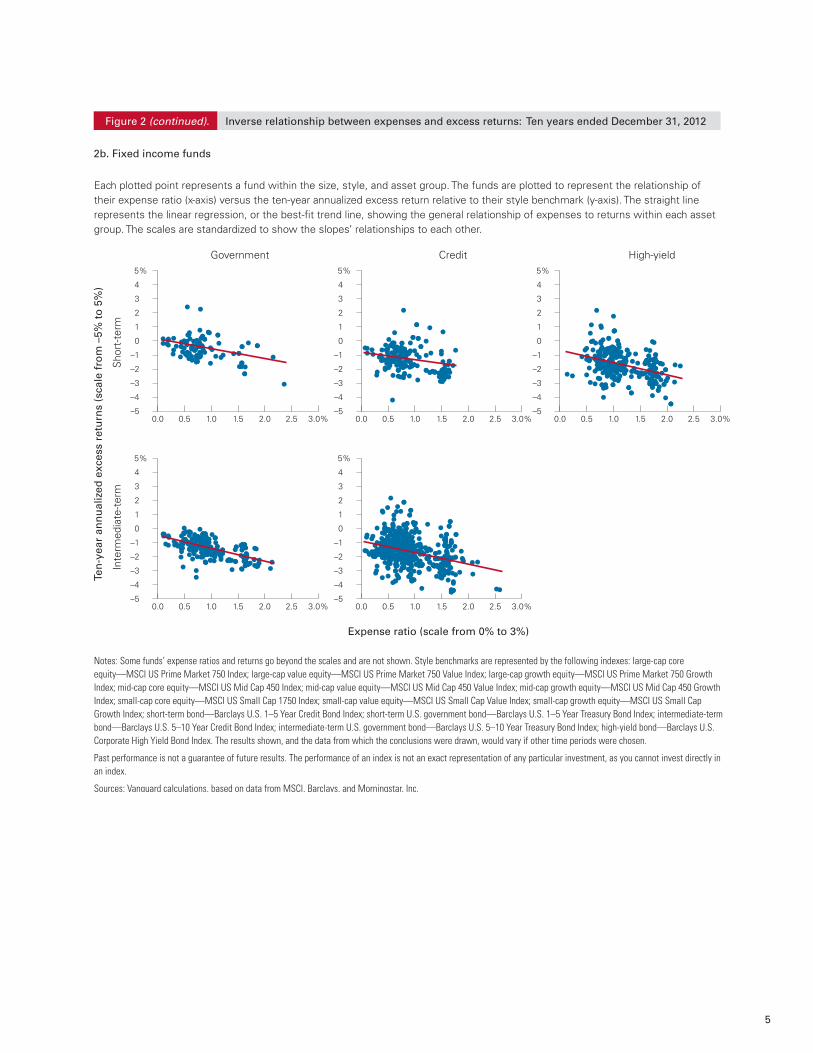
These results are surprising because they are contrary to historical evidence: Although it is possible for active managers to outperform (particularly in the short run), underperformance tends to be more probable after all fees and trading costs are considered. Consistent net outperformance is rare. This isn’t necessarily due to a lack of management skill; rather, it is a consequence of the burden of higher costs (Figure 1). Time is an important con-sideration in this relative performance comparison, as advisors try to coach investors away from the distraction of short-term market actions, whether positive or negative. As illustrated by the down-wardly sloping trend lines in Figure 2, on pages 4–5, over longer time frames the added expense of active management often proves too much to overcome.
A value proposition based on outperforming the market puts an advisor at a meaningful disadvantage and—using history as a guide—is hard to fulfill consistently over time. Not only does success
depend on factors outside the advisor’s control, such as the returns from individual securities or professionally managed funds, but the strategy also can promote a horse-race mentality among clients, leading them to depart if the promised out-performance does not materialize. Fortunately, the advisor’s alpha model emphasizes more reliable benefits of a professional relationship.
Professional stewardship: Central to the advisor’s alpha model
Rather than investment capabilities, the advisor’s alpha model relies on the experience and stewardship that the advisor can provide in the relationship. Left alone, investors often make choices that impair their returns and jeopardize their ability to fund their long-term objectives. Many are influenced by capital market performance; this is often evident in market cash flows mirroring what appears to be an emotional response—fear or greed—rather than a rational one. Investors also can be moved to act by fund advertisements that tout recent outperformance, as if the investor could somehow inherit those historical returns, despite disclaimers stating that past performance “is not a guarantee of future results.” Historical studies of mutual fund cash flows show that, after protracted
Asset-weighted average expense ratios of active and index mutual funds as of December 31, 2012
Figure 1.
Actively managed Index Investment type funds funds ETFs
U.S. stocks Large-cap 0.82% 0.11% 0.14%
Mid-cap 1.00 0.19 0.25
Small-cap 1.07 0.23 0.23
U.S. sectors Stock sector 0.98 0.40 0.39
Real estate 0.98 0.12 0.22
International Developed markets 0.92 0.19 0.31stocks Emerging markets 1.17 0.22 0.44
U.S. bonds Corporate 0.60 0.12 0.14
Government 0.50 0.15 0.15
Sources: Vanguard calculations, using data from Morningstar, Inc.
4
Inverse relationship between expenses and excess returns: Ten years ended December 31, 2012
2a. Equity funds
Figure 2.
0.0 0.5 1.0 1.5 2.0 2.5 3.0%
–15
–10
–5
0
5
10
15%
0.0 0.5 1.0 1.5 2.0 2.5 3.0%
–15
–10
–5
0
5
10
15%
0.0 0.5 1.0 1.5 2.0 2.5 3.0%
–15
–10
–5
0
5
10
15%
0.0 0.5 1.0 1.5 2.0 2.5 3.0%
–15
–10
–5
0
5
10
15%
0.0 0.5 1.0 1.5 2.0 2.5 3.0%
–15
–10
–5
0
5
10
15%
0.0 0.5 1.0 1.5 2.0 2.5 3.0%
–15
–10
–5
0
5
10
15%
0.0 0.5 1.0 1.5 2.0 2.5 3.0%
–15
–10
–5
0
5
10
15%
0.0 0.5 1.0 1.5 2.0 2.5 3.0%
–15
–10
–5
0
5
10
15%
0.0 0.5 1.0 1.5 2.0 2.5 3.0%
–15
–10
–5
0
5
10
15%
Larg
e-ca
p
Value Blend Growth
Mid
-cap
Ten
-yea
r an
nu
aliz
ed e
xces
s re
turn
s (s
cale
fro
m –
15%
to
15%
)
Expense ratio (scale from 0% to 3%)
Sm
all-c
ap
Each plotted point represents a fund within the size, style, and asset group. The funds are plotted to represent the relationship of their expense ratio (x-axis) versus the ten-year annualized excess return relative to their style benchmark (y-axis). The straight line represents the linear regression, or the best-�t trend line, showing the general relationship of expenses to returns within each asset group. The scales are standardized to show the slopes’ relationships to each other.
5
Inverse relationship between expenses and excess returns: Ten years ended December 31, 2012
2b. Fixed income funds
Figure 2 (continued).S
hort
-ter
m
Government Credit High-yield
Inte
rmed
iate
-ter
m
Each plotted point represents a fund within the size, style, and asset group. The funds are plotted to represent the relationship of their expense ratio (x-axis) versus the ten-year annualized excess return relative to their style benchmark (y-axis). The straight line represents the linear regression, or the best-�t trend line, showing the general relationship of expenses to returns within each asset group. The scales are standardized to show the slopes’ relationships to each other.
0.0 0.5 1.0 1.5 2.0 2.5 3.0%–5
–4
–3
–2
–1
0
1
2
3
4
5%
0.0 0.5 1.0 1.5 2.0 2.5 3.0%–5
–4
–3
–2
–1
0
1
2
3
4
5%
0.0 0.5 1.0 1.5 2.0 2.5 3.0%–5
–4
–3
–2
–1
0
1
2
3
4
5%
0.0 0.5 1.0 1.5 2.0 2.5 3.0%–5
–4
–3
–2
–1
0
1
2
3
4
5%
0.0 0.5 1.0 1.5 2.0 2.5 3.0%–5
–4
–3
–2
–1
0
1
2
3
4
5%
Notes: Some funds’ expense ratios and returns go beyond the scales and are not shown. Style benchmarks are represented by the following indexes: large-cap core equity—MSCI US Prime Market 750 Index; large-cap value equity—MSCI US Prime Market 750 Value Index; large-cap growth equity—MSCI US Prime Market 750 Growth Index; mid-cap core equity—MSCI US Mid Cap 450 Index; mid-cap value equity—MSCI US Mid Cap 450 Value Index; mid-cap growth equity—MSCI US Mid Cap 450 Growth Index; small-cap core equity—MSCI US Small Cap 1750 Index; small-cap value equity—MSCI US Small Cap Value Index; small-cap growth equity—MSCI US Small Cap Growth Index; short-term bond—Barclays U.S. 1–5 Year Credit Bond Index; short-term U.S. government bond—Barclays U.S. 1–5 Year Treasury Bond Index; intermediate-term bond—Barclays U.S. 5–10 Year Credit Bond Index; intermediate-term U.S. government bond—Barclays U.S. 5–10 Year Treasury Bond Index; high-yield bond—Barclays U.S. Corporate High Yield Bond Index. The results shown, and the data from which the conclusions were drawn, would vary if other time periods were chosen.
Past performance is not a guarantee of future results. The performance of an index is not an exact representation of any particular investment, as you cannot invest directly in an index.
Sources: Vanguard calculations, based on data from MSCI, Barclays, and Morningstar, Inc.
Ten
-yea
r an
nu
aliz
ed e
xces
s re
turn
s (s
cale
fro
m –
5% t
o 5
%)
Expense ratio (scale from 0% to 3%)
6
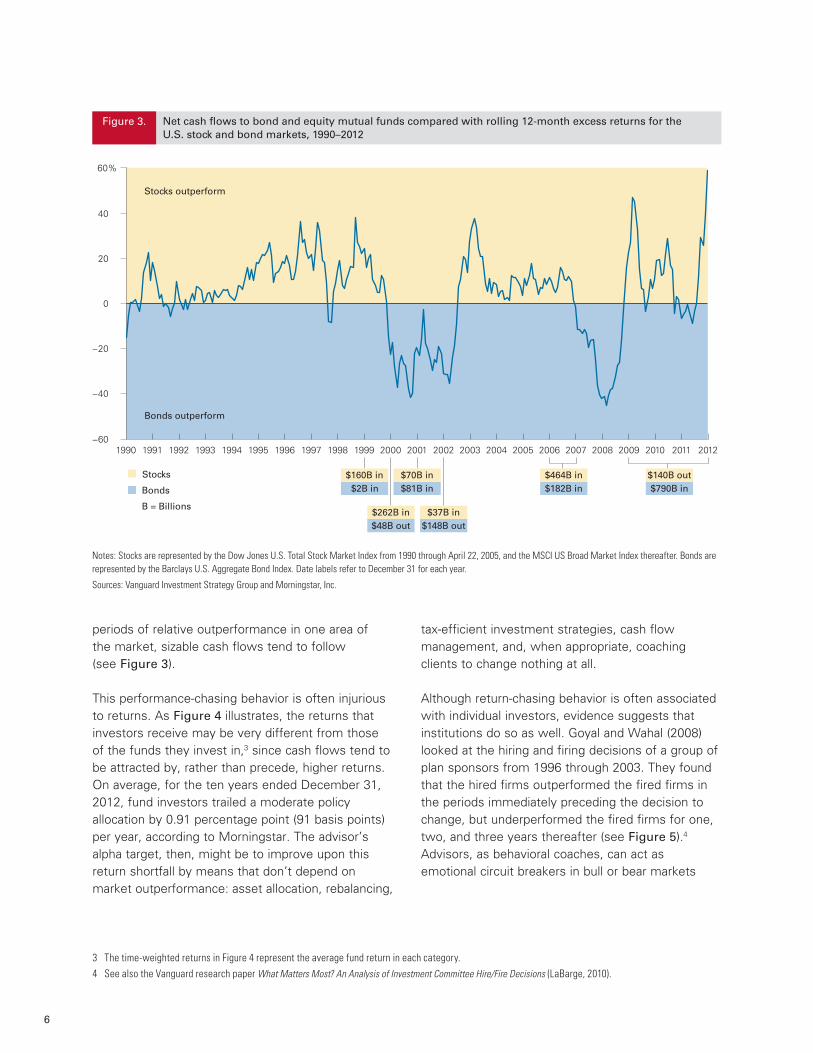
periods of relative outperformance in one area of the market, sizable cash flows tend to follow (see Figure 3).
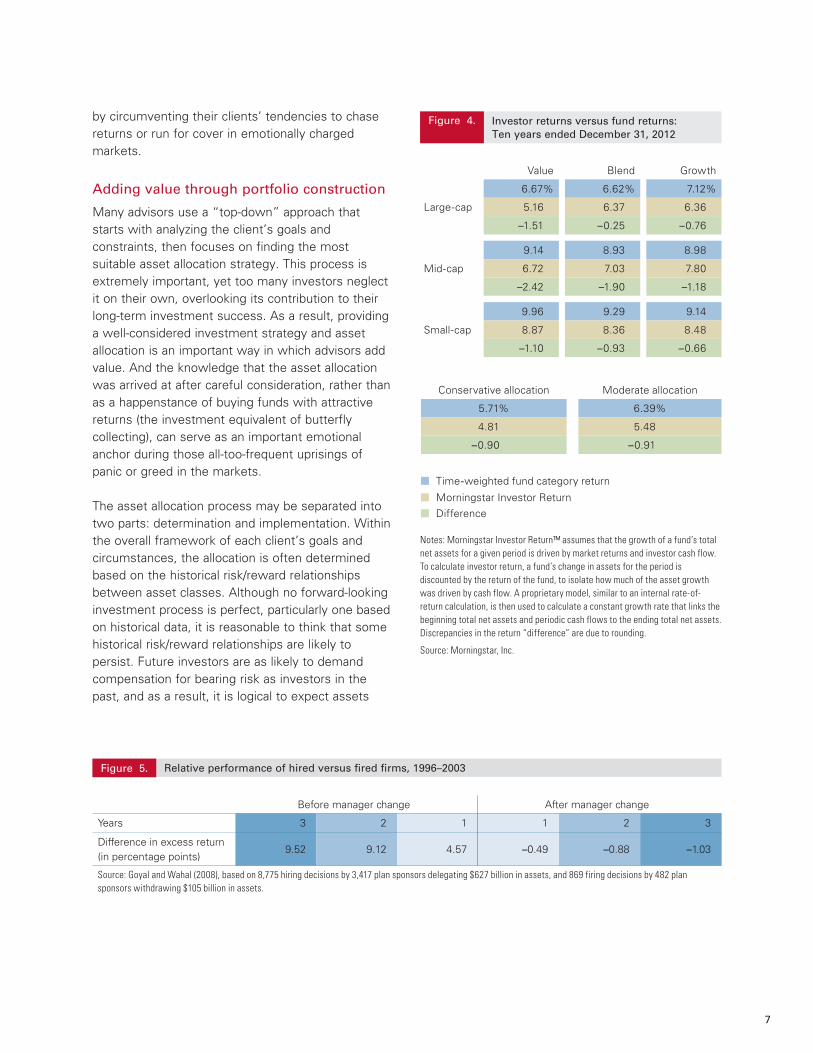
This performance-chasing behavior is often injurious to returns. As Figure 4 illustrates, the returns that investors receive may be very different from those of the funds they invest in,3 since cash flows tend to be attracted by, rather than precede, higher returns. On average, for the ten years ended December 31, 2012, fund investors trailed a moderate policy allocation by 0.91 percentage point (91 basis points) per year, according to Morningstar. The advisor’s alpha target, then, might be to improve upon this return shortfall by means that don’t depend on market outperformance: asset allocation, rebalancing,
tax-efficient investment strategies, cash flow management, and, when appropriate, coaching clients to change nothing at all.
Although return-chasing behavior is often associated with individual investors, evidence suggests that institutions do so as well. Goyal and Wahal (2008) looked at the hiring and firing decisions of a group of plan sponsors from 1996 through 2003. They found that the hired firms outperformed the fired firms in the periods immediately preceding the decision to change, but underperformed the fired firms for one, two, and three years thereafter (see Figure 5).4 Advisors, as behavioral coaches, can act as emotional circuit breakers in bull or bear markets
3 The time-weighted returns in Figure 4 represent the average fund return in each category.4 See also the Vanguard research paper What Matters Most? An Analysis of Investment Committee Hire/Fire Decisions (LaBarge, 2010).
Stocks
Bonds
B = Billions
−60
−40
−20
0
20
40
60%
2009200820072006 2012201120102005200420032002200120001999199819971996199519941993199219911990
Stocks outperform
Bonds outperform
$160B in$2B in
$70B in$81B in
$464B in$182B in
$140B out$790B in
$262B in$48B out
$37B in$148B out
Notes: Stocks are represented by the Dow Jones U.S. Total Stock Market Index from 1990 through April 22, 2005, and the MSCI US Broad Market Index thereafter. Bonds are represented by the Barclays U.S. Aggregate Bond Index. Date labels refer to December 31 for each year.
Sources: Vanguard Investment Strategy Group and Morningstar, Inc.
Figure 3. Net cash �ows to bond and equity mutual funds compared with rolling 12-month excess returns for the U.S. stock and bond markets, 1990–2012
7
by circumventing their clients’ tendencies to chase returns or run for cover in emotionally charged markets.
Adding value through portfolio construction
Many advisors use a “top-down” approach that starts with analyzing the client’s goals and constraints, then focuses on finding the most suitable asset allocation strategy. This process is extremely important, yet too many investors neglect it on their own, overlooking its contribution to their long-term investment success. As a result, providing a well-considered investment strategy and asset allocation is an important way in which advisors add value. And the knowledge that the asset allocation was arrived at after careful consideration, rather than as a happenstance of buying funds with attractive returns (the investment equivalent of butterfly collecting), can serve as an important emotional anchor during those all-too-frequent uprisings of panic or greed in the markets.
The asset allocation process may be separated into two parts: determination and implementation. Within the overall framework of each client’s goals and circumstances, the allocation is often determined based on the historical risk/reward relationships between asset classes. Although no forward-looking investment process is perfect, particularly one based on historical data, it is reasonable to think that some historical risk/reward relationships are likely to persist. Future investors are as likely to demand compensation for bearing risk as investors in the past, and as a result, it is logical to expect assets
Value Blend Growth
Large-cap
6.67% 6.62% 7.12%
5.16 6.37 6.36
–1.51 –0.25 –0.76
Mid-cap
9.14 8.93 8.98
6.72 7.03 7.80
–2.42 –1.90 –1.18
Small-cap
9.96 9.29 9.14
8.87 8.36 8.48
–1.10 –0.93 –0.66
Conservative allocation Moderate allocation
5.71% 6.39%
4.81 5.48
–0.90 –0.91
Investor returns versus fund returns: Ten years ended December 31, 2012
Figure 4.
Time-weighted fund category return
Morningstar Investor ReturnDifference
Notes: Morningstar Investor Return™ assumes that the growth of a fund’s total net assets for a given period is driven by market returns and investor cash flow. To calculate investor return, a fund’s change in assets for the period is discounted by the return of the fund, to isolate how much of the asset growth was driven by cash flow. A proprietary model, similar to an internal rate-of-return calculation, is then used to calculate a constant growth rate that links the beginning total net assets and periodic cash flows to the ending total net assets. Discrepancies in the return “difference” are due to rounding.
Source: Morningstar, Inc.
Before manager change After manager change
Years 3 2 1 1 2 3
Difference in excess return (in percentage points)
9.52 9.12 4.57 –0.49 –0.88 –1.03
Source: Goyal and Wahal (2008), based on 8,775 hiring decisions by 3,417 plan sponsors delegating $627 billion in assets, and 869 firing decisions by 482 plan sponsors withdrawing $105 billion in assets.
Relative performance of hired versus fired firms, 1996–2003Figure 5.
8
with more return uncertainty (such as stocks or high-yield bonds) to outperform lower-risk assets over the long run.
Once an asset allocation has been determined, advisors can help their clients understand the important considerations involved in implementing it. For example, the next question might be, “Do I want to use actively managed funds or index funds to implement this portion of the allocation?” To help clients evaluate the index side of the scale, an advisor can point out that—in addition to the higher expense ratios commonly charged for actively
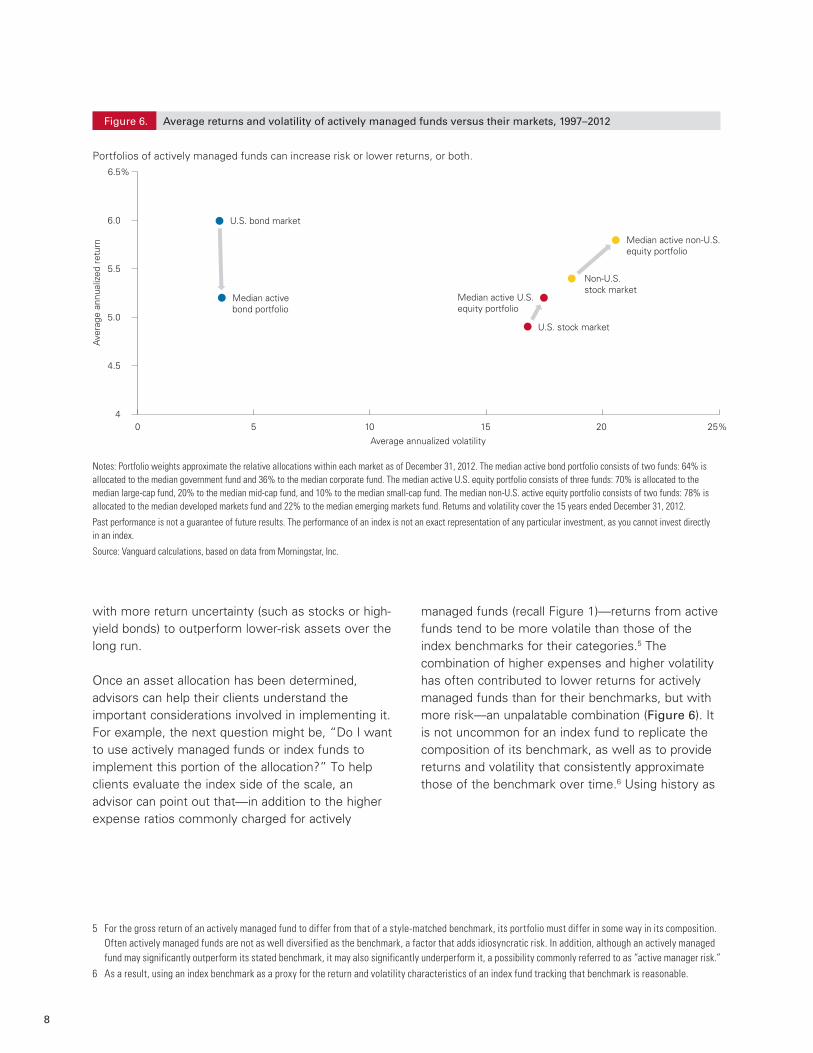
managed funds (recall Figure 1)—returns from active funds tend to be more volatile than those of the index benchmarks for their categories.5 The combination of higher expenses and higher volatility has often contributed to lower returns for actively managed funds than for their benchmarks, but with more risk—an unpalatable combination (Figure 6). It is not uncommon for an index fund to replicate the composition of its benchmark, as well as to provide returns and volatility that consistently approximate those of the benchmark over time.6 Using history as
5 For the gross return of an actively managed fund to differ from that of a style-matched benchmark, its portfolio must differ in some way in its composition. Often actively managed funds are not as well diversified as the benchmark, a factor that adds idiosyncratic risk. In addition, although an actively managed fund may significantly outperform its stated benchmark, it may also significantly underperform it, a possibility commonly referred to as “active manager risk.”
6 As a result, using an index benchmark as a proxy for the return and volatility characteristics of an index fund tracking that benchmark is reasonable.
Average returns and volatility of actively managed funds versus their markets, 1997–2012Figure 6.
Ave
rage
ann
ualiz
ed r
etur
n
0 5 10 15 20 25%4
4.5
5.0
5.5
6.0
6.5%
U.S. bond market
Average annualized volatility
Median active bond portfolio
Median active U.S. equity portfolio
U.S. stock market
Non-U.S. stock market
Median active non-U.S. equity portfolio
Notes: Portfolio weights approximate the relative allocations within each market as of December 31, 2012. The median active bond portfolio consists of two funds: 64% is allocated to the median government fund and 36% to the median corporate fund. The median active U.S. equity portfolio consists of three funds: 70% is allocated to the median large-cap fund, 20% to the median mid-cap fund, and 10% to the median small-cap fund. The median non-U.S. active equity portfolio consists of two funds: 78% is allocated to the median developed markets fund and 22% to the median emerging markets fund. Returns and volatility cover the 15 years ended December 31, 2012.
Past performance is not a guarantee of future results. The performance of an index is not an exact representation of any particular investment, as you cannot invest directly in an index.
Source: Vanguard calculations, based on data from Morningstar, Inc.
Portfolios of actively managed funds can increase risk or lower returns, or both.

9
a guide, index funds often provide higher returns and lower volatilities over time, relative to actively managed funds in the same category.
However, many investors (and certainly some advisors) approach investing from the “bottom up,” focusing foremost on security or fund selection, with emphasis on investments that have caught their eye through recent outperformance. Cash-flow patterns such as those illustrated in Figure 3 tend to result, often with the greatest differential in net cash flows occurring at or near the peak in relative out-performance.7 For example, Figure 3 shows that in 1999 and 2000, cash flows into U.S. equities dwarfed those into bonds. More specifically, in 2000, bond funds saw approximately $48 billion depart, while stock funds gathered in about $262 billion. After a five-year stock market boom, one might have looked for cash coming into bond funds as a result of portfolio rebalancing. However, such an expectation would presume that a large majority of investors and advisors both employed asset allocation strategies and possessed the discipline to execute rebalancing as planned—paring the holdings of their out-performers and committing more capital to the underperformers. The data do not seem to validate this presumption.
Addition by subtraction: Emphasis on tax-efficient strategies
Taxes are another major consideration for many clients, and tax management is a further important way in which advisors can demonstrate the value they add. If future returns turn out to be more modest while taxes on those returns are higher than they have been, as some professionals are forecasting, then total costs (management fees, expense ratios, frictional costs, taxes, etc.) will
erode an investor’s returns even further. And tax-conscious financial planning and tax-efficient portfolio construction will have proportionately larger benefits.
Actively managed equity strategies or funds tend to be tax-inefficient, potentially diminishing or erasing any gains from outperformance if they are held in taxable accounts. If an advisor has great faith in the active manager’s abilities, then techniques such as asset location—sheltering tax-inefficient funds in tax-advantaged accounts—may help preserve the expected rewards for bearing active-manager risk.
An asset-location strategy can also help clients to understand the trade-offs between municipal bonds and taxable bonds. For higher-tax-bracket clients, tax-exempt munis are often the default fixed income holdings, as these bonds provide income exempt from federal, and sometimes state and local, income taxes. Because of the tax-free income, as well as the generally higher creditworthiness of municipalities, a municipal bond portfolio is typically expected to have a lower yield than a broadly diversified portfolio of investment-grade bonds, such as the Barclays U.S. Aggregate Bond Index. Historically, the muni/taxable yield differential has been approximately 130 basis points per year (though amid the recent stresses in the U.S. financial markets, munis have sometimes yielded more than taxable bonds, an unusual occurrence).8
An advisor familiar with the asset-location process can help a client understand the interplay of these decisions—index or active funds, taxable or tax-exempt bonds—in implementing the asset allocation. Taxable bonds have historically outperformed municipal bonds by more than 100 basis points a year in annualized returns, but they are tax-inefficient unless they can be sheltered in a tax-advantaged account. Actively managed equity funds offer the opportunity to outperform, but they are also tax-
7 Although our illustration reflects the relative cash flows and performance for the overall U.S. stock and bond markets, our research has shown that similar patterns exist for U.S. growth and value stock funds, U.S. large-cap and small-cap stock funds, and domestic and international stock funds.
8 The average yield differential (muni/taxable spread) for the Barclays U.S. Aggregate Bond Index and the Barclays Municipal Bond Index from January 1980 through December 2012 was 1.28% (128 basis points); as of December 31, 2012, the muni/taxable spread for the same indexes was –0.43% (–43 basis points).

10
inefficient and are principal candidates for tax-advantaged accounts, too. But if the assets available for tax-advantaged accounts are limited, which investment should be sheltered first? Unless the investor or advisor has tremendous confidence that the active fund manager can consistently outperform after expenses by at least 100 basis points annually (approximating the historical muni/taxable spread), then sheltering the taxable bonds first is likely to yield better after-tax results.9 Helping clients not only with their asset allocation but also with their asset location can be a meaningful part of advisor’s alpha, adding clear value by helping to improve the client’s after-tax returns.
Further, clients who are retired can often benefit from tax-conscious guidance about spending from their portfolios. On their own, investors often spend first from their tax-advantaged accounts, and to some degree this is understandable since those accounts were explicitly set up for this purpose. However, it is generally more advantageous to spend from taxable accounts first, allowing the tax-advantaged accounts to grow as much as possible.
Determining the appropriate drawdown strategy often includes making some assumptions about future tax rates as well as estimating the client’s future income levels. Meeting with the client to work through these assumptions can provide an excellent opportunity to discuss possible scenarios, demonstrate that the guidance is personalized, and promote the client’s confidence in the strategy and the advisor. A well-thought-out drawdown strategy can improve the likelihood that the client’s assets will be able to support his or her financial goals through retirement and beyond, which is a significant—if hard to quantify—added value.10
Conclusion
The compensation structure for advisors is evolving from a commission and transaction-based system to a fee-based, asset management framework. In our view, this is a mutually beneficial transition for clients and advisors. However, the traditional value proposition for many advisors has been based on their investment acumen and their prospects for delivering better returns than those of the markets. No matter how skilled the advisor, the path to better investment results may not lie with the ability to pick investments or strategies. Historically, active management has failed to deliver on its promise of outperformance over longer investment horizons.
Instead, advisors should consider a new value proposition based on alternative skills and expertise: They should act as wealth managers and behavioral coaches, providing discipline and experience to investors who need it. On their own, investors often lack both understanding and discipline, allowing themselves to be swayed by headlines and advertisements surrounding the “investment du jour”—and thus often achieving wealth destruction rather than creation. In the advisor’s alpha framework we’ve described, the advisor becomes an even more important factor in the client-advisor relationship, because the greatest obstacle to clients’ long-term investment success is likely themselves.
9 For more information on the topic, see Jaconetti (2007).10 For more information on the topic, see Jaconetti and Bruno (2008).

11
References
Cerulli Associates, 2012. Cerulli Quantitative Update: Advisor Metrics 2012.
Cogent Research, 2012. Cogent Research Advisor Brandscape: 2012.
Goyal, Amit, and Sunil Wahal, 2008. The Selection and Termination of Investment Management Firms by Plan Sponsors. Journal of Finance 63(4): 1805–48.
Jaconetti, Colleen M., 2007. Asset Location for Taxable Investors. Valley Forge, Pa.: The Vanguard Group.
Jaconetti, Colleen M., and Maria A. Bruno, 2008. Spending From a Portfolio: Implications of Withdrawal Order for Taxable Investors. Valley Forge, Pa.: The Vanguard Group.
LaBarge, Karin Peterson, 2010. What Matters Most? An Analysis of Investment Committee Hire/Fire Decisions. Valley Forge, Pa.: The Vanguard Group.
Philips, Christopher B., 2012. The Case for Indexing. Valley Forge, Pa.: The Vanguard Group.

Vanguard research > Vanguard Center for Retirement Research Vanguard Investment Strategy Group
E-mail > [email protected]
For more information about Vanguard funds, visit vanguard.com or call 800-662-2739 to obtain a prospectus. Investment objectives, risks, charges, expenses, and other important information about a fund are contained in the prospectus; read and consider it carefully before investing.
CFA® is a trademark owned by CFA Institute.
Morningstar data © 2013 Morningstar, Inc. All rights reserved. The information contained herein: (1) is proprietary to Morningstar and/or its content providers; (2) may not be copied or distributed; and (3) is not warranted to be accurate, complete, or timely. Neither Morningstar nor its content providers are responsible for any damages or losses arising from any use of this information.
P.O. Box 2600 Valley Forge, PA 19482-2600
© 2013 The Vanguard Group, Inc. All rights reserved. Vanguard Marketing Corporation, Distributor.
ICRAA 042013
Connect with Vanguard® > vanguard.com