advice for the wise - february 2013
TRANSCRIPT

1
ADVICE for the WISE
Newsletter – FEBRUARY 2013

Economic Update 4
Equity Outlook 8
Debt Outlook 13
Forex 15
Commodities 16
Index Page No.
Contents
Real Estate 17
2

From the Desk of the CIO…
“Advisory services are provided through Karvy Stock Broking Ltd. (PMS) having SEBI Registration No: INP000001512. Investments are subject to market risks. Please read the disclaimer on slide 20”
Dear Investors,
The enthusiastic mood of January in capital markets was duly followed by
some somber reflections towards the end of the month. RBI obliged the
capital markets, the government and the real economy alike by reducing
the repo rate by 25 bps. It further tried to reduce the liquidity strain in
the banking system by reducing the cash reserve ratio by 25 bps as well.
The long due monetary easing finally began! It came with the usual
caveats from the Governor though, when he reminded everyone that the
pace of further easing is contingent on inflation coming down. Hence
even now, we cannot take further rate cuts for granted. The high base
effect may suppress inflation numbers for long enough to create a climate
for a moderate pace of monetary easing but the picture is complicated by
diesel price hike, not to mention RBI’s awareness of the base effect itself.
While RBI did its part by reducing the repo rate and CRR much rests with
banks and real economy decision makers as regards revival of high
economic growth. Consumption growth has held up quite well in India
through the last few years. Most of the slowdown in growth was a result
of a sharp reduction in real investments i.e. new factories, roads, power
plants and the like. Even real estate construction had slowed down
significantly, though prices remained firm. Part of this slowdown was due
to high interest rates, but a large part was due to bearish sentiments in
the real economy. Stated simply, companies and individuals alike
postponed or cancelled their investment plans due to concerns regarding
future growth in whatever they sell (for companies) or in their income
(for individuals).
The repo rate cut to translate into pick-up in investment activity has to
have two other favorable developments as well. One is the willingness
and ability of banks to lend for funding investments and second is the
willingness and ability of borrowers to ask for loans. The first is not a
major concern for private sector banks (a leading bank recently raised
significant fresh equity, signaling aggressive lending plans) but will remain
a worry for public sector banks with balance sheets still under strain from
NPAs. The second might emerge as a concern if the banks increasingly
find the only willing borrowers to be already overleveraged; worse still if
most real economy participants are still focusing on lightening their
balance sheets.
The repo rate cut thus is a good starting point for revival of growth.
However, we will have to watch for signs of investment activity picking up
before declaring victory on the growth front. The other factor to track is
the global risk appetite. Even on this front, there are some murmurs of
caution – largely due to fresh hints of trouble in Euro-zone and less than
jubilant data in US on employment. The actual numbers are hard enough
to predict; the reaction of market participants to them even more so. We
continue to believe that an unpleasant development on either EU front or
US front may send the risk appetite in reverse gear with immediate
consequences for emerging market fund flow. Investing into equities at
this stage, while lucrative, requires the awareness of the potential short
term volatility.
Long term debt continues to be a safe heads-I-win-tails-I-don’t-lose bet.
Slower pace of monetary easing will reduce the capital appreciation in
long term debt but the coupon accrual will still deliver decent returns.
3

As on 31st Jan 2013
Change over last month
Change over last year
Equity Markets
BSE Sensex 19895 2.4% 15.7%
S&P Nifty 6035 2.2% 16.1%
S&P 500 1498 5.0% 14.1%
Nikkei 225 11139 7.2% 26.5%
Debt Markets
10-yr G-Sec Yield 7.91% (14 bps) (36 bps)
Call Markets 7.80% 53 bps 124 bps
Fixed Deposit* 8.50% 0 (75 bps)
Commodity Markets
RICI Index 3847 4% 2.6%
Gold (`/10gm) 30169 (0.9%) 7.3%
Crude Oil ($/bbl) (As on 29th Jan)
115.22 4.0% 4.5%
Forex
Markets
Rupee/Dollar 53.3 2.8% (6.8%)
Yen/Dollar 91.0 (5.7%) (15.9%)
Economic Update - Snapshot of Key Markets
Gold
• Indicates SBI one-year FD •New 10 Year benchmark paper(8.15%, 2022 Maturity) was listed in the month of June, the 1 year yield is compared to the earlier benchmark(2021 Maturity)
4
75
85
95
105
115
125
135 Sensex Nifty S&P 500 Nikkei 225
7.30
7.80
8.30
8.80
9.30 10 Year G-Sec
15000
20000
25000
30000
35000
40
42
44
46
48
50
52
54
56
58
60
`/$
US
Europe
Japan
Emerging economies
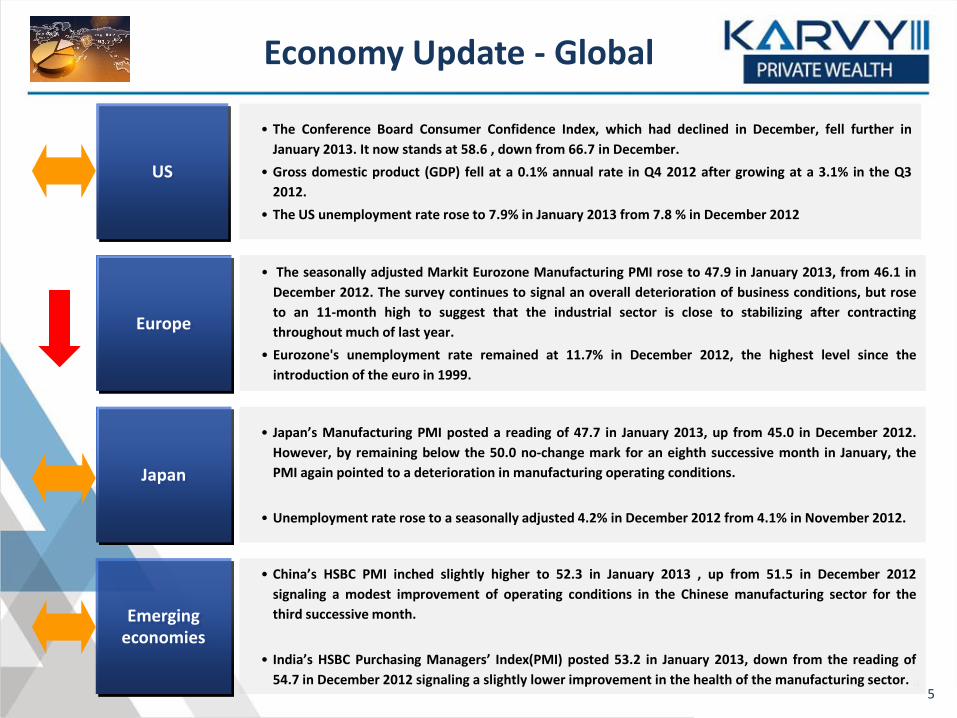
• The Conference Board Consumer Confidence Index, which had declined in December, fell further in
January 2013. It now stands at 58.6 , down from 66.7 in December.
• Gross domestic product (GDP) fell at a 0.1% annual rate in Q4 2012 after growing at a 3.1% in the Q3
2012.
• The US unemployment rate rose to 7.9% in January 2013 from 7.8 % in December 2012
• The seasonally adjusted Markit Eurozone Manufacturing PMI rose to 47.9 in January 2013, from 46.1 in
December 2012. The survey continues to signal an overall deterioration of business conditions, but rose
to an 11-month high to suggest that the industrial sector is close to stabilizing after contracting
throughout much of last year.
• Eurozone's unemployment rate remained at 11.7% in December 2012, the highest level since the
introduction of the euro in 1999.
Economy Update - Global
• Japan’s Manufacturing PMI posted a reading of 47.7 in January 2013, up from 45.0 in December 2012.
However, by remaining below the 50.0 no-change mark for an eighth successive month in January, the
PMI again pointed to a deterioration in manufacturing operating conditions.
• Unemployment rate rose to a seasonally adjusted 4.2% in December 2012 from 4.1% in November 2012.
• China’s HSBC PMI inched slightly higher to 52.3 in January 2013 , up from 51.5 in December 2012
signaling a modest improvement of operating conditions in the Chinese manufacturing sector for the
third successive month.
• India’s HSBC Purchasing Managers’ Index(PMI) posted 53.2 in January 2013, down from the reading of
54.7 in December 2012 signaling a slightly lower improvement in the health of the manufacturing sector. 5

Economy Outlook - Domestic
• The Indian economy grew by 5.3 per cent in the July-September
period of the current financial year (2012-13), pulled down by
poor performance of manufacturing and agriculture sectors,
showing persistent signs of slowdown. The gross domestic
product (GDP) had expanded by 6.7 per cent in the same period
of last fiscal. During the three-month period ended September
30, the manufacturing sector grew marginally by 0.8 per cent,
against 2.9 per cent growth in the same period of 2011-12
• The economic growth in the first six month of this fiscal (April-
September) is 5.4 per cent, lower than 7.3 per cent growth
clocked in the year-ago period
• The Reserve Bank of India (RBI) sharply lowered the economic
growth projection to 5.8%, from 6.5%, projected earlier. The
growth rate in 2011-12 slipped to a nine-year low of 6.5%.
GDP growth
• Dashing hopes of a rebound, the industrial output contracted to a
four-month low of 0.1% in November due to poor performance of
manufacturing and mining sectors and decline in production of
capital goods. IIP dipped from a robust 8.3% in October. Factory
output growth was 1% in April-November period this fiscal, down
from 3.8% in the same period in 2011-12.
• the manufacturing sector rose a paltry 0.3% in November compared
with 6.6% expansion in the year ago period while mining fell 5.5%
compared to a decline of 3.5%. The capital goods sector, which is a
key indicator of industrial activity, fell 7.7% compared to a fall of
4.7% in the year-earlier period.
• The growth in the industrial production during October last year
was revised upward to 8.3%, from earlier provisional estimates of
8.2% released last month.
IIP
6
8.3
7.8 7.7
6.9
6.1
5.3 5.5
5.3
4.0
4.5
5.0
5.5
6.0
6.5
7.0
7.5
8.0
8.5
9.0
FY11(Q3) FY11(Q4) FY12(Q1) FY12(Q2) FY12(Q3) FY12(Q4) FY13(Q1) FY13(Q2)
-6.0%
-4.0%
-2.0%
0.0%
2.0%
4.0%
6.0%
8.0%
10.0%
Nov 11
Dec 11
Jan 12
Feb 12
Mar 12
Apr 12
May 12
Jun 12
Jul 12
Aug 12
Sep 12
Oct 12
Nov 12
Economic Outlook - Domestic
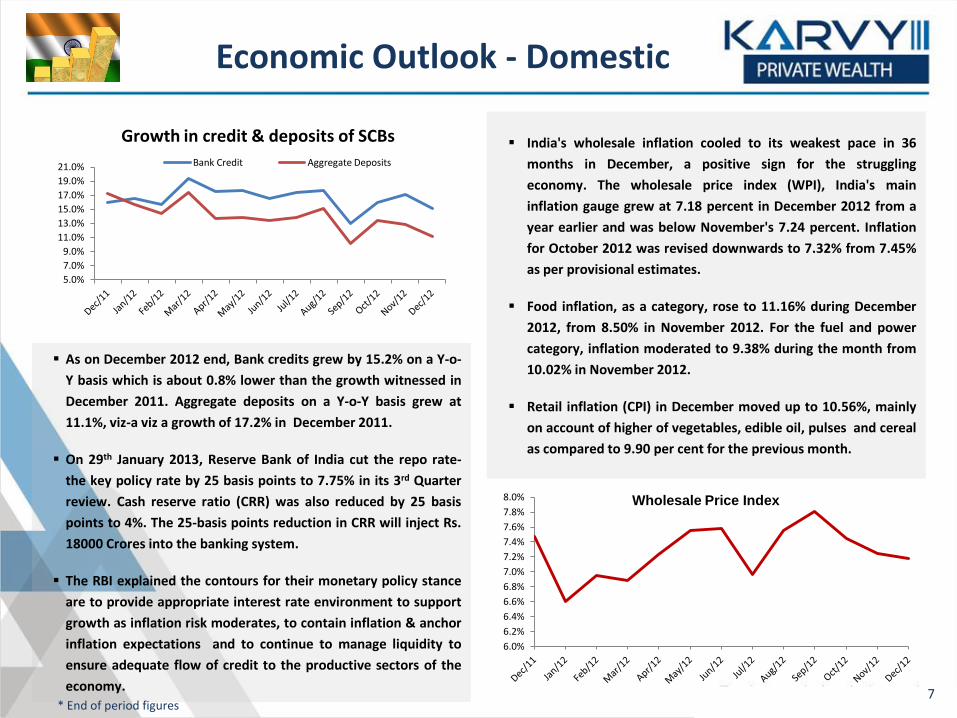
As on December 2012 end, Bank credits grew by 15.2% on a Y-o-
Y basis which is about 0.8% lower than the growth witnessed in
December 2011. Aggregate deposits on a Y-o-Y basis grew at
11.1%, viz-a viz a growth of 17.2% in December 2011.
On 29th January 2013, Reserve Bank of India cut the repo rate-
the key policy rate by 25 basis points to 7.75% in its 3rd Quarter
review. Cash reserve ratio (CRR) was also reduced by 25 basis
points to 4%. The 25-basis points reduction in CRR will inject Rs.
18000 Crores into the banking system.
The RBI explained the contours for their monetary policy stance
are to provide appropriate interest rate environment to support
growth as inflation risk moderates, to contain inflation & anchor
inflation expectations and to continue to manage liquidity to
ensure adequate flow of credit to the productive sectors of the
economy.
India's wholesale inflation cooled to its weakest pace in 36
months in December, a positive sign for the struggling
economy. The wholesale price index (WPI), India's main
inflation gauge grew at 7.18 percent in December 2012 from a
year earlier and was below November's 7.24 percent. Inflation
for October 2012 was revised downwards to 7.32% from 7.45%
as per provisional estimates.
Food inflation, as a category, rose to 11.16% during December
2012, from 8.50% in November 2012. For the fuel and power
category, inflation moderated to 9.38% during the month from
10.02% in November 2012.
Retail inflation (CPI) in December moved up to 10.56%, mainly
on account of higher of vegetables, edible oil, pulses and cereal
as compared to 9.90 per cent for the previous month.
Growth in credit & deposits of SCBs
* End of period figures 7
5.0%
7.0%
9.0%
11.0%
13.0%
15.0%
17.0%
19.0%
21.0% Bank Credit Aggregate Deposits
6.0%
6.2%
6.4%
6.6%
6.8%
7.0%
7.2%
7.4%
7.6%
7.8%
8.0% Wholesale Price Index
Budget FY 14
In the last several months, Government of India has demonstrated its willingness to restart the reform process by pushing several
politically difficult reform measures. The FDI in Retail, Aviation & broadcasting are all measures which will have a long term beneficial
impact on the Indian Economy. Government has displayed a lot of political courage in pushing ahead with these measures despite stiff
political opposition. We see the Government’s decision to raise railway passenger fares and allow oil companies to raise diesel & petrol
prices periodically and free bulk diesel prices as positive for sentiment and much needed from a fiscal consolidation perspective.
It is important to note that most of these measures have been pushed before the announcement of the budget as government might
want a politically non-controversial budget considering its precarious majority in the Parliament. We expect most of the reform
measures to be carried out through executive actions before the budget and after it.
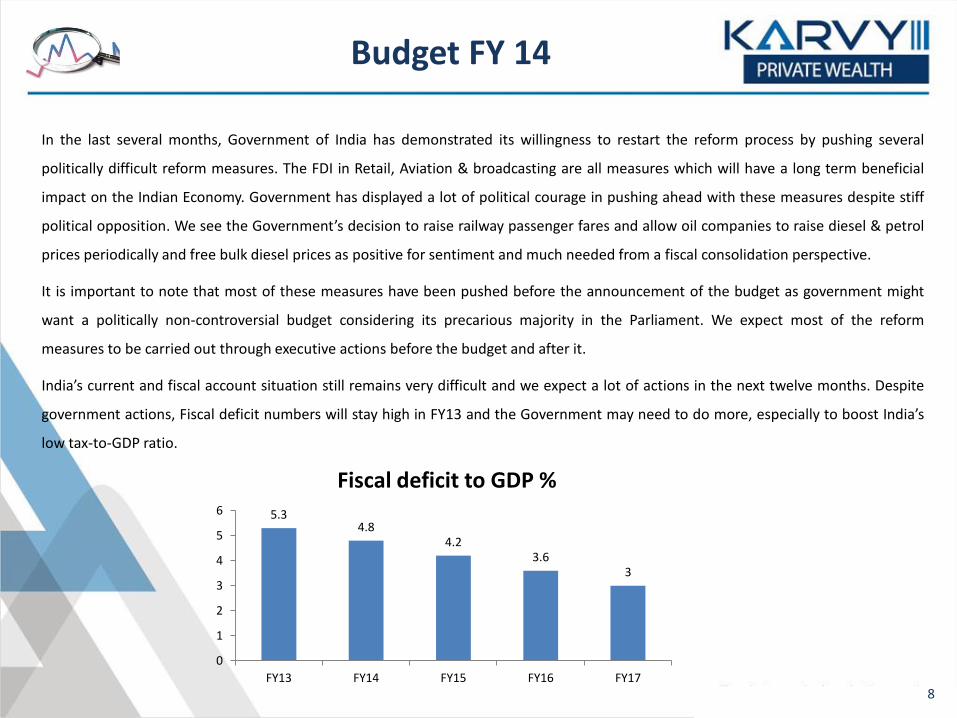
India’s current and fiscal account situation still remains very difficult and we expect a lot of actions in the next twelve months. Despite
government actions, Fiscal deficit numbers will stay high in FY13 and the Government may need to do more, especially to boost India’s
low tax-to-GDP ratio.
8
5.3 4.8
4.2 3.6
3
0
1
2
3
4
5
6
FY13 FY14 FY15 FY16 FY17
Fiscal deficit to GDP %
9
Budget FY 14
The implementation of GST looks unlikely in FY2014 but unaccounted income can be taxed through other innovative methods which
might find a place in this year’s budget. The finance minister has promised to curb the fiscal deficit without raising taxes. There could be
realignment of government expenditure to reduce the impact of new subsidies on the fiscal deficit numbers.
An area where budget might play a role is expenditure control. Government is trying hard to curtail expenditure and the biggest cut that
we expect will come in Plan expenditure. Already, Defense Ministry’s capex plan has been cut by 10,000 crores. There is an expectation
that there could be drastic cut in plan expenditure of various ministries with an objective of reducing deficit by 0.5%-1% of GDP in this
fiscal. This could well go into next year’s budget. Disinvestment is another area where government may be looking to raise some more
revenue. While budget targets are rarely met, we expect a mobilization of 25000 crores in FY13 from this route which could increase to
40000 crores next year. Further deregulation of fertilizer and fuel prices might also happen post the budget but it is a politically
inconvenient decision to push in an election year. We expect a fiscal deficit of around 5.5% for FY13 and 5% for FY14.
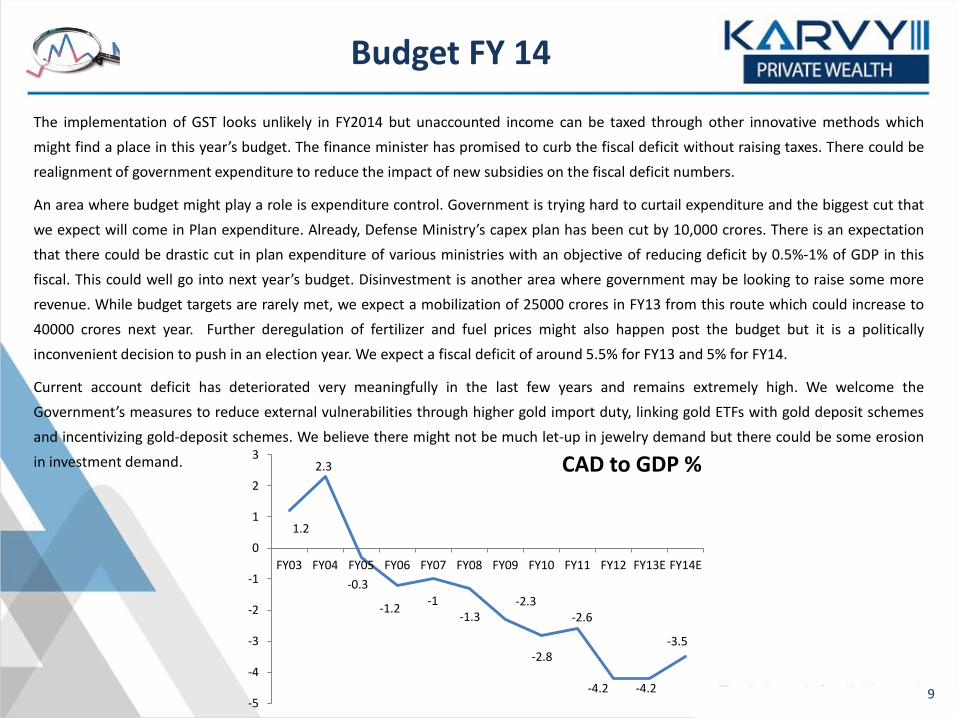
Current account deficit has deteriorated very meaningfully in the last few years and remains extremely high. We welcome the
Government’s measures to reduce external vulnerabilities through higher gold import duty, linking gold ETFs with gold deposit schemes
and incentivizing gold-deposit schemes. We believe there might not be much let-up in jewelry demand but there could be some erosion
in investment demand.
1.2
2.3
-0.3
-1.2 -1
-1.3 -2.3
-2.8
-2.6
-4.2 -4.2
-3.5
-5
-4
-3
-2
-1
0
1
2
3
FY03 FY04 FY05 FY06 FY07 FY08 FY09 FY10 FY11 FY12 FY13E FY14E
CAD to GDP %

10
More such actions might be taken in the next few months. To ensure that FII continue to invest in India, GAAR has been postponed till
April 2016 and will not be applicable to FIIs whose intention is clear, i.e., not to avoid taxes using tax treaties. Government will keep
taking these kind of measures in an attempt to bridge the deficit on the current account with capital inflows. Investment limits in
Government and corporate bond markets have already been enhanced several times in the last year and could be increased further. If
Foreign investment limits in insurance sector is raised, that can bring fresh foreign capital into India. We expect swift approvals to
investment plans of foreign retailers.
Domestic Investment demand continues to be very weak and will likely remain so till the time underlying issues are addressed. It will
take time to fix the structural issues that plague investment. The IIP numbers indicate the low level of industrial activity in the country.
5.8 7
11.7
8.6
12.9
15.5
2.5
5.3
8.2
2.9 1.4
4.5
0
2
4
6
8
10
12
14
16
18
FY03 FY04 FY05 FY06 FY07 FY08 FY09 FY10 FY11 FY12 FY13E FY14E
IIP Growth % The new land acquisition bill might be placed in the
budget session of Parliament which will streamline the
land acquisition process for large industrial projects.
Cabinet Committee for Infrastructure announced last
month will look at solving inter-ministerial issues on
various infra project and their first meeting is expected at
the end of January. The biggest road block to large
projects in the last three years has been the delays in
getting approvals from the environment ministry. Again,
something where budget can have very little impact.
We believe that a lot of actions will be taken by the government in the next twelve months to revive the ailing economy. However, there
will be a mix of executive decisions and few economic bills outside of budget. Those looking for a new economic vision for India in the
budget might end of getting disappointed again.
Budget FY 14
Sector Stance Remarks
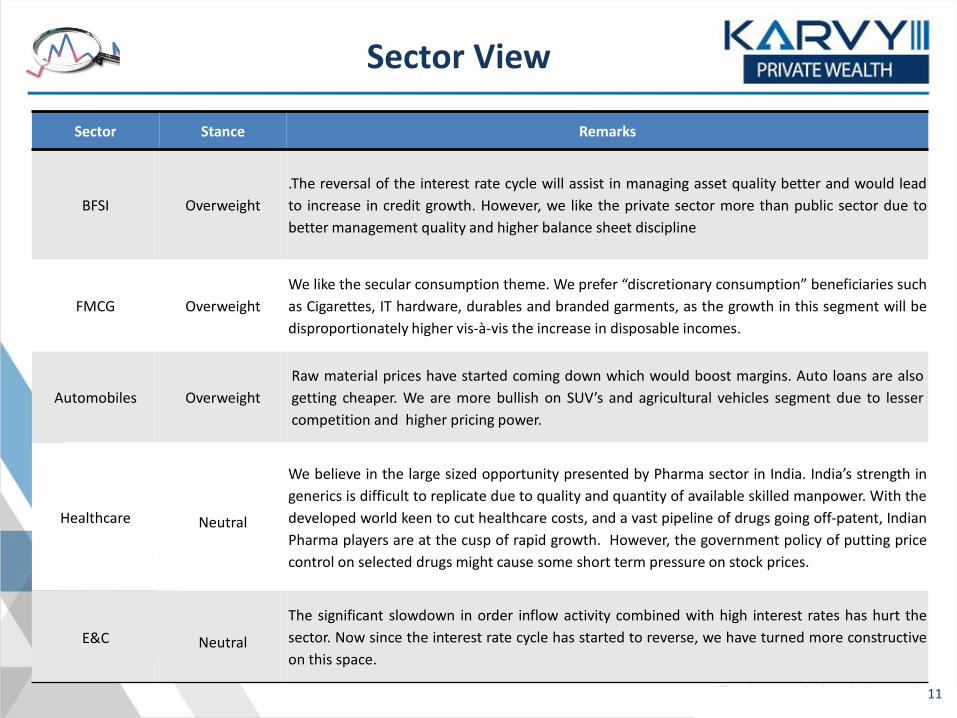
BFSI Overweight
.The reversal of the interest rate cycle will assist in managing asset quality better and would lead
to increase in credit growth. However, we like the private sector more than public sector due to
better management quality and higher balance sheet discipline
FMCG Overweight
We like the secular consumption theme. We prefer “discretionary consumption” beneficiaries such
as Cigarettes, IT hardware, durables and branded garments, as the growth in this segment will be
disproportionately higher vis-à-vis the increase in disposable incomes.
Automobiles Overweight
Raw material prices have started coming down which would boost margins. Auto loans are also
getting cheaper. We are more bullish on SUV’s and agricultural vehicles segment due to lesser
competition and higher pricing power.
Healthcare Neutral
We believe in the large sized opportunity presented by Pharma sector in India. India’s strength in
generics is difficult to replicate due to quality and quantity of available skilled manpower. With the
developed world keen to cut healthcare costs, and a vast pipeline of drugs going off-patent, Indian
Pharma players are at the cusp of rapid growth. However, the government policy of putting price
control on selected drugs might cause some short term pressure on stock prices.
E&C Neutral
The significant slowdown in order inflow activity combined with high interest rates has hurt the
sector. Now since the interest rate cycle has started to reverse, we have turned more constructive
on this space.
Sector View
11

Sector Stance Remarks
Telecom Neutral The regulatory hurdles and competitive pressures seem to be reducing. Incumbents have started
to increase tariffs slowly and we believe that consolidation will happen sooner than expected
Cement Neutral Cement industry is facing over capacity issues and lackluster demand. With regulator taking a
strong view against pricing discipline, the profits of the sector are expected to stay muted.
Power Utilities Neutral We like the regulated return characteristics of this space. This space provides steady growth in
earnings and decent return on capital.
IT/ITES Neutral Demand seems to be coming back in Europe. US volume growth has also remained resilient. With
pricing already bottomed out, we have turned positive on the space selectively.
Energy Underweight We would stay away from oil PSUs, due to issues of cross subsidization distorting the underlying
economics of oil exploration and refinery businesses.
Metals Underweight Commodity prices have corrected significantly over the last few months due to concerns about
growth in China and developed parts of the world.
Sector View
12
Debt Outlook
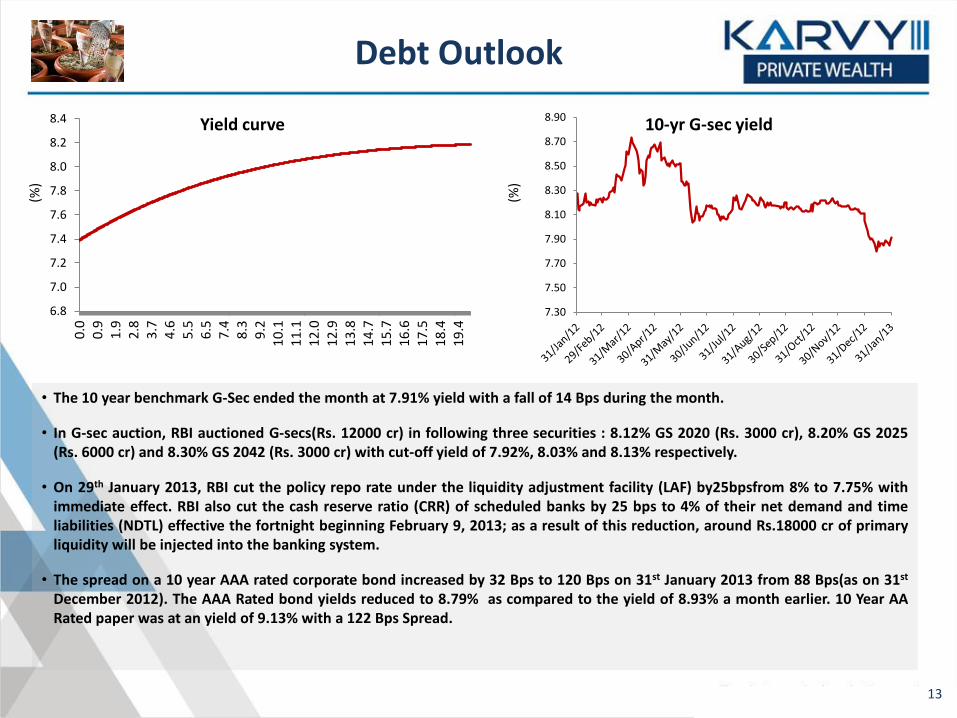
• The 10 year benchmark G-Sec ended the month at 7.91% yield with a fall of 14 Bps during the month.
• In G-sec auction, RBI auctioned G-secs(Rs. 12000 cr) in following three securities : 8.12% GS 2020 (Rs. 3000 cr), 8.20% GS 2025 (Rs. 6000 cr) and 8.30% GS 2042 (Rs. 3000 cr) with cut-off yield of 7.92%, 8.03% and 8.13% respectively.
• On 29th January 2013, RBI cut the policy repo rate under the liquidity adjustment facility (LAF) by25bpsfrom 8% to 7.75% with immediate effect. RBI also cut the cash reserve ratio (CRR) of scheduled banks by 25 bps to 4% of their net demand and time liabilities (NDTL) effective the fortnight beginning February 9, 2013; as a result of this reduction, around Rs.18000 cr of primary liquidity will be injected into the banking system.
• The spread on a 10 year AAA rated corporate bond increased by 32 Bps to 120 Bps on 31st January 2013 from 88 Bps(as on 31st December 2012). The AAA Rated bond yields reduced to 8.79% as compared to the yield of 8.93% a month earlier. 10 Year AA Rated paper was at an yield of 9.13% with a 122 Bps Spread.
10-yr G-sec yield Yield curve
(%)
(%)
13
7.30
7.50
7.70
7.90
8.10
8.30
8.50
8.70
8.90
6.8
7.0
7.2
7.4
7.6
7.8
8.0
8.2
8.4
0.0
0
.9
1.9
2
.8
3.7
4
.6
5.5
6
.5
7.4
8
.3
9.2
1
0.1
1
1.1
1
2.0
1
2.9
1
3.8
1
4.7
1
5.7
1
6.6
1
7.5
1
8.4
1
9.4
Debt Strategy
Outlook Category Details
Long Tenure Debt
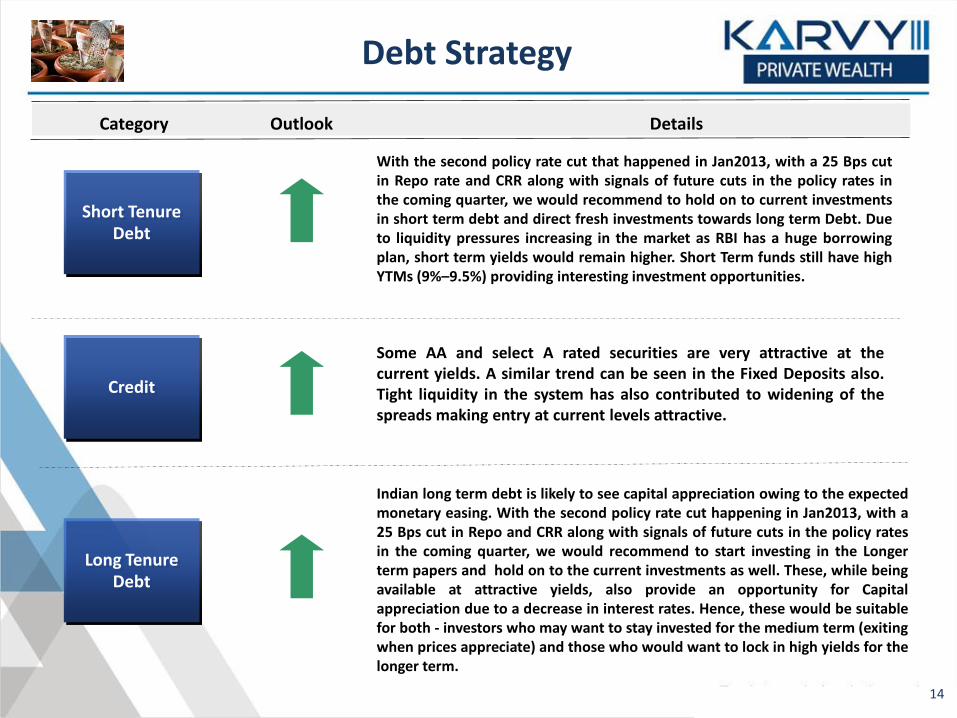
Indian long term debt is likely to see capital appreciation owing to the expected monetary easing. With the second policy rate cut happening in Jan2013, with a 25 Bps cut in Repo and CRR along with signals of future cuts in the policy rates in the coming quarter, we would recommend to start investing in the Longer term papers and hold on to the current investments as well. These, while being available at attractive yields, also provide an opportunity for Capital appreciation due to a decrease in interest rates. Hence, these would be suitable for both - investors who may want to stay invested for the medium term (exiting when prices appreciate) and those who would want to lock in high yields for the longer term.
Some AA and select A rated securities are very attractive at the current yields. A similar trend can be seen in the Fixed Deposits also. Tight liquidity in the system has also contributed to widening of the spreads making entry at current levels attractive.
With the second policy rate cut that happened in Jan2013, with a 25 Bps cut in Repo rate and CRR along with signals of future cuts in the policy rates in the coming quarter, we would recommend to hold on to current investments in short term debt and direct fresh investments towards long term Debt. Due to liquidity pressures increasing in the market as RBI has a huge borrowing plan, short term yields would remain higher. Short Term funds still have high YTMs (9%–9.5%) providing interesting investment opportunities.
Short Tenure Debt
Credit
14

Forex
• INR has appreciated against the major four currencies. INR saw an appreciation of 2.79% against dollar, where as the appreciation against Euro was minute. It saw a high appreciation against Japanese Yen of 8.5%.
• Recovery in US economy increased risk appetite among global investors, sending funds flowing into riskier assets, including those in emerging markets. One more Factor for INR to strengthen is that it did not react adversely to fiscal deficit for April-December 2012 being reported at Rs 407,000 crore, or 78.8% of the budgeted fiscal deficit of Rs 991,000 crore for fiscal 2010-13.
• Volatility as last year is expected to continue as the rupee would track cues from the domestic markets as well as global shores.
Rupee movement vis-à-vis other currencies (M-o-M) Trade balance and export-import data
• The preliminary capital account balance for Q2 FY 13 came in at Rs. 1,31,800 Cr. Thus, taking H1 FY 13 figure to Rs. 2,19,000 Cr.
• Capital account surplus improved further in Q2 FY13, widening Rs. 1,31,800 as against Rs. 87,200 in Q1 FY 13.
68531 73903 75512
99033
66748
37298
95500 78800
0
20000
40000
60000
80000
100000
120000
140000
FY 10 (Q3) FY 10 (Q4) FY 11 (Q1) FY 11 (Q2) FY 11 (Q3) FY 11 (Q4) FY 12 (Q1) FY 12 (Q2)
Capital Account Balance
Exports during December, 2012 were valued at US$ 24.88 bn which was 1.92% lower than the level of US $ 25.36 bn during December, 2011. Imports during December, 2012 were valued at US $ 42.60 Bn representing a negative growth of 6.26% over the level of imports valued at US $ 40.04 Bn in December 2011, translating into a trade deficit of $17.7 Bn.
15
2.79%
5.09%
0.04%
8.52%
0.00%
1.00%
2.00%
3.00%
4.00%
5.00%
6.00%
7.00%
8.00%
9.00%
USD GBP EURO YEN
-25000
-20000
-15000
-10000
-5000
0
-20
-10
0
10
20
30 Export Import Trade Balance (mn $)
Commodities
Precious
Metals
Oil & Gas
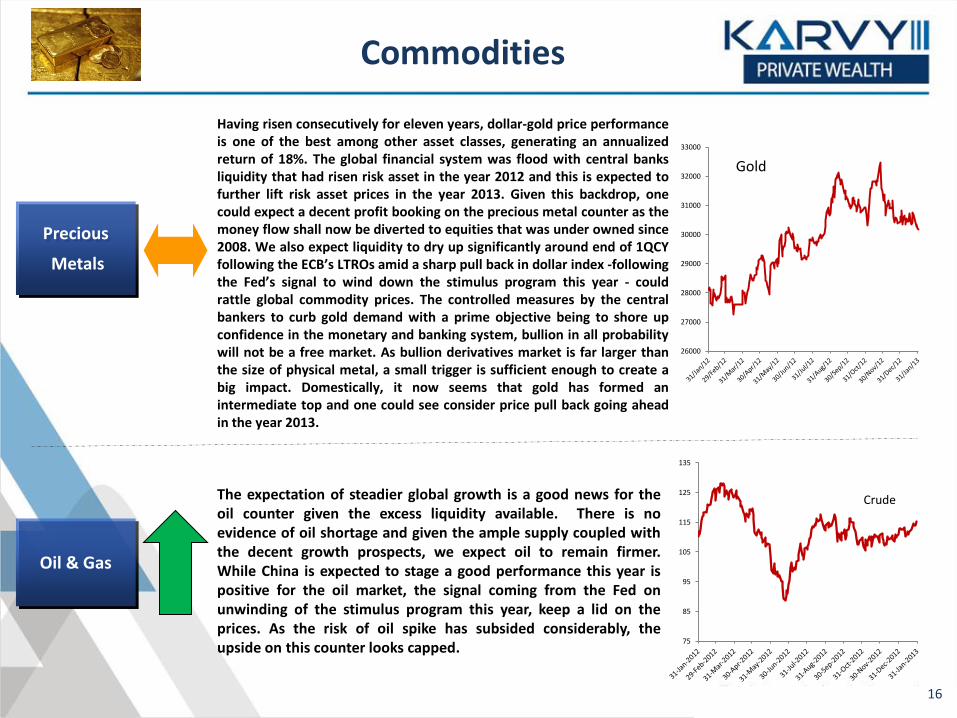
The expectation of steadier global growth is a good news for the oil counter given the excess liquidity available. There is no evidence of oil shortage and given the ample supply coupled with the decent growth prospects, we expect oil to remain firmer. While China is expected to stage a good performance this year is positive for the oil market, the signal coming from the Fed on unwinding of the stimulus program this year, keep a lid on the prices. As the risk of oil spike has subsided considerably, the upside on this counter looks capped.
Crude
Gold
Having risen consecutively for eleven years, dollar-gold price performance is one of the best among other asset classes, generating an annualized return of 18%. The global financial system was flood with central banks liquidity that had risen risk asset in the year 2012 and this is expected to further lift risk asset prices in the year 2013. Given this backdrop, one could expect a decent profit booking on the precious metal counter as the money flow shall now be diverted to equities that was under owned since 2008. We also expect liquidity to dry up significantly around end of 1QCY following the ECB’s LTROs amid a sharp pull back in dollar index -following the Fed’s signal to wind down the stimulus program this year - could rattle global commodity prices. The controlled measures by the central bankers to curb gold demand with a prime objective being to shore up confidence in the monetary and banking system, bullion in all probability will not be a free market. As bullion derivatives market is far larger than the size of physical metal, a small trigger is sufficient enough to create a big impact. Domestically, it now seems that gold has formed an intermediate top and one could see consider price pull back going ahead in the year 2013.
16
26000
27000
28000
29000
30000
31000
32000
33000
75
85
95
105
115
125
135

Real Estate Outlook
17
Asset Classes Tier I Tier II
Residential
Prices continued to be at peak levels in most markets with sales being slow,
more so in the premium segment. Going forward, the expectation of a general
recovery of the economy is likely to improve the sentiment in the real estate
sector. Residential asset class shall continue to be the prime focus. If the RBI
does implement key policy rates cuts, cheaper home loans will significantly
improve the liquidity in the market.
A lot of new supply is expected to hit the market specially in NCR and Mumbai
regions in the near future as developers have been waiting for some time for
the liquidity situation to improve. In December, DLF launched a 13 acre
project, SkyCourt in Gurgaon which was completely sold off.
On an average, projects with Rs. 4,000 – 5,000 per sq. ft. entry pricing with
good developers in Pune, Bangalore, NCR and Mumbai suburbs are expected
to see good percentage returns.
The recent increase of 5-30% in the Ready Reckoner values, used to calculate
the stamp duty cost, from January 1 by the Maharashtra Government may act
as the slight dampener for the Mumbai market.
Demand in Tier II cities is largely driven by the trend towards
nuclear families, increasing disposable income, rising
aspiration to own quality products and the growth in
infrastructure facilities in these cities. Price appreciation is
more concentrated to specific micro-markets in these cities.
Cities like Chandigarh, Jaipur, Lucknow, Ahmedabad, Bhopal,
Nagpur, Patna and Cochin are expected to perform well.
Commercial/IT
Commercial asset class continues to be under pressure as most markets
continue to have an over-supply . Lease transactions are still slow as demand
has not yet revived. On an average, lease rentals have also not seen much
increase.
However, specific pre-leased properties with good tenant profile and larger
lock-in periods may present good investment opportunities over a long-term
horizon.
Lower unsold inventory and smaller unit sizes have led to
stable lease rentals in Tier II cities.

Real Estate Outlook
Please Note: Tier I* markets include Mumbai, Delhi & NCR, Bangalore, Pune, Chennai, Hyderabad and Kolkatta Tier II* markets includes all state capitals other than the Tier I markets The IC note is proposed to be presented every quarter
18
Asset Classes Tier I Tier II
Retail
Government has recently approved 51% foreign
ownership in multi-brand retail and 100% in single-brand
retail. Entry of foreign retailers in the Indian markets may
infuse new enthusiasm in the sector and improve the
demand for retail space.
However, it will take a gestation period of at least an year
for this to translate into actaul offtake of space. In the
immediate near term, unsold invesntory levels continue
to be high levels and lease rentals stagnant.
Long term investments in retail space along pre-
eastblished hubs may be attractive.
Tier II cities see a preference of hi-street retail as compared
to mall space in Tier I cities. While not much data on these
rentals gets reported, these are expected to have been
stagnant.
The mall culture has repeatedly failed in the past n the
Tier-2 cities. Whether the FDI in retail can change this
phenomenon can be known with more certainty once the
effect of FDI is more visible in Tier I cities.
Land
As Tier I cities continue to grow, new proposed /
implemented infrastructure developments at the
outskirts of these cities are making adjoining lands
expensive and attracting a lot of investor attention.
Caution should however be exercised due to the
complexities typically involved in land investments.
Land in Tier II and III cities along upcoming / established
growth corridors have seen good percentage appreciation
due to low investment base in such areas.
Why Karvy Private Wealth?
We are an open-architecture firm at two levels – asset class level and product level : • Offering COMPREHENSIVE choice of investing across all asset classes • Offering EXTENSIVE choice of multiple products from different product providers under each asset class
Open Architecture – Widest array of products
Intensive Research
We closely track the historical performance across asset classes, sub-asset classes and product providers to identify, evaluate and recommend investment products (KPW’s or third-party). We have our own proprietary methodology for evaluating products; for product providers, we also note the investment style and risk management philosophy. Our comprehensive analysis determines truly exceptional performers to be added to your portfolio
When you become a Client of KPW, besides getting intelligent & practicable Investment Advice, you get the benefit of “The KPW 3-S Service Promise” :
• Smooth and Hassle Free – Attention, Service & Convenience • Sharp and proactive – Portfolio monitoring and tracking • Smart –Incisive insights on markets and Investment products
The KPW 3-S Service promise:
Group-wide, we have no Mutual Fund or Insurance products of our own unlike most of the financial services groups (banks or broking houses), who are doing wealth management. Neither do we have exclusive tie-up with any single insurance company like all banks do.
Honest, unbiased advise
A talented team of leaders with global and Indian experience, having a unique blend of backgrounds of wealth management, private equity, strategy consulting and building businesses powers Karvy Private Wealth and its operations.
Pedigreed Senior Management Team
19

Disclaimer
The information and views presented here are prepared by Karvy Private Wealth(a division of Karvy Stock Broking Limited) or other Karvy Group
companies. The information contained herein is based on our analysis and upon sources that we consider reliable. We, however, do not vouch for the
accuracy or the completeness thereof. This material is for personal information and we are not responsible for any loss incurred based upon it.
The investments discussed or recommended here may not be suitable for all investors. Investors must make their own investment decisions based on
their specific investment objectives and financial position and using such independent advice, as they believe necessary. While acting upon any
information or analysis mentioned here, investors may please note that neither Karvy nor any person connected with any associated companies of
Karvy accepts any liability arising from the use of this information and views mentioned here.
The author, directors and other employees of Karvy and its affiliates may hold long or short positions in the above-mentioned companies from time to
time. Every employee of Karvy and its associated companies are required to disclose their individual stock holdings and details of trades, if any, that
they undertake. The team rendering corporate analysis and investment recommendations are restricted in purchasing/selling of shares or other
securities till such a time this recommendation has either been displayed or has been forwarded to clients of Karvy. All employees are further
restricted to place orders only through Karvy Stock Broking Ltd.
The information given in this document on tax are for guidance only, and should not be construed as tax advice. Investors are advised to consult their
respective tax advisers to understand the specific tax incidence applicable to them. We also expect significant changes in the tax laws once the new
Direct Tax Code is in force – this could change the applicability and incidence of tax on investments
Karvy Private Wealth (A division of Karvy Stock Broking Limited) operates from within India and is subject to Indian regulations.
Karvy Stock Broking Ltd. is a SEBI registered stock broker, depository participant having its offices at:
702, Hallmark Business plaza, Sant Dnyaneshwar Marg, Bandra (East), off Bandra Kurla Complex, Mumbai 400 051 .
(Registered office Address: Karvy Stock Broking Limited, “KARVY HOUSE”, 46, Avenue 4, Street No.1, Banjara Hills, Hyderabad 500 034)
SEBI registration No’s:”NSE(CM):INB230770138, NSE(F&O): INF230770138, BSE: INB010770130, BSE(F&O): INF010770131,NCDEX(00236,
NSE(CDS):INE230770138, NSDL – SEBI Registration No: IN-DP-NSDL-247-2005, CSDL-SEBI Registration No:IN-DP-CSDL-305-2005, PMS Registration No.:
INP000001512”
20

Contact Us
Bangalore 080-26606126
Chennai 044-45925923
Coimbatore 0422-4291018
Hyderabad 040-44507282
Kolkata 033-40515100
Mumbai 022-33055000
Gurgaon 0124-4780228
Email: [email protected] SMS: ‘HNI’ to 56767 Website: www.karvywealth.com
Corporate Office : 702, Hallmark Business Plaza, Off Bandra Kurla Complex, Bandra (East), Mumbai – 400 051
Pune 020-30116238
Kochi 0484-2321831
Delhi 011-43533941
21