advances in adolescent substance abuse treatment and research michael dennis, ph.d. chestnut health...
TRANSCRIPT

Advances in Adolescent Substance AbuseTreatment and Research
Michael Dennis, Ph.D.
Chestnut Health Systems,
Bloomington, IL
Presentation for the Adolescent Treatment Initiative, Concord, NH, April 20, 2005. Sponsored by New Futures. The content of this presentations are based on treatment & research funded by the Center for Substance Abuse Treatment (CSAT), Substance Abuse and Mental Health Services Administration (SAMHSA) under contract 270-2003-00006 and several individual grants. The opinions are those of the author and do not reflect official positions of the consortium or government. Available on line at www.chestnut.org/LI/Posters or by contacting Joan Unsicker at 720 West Chestnut, Bloomington, IL 61701, phone: (309) 827-6026, fax: (309) 829-4661, e-Mail: [email protected]

Examine the prevalence, course, and consequences of adolescent substance use and co-occurring disorders
Examine the rates of use, substance use disorders (SUD) and unmet treatment needs in the US and NH
Summarize major trends in the adolescent treatment system
Review the current knowledge base on treatment effectiveness
Examine the results of recent major studies
Examine how characteristics vary by intensity of juvenile justice system involvement
Goals of this Presentation

Relationship between Past Month Substance Use and Age
Source: Dennis (2002) and 1998 NHSDA
0
10
20
30
40
50
60
70
80
90
10012
13
14
15
16
17
18
19
20
21
22-2
3
24-2
5
26-2
9
30-3
4
35-3
9
50-6
4
65 +
Age
Alcohol Use
Tobacco Use
Binge Alcohol use
Any Illicit Drug Use
Marijuana Use

Age of First Use Predicts Dependence an Average of 22 years Later
Source: Dennis, Babor, Roebuck & Donaldson (2002) and 1998 NHSDA

Source: OAS (2004). Results from the 2003 National Survey on Drug Use and Health: National Findings. Rockville, MD: SAMHSA. http://oas.samhsa.gov/nhsda/2k3nsduh/2k3ResultsW.pdf
The Growing Incidence of Adolescent Marijuana Use: 1965-2002
Adult Initiation Relatively Stable
Adolescent Initiation Rising

Importance of Perceived Risk
Source: Office of Applied Studies. (2000). 1998 NHSDA
Mar
ijua
na
Use
Ris
k &
Ava
ilab
ilit
y

Actual Marijuana Risk
From 1980 to 1997 the potency of marijuana in federal drug seizures increased three fold.
The combination of alcohol and marijuana has become very common and appears to be synergistic and leads to much higher rates of problems than would be expected from either alone.
Combined marijuana and alcohol users are 4 to 47 times more likely than non-users to have a wide range of dependence, behavioral, school, health and legal problems.
Marijuana and alcohol are the leading substances mentioned in arrests, emergency room admissions, autopsies, and treatment admissions.

Source: Dennis and McGeary (1999) and 1997 NHSDA
Substance Use in the Community

Consequences of Substance Use
Source: Dennis, Godley and Titus (1999) and 1997 NHSDA

Sour
ce:
D. W
righ
t (20
04).
Sta
te E
stim
ates
of S
ubst
ance
Use
fr
om th
e 20
02 N
atio
nal S
urve
y on
Dru
g U
se a
nd
Hea
lth,
Roc
kvil
le, M
D:
OA
S, S
AM
HSA
ht
tp:/
/oas
.sam
hsa.
gov/
2k2S
tate
/PD
FW
/2k2
SAE
W.p
df
Adolescents with Past Year Alcohol or Other Drug (AOD) Abuse or Dependence
National=8.92%NH=12.21%

Adolescents Needing But Not Receiving Treatment for Alcohol Use
Sour
ce:
D. W
righ
t (20
04).
Sta
te E
stim
ates
of S
ubst
ance
Use
fr
om th
e 20
02 N
atio
nal S
urve
y on
Dru
g U
se a
nd
Hea
lth,
Roc
kvil
le, M
D:
OA
S, S
AM
HSA
ht
tp:/
/oas
.sam
hsa.
gov/
2k2S
tate
/PD
FW
/2k2
SAE
W.p
df
National=5.55%NH=8.24%

Sour
ce:
D. W
righ
t (20
04).
Sta
te E
stim
ates
of S
ubst
ance
Use
fr
om th
e 20
02 N
atio
nal S
urve
y on
Dru
g U
se a
nd
Hea
lth,
Roc
kvil
le, M
D:
OA
S, S
AM
HSA
ht
tp:/
/oas
.sam
hsa.
gov/
2k2S
tate
/PD
FW
/2k2
SAE
W.p
df
Adolescents Needing But Not Receiving Treatment for Illicit Drug Use
National=5.14%NH=6.99%

Rates of Use in NH by Age
18
72
63
12
50
21
15
31
7
11
30
7
7
11
2
0 10 20 30 40 50 60 70 80 90 100
Age 12-17
Age 18-25
Age 26+
Any Alcohol Use
Binge Alcohol Use
Any Past MonthIllicit Drug Use
Any Past MonthMarijuana Use
Any Past MonthIllicit BesideMarijuana
Source: D. Wright (2004). State Estimates of Substance Use from the 2002 National Survey on Drug Use and Health, Rockville, MD: OAS, SAMHSA. http://oas.samhsa.gov/2k2State/PDFW/2k2SAEW.pdf

Rates of SUD and Unmet Tx Need in NH by Age
Source: D. Wright (2004). State Estimates of Substance Use from the 2002 National Survey on Drug Use and Health, Rockville, MD: OAS, SAMHSA. http://oas.samhsa.gov/2k2State/PDFW/2k2SAEW.pdf
12
31
8
8
26
7
7
10
1
0 5 10 15 20 25 30 35
12
30
7
8
26
6
7
10
1
0 5 10 15 20 25 30 35
Age 12-17
Age26+
Age18-25
Abuse or Dependence Unmet Treatment Need
DrugAlcoholEither

Adolescent Treatment Admissions have increased by 50% over the past decade
Source: Office of Applied Studies 1992- 2002 Treatment Episode Data Set (TEDS)http://www.samhsa.gov/oas/dasis.htm
50% higher than in 1992

Change in Primary Substance
Source: OAS 2004, Treatment Episode Data Set (TEDS) 1992-2002. Rockville, MD: SAMHSA. http://www.dasis.samhsa.gov/teds02/2002_teds_rpt.pdf
+317% increase in marijuana
-50% decrease in alcohol
+375% increase in stimulants
-21% decrease in cocaine
+144% increase in opiates

Change in Referral Sources
Source: OAS 2004, Treatment Episode Data Set (TEDS) 1992-2002. Rockville, MD: SAMHSA http://www.dasis.samhsa.gov/teds02/2002_teds_rpt.pdf
JJ referrals have doubled and are driving growth

Primary Substance by Referral Source
Source: OAS 2004, Treatment Episode Data Set (TEDS) 1992-2002. Rockville, MD: SAMHSA http://www.dasis.samhsa.gov/teds02/2002_teds_rpt.pdf
More recent marijuana
referrals driven more by JJ

Severity Varies by Level of Care
0%10%20%30%40%50%60%70%80%90%
100%
Weekly use atintake
Dependence First usedunder age 15
Prior Treatment
Outpatient (n=24704)Intensive Outpatient (n=4024)Detoxification or Hospital (n=2062)
Short Term Residential (n=2046)Long Term Residential (n=3124)
Source: Dennis, Dawud-Noursi, Muck & McDermeit, 2002 and 1998 Treatment Episode Data Set (TEDS)
Severity goes up with level of care
STR clients get there younger and sooner
* Weekly use is the Norm
* 1 in 5 report with no past month use

Key Problems in the System
Less than 1/10th of adolescents with substance dependence problems receive treatment
Less than 50% stay 6 weeks
Less than 75% stay the 3 months recommended by NIDA
Under 25% in Residential Treatment successfully step down to outpatient care
Little is known about the rate of initiation after detention
The size of the NH system is actually coming out of a 7 year decline in admissions
Source: Dennis, Dawud-Noursi, Muck, & McDermeit (Ives), 2002; Godley et al., 2002; Hser et al., 2001; OAS, 2000

NH is also a Heterogeneous Mix of Urban, Small Urban & Rural Systems
1,235,786 people in 9,345 square miles (137.8 people per square mile or ppsm)
Ranges from 18.8 ppsm in Coos County to 434.6 ppsm in Hillsborough County
Approximately 9% age 12-17, 4% age 18-20, 71% age 21+
Source: U.S. Census 2000
<-US avg. 79.6

Pre-2002 Knowledge Base from 36 Studies
9 large multi-site longitudinal studies (ATM, DARP, TOPS, SROS, TCA, NTIES, DATOS-A, DOMS), including 1 large multi-site experiment (Cannabis Youth Treatment - CYT)
24 behavioral treatment studies (12-step, behavioral, family, other outpatient, inpatient, therapeutic communities, engagement, aftercare), including CYT and 1 pharmacology-behavioral (CBT) trial
8 pharmacology treatment studies (bupropion, disulfiram, fluoxetine, lithium, pemoline, sertaline) and 1 pharmacology-behavioral (CBT) trial
Source: Bukstein & Kithas, 2002; Dennis & White (2003), & Lewinsohn et al. 1993; PNLDP, 2003

Key Lessons from Early Literature
Assessment needs to be very concrete Multiple co-occurring problems are the norm in clinical samples
of SUD adolescents (60-80% external disorders, 25-60% mood disorders, 16-45% anxiety disorders, 70-90% 3 or more diagnoses)
Adolescents are involved in multiple systems competing to control their behavior (e.g, family, peers, school, work, criminal justice, and controlled environments)
Relapse is common in the first 3-12 months Recovery often takes multiple attempts and episodes of care that
may take years Improvements generally come during active treatment and are
sustained for 12 or more months Family therapies are associated with less initial change but more
change post active treatment and less relapse

Interventions associated with reduced substance use and problems:
1 experimental and 3 non-experimental studies of 12-step treatment (e.g., CD, Hazelden)
7 experimental studies of behavior therapies (e.g., ACRA, AGT, BTOS, CBT, MET, RP)
8 experimental studies of family therapy (CFT, FDE, FFT, FSN, FST, MDFT, MST, PBFT, TIPS)
6 longitudinal studies of existing outpatient 6 longitudinal studies of existing short term
residential/inpatient 7 longitudinal studies of therapeutic communities (TC) and
other forms of long term residential treatment (LTR)
Another 3 experimental studies have shown that engagement and retention are associated with several interventions (case management, stepping down
residential to OP, assertive aftercare)

Lessons from 9 Pharmacology Studies No controlled trials of medication for treating withdrawal,
substitution therapy, blocking therapy, aversive therapy or management of cravings
– Though NIDA’s Clinical Trials Network (CTN) and Australian researchers are currently studying the effects of Buprenorphine/Naloxone
Most studies of other disorders exclude adolescents with substance use disorders
Small (n of 8-25), short-term (4-12 weeks) studies suggest medication can be used to effectively treat several co-occurring problems:
– Fluoxetine (Prozac®) & Sertaline (Zoloft®) helped reduce depressive symptoms– Lithium carbonate (Eskalith®) reduced bipolar symptoms and positive urine rates– Pemoline (Cylert®) and Bupropion (Wellbutrin®) reduced symptoms of ADHD

Effectiveness was also associated with therapies that technologically were:
manual-guided
had developmentally appropriate materials
involved more quality assurance and clinical supervision
achieved therapeutic alliance and early positive outcomes
successfully engaged adolescents in aftercare, support groups, positive peer reference groups, more supportive recovery environments

Lessons about what did NOT work
Interventions associated with No or Minimal Change: Passive referrals Educational units alone Probation services as usual Early unstandardized outpatient services as usual
Interventions associated with Deterioration: treatment of adolescents in badly managed groups or “groups
including one or more highly deviant individuals” (but NOT! all groups or any CD)
treatment of adolescents in adult units and/or with adult models/materials (particularly outpatient)

Key Points that Have Been Contentious As other therapies have improved, there is no longer the clear advantage of
family therapy found in early literature reviews While there have been concerns about the potential iatrogenic effects of
group therapy, the rates do not appear to be appreciably different from individual or family therapy if it is done well (important since group tx typically costs less)
Effectiveness was not consistently associated with the amount of therapy over a short period of time (6-12 weeks) but was related to longer term continuing care
Over time, adolescents regularly cycle between use, treatment, incarceration and recovery
Treatment primarily impacts the short term movement from use to non use in the community
The long term effectiveness of therapy was dependent on changes in the long term recovery environment and social risk

Limitations of the Early Literature Small sample sizes (most under 50)
High rates (30-50%) of refusals by eligible people
Unstandardized measures, no measures of abuse or dependence, no measures of co-morbidity, crime or violence (just arrest)
Unstandardized and minimally-supervised therapies (making replication very difficult)
Minimal information on services received
High rates (20-50%) of treatment dropout
High rates of attrition from follow-up (25-54%) leading to potentially large (unknown) bias

Studies are Improving! New studies are likely to have higher rates of participation (70-
90%), treatment completion (70-85%), and successful follow-up (85-95%)
They are more likely to involve standardized assessments, manual-guided therapy, and better quality assurance/clinical supervision
They have experimental design, multiple time points of assessment and follow-up lasting 1 or more years
They include economic analysis of their costs, cost-effectiveness and benefit cost
They have agreed to pool their data to facilitate further comparisons and secondary analysis

Studies by Date of First Publication
From 1998 to 2002 the number of adolescent treatment studies doubled and has doubled again in the past 2 years – with twice this many published in the past 2 years and over 100 adolescent treatment studies currently in the field
Source: Dennis &, White (2003) at www.drugstrategies.org

Studies with Publications Currently Coming Out 1994-2000 NIDA’s Drug Abuse Treatment Outcome Study of
Adolescents (DATOS-A) 1995-1997 Drug Abuse Treatment Outcome Study (DOMS) 1997-2000 CSAT’s Cannabis Youth Treatment (CYT) experiments 1998-2003 NIAAA/CSAT’s 14 individual research grants 1998-2003 CSAT’s 10 Adolescent Treatment Models (ATM) 2000-2003 CSAT’s Persistent Effects of Treatment Study (PETS-A) 2002-2007 CSAT’s 12 Strengthening Communities for Youth (SCY) 2002-2007 RWJF’s 10 Reclaiming Futures (RF) diversion projects 2002-2007 CSAT’s 12+ Targeted Capacity Expansion TCE/HIV 2003-2009 NIDA’s 12 individual research grants 2003-2006 CSAT’s 17 Adolescent Residential Treatment (ART) 2003-2008 NIDA’s Criminal Justice Drug Abuse Treatment Study
(CJ-DATS) 2003-2007 CSAT’s 36 Effective Adolescent Treatment (EAT) 2004-2007 NIAAA/CSAT’s study of diffusion of innovation
Full ( ) or Partial ( ) use of the Global Appraisal of Individual Needs (GAIN)

Source: www.chestnut.org/li/apss
NIAAA/NIDA Other Grantees
CSAT
Cannabis Youth Treatment (CYT)Adolescent Treatment Model (ATM)Strengthening Communities for Youth (SCY)Adolescent Residential Treatment (ART)Effective Adolescent Treatment (EAT)
Targeted Capacity Expansion (TCE) grants
Other CollaboratorsRWJF Reclaiming Futures ProgramOther RWJF Grantees
Other Grants/Contracts
Co-occurring Disorder Studies
Young Offender Re-Entry Program (YORP)
Adolescent Treatment Program GAIN Clinical Collaborators
State, County, or Agency-wide systems(also negotiating with 12 states/counties)

Since 1997, the data has been pooled to create one of the largest benchmark data sets in the field
17,464
32,054
57,360
0
10,000
20,000
30,000
40,000
50,000
60,000
70,000
80,000
90,000
Cu
mul
ativ
e G
AIN
In
terv
iew
s(o
bse
rvat
ion
s)
Prior to FY2003
FY2004 FY2005 FY2006
Largest Combined Adolescent Data Set
~ Half of all Adolescent
Treatment Data
One of the Largest Data Sets in the Field with
1+ year follow-up (2nd only to ASI)
74,670..and we are still growing


Normal Adolescent Development
Biological changes in the body, brain, and hormonal systems that continue into mid-to-late 20s.
Shift from concrete to abstract thinking. Improvements in the ability to link causes and
consequences (particularly strings of events over time). Separation from a family-based identity and the
development of peer- and individual-based identities. Increased focus on how one is perceived by peers. Increasing rates of sensation seeking/trying new things. Development of impulse control and coping skills. Concerns about avoiding emotional or physical violence.

Key Adaptation for Adolescents
Examples need to be altered to relevant substances, situations, and triggers
Consequences have to be altered to things of concern to adolescents
Most adolescents do not recognize their substance use as a problem and are being mandated to treatment
All materials need to be converted from abstract to concrete concepts
Co-morbid problems (mental, trauma, legal) are the norm and often predate substance use
Treatment has to take into account the multiple systems (family, school, welfare, criminal justice)
Less control of life and recovery environment
Less aftercare and social support
Complicated staffing needs

Length of Stay Varies by Level of Care
Source: Adolescent Treatment Model (ATM) Data
0%
50%
100%0 30 60 90 120
150
180
210
240
270
300
330
360
390
Length of Stay
Perc
ent S
till
in T
reat
men
t
Long Term Residential (median=155 days; n=222)
Short Term Residential (median=40 days; n=589)
Outpatient (median= 213 days; n=47)

Adolescents often go through multiple levels of care
Source: Adolescent Treatment Model (ATM) Data
0%
50%
100%0 30 60 90 120
150
180
210
240
270
300
330
360
390
Length of Stay
Perc
ent S
till i
n T
reat
men
t
Index Episode of Care (median=52 days; n=1380)
System Episode of Care (median=73 days; n=1380)
Length of Stay Across Episodes of care is about 50% longer

Program Evaluation Data
Level of Care Clinics Adolescents 1+ FU*
Outpatient/ Intensive Outpatient (OP/IOP)
8 560 96%
Long Term Residential (LTR)**
4 390 98%
Short Term Residential (STR)**
4 594 97%
Total 16 1544 97%
* Completed follow-up calculated as 1+ interviews over those due-done, with site varying between 2-4 planned follow-up interviews. Of those due and alive, 89% completed with 2+ follow-ups, 88% completed 3+ and 78% completed 4.
** Both LTR and STR include programs using CD and therapeutic community models

Years of Use
Source: Adolescent Treatment Model (ATM) data
3 0 1
3127
19
3339 37
33 33
43
0
10
20
30
40
50
60
70
80
90
100
OP/IOP (n=560) LTR (n=390) STR (n=594)
Less than 1 1-2 years 3-4 years 5 or more years

Patterns of Weekly (13+/90) Use
Source: Adolescent Treatment Model (ATM) data
61
71
83
56 57
72
20
29
43
4 714
1 49
0
20
40
60
80
100
OP/IOP (n=560) LTR (n=390) STR (n=594)
Weekly use of anything Weekly Marijuana Use
Weekly Alcohol Use Weekly Crack/Cocaine Use
Weekly Heroin/Opioid Use
7
21 17
Weekly Other Drug Use
29
4441
13+ Days in Controlled Environment

Substance Use Severity
Source: Adolescent Treatment Model (ATM) data
71
93
62
70
89
2925
7
35
27
10
75
0
10
20
30
40
50
60
70
80
90
100
OP/IOP (n=560) LTR (n=390) STR (n=594)
Lifetime Substance Dependence Past year Dependence
Lifetime Substance Abuse Past year Abuse

Change in Substance Frequency Indexby Level of Care\a
\a Source: Adolescent Treatment Model (ATM) data; Levels of care coded as Long Term Residential (LTR, n=390), Short Term Residential (STR, n=594), Outpatient/Intensive and Outpatient (OP/IOP, n=560);. T scores are normalized on the ATM outpatient intake mean and standard deviation. Significance (p<.05) marked as \t for time effect, \s for site effect, and \ts for time x site effect.
40
50
60
Intake 3 6 9 12
Months from Intake
STR\t,s,ts
LTR\t,ts
OP\t,s,ts

Change in Substance Problem Indexby Level of Care\a
\a Source: Adolescent Treatment Model (ATM) data; Levels of care coded as Long Term Residential (LTR, n=390), Short Term Residential (STR, n=594), Outpatient/Intensive and Outpatient (OP/IOP, n=560);. T scores are normalized on the ATM outpatient intake mean and standard deviation. Significance (p<.05) marked as \t for time effect, \s for site effect, and \ts for time x site effect.
Change in Substance Problem Index Past Month T-Score (TSPIM) by Level of Care\a
40
50
60
Intake 3 6 9 12
Months from Intake
STR\t,s,ts
LTR\t,s,ts
OP\t,s,ts

Percent in Recovery (no past month use or problems while living in the community)
\a Source: Adolescent Treatment Model (ATM) data; Levels of cares coded as Long Term Residential (LTR, n=390), Short Term Residential (STR, n=594), Outpatient/Intensive and Outpatient (OP/IOP, n=560);. T scores are normalized on the ATM outpatient intake mean and standard deviation. Significance (p<.05) marked as \t for time effect, \s for site effect, and \ts for time x site effect.
0%
20%
40%
60%
80%
100%
Intake 3 6 9 12
Months from Intake
STR\t,s,ts
LTR\t,ts
OP\t,s

Multiple Co-occurring Problems Were the Norm and Increased with Level of Care
Source: CSAT’s Cannabis Youth Treatment (CYT) and Adolescent Treatment Model (ATM),
44
2125
21
70
47 43
7880
65
88
56
3635
68
445252
0
20
40
60
80
100
ConductDisorder
ADHD MajorDepressiveDisorder
GeneralizedAnxietyDisorder
TraumaticStress
Disorder
Any Co-OccurringDisorder
Outpatient Long Term Residential Short Term Residential

Change in Emotional Problem Indexby Level of Care\a
\a Source: Adolescent Treatment Model (ATM) data; Levels of care coded as Long Term Residential (LTR, n=390), Short Term Residential (STR, n=594), Outpatient/Intensive and Outpatient (OP/IOP, n=560);. T scores are normalized on the ATM outpatient intake mean and standard deviation. Significance (p<.05) marked as \t for time effect, \s for site effect, and \ts for time x site effect.
40
50
60
Intake 3 6 9 12
Months from Intake
STR\t,s,ts
LTR\t,s,ts
OP\t,s

Pattern of SA Outcomes is Related to the Pattern of Psychiatric Multi-morbidity
Source: Shane et al 2003, PETSA data
Months Post Intake (Residential only)0 3 6 12
Nu
mb
er o
f P
ast
Mon
th S
ub
stan
ce P
rob
lem
s
2+ Co-occurring 1 Co-occurring No Co-occurring
Multi-morbid Adolescents start the highest, change the most, and relapse the most

High Rates of Victimization are the Norm
Source: Adolescent Treatment Model (ATM) data
71
82 84
52
6973
45
5662
2519
37
0
10
20
30
40
50
60
70
80
90
100
OP/IOP (n=560) LTR (n=390) STR (n=594)
Lifetime History of Victimization Acute Victimization
Past Year Victimization Past 90 Day Victimization

Victimization Is Related to Severity
Source: Titus, Dennis, et al., 2003
-0.4
-0.3
-0.2
-0.1
0
0.1
0.2
0.3
0.4
SubstanceFrequency
Index(SFI6P; f=.13)
SubstanceProblem Index(SPI16; f=.21)
General MentalDistress Index(GMDI; f=.32)
Traumatic Stress Index
(TSI; f=.25)
GeneralConflict Tactic
Index(GCTI; f=.20)
Eff
ect S
ize
(f)
High (n=102)Moderate (31)Low (n=80)
Use goes up with
Moderate Victim.
Pathology goes up
with High Victim.

Victimization Also Interacts with Level of Care to Predict SA Outcomes
Source: Funk, et al., 2003
0
5
10
15
20
25
30
35
40
Intake 6 Months Intake 6 Months
Mar
ijua
na U
se (
Day
s of
90)
OP -Acute OP - Low/Cl. Resid-Acute Resid - Low/Cl.
Outpatient Residential Traumatized groups have higher severity
Acute trauma group does not respond to OP
Both groups respond to residential treatment

Broad Range of Past Year Illegal Activity
Source: Adolescent Treatment Model (ATM) data
7478
82
69 7168
86
65
8580 81 81
939395
0
10
20
30
40
50
60
70
80
90
100
OP/IOP (n=560) LTR (n=390) STR (n=594)
Any illegal activity Property crimes Interpersonal crimes
Drug related crimes Acts of physical violence
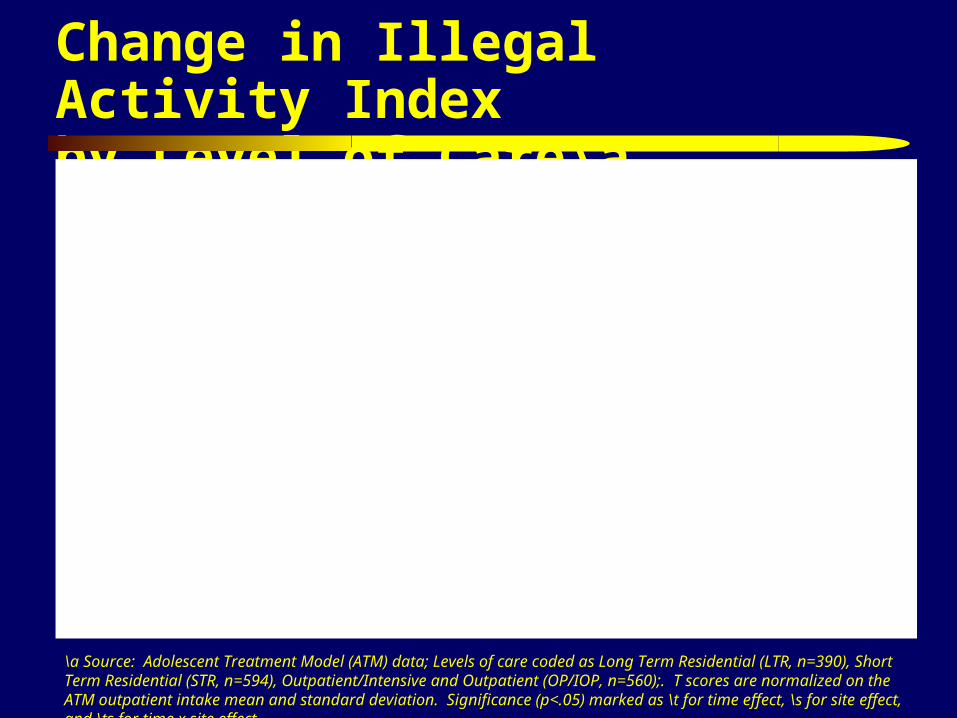
Change in Illegal Activity Indexby Level of Care\a
\a Source: Adolescent Treatment Model (ATM) data; Levels of care coded as Long Term Residential (LTR, n=390), Short Term Residential (STR, n=594), Outpatient/Intensive and Outpatient (OP/IOP, n=560);. T scores are normalized on the ATM outpatient intake mean and standard deviation. Significance (p<.05) marked as \t for time effect, \s for site effect, and \ts for time x site effect.
40
50
60
Intake 3 6 9 12
Months from Intake
STR\t,s,ts
LTR\t,ts
OP\s

0%
10%
20%
30%
40%
50%
60%
70%
80%
90%
100%
Low (n=150) Moderate (n=158) High (n=216)
No crime
Incarcerated
Substance Use only
Non-violent crime
Violent crimeX2(8)=18.36, p<.05
GAIN’s Crime and Violence Scale at Intake can predict 30 Months Recidivism
Odds of committing
violent crime 4.5
times higherSource: White et al (2003), PETSA

Crime/Violence and Substance Problems Interact to Predict Recidivism
Low
Mod.
High
LowMod
.High0%
20%
40%
60%
80%
100%
Substance Problem Scale(Abuse/Dependence symptoms)
Crime and Violence
Scale
Source: Dennis et al 2004
Pro
babi
lity
of
12 m
onth
rec
idiv
ism
The probability of committing
another crime goes up with
the CVS score
The probability of committing another crime
goes up with the SPS score
Knowing both is the best predictor

Findings from the Assertive Continuing Care (ACC)
Experiment
183 adolescents admitted to residential substance abuse treatment
Treated for 30-90 days inpatient, then discharged to outpatient treatment
Random assignment to usual continuing care (UCC) or “assertive continuing care” (ACC)
Source: Godley et al 2002

Assertive Continuing Care (ACC) Enhancements
Continue to participate in UCC
Home Visits
Sessions for adolescent, parents, and together
Sessions based on ACRA manual (Godley, Meyers et al., 2001)
Case Management based on ACC manual (Godley et al, 2001) to assist with other issues (e.g., job finding, medication evaluation)

Assertive Continuing Care (ACC)Hypotheses
Assertive Continuin
g Care
General Continuin
g Care Adherence
Relative to UCC, ACC will increase General Continuing Care Adherence (GCCA)
Early Abstinence
GCCA (whether due to UCC or ACC) will be associated with higher rates of early abstinence
Sustained Abstinence
Early abstinence will be associated with higher rates of long term abstinence.

Usual Continuing Care (UCC): Expectation vs. Performance
Source: Godley et al 2002
0% 10%
20%
30%
40%
50%
60%
70%
80%
90%
100%
0% 10%
20%
30%
40%
50%
60%
70%
80%
90%
100%
Expected
Weekly Tx Weekly 12 step meetings
Regular urine tests
Contact w/probation/school
Follow up on referrals
Relapse prevention
Communication skills training
Problem solving component
Meet with parents 1-2x month
Weekly telephone contact
Referrals to other services
Discuss probation/school compliance
Adherence: Meets 7/12 criteria
UCC

ACC Improved Adherence
Source: Godley et al 2002, forthcoming
0% 10%
20%
30%
40%
50%
60%
70%
80%
Weekly Tx Weekly 12 step meetings
Regular urine tests
Contact w/probation/school
Follow up on referrals*
ACC * p<.05
90%
100%
Relapse prevention*
Communication skills training*
Problem solving component*
Meet with parents 1-2x month*
Weekly telephone contact*
Referrals to other services*
Discuss probation/school compliance*
Adherence: Meets 7/12 criteria*
UCC

GCCA Improved Early (0-3 mon.) Abstinence
Source: Godley et al 2002, forthcoming
24%
36% 38%
0%
10%
20%
30%
40%
50%
60%
70%
80%
90%
100%
Any AOD (OR=2.16*) Alcohol (OR=1.94*) Marijuana (OR=1.98*)
Low (0-6/12) GCCA
43%
55% 55%
High (7-12/12) GCCA * p<.05

Early (0-3 mon.) Abstinence Improved Sustained (4-9 mon.) Abstinence
Source: Godley et al 2002, forthcoming
19% 22% 22%
0%
10%
20%
30%
40%
50%
60%
70%
80%
90%
100%
Any AOD (OR=11.16*) Alcohol (OR=5.47*) Marijuana (OR=11.15*)
Early(0-3 mon.) Relapse
69%
59%
73%
Early (0-3 mon.) Abstainer * p<.05

Next Steps for ACC
Preliminary findings and manual published, main findings under review
Currently in use in eight clinical sites
ACC 2 experiment is currently testing– the ACC intervention model in a multi-site trial – whether or not participants get contingency
management (CM) alone or with ACC– CM is targeted at reducing use and increasing
prosocial activities

Secondary Analysis by Intensity of Juvenile Justice System Involvement
0% 10% 20% 30% 40% 50% 60% 70% 80% 90% 100%
Severity
Detention 14+ days (n=433)
Probation/parole and urine monitoring 14+ days (n=472)
Other current arrest or JJ status (n=303)
Other detention, parole, or probation (n=374)
Past arrest or JJ status (n=170)
Past year illegal activity (n=298)
Source: CYT & ATM Data
LowHi

Intensity by Level of Care
0% 10% 20% 30% 40% 50% 60% 70% 80% 90% 100%
Short Term Residential
Long Term Residential
Outpatient/IOP
Step Down OP
Total
Detention 14+ days (n=433) Probation/parole and urine monitoring 14+ days (n=472)Other detention, parole, or probation (n=374) Other current arrest or JJ status (n=303)Past arrest or JJ status (n=170) Past year illegal activity (n=298)
Source: CYT & ATM Data

Intensity by Demographics
Detention 14+ days (n=433) Probation/parole and urine monitoring 14+ days (n=472)Other detention, parole, or probation (n=374) Other current arrest or JJ status (n=303)Past arrest or JJ status (n=170) Past year illegal activity (n=298)
Source: CYT & ATM Data
0%
10%
20%
30%
40%
50%
60%
70%
80%
90%
100%
Female Caucasian AfricanAmerican
Hispanic NativeAmerican
Other
Females and Caucasians more likely in lower
intensityMinorities More
Likely to be in higher intensity

Intensity by Demographics (continued)
Detention 14+ days (n=433) Probation/parole and urine monitoring 14+ days (n=472)Other detention, parole, or probation (n=374) Other current arrest or JJ status (n=303)Past arrest or JJ status (n=170) Past year illegal activity (n=298)
Source: CYT & ATM Data
0%
10%
20%
30%
40%
50%
60%
70%
80%
90%
100%
Age 11-15 Years Age 15-17 Years Age 18+ Years Single Parent
High Severity More likely to be 15-17 years olds and
from Single Parent FamiliesLow Intensity More Likely to
be Still Committing
Crime

Intensity by Substance Use Disorder Diagnosis
Detention 14+ days (n=433) Probation/parole and urine monitoring 14+ days (n=472)Other detention, parole, or probation (n=374) Other current arrest or JJ status (n=303)Past arrest or JJ status (n=170) Past year illegal activity (n=298)
Source: CYT & ATM Data; a\ Self report for past year
0%
10%
20%
30%
40%
50%
60%
70%
80%
90%
100%
Any Substance Disorder Dependence Abuse
Current Intensity Inversely related to Substance Use Severity
Past Involvement a Mix of Severity

Intensity by External Diagnoses
Detention 14+ days (n=433) Probation/parole and urine monitoring 14+ days (n=472)Other detention, parole, or probation (n=374) Other current arrest or JJ status (n=303)Past arrest or JJ status (n=170) Past year illegal activity (n=298)
Source: CYT & ATM Data
0%
10%
20%
30%
40%
50%
60%
70%
80%
90%
100%
Any External Conduct Disorder ADHD

Intensity by Internal Diagnoses/Problems
Detention 14+ days (n=433) Probation/parole and urine monitoring 14+ days (n=472)Other detention, parole, or probation (n=374) Other current arrest or JJ status (n=303)Past arrest or JJ status (n=170) Past year illegal activity (n=298)
Source: CYT & ATM Data \b n=1838 because some sites did not ask trauma questions
0%
10%
20%
30%
40%
50%
60%
70%
80%
90%
100%
Any Internal
Major Depression
SuicideIdeation
GeneralizedAnxiety
TraumaRelated
Curvilinear Relationship between Intensity and Internal Distress

Intensity by Pattern of Co-occurring Disorders
Detention 14+ days (n=433) Probation/parole and urine monitoring 14+ days (n=472)Other detention, parole, or probation (n=374) Other current arrest or JJ status (n=303)Past arrest or JJ status (n=170) Past year illegal activity (n=298)
Source: CYT & ATM Data
0%
10%
20%
30%
40%
50%
60%
70%
80%
90%
100%
None Internal Only External Only Both
Most Internal Distress is Multi-morbid with External (and Substance Use) Disorders

Intensity by Other Common Problems
Detention 14+ days (n=433) Probation/parole and urine monitoring 14+ days (n=472)Other detention, parole, or probation (n=374) Other current arrest or JJ status (n=303)Past arrest or JJ status (n=170) Past year illegal activity (n=298)
Source: CYT & ATM Data
0%
10%
20%
30%
40%
50%
60%
70%
80%
90%
100%
AnyVictimization
High levels ofVictimization
Any Crime
High Crime/Violence
Homeless orRunaway
High HealthProblems
Focus of JJ Detention

Concluding Comments
We are entering a renaissance of new knowledge in this area, but are only reaching 1 of 10 in need
Several interventions work, but 2/3 of the adolescents are still having problems 12 months later
We need to move beyond focusing on minor variations in therapy (behavioral brand names) and acute episodes of care to focus on continuing care and a recovery management paradigm
It is very difficult to predict exactly who will relapse so it is essential to conduct aftercare monitoring with all adolescents
Juvenile justice referrals are a central factor in recent growth of the adolescent treatment system and the intensity of JJ involvement is correlated with clinical severity

Resources Copy of these slides and handouts
– http://www.chestnut.org/LI/Posters/
Assessment Instruments – CSAT TIP 3 at http://www.athealth.com/practitioner/ceduc/health_tip31k.html– NIAAA Assessment Handbook,http://www.niaaa.nih.gov/publications/instable.htm – GAIN Coordinating Center www.chestnut.org/li/gain
Adolescent Treatment Manuals– CSAT CYT, ATM, ACC and other manuals at www.chestnut.org/li/apss/csat/protocols or
www.chestnut.org/li/bookstore– SAMHSA at http://kap.samhsa.gov/products/manuals/cyt/index.htm or NCADI at www.health.org
Adolescent Treatment Programs and Studies – List of programs by state and summary of pre-2002 studies at www.drugstrategies.com – Cannabis Youth Treatment (CYT) : www.chestnut.org/li/cyt – Persistent Effects of Treatment Study of Adolescents (PETSA):
www.samhsa.gov/centers/csat/csat.html (then select PETS from program resources)– Adolescent Program Support Site (APSS): www.chestnut.org/li/apss
Society for Adolescent Substance Abuse Treatment Effectiveness (SASATE)– Website at www.chestnut.org/li/apss/sasate with bibliography – E-mail Darren Fulmore <[email protected]> to be added to list server– Next conference is March 21-23, 2005, See website or E-mail Darren for information about
meeting

ReferencesBabor, T. F., Webb, C. P. M., Burleson, J. A., & Kaminer, Y. (2002). Subtypes for classifying adolescents with marijuana use disorders Construct
validity and clinical implications. Addiction, 97(Suppl. 1), S58-S69.
Buchan, B. J., Dennis, M. L., Tims, F. M., & Diamond, G. S. (2002). Cannabis use Consistency and validity of self report, on-site urine testing, and laboratory testing. Addiction, 97(Suppl. 1), S98-S108.
Bukstein, O.G., & Kithas, J. (2002) Pharmacologic treatment of substance abuse disorders. In Rosenberg, D., Davanzo, P., Gershon, S. (Eds.), Pharmacotherapy for Child and Adolescent Psychiatric Disorders, Second Edition, Revised and Expanded. NY, NY: Marcel Dekker, Inc.
Dennis, M.L., (2002). Treatment Research on Adolescents Drug and Alcohol Abuse: Despite Progress, Many Challenges Remain. Connections, May, 1-2,7, and Data from the OAS 1999 National Household Survey on Drug Abuse
Dennis, M.L. (2004). Traumatic victimization among adolescents in substance abuse treatment: Time to stop ignoring the elephant in our counseling rooms. Counselor, April, 36-40.
Dennis, M.L., & Adams, L. (2001). Bloomington Junior High School (BJHS) 2000 Youth Survey: Main Findings. Bloomington, IL: Chestnut Health Systems
Dennis, M. L., Babor, T., Roebuck, M. C., & Donaldson, J. (2002). Changing the focus The case for recognizing and treating marijuana use disorders. Addiction, 97 (Suppl. 1), S4-S15.
Dennis, M.L., Dawud-Noursi, S., Muck, R., & McDermeit, M. (2003). The need for developing and evaluating adolescent treatment models. In S.J. Stevens & A.R. Morral (Eds.), Adolescent substance abuse treatment in the United States: Exemplary Models from a National Evaluation Study (pp. 3-34). Binghamton, NY: Haworth Press and 1998 NHSDA.
Dennis, M. L., Godley, S. H., Diamond, G., Tims, F. M., Babor, T., Donaldson, J., Liddle, H., Titus, J. C., Kaminer, Y., Webb, C., Hamilton, N., & Funk, R. (2004). The Cannabis Youth Treatment (CYT) Study: Main Findings from Two Randomized Trials. Journal of Substance Abuse Treatment, 27, 197-213.
Dennis, M. L., Godley, S. and Titus, J. (1999). Co-occurring psychiatric problems among adolescents: Variations by treatment, level of care and gender. TIE Communiqué (pp. 5-8 and 16). Rockville, MD: Substance Abuse and Mental Health Services Administration, Center for Substance Abuse Treatment.
Dennis, M. L., Perl, H. I., Huebner, R. B., & McLellan, A. T. (2000). Twenty-five strategies for improving the design, implementation and analysis of health services research related to alcohol and other drug abuse treatment. Addiction, 95, S281-S308.
Dennis, M. L. and McGeary, K. A. (1999). Adolescent alcohol and marijuana treatment: Kids need it now. TIE Communiqué (pp. 10-12). Rockville, MD: Substance Abuse and Mental Health Services Administration, Center for Substance Abuse Treatment.
References - continuedDennis, M. L., Titus, J. C., Diamond, G., Donaldson, J., Godley, S. H., Tims, F., Webb, C., Kaminer, Y., Babor, T., Roebeck, M. C., Godley, M.
D., Hamilton, N., Liddle, H., Scott, C., & CYT Steering Committee. (2002). The Cannabis Youth Treatment (CYT) experiment Rationale, study design, and analysis plans. Addiction, 97, 16-34..
Dennis, M. L., Titus, J. C., White, M., Unsicker, J., & Hodgkins, D. (2003). Global Appraisal of Individual Needs (GAIN) Administration guide for the GAIN and related measures. (Version 5 ed.). Bloomington, IL Chestnut Health Systems. Retrieve from http//www.chestnut.org/li/gain
Dennis, M.L., & White, M.K. (2003). The effectiveness of adolescent substance abuse treatment: a brief summary of studies through 2001, (prepared for Drug Strategies adolescent treatment handbook). Bloomington, IL: Chestnut Health Systems. [On line] Available at http://www.drugstrategies.org
Dennis, M. L. and White, M. K. (2004). Predicting residential placement, relapse, and recidivism among adolescents with the GAIN. Poster presentation for SAMHSA's Center for Substance Abuse Treatment (CSAT) Adolescent Treatment Grantee Meeting; Feb 24; Baltimore, MD. 2004 Feb.
Diamond, G., Leckrone, J., & Dennis, M. L. (In press). The Cannabis Youth Treatment study Clinical and empirical developments. In R. Roffman, & R. Stephens, (Eds.) Cannabis dependence Its nature, consequences, and treatment . Cambridge, UK Cambridge University Press.
Diamond, G., Panichelli-Mindel, S. M., Shera, D., Dennis, M. L., Tims, F., & Ungemack, J. (in press). Psychiatric syndromes in adolescents seeking outpatient treatment for marijuana with abuse and dependency in outpatient treatment. Journal of Child and Adolescent Substance Abuse.
French, M.T., Roebuck, M.C., Dennis, M.L., Diamond, G., Godley, S.H., Tims, F., Webb, C., & Herrell, J.M. (2002). The economic cost of outpatient marijuana treatment for adolescents: Findings from a multisite experiment. Addiction, 97, S84-S97.
French, M. T., Roebuck, M. C., Dennis, M. L., Diamond, G., Godley, S. H., Liddle, H. A., and Tims, F. M. (2003). Outpatient marijuana treatment for adolescents Economic evaluation of a multisite field experiment. Evaluation Review,27(4)421-459.
Funk, R. R., McDermeit, M., Godley, S. H., & Adams, L. (2003). Maltreatment issues by level of adolescent substance abuse treatment The extent of the problem at intake and relationship to early outcomes. Journal of Child Maltreatment, 8, 36-45.
Godley, S. H., Dennis, M. L., Godley, M. D., & Funk, R. R. (2004). Thirty-month relapse trajectory cluster groups among adolescents discharged from outpatient treatment. Addiction, 99 (s2), 129-139,
Godley, M. D., Godley, S. H., Dennis, M. L., Funk, R., & Passetti, L. (2002). Preliminary outcomes from the assertive continuing care experiment for adolescents discharged from residential treatment. Journal of Substance Abuse Treatment, 23, 21-32.
Godley, S. H., Jones, N., Funk, R., Ives, M., and Passetti, L. L. (2004). Comparing Outcomes of Best-Practice and Research-Based Outpatient Treatment Protocols for Adolescents. Journal of Psychoactive Drugs, 36, 35-48.
Godley, M. D., Kahn, J. H., Dennis, M. L., Godley, S. H., & Funk, R. R. (2005). The stability and impact of environmental factors on substance use and problems after adolescent outpatient treatment. Psychology of Addictive Behaviors.

References - continuedHser, Y., Grella, C. E., Hubbard, R. L., Hsieh, S. C., Fletcher, B. W., Brown, B. S., & Anglin, M. D. (2001). An evaluation of drug treatments for adolescents in
four U.S. cities. Archives of General Psychiatry, 58, 689-695.Lewinsohn, P.M., Hops, H., Roberts, R.E., Seeley, J.R., Andrews, J.A. (1993). Adolescent psychopathology, I: prevalence and incidence of depression and other
DSM-III-R disorders in high school students. J Abn Psychol, 102, 133-144. National Academy of Sciences (1994). Reducing risks for mental disorders: Frontiers for preventive intervention research. Washington, DC: National Academy
Press.Office of Applied Studies. (2000). National Household Survey on Drug Abuse: Main Findings 1998. Rockville, MD: Substance Abuse and Mental Health Services
Administration. Retrieved, from http://www.samhsa.gov/statistics.Office of Applied Studies (OAS) (1999). Treatment Episode Data Set (TEDS) 1992-1997: National admissions to substance abuse treatment services. Rockville,
MD: Author. [Available online at <http://www.icpsr.umich.edu/SAMHDA>.]Office of Applied Studies (OAS) (2000). Treatment Episode Data Set (TEDS) 1993-1998: National admissions to substance abuse treatment services. Rockville,
MD: Author. [Available on line at <http://www.icpsr.umich.edu/SAMHDA.html>.]Office of Applied Studies. (2000). National Household Survey on Drug Abuse: Main Findings 1998. Rockville, MD: Substance Abuse and Mental Health Services
Administration. Retrieved, from http://www.samhsa.gov/statisticsOffice of Applied Studies 1992- 2002 Treatment Episode Data Set (TEDS) retrived fromhttp://www.samhsa.gov/oas/dasis.htmPhysician Leadership on National Drug Policy (PNLDP, 2002) Adolescent Substance Abuse: A Public Health Priority. Providence, RI: Brown University.
Retrieved from http://www.plndp.org/Physician_Leadership/Resources/resources.htmlShane, P., Jasiukaitis, P., & Green, R. S. (2003). Treatment outcomes among adolescents with substance abuse problems: The relationship between comorbidities
and post-treatment substance involvement. Evaluation and Program Planning, 26, 393-402.Tims, F. M., Dennis, M. L., Hamilton, N., Buchan, B. J., Diamond, G. S., Funk, R., & Brantley, L. B. (2002). Characteristics and problems of 600 adolescent
cannabis abusers in outpatient treatment . Addiction, 97, 46-57.Titus, J. C., Dennis, M. L., White, W. L., Scott, C. K., & Funk, R. R. (2003). Gender differences in victimization severity and outcomes among adolescents treated
for substance abuse. Journal of Child Maltreatment, 8, 19-35.
White, M. K., Funk, R., White, W., & Dennis, M. (2003). Predicting violent behavior in adolescent cannabis users The GAIN-CVI. Offender Substance Abuse Report, 3(5), 67-69.
White, M. K., White, W. L., & Dennis, M. L. (2004). Emerging models of effective adolescent substance abuse treatment. Counselor, 5(2), 24-28.
D. Wright (2004). State Estimates of Substance Use from the 2002 National Survey on Drug Use and Health. Rockville, MD: OAS, SAMHSA. http://oas.samhsa.gov/2k2State/PDFW/2k2SAEW.pdf