advanced math topics
DESCRIPTION
Advanced Math Topics. Chapter 2 Review Olympics. Terms to Know. A group that represents the entire population fairly. Random Samples-. Frequency Distribution-. Ordering data into intervals and their corresponding freq. Interval width-. - PowerPoint PPT PresentationTRANSCRIPT

Advanced Math TopicsAdvanced Math Topics
Chapter 2 Review OlympicsChapter 2 Review Olympics
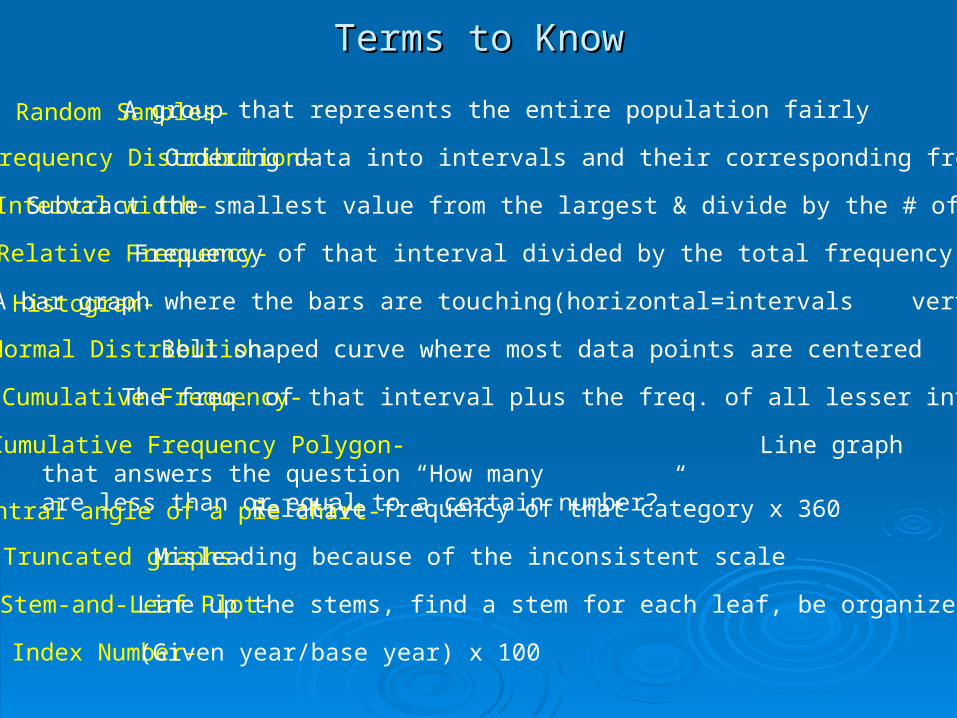
Terms to KnowTerms to Know
Random Samples- A group that represents the entire population fairly
Frequency Distribution- Ordering data into intervals and their corresponding freq.
Relative Frequency- Frequency of that interval divided by the total frequency
Interval width- Subtract the smallest value from the largest & divide by the # of intervals
Histogram- A bar graph where the bars are touching(horizontal=intervals vert. = freq.
Normal Distribution- Bell shaped curve where most data points are centered
Cumulative Frequency Polygon- Line graph that answers the question “How manyare less than or equal to a certain number?”
Cumulative Frequency-The freq. of that interval plus the freq. of all lesser intervals
Central angle of a pie chart- Relative frequency of that category x 360
Truncated graphs- Misleading because of the inconsistent scale
Stem-and-Leaf Plot- Line up the stems, find a stem for each leaf, be organized
Index Number-(Given year/base year) x 100

Take a look at the back wall to see your row Take a look at the back wall to see your row #.#.

World PopulationWorld PopulationContinentContinent Population Population
(millions)(millions)
AfricaAfrica 513513
AsiaAsia 27302730
EuropeEurope 489489
South South AmericaAmerica
390390
North North AmericaAmerica
429429
AntarcticaAntarctica 2424
AustraliaAustralia 272272
1) Find the relative frequency of a) Asia and b) Antarctica to the nearest %.

World PopulationWorld PopulationContinentContinent Population Population
(millions)(millions)
AfricaAfrica 513513
AsiaAsia 27302730
EuropeEurope 489489
South South AmericaAmerica
390390
North North AmericaAmerica
429429
AntarcticaAntarctica 2424
AustraliaAustralia 272272
2) If you were making a pie chart of the data, find the central angle, to the nearest degree, of a) North America and b) Australia.

Number of Rooms Rented Daily at Number of Rooms Rented Daily at the Courtyard by Marriottthe Courtyard by Marriott
IntervalInterval FrequencyFrequency
50-5950-59 1717
60-6960-69 1212
70-7970-79 99
80-8980-89 2222
90-9990-99 2525
100-109100-109 1313
3) Find the cumulative frequency of the interval a) 70-79 and the interval b) 90-99.

Number of Rooms Rented Daily at Number of Rooms Rented Daily at the Courtyard by Marriottthe Courtyard by Marriott
IntervalInterval FrequencyFrequency
50-5950-59 1717
60-6960-69 1212
70-7970-79 99
80-8980-89 2222
90-9990-99 2525
100-109100-109 1313
4) Find the relative frequency of the interval 80-99.

Cost of a Car Stereo InstallationCost of a Car Stereo Installation5) Fill in the missing frequencies.IntervalInterval FrequencyFrequency Cumulative Cumulative
Freq.Freq.
150-159150-159 44
160-169160-169 88
170-179170-179 1717
180-189180-189 3131
190-199190-199 4040
200-209200-209 5050

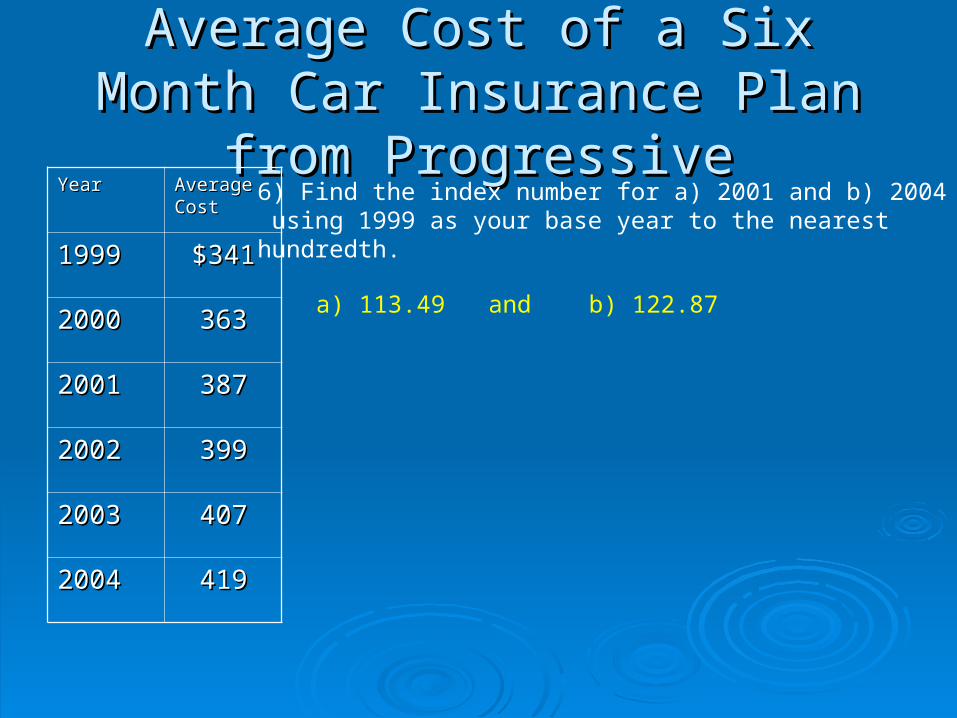
Average Cost of a Six Month Car Average Cost of a Six Month Car Insurance Plan from ProgressiveInsurance Plan from Progressive
6) Find the index number for a) 2001 and b) 2004 using 1999 as your base year to the nearesthundredth.
YearYear Average Average CostCost
19991999 $341$341
20002000 363363
20012001 387387
20022002 399399
20032003 407407
20042004 419419

Average Cost of a Six Month Car Average Cost of a Six Month Car Insurance Plan from ProgressiveInsurance Plan from Progressive
7) Find the % of change from 2001 to 2004to the nearest hundredth of a percent.
YearYear Average Average CostCost
19991999 $341$341
20002000 363363
20012001 387387
20022002 399399
20032003 407407
20042004 419419

Average Cost of a Six Month Car Average Cost of a Six Month Car Insurance Plan from ProgressiveInsurance Plan from Progressive
8) You are planning to create a freq. distribution using 12 intervals. List out the intervals.
3232 3434 4141 4646 6161 5959
3737 5555 1616 1414 5252 6161
3939 4747 5252 1818 2828 2626
4343 4747 5959 1919 3333 4444
5656 4343 2727 3939 4141 4747

Cell Phone & Home Phone Cell Phone & Home Phone ProvidersProviders9) You are constructing a pie chart of the data. What would the central angle be, to the nearest degree, for both AT&T Home and Cell Phone users combined?
PhonePhoneCompanyCompany
San San Ramon Ramon CustomersCustomers
VerizonVerizon 4,3444,344
CingularCingular 3,3573,357
SprintSprint 3,8903,890
AT&T AT&T HomeHome
12,15112,151
AT&T AT&T CellCell
754754

Odd rows trade with the group behind you, Odd rows trade with the group behind you, even rows trade with the group in front of even rows trade with the group in front of you.you.

World PopulationWorld PopulationContinentContinent Population Population
(millions)(millions)
AfricaAfrica 513513
AsiaAsia 27302730
EuropeEurope 489489
South South AmericaAmerica
390390
North North AmericaAmerica
429429
AntarcticaAntarctica 2424
AustraliaAustralia 272272
1) Find the relative frequency of a) Asia and b) Antarctica to the nearest %.
a) 56% and b) 0%

World PopulationWorld PopulationContinentContinent Population Population
(millions)(millions)
AfricaAfrica 513513
AsiaAsia 27302730
EuropeEurope 489489
South South AmericaAmerica
390390
North North AmericaAmerica
429429
AntarcticaAntarctica 2424
AustraliaAustralia 272272
2) If you were making a pie chart of the data, find the central angle, to the nearest degree, of a) North America and b) Australia.
a) 32 degrees and b) 20 degrees

Number of Rooms Rented Daily at Number of Rooms Rented Daily at the Courtyard by Marriottthe Courtyard by Marriott
IntervalInterval FrequencyFrequency
50-5950-59 1717
60-6960-69 1212
70-7970-79 99
80-8980-89 2222
90-9990-99 2525
100-109100-109 1313
3) Find the cumulative frequency of the interval a) 70-79 and the interval b) 90-99.
a) 38 and b) 85

Number of Rooms Rented Daily at Number of Rooms Rented Daily at the Courtyard by Marriottthe Courtyard by Marriott
IntervalInterval FrequencyFrequency
50-5950-59 1717
60-6960-69 1212
70-7970-79 99
80-8980-89 2222
90-9990-99 2525
100-109100-109 1313
4) Find the relative frequency of the interval 80-99.
47/98 = .48 = 48%

Cost of a Car Stereo InstallationCost of a Car Stereo Installation5) Fill in the missing frequencies.IntervalInterval FrequencyFrequency Cumulative Cumulative
Freq.Freq.
150-159150-159 44
160-169160-169 88
170-179170-179 1717
180-189180-189 3131
190-199190-199 4040
200-209200-209 5050
4
4
9
14
9
10
Average Cost of a Six Month Car Average Cost of a Six Month Car Insurance Plan from ProgressiveInsurance Plan from Progressive
6) Find the index number for a) 2001 and b) 2004 using 1999 as your base year to the nearesthundredth.
YearYear Average Average CostCost
19991999 $341$341
20002000 363363
20012001 387387
20022002 399399
20032003 407407
20042004 419419
a) 113.49 and b) 122.87

Average Cost of a Six Month Car Average Cost of a Six Month Car Insurance Plan from ProgressiveInsurance Plan from Progressive
7) Find the % of change from 2001 to 2004to the nearest hundredth of a percent.
YearYear Average Average CostCost
19991999 $341$341
20002000 363363
20012001 387387
20022002 399399
20032003 407407
20042004 419419
8.27% increase

Average Cost of a Six Month Car Average Cost of a Six Month Car Insurance Plan from ProgressiveInsurance Plan from Progressive
8) You are planning to create a freq. distribution using 12 intervals. List out the intervals.
3232 3434 4141 4646 6161 5959
3737 5555 1616 1414 5252 6161
3939 4747 5252 1818 2828 2626
4343 4747 5959 1919 3333 4444
5656 4343 2727 3939 4141 4747
14-1718-2122-2526-2930-3334-3738-4142-4546-4950-5354-5758-61

Cell Phone & Home Phone Cell Phone & Home Phone ProvidersProviders9) You are constructing a pie chart of the data. What would the central angle be, to the nearest degree, for both AT&T Home and Cell Phone users combined?
PhonePhoneCompanyCompany
San San Ramon Ramon CustomersCustomers
VerizonVerizon 4,3444,344
CingularCingular 3,3573,357
SprintSprint 3,8903,890
AT&T AT&T HomeHome
12,15112,151
AT&T AT&T CellCell
754754
190 degrees

Tiebreaker: Favorite Sodas at Tiebreaker: Favorite Sodas at SRVHSSRVHS
If the central angle of a pie chart for the Coke piece is exactly 102.5 degrees, how many peoplelike Dr. Pepper as their favorite soda?
SodaSoda # of # of StudentsStudents
CokeCoke 820820
PepsiPepsi 660660
Mt. DewMt. Dew 500500
Dr. Dr. PepperPepper
Root Root BeerBeer
410410
102.5/360 = 820/x
x = 2880 people at the school
2880 – 820 – 660 – 500 – 410 =
490 students love Dr. P!!
The first non-tied student to show me (not yell) the answerwill also get reduced HW.

HWHW
P. 90 #3-6, 8, 10P. 90 #3-6, 8, 10 for #5 create a frequency histogram onlyfor #5 create a frequency histogram only
Bring graph paper and a calc. for the test tomorrowBring graph paper and a calc. for the test tomorrow
Winning Players: do only #4, 6, and 8Winning Players: do only #4, 6, and 8
FYI: A lot of people forgot to do #14b on FYI: A lot of people forgot to do #14b on Firday’s Assignment, Cum. Freq. Histo.Firday’s Assignment, Cum. Freq. Histo.