advanced macroeconomics 12. population & resources ... · economics of easter island: a...
TRANSCRIPT

Advanced Macroeconomics12. Population & Resources:Malthus and the Environment
Karl Whelan
School of Economics, UCD
Spring 2015
Karl Whelan (UCD) Population and Resources Spring 2015 1 / 26

Malthus and Resources
The Malthusian model may seem of interest today only to explain the worldbefore the Industrial Revolution.
Recall, however, that Malthus’s views focused on how increasing numbers ofpeople placed pressures on the allocation of scarce resources, particularly food.
Are concerns about scarce resources necessarily a thing of the past?
With global population passed 7 billion, it is reasonable to ask whether energysources, agricultural land and climate can continue to withstand the strain ofincreasing population.
Here, we look at a model that combines a Malthusian approach to populationdynamics with modelling changes in a renewable resource base.
First presented by Brander and Taylor in their 1998 paper “The SimpleEconomics of Easter Island: A Ricardo-Malthus Model of Renewable ResourceUse.”
Karl Whelan (UCD) Population and Resources Spring 2015 2 / 26

The World’s Most Remote Place
Karl Whelan (UCD) Population and Resources Spring 2015 3 / 26

Easter Island Statues
Karl Whelan (UCD) Population and Resources Spring 2015 4 / 26

Standing and Toppled Statues
Karl Whelan (UCD) Population and Resources Spring 2015 5 / 26
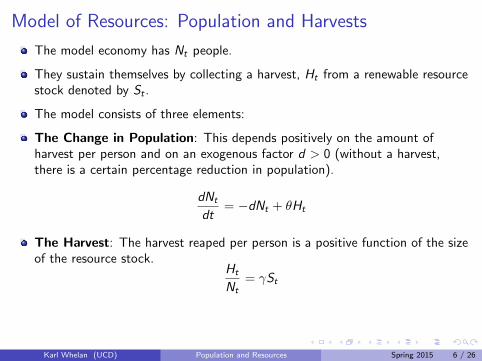
Model of Resources: Population and Harvests
The model economy has Nt people.
They sustain themselves by collecting a harvest, Ht from a renewable resourcestock denoted by St .
The model consists of three elements:
The Change in Population: This depends positively on the amount ofharvest per person and on an exogenous factor d > 0 (without a harvest,there is a certain percentage reduction in population).
dNt
dt= −dNt + θHt
The Harvest: The harvest reaped per person is a positive function of the sizeof the resource stock.
Ht
Nt= γSt
Karl Whelan (UCD) Population and Resources Spring 2015 6 / 26

Model of Resources: Stock of Resources
The final element in the model is the change in the resource stock.
We are describing a resource stock that is renewable. It doesn’t simply declinewhen harvested until it is all gone.
Instead, it has its own capacity to increase. For example, stocks of fish can bedepleted but will increase naturally again if fishing is cut back.
So, our equation for the change in resources is
dStdt
= G (St)− Ht
The second term on the right-hand-side captures that the resource stock isreduced by the amount that is harvested.
The first element describes the ability of the resource to grow.
Karl Whelan (UCD) Population and Resources Spring 2015 7 / 26
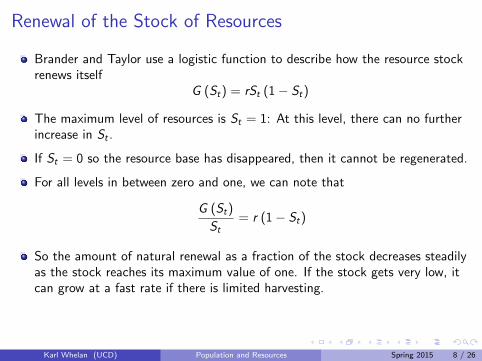
Renewal of the Stock of Resources
Brander and Taylor use a logistic function to describe how the resource stockrenews itself
G (St) = rSt (1− St)
The maximum level of resources is St = 1: At this level, there can no furtherincrease in St .
If St = 0 so the resource base has disappeared, then it cannot be regenerated.
For all levels in between zero and one, we can note that
G (St)
St= r (1− St)
So the amount of natural renewal as a fraction of the stock decreases steadilyas the stock reaches its maximum value of one. If the stock gets very low, itcan grow at a fast rate if there is limited harvesting.
Karl Whelan (UCD) Population and Resources Spring 2015 8 / 26

Dynamics of Population
We are going to use a phase diagram to describe the joint dynamics of Nt andSt .
Inserting the equation for the harvest into the equation for the change inpopulation we get
dNt
dt= −dNt + θγStNt
This equation shows us that population growth is a positive function of theresource stock.
This means there is a particular value of the resource stock, S∗, for whichpopulation growth is zero. When resources are higher than S∗ populationincreases and when it is lower than S∗ population declines.
The value of S∗ can be calculated as
−dNt + θγS∗Nt = 0⇒ S∗ =d
θγ
Karl Whelan (UCD) Population and Resources Spring 2015 9 / 26

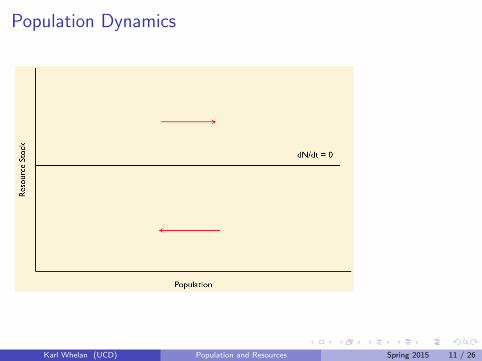
Phase Diagram: Population Dynamics
The figure on the next slide shows how we illustrate the dynamics with aphase diagram.
We put population on the x-axis and the stock of resources on the y -axis.
Population dynamics can then be described as follows:
1 Unchanged population corresponds to a straight line at S∗.2 For all values of resources above S∗ population is increasing: Thus in the
area above the line, we show an arrow pointing right, meaningpopulation is increasing.
3 In the area below this line, there is an arrow pointing left, meaningpopulation is falling.
Karl Whelan (UCD) Population and Resources Spring 2015 10 / 26
Population Dynamics
Karl Whelan (UCD) Population and Resources Spring 2015 11 / 26
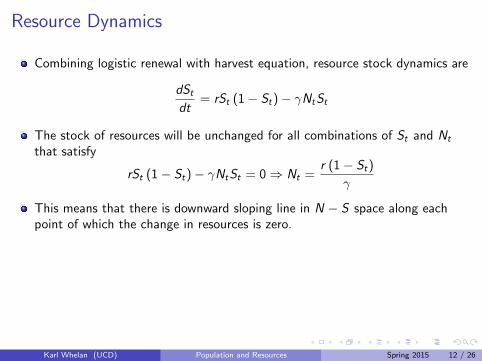
Resource Dynamics
Combining logistic renewal with harvest equation, resource stock dynamics are
dStdt
= rSt (1− St)− γNtSt
The stock of resources will be unchanged for all combinations of St and Nt
that satisfy
rSt (1− St)− γNtSt = 0⇒ Nt =r (1− St)
γ
This means that there is downward sloping line in N − S space along eachpoint of which the change in resources is zero.
Karl Whelan (UCD) Population and Resources Spring 2015 12 / 26
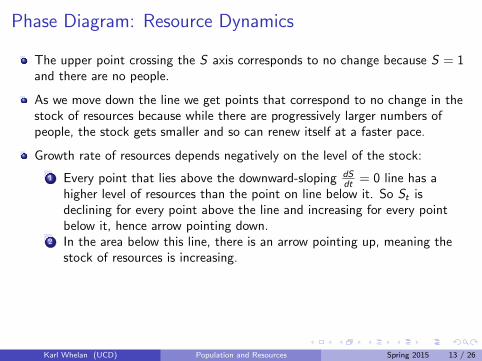
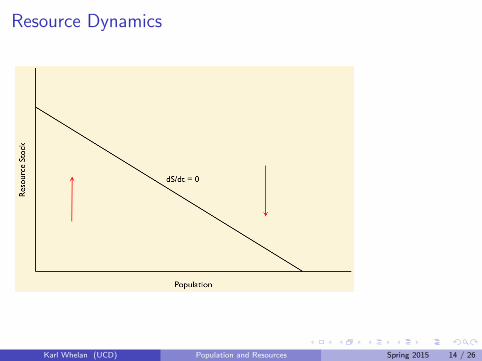
Phase Diagram: Resource Dynamics
The upper point crossing the S axis corresponds to no change because S = 1and there are no people.
As we move down the line we get points that correspond to no change in thestock of resources because while there are progressively larger numbers ofpeople, the stock gets smaller and so can renew itself at a faster pace.
Growth rate of resources depends negatively on the level of the stock:
1 Every point that lies above the downward-sloping dSdt = 0 line has a
higher level of resources than the point on line below it. So St isdeclining for every point above the line and increasing for every pointbelow it, hence arrow pointing down.
2 In the area below this line, there is an arrow pointing up, meaning thestock of resources is increasing.
Karl Whelan (UCD) Population and Resources Spring 2015 13 / 26
Resource Dynamics
Karl Whelan (UCD) Population and Resources Spring 2015 14 / 26

Joint Dynamics of Population and Resources
In the next figure, we put together the four arrows drawn in the two previousfigures.
The joint dynamics of population and resources can be divided up into fourdifferent quadrants.
We can also see that there is one point at which both population andresources are unchanged.
We know already from equation (9) that the level of the resource stock at thispoint is S∗ = d
θγ .
The level of population associated with this point is:
N∗ =r(
1− dθγ
)γ
=r (θγ − d)
θγ2
Karl Whelan (UCD) Population and Resources Spring 2015 15 / 26

Combining Population and Resource Dynamics
Karl Whelan (UCD) Population and Resources Spring 2015 16 / 26
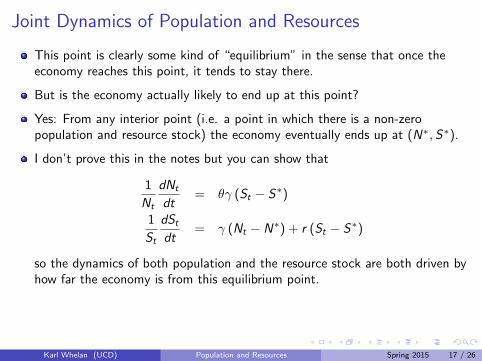
Joint Dynamics of Population and Resources
This point is clearly some kind of “equilibrium” in the sense that once theeconomy reaches this point, it tends to stay there.
But is the economy actually likely to end up at this point?
Yes: From any interior point (i.e. a point in which there is a non-zeropopulation and resource stock) the economy eventually ends up at (N∗,S∗).
I don’t prove this in the notes but you can show that
1
Nt
dNt
dt= θγ (St − S∗)
1
St
dStdt
= γ (Nt − N∗) + r (St − S∗)
so the dynamics of both population and the resource stock are both driven byhow far the economy is from this equilibrium point.
Karl Whelan (UCD) Population and Resources Spring 2015 17 / 26
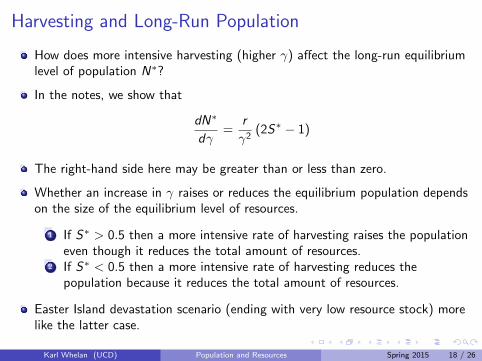
Harvesting and Long-Run Population
How does more intensive harvesting (higher γ) affect the long-run equilibriumlevel of population N∗?
In the notes, we show that
dN∗
dγ=
r
γ2(2S∗ − 1)
The right-hand side here may be greater than or less than zero.
Whether an increase in γ raises or reduces the equilibrium population dependson the size of the equilibrium level of resources.
1 If S∗ > 0.5 then a more intensive rate of harvesting raises the populationeven though it reduces the total amount of resources.
2 If S∗ < 0.5 then a more intensive rate of harvesting reduces thepopulation because it reduces the total amount of resources.
Easter Island devastation scenario (ending with very low resource stock) morelike the latter case.
Karl Whelan (UCD) Population and Resources Spring 2015 18 / 26
Back to Easter Island
Let’s go back to Easter Island and imagine the island in its early days with afull stock of resources and very few residents. What happens next?
For many years, the population expands and resources decline.
Then, when it moves into the bottom right quadrant, population falls andresources keep declining.
It moves though the quadrants and ends up at equilibrium with S = S∗ andN = N∗
Our theoretical Easter Island sees its population far overshoot its long-runequilibrium level before collapsing below this level and then oscillating aroundthe long-run level and then finally settling down.
Karl Whelan (UCD) Population and Resources Spring 2015 19 / 26

Illustrative Dynamics Starting from Low Population andHigh Resources
Karl Whelan (UCD) Population and Resources Spring 2015 20 / 26

Resources in a Simulated Easter Island Economy
50 100 150 200 250 300 350 400 450 5000.2
0.3
0.4
0.5
0.6
0.7
0.8
0.9
1.0
Karl Whelan (UCD) Population and Resources Spring 2015 21 / 26
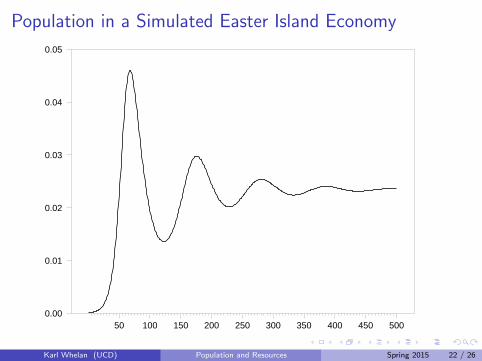
Population in a Simulated Easter Island Economy
50 100 150 200 250 300 350 400 450 5000.00
0.01
0.02
0.03
0.04
0.05
Karl Whelan (UCD) Population and Resources Spring 2015 22 / 26

Resource Stock with Less Harvesting
Base Case Less Harvesting
50 100 150 200 250 300 350 400 450 5000.2
0.3
0.4
0.5
0.6
0.7
0.8
0.9
1.0
Karl Whelan (UCD) Population and Resources Spring 2015 23 / 26

Population with Less Harvesting
Base Case Less Harvesting
50 100 150 200 250 300 350 400 450 5000.00
0.01
0.02
0.03
0.04
0.05
Karl Whelan (UCD) Population and Resources Spring 2015 24 / 26

Why Doesn’t Someone Shout Stop?
In his book, Collapse, Jared Diamond discusses Easter Island and a number ofother cases in which societies saw dramatic collapses, many triggered bylong-term environmental damage.
Diamond points to a number of potential explanations for why societies canlet environmental damage occur up to the point where they trigger disasters.
I The Tragedy of the Commons: It may simply never be in anyone’sindividual interests at any point in time to prevent environmentaldegradation. Need political institutions to take into account externalitiesassociated with self-interested behaviour.
I Failure to Anticipate: Societies may not realise exactly how muchdamage they are doing to their environment or what its long-termconsequences will be.
I Failure to Perceive, Until Too Late: Diamond notes thatenvironmental change often occurs at such a slow pace that people failto notice it and plan to deal with it.
Analogies with current debate about climate change are clear.
Karl Whelan (UCD) Population and Resources Spring 2015 25 / 26

Things to Understand From This Topic1 A rough idea of the facts about the history of Easter Island prior to the arrival
of Europeans.
2 The structure of the Brander-Taylor model.
3 How to derive the dynamics of population.
4 How to derive the dynamics of resources.
5 The long-run impacts of more intensive harvesting.
6 How to draw the phase diagram.
7 The likely dynamics starting from low population and high resources.
8 Why environmental disasters are not prevented.
Karl Whelan (UCD) Population and Resources Spring 2015 26 / 26