advanced imaging and inversion for unconventional resource
TRANSCRIPT

41
technical article
© 2013 EAGE www.firstbreak.org
first break volume 31, July 2013
1 WesternGeco, 1625 Broadway, Suite 1300, Denver, Colorado 80202, USA.2 Schlumberger, 10001 Richmond Ave, Houston, Texas 77042, USA.* Corresponding author, E-mail: [email protected]
Advanced imaging and inversion for unconventional resource plays
Greg M. Johnson1* and Paul Miller2
IntroductionUnconventional tight shale oil and gas plays have recently become major targets for exploration. Extended horizon-tal drilling and hydraulic fracturing to exploit these plays, which started in the USA, has now expanded worldwide. Current development of these plays is a statistical process where evenly laid out drilling locations allow a company to hold land leases and ensure a projected return on investment based on early initial and cumulative production numbers from neighbouring wells (Figure 1). The challenge then becomes the design of the infill drilling programme and how best to maximize the ultimate recovery of resource from each field in a timely fashion.
With a typical 3350 m lateral well that has more than 30 completion stages costing $8 million, the infill plan dramatically impacts long-term economics of the programme. Using a hypothetical scenario, what if the infill wells shown in the red outline in Figure 1 were not drilled due to some prior information about the reservoir quality in that specific part of the field? That equates to fourteen infill wells not drilled, free-ing up $112 million in cash flow. For a fraction of that money, 3D seismic technology can be effectively utilized to reduce the risk of wasted expenditure on infill drilling, thereby maximiz-ing ultimate recovery from the field. The key is processing the seismic data specifically for these types of plays without taking shortcuts due to perceived time and cost constraints.
Not drilling the infill wells before the seismic work alleviates some of the cost constraint. The seismic work can be performed during the initial drilling programme aimed at holding the lease acreage, so this alleviates the time
AbstractUnconventional resource plays have now reached mainstream in terms of the amount of commercial exploration and production activity within these fields. In this paper we introduce a no-compromise advanced workflow for imaging and prestack inversion of 3D seismic data for unconventional resource plays. The imaging portion of the workflow includes a calibrated tomography that simultaneously solves for vertical velocity and TI anisotropy, ensuring accurate well ties during prestack depth migration. The prestack inversion portion of the workflow includes both azimuthal traveltime and amplitude inversion schemes. The resulting seismic attributes are well suited to help predict future well performance in planning the development of these fields.
constraint. The full 3D seismic work can be completed and analysed such that the first infill wells can be located and drilled for maximum productivity. This strategy not only has the potential to improve on the production company’s internal rate of return, but also is the responsible way to develop these fields. More accurate placement of wells moves away from pattern drilling and ultimately uses less resource for the same or even greater production levels. This paper presents a case study from the Bakken Shale play in North Dakota, USA, where advanced imaging and inversion techniques unlock the true predictive power of 3D seismic methodology for cost-effective and responsible development of unconventional resource plays.
Figure 1 Plan view of two different horizontal well patterns. On the right, one well is drilled per 2.59 km² section, to allow the production company to hold the leased acreage. On the left, the wells are longer and include some infill wells (in red) aimed at additional production.
technical article first break volume 31, July 2013
www.firstbreak.org © 2013 EAGE42
Theory and methodLand 3D seismic data are normally acquired with multiple azimuth directions between source and receiver positions. Advantages of multi-azimuth seismic acquisition have been well documented (Kapoor and Woodward, 2008). Multi-azimuth seismic data not only enable superior imaging, but if the azimuthal information is carried correctly through all imaging steps, multi-azimuth inversion techniques utilizing both residual traveltimes and amplitudes can be effectively used for reservoir property description. However, the quality and effectiveness of the derived attributes are directly related to the quality of the seismic imaging used in the inversion (Johnson and Dorsey, 2010).
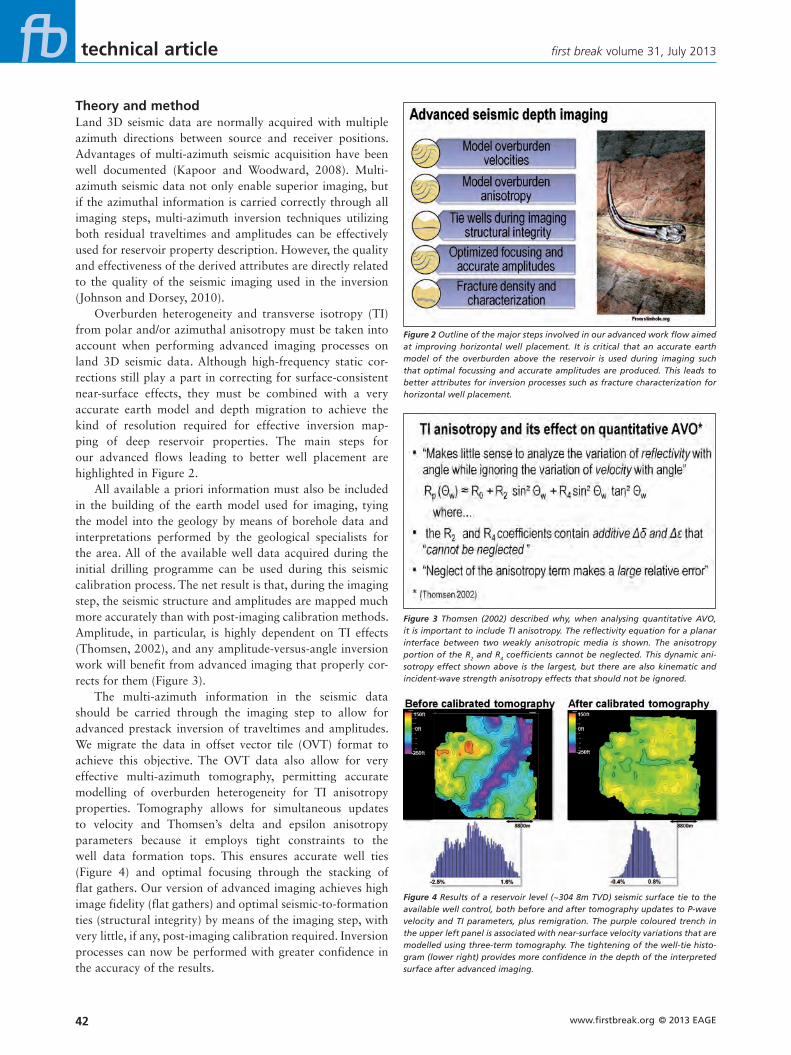
Overburden heterogeneity and transverse isotropy (TI) from polar and/or azimuthal anisotropy must be taken into account when performing advanced imaging processes on land 3D seismic data. Although high-frequency static cor-rections still play a part in correcting for surface-consistent near-surface effects, they must be combined with a very accurate earth model and depth migration to achieve the kind of resolution required for effective inversion map-ping of deep reservoir properties. The main steps for our advanced flows leading to better well placement are highlighted in Figure 2.
All available a priori information must also be included in the building of the earth model used for imaging, tying the model into the geology by means of borehole data and interpretations performed by the geological specialists for the area. All of the available well data acquired during the initial drilling programme can be used during this seismic calibration process. The net result is that, during the imaging step, the seismic structure and amplitudes are mapped much more accurately than with post-imaging calibration methods. Amplitude, in particular, is highly dependent on TI effects (Thomsen, 2002), and any amplitude-versus-angle inversion work will benefit from advanced imaging that properly cor-rects for them (Figure 3).
The multi-azimuth information in the seismic data should be carried through the imaging step to allow for advanced prestack inversion of traveltimes and amplitudes. We migrate the data in offset vector tile (OVT) format to achieve this objective. The OVT data also allow for very effective multi-azimuth tomography, permitting accurate modelling of overburden heterogeneity for TI anisotropy properties. Tomography allows for simultaneous updates to velocity and Thomsen’s delta and epsilon anisotropy parameters because it employs tight constraints to the well data formation tops. This ensures accurate well ties (Figure 4) and optimal focusing through the stacking of flat gathers. Our version of advanced imaging achieves high image fidelity (flat gathers) and optimal seismic-to-formation ties (structural integrity) by means of the imaging step, with very little, if any, post-imaging calibration required. Inversion processes can now be performed with greater confidence in the accuracy of the results.
Figure 2 Outline of the major steps involved in our advanced work flow aimed at improving horizontal well placement. It is critical that an accurate earth model of the overburden above the reservoir is used during imaging such that optimal focussing and accurate amplitudes are produced. This leads to better attributes for inversion processes such as fracture characterization for horizontal well placement.
Figure 3 Thomsen (2002) described why, when analysing quantitative AVO, it is important to include TI anisotropy. The reflectivity equation for a planar interface between two weakly anisotropic media is shown. The anisotropy portion of the R2 and R4 coefficients cannot be neglected. This dynamic ani-sotropy effect shown above is the largest, but there are also kinematic and incident-wave strength anisotropy effects that should not be ignored.
Figure 4 Results of a reservoir level (~304 8m TVD) seismic surface tie to the available well control, both before and after tomography updates to P-wave velocity and TI parameters, plus remigration. The purple coloured trench in the upper left panel is associated with near-surface velocity variations that are modelled using three-term tomography. The tightening of the well-tie histo-gram (lower right) provides more confidence in the depth of the interpreted surface after advanced imaging.
technical articlefirst break volume 31, July 2013
© 2013 EAGE www.firstbreak.org 43
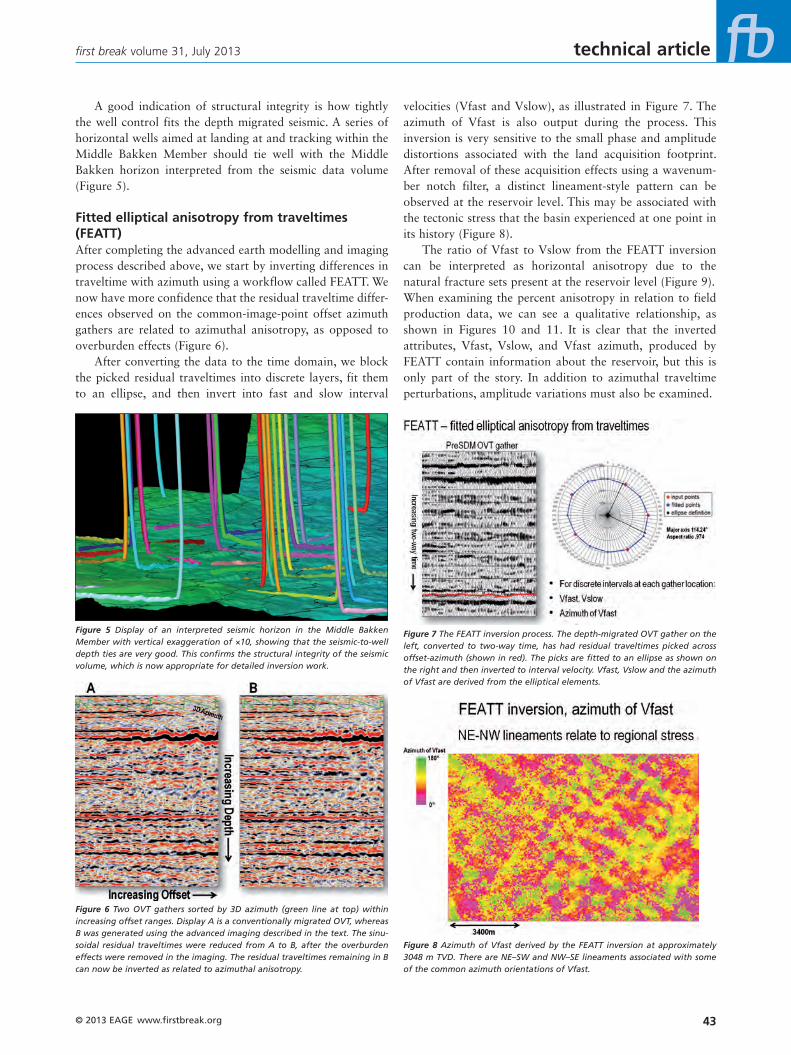
velocities (Vfast and Vslow), as illustrated in Figure 7. The azimuth of Vfast is also output during the process. This inversion is very sensitive to the small phase and amplitude distortions associated with the land acquisition footprint. After removal of these acquisition effects using a wavenum-ber notch filter, a distinct lineament-style pattern can be observed at the reservoir level. This may be associated with the tectonic stress that the basin experienced at one point in its history (Figure 8).
The ratio of Vfast to Vslow from the FEATT inversion can be interpreted as horizontal anisotropy due to the natural fracture sets present at the reservoir level (Figure 9). When examining the percent anisotropy in relation to field production data, we can see a qualitative relationship, as shown in Figures 10 and 11. It is clear that the inverted attributes, Vfast, Vslow, and Vfast azimuth, produced by FEATT contain information about the reservoir, but this is only part of the story. In addition to azimuthal traveltime perturbations, amplitude variations must also be examined.
A good indication of structural integrity is how tightly the well control fits the depth migrated seismic. A series of horizontal wells aimed at landing at and tracking within the Middle Bakken Member should tie well with the Middle Bakken horizon interpreted from the seismic data volume (Figure 5).
Fitted elliptical anisotropy from traveltimes (FEATT)After completing the advanced earth modelling and imaging process described above, we start by inverting differences in traveltime with azimuth using a workflow called FEATT. We now have more confidence that the residual traveltime differ-ences observed on the common-image-point offset azimuth gathers are related to azimuthal anisotropy, as opposed to overburden effects (Figure 6).
After converting the data to the time domain, we block the picked residual traveltimes into discrete layers, fit them to an ellipse, and then invert into fast and slow interval
Figure 5 Display of an interpreted seismic horizon in the Middle Bakken Member with vertical exaggeration of ×10, showing that the seismic-to-well depth ties are very good. This confirms the structural integrity of the seismic volume, which is now appropriate for detailed inversion work.
Figure 6 Two OVT gathers sorted by 3D azimuth (green line at top) within increasing offset ranges. Display A is a conventionally migrated OVT, whereas B was generated using the advanced imaging described in the text. The sinu-soidal residual traveltimes were reduced from A to B, after the overburden effects were removed in the imaging. The residual traveltimes remaining in B can now be inverted as related to azimuthal anisotropy.
Figure 7 The FEATT inversion process. The depth-migrated OVT gather on the left, converted to two-way time, has had residual traveltimes picked across offset-azimuth (shown in red). The picks are fitted to an ellipse as shown on the right and then inverted to interval velocity. Vfast, Vslow and the azimuth of Vfast are derived from the elliptical elements.
Figure 8 Azimuth of Vfast derived by the FEATT inversion at approximately 3048 m TVD. There are NE–SW and NW–SE lineaments associated with some of the common azimuth orientations of Vfast.

technical article first break volume 31, July 2013
www.firstbreak.org © 2013 EAGE44
Simultaneous azimuthal amplitude variation with angle elastic inversion (AVOAZ)Preservation of amplitude and azimuthal information in the imaged OVT seismic data enables implementation of a simultaneous prestack seismic inversion workflow to esti-mate attributes of shear-wave anisotropy. This information has particular relevance in unconventional reservoirs, such as the Bakken Shale Formation, where pre-knowledge of the in situ stress field and of natural fracture orientations can be used to optimize the effectiveness of hydraulic fracturing and maxi-mize hydrocarbon production (Besler et al., 2007).
The method we use is an extension of isotropic simultane-ous inversion with global optimization based on simulated annealing (Rasmussen et al., 2004), incorporating an approxi-mation to the elastic anisotropic Zoeppritz equations (Pšenčík and Martins, 2001). We calibrate the amplitude variation with angle/offset (AVO) and the amplitude variation with azimuth (AVAZ) of the reflectivity to the recorded surface seismic OVT data by utilizing dipole sonic, compressional sonic, and density logs and estimating the wavelet deterministically. This procedure consists of azimuthal sectoring of the input OVT data to enable sampling of the AVAZ reflectivity, and splitting of each sector into a number of angle stacks to allow sampling of the AVO reflectivity response. Independent wavelets are then estimated for all the azimuth sector/angle-stack combinations.
Determination of the optimal number of sectors, angle stacks, and angle ranges that the data could support was performed using an inversion-calibrated processing workflow (Figure 12) based on a small test cube around a key well. Application of this workflow is also useful to quantify improvements as a result of potential gather pre-conditioning steps. Using this methodology, we opted for splitting the OVT data into five azimuthal sectors, and four angle stacks per sector (Figure 13). The high correlation observed between the well synthetic (obtained by convolution of the extracted wavelet with the measured angular and azimuthal reflectivity) and the azimuthally sectored, angle-stack seismic data, and the corresponding quality and similarity of the extracted wavelets over all the azimuthal/angle ranges are testament to the superior imaging and amplitude fidelity achieved using the advanced imaging workflow.
We perform simultaneous inversion of all the azimuth-ally sectored angle-stack data to generate volume estimates of acoustic impedance (AI), density, fast and slow shear imped-ance (SI), and an orientation estimate of the fast shear azimuth. In conjunction with the advanced seismic imaging workflow, this inversion method has the benefit of improved estimates of acoustic impedance and density because azimuthally sectored angle-stack data typically contain less smearing due to ani-sotropy effects than a full-azimuth angle stack. The excellent well ties observed for the inverted data, including a blind well (Figure 14), provide confidence in the results over the entire project area. This presents the potential for more accurate inversion-derived lithology and fluids prediction, in addition to estimates of fracture orientation and fracture density. Jia et al.
Figure 9 Relationships between fracture direction, fast/slow azimuths of P-wave velocity, and fast/slow S-wave propagation. After Bratton et al. (2006).
Figure 10 P-wave velocity anisotropy at the reservoir level, derived using FEATT. The arrows are directed in the azimuth of Vfast and their length indi-cates the amount of anisotropy. Here, in an area of lower production during the first 90 days, there is more weak anisotropy, shown by the purple colour.
Figure 11 P-wave velocity anisotropy at the reservoir level, derived using FEATT. The vectors are directed in the azimuth of Vfast and their lengths indicate the amount of anisotropy. Here, in an area of higher production dur-ing the first 90 days, there is more strong anisotropy, shown by the warmer colours.

technical articlefirst break volume 31, July 2013
© 2013 EAGE www.firstbreak.org 45
ing fractures, to the left. Figure 15 also illustrates the difference in resolution between borehole measurements, where the interfaces are sharp and property changes are clearly visible, and the inversion result from the surface seismic data.
The observation from the inversion results that there is an increase in anisotropy in the vicinity of the interfaces between the underlying and overlying shales may be related to previous observations from core data. The best developed and most extensive fracture networks occur in oil-saturated reservoir rocks adjacent to mature–overmature source rocks that are actively generating hydrocarbons (Pitman et al., 2001). Larger scale analysis reveals that these, and other, anisotropic intervals are spatially distributed as discrete layers (Figure 16).
The Bakken reservoir is difficult to define seismically due to the thickness of its members being comparable to, or less than, the minimum resolvable thickness, especially in the
(2012) reported the use of seismic inversion to estimate quality of unconventional reservoir in terms of total organic content. This type of analysis should benefit from the improvement in accuracy of the AVOAZ inversion elastic property estimates.
Analysis of the ratio of slow to fast shear impedances at a well location reveals the presence of anisotropy in the lower part of the Middle Bakken Member, close to the interface with the Lower Bakken Member, and in the upper part of the Middle Bakken Member together with the Upper Bakken shale and lowest part of the Lodgepole Formation (Figure 15). The anisotropy is corroborated by borehole measurements. The inset panel displays measured well log responses (density, compressional sonic, and acoustic impedance) associated with the individual Bakken members on the left, and the slow/fast shear impedance ratio from the inversion result on the right. The shear impedance is more anisotropic, potentially indicat-
Figure 12 Optimization of the input seismic data for the AVOAZ simultaneous inversion utilizing the inversion-calibrated workflow.
Figure 13 Results of deterministic wavelet estima-tion used as input into the simultaneous AVOAZ inversion.

technical article first break volume 31, July 2013
www.firstbreak.org © 2013 EAGE46
the south and east exhibiting significantly higher anisotropy (coloured magenta), compared to the western area where the anisotropy estimate is visibly of a lower magnitude (coloured orange/yellow). The AVOAZ inversion also provides estimates of the orientation of the fast shear azimuth, plotted as arrows, with the lengths of the arrows being proportional to the mag-nitude of the anisotropy. Borehole measurement of the fast shear azimuth is in agreement with the orientation estimate from the AVOAZ inversion close to the well location. There is generally a NW–SE trend except for the region of higher anisotropy where there appears to be some rotation towards
case of the Upper Bakken Shale Member. In order to achieve higher confidence in analysis at the reservoir level, we utilized a post-stack inversion/whitening technique based on spatially adaptive wavelet processing (Poggiagliolmi and Allred, 1994) to optimally zero-phase the wavelet and to maximize the available signal frequencies. This technique enables the inter-faces between individual Bakken members to be picked, so that detailed analysis of the changes in observed anisotropy can be performed for the separate reservoir units.
Inspection of the slow/fast shear impedance ratio extracted at the Middle Bakken Member (Figure 17) reveals an area to
Figure 14 Acoustic impedance, density, and shear impedance (fast and slow) results of the AVOAZ inversion at the reservoir level for a single well location. The red function on the right side of each display is the filtered log curve, the blue function the inversion result, and the green function is the background low-frequency model used in the inversion.
Figure 15 Slow/fast shear impedance ratio from AVOAZ inversion at the reser-voir interval for the inline/crossline pair that coincide at a well location. The magenta ellipses indicate well formation tops.
Figure 16 Larger scale view of the slow/fast shear impedance ratio from AVOAZ inversion for the inline/crossline pair. The red rectangle (centre) indi-cates the reservoir interval displayed in Figure 15.

technical articlefirst break volume 31, July 2013
© 2013 EAGE www.firstbreak.org 47
than 2500–3000 m, permeable fractures focus hydrocarbon fluids and locally serve as oil reservoirs (Pitman et al., 2001).
If the higher measured anisotropy is due to the presence of more fractures, it suggests that a significant contribution to higher initial productivity comes from natural fractures. Similar observations have been reported elsewhere (Grau and Stirling, 2011; Theloy and Sonnenberg 2012). A recent case study using azimuthally focused resistivity (AFR) and azimuthal deep reading resistivity (ADR) measured along a 3330 m lateral in the Middle Bakken Member revealed some 839 individual fractures concentrated in four fracture swarms. Evaluation of a post-stimulation oil tracer indicated that these fracture swarms were responsible for 70% of the production after stimulation (Mullen et al., 2010). Implementation of a cutoff for the slow/fast shear impedance ratio (e.g., < 0.85) enables visualization in 3D of the spatial extent and geometries associated with the most anisotropic regions, potentially related to fracture swarms, between the interpreted horizons in the Upper and Lower Bakken members (Figure 19).
In addition to combining groups of attributes, it is impor-tant to recognize that they must be analysed in the context of the potential fracture radius around the horizontal borehole (Figure 20). In this way, the 3D seismic data can contribute
N–S and NE–SW directions. The NE–SW trend is typically observed across the basin (Sturm and Gomez, 2009).
Inclusion of data on the first 90 days of oil production from the Middle Bakken for wells in the area reveals a good correlation to anisotropic anomalies (Figure 18). Generally, the better producing wells are in the eastern part of the survey, and the poorer producers are in the western part. For reasons of confidentiality, we cannot display the actual wellbore trajectories. The marked locations are somewhere along the real trajectories, which can typically be in excess of 3000 m from heel to toe.
Core studies of the Bakken Formation reveal that reservoir rocks with permeability values greater than 0.01 mD in the Middle Bakken Member commonly contain open, natural hydraulic fractures. Reservoir sandstones and siltstones adjacent to thermally immature, kerogen-poor shales typically are devoid of fractures and have lower permeabilities. In contrast, reservoir rocks associated with thermally mature, kerogen-rich shales generally have a high fracture density along with a large residual oil content and, hence, significant permeability enhancement. The highest permeabilities in the Middle Bakken Member correspond to sandstones and siltstones with high residual oil concentra-tions and well developed open fractures. At depths greater
Figure 17 Slow/fast shear impedance ratio extracted at the Middle Bakken, overlain by estimates of the fast shear azimuth, displayed as arrows with lengths proportional to the magnitude of anisotropy. The panel at lower left displays the recorded well log responses (compressional sonic, density, and acoustic imped-ance) at the approximate location in the reservoir indicated by the red arrow, a zero phase 0–65 Hz synthetic, and the AVOAZ inversion results for acoustic impedance, density and the slow/fast shear impedance ratio.

technical article first break volume 31, July 2013
www.firstbreak.org © 2013 EAGE48
shown how these two inversion processes are complementary and provide important information about the rock properties within a Bakken Shale unconventional resource play. We can now proceed to examine correlations between inverted seismic attribute volumes and general production figures from existing lateral wells, and define the relationships between the two. The inverted seismic attributes have the potential to be a powerful predictor of future well performance and can be used in the planning and execution of the continuing infill well programme.
information about the stimulated rock volume, which is more realistic than information along a single surface, such as the Middle Bakken horizon.
ConclusionsWe have defined a methodology for advanced imaging of 3D surface seismic data and have shown how important it is to perform this step prior to inversion processes that use prestack traveltime and amplitude information. We have also
Figure 18 Correlation of first 90 days of oil production data with inversion estimates of anisotropy: the slow/fast shear impedance ratio extracted for the Middle Bakken, overlain by estimates of the fast shear azimuth displayed as arrows with lengths proportional to the magnitude of anisotropy.
Figure 19 Fracture swarms extracted between the Upper and Lower Bakken horizons (slow/fast shear impedance ratio < 0.85). The underlying surface (orange/red) is a horizon in the Three Forks Formation.
Figure 20 The seismic attributes do not apply only along the Middle Bakken level, but to a volume around the horizontal borehole. This better matches the real case of hydraulic fractures extending hundreds of metres from bore-holes and contributing to overall production.
technical articlefirst break volume 31, July 2013
© 2013 EAGE www.firstbreak.org 49
an impact on production? A case study from the Middle Bakken
dolomite, North Dakota. SPE 135319.
Pitman, J.K., Price, L.C. and LeFever, J.A. [2001] Diagenesis and fracture
development in the Bakken Formation, Williston Basin—implications
for reservoir quality in the Middle Member. US Geological Survey,
Professional Paper 1653.
Poggliagliolmi, E. and Allred, R.D. [1994] Detailed reservoir definition by
integration of well and 3-D seismic data using space adaptive wavelet
processing. The Leading Edge, 13, 749–754.
Pšenčík, I. and Martins, J.L. [2001] Properties of weak contrast PP reflec-
tion/transmission coefficients for weakly anisotropic elastic media.
Studia Geophysica et Geodaetica, 45, 176–199.
Rasmussen, K.B., Bruun, A. and Pedersen, J.M. [2004] Simultaneous
seismic inversion. 66th EAGE Conference & Exhibition, Extended
Abstracts, P165.
Sturm, S. and Gomez,E. [2009] Role of natural fracturing in production
from the Bakken Formation, Williston Basin, North Dakota. AAPG
Search and Discovery, 50199.
Theloy, C. and Sonnenberg, S.A. [2012] Factors influencing productivity in
the Bakken play, Williston Basin. AAPG Search and Discovery, 10413.
Thomsen, L. [2002] Understanding Seismic Anisotropy in Exploration and
Exploitation. SEG, Tulsa and EAGE, Houten.
Received 27 March 2013; accepted 14 May 2013.
doi: 10.3997/1365-2397.2013020
ReferencesBesler, M.R., Steele, J.W., Egan, T. and Wagner, J. [2007] Improving well
productivity and profitability in the Bakken – a summary of our
experiences drilling, stimulating and operating horizontal wells. SPE
110679.
Bratton, T., Dao, V.C., Nguyen, V.Q., Gillespie, P., Hunt, D., Li, B.,
Marcinew, R., Ray, S., Montaron, B., Nelson, R., Schoderbek, D. and
Sonneland, L. [2006] The nature of naturally fractured reservoirs.
Schlumberger Oilfield Review, Summer 2006, 4–23.
Grau, A. and Sterling, R.H. [2011] Characterization of the Bakken System
of the Williston Basin from pores to production; the power of a source
rock/unconventional reservoir couplet. AAPG Search and Discovery,
40847.
Johnson, G. and Dorsey, J. [2010] Modeling overburden heterogeneity
in terms of Vp and TI for PSDM, Williston Basin, U.S.A. 80th SEG
Annual Meeting, Expanded Abstracts, 29, 4062–4065.
Jia, J.L., Liu, Z.J., Meng, Q.T., Liu, R., Sun, P.C. and Chen, Y.C. [2012]
Quantitative evaluation of oil shale based on well log and 3-D seismic
technique in the Songliao Basin, North East China. Journal of Oil
Shale, 29, 128–150.
Kapoor, J. and Woodward, M. [2008] Velocity model building for
subsalt imaging using Wide and Rich azimuth data. 78th SEG Annual
Meeting, Expanded Abstracts, 27, 3693–3696.
Mullen, M., Pitcher, J., Hinz, D., Everts. M., Dunbar, D., Carlstrom, G.
and Brenize, G. [2010] Does the presence of natural fractures have