advanced analysis identifies greater efficiency for...
TRANSCRIPT

Advanced Analysis Identifies GreaterEfficiency for Testing BOPs in Deep WaterC. Mark Franklin, SPE, BP America Inc.; Richard F. Vargo Jr., SPE, Halliburton; U.B. Sathuvalli, SPE, Blade Energy
Partners; and Mike Payne, SPE, BP America Inc.
SummaryPressure testing blowout preventers (BOPs) with synthetic-basedmud (SBM) requires lengthy testing times resulting from pressure/volume/temperature (PVT) influences associated with SBM. PVTinfluences are especially pronounced in deep water and high-pres-sure test environments.
A project was initiated in an effort to better understand themechanics that transpired during BOP testing. The primary objec-tive was to demonstrate that the pressure decline was quantified bythe fluid-PVT behavior, mechanical influences and thermodynam-ics of pressurization, and subsequent cool down. The secondaryobjective was to demonstrate that the pressure decline resultingfrom a leak could be reliably and efficiently detected with high-resolution pressure data.
It was theorized that the gradual decay of pressure during theshut-in phase was a result of the heat added to the system duringpressurization. To pursue this investigation, real-time PVT datawere gathered at the cementing-unit (CU) suction and dischargewhile testing the BOP. In addition, pressure/temperature (P/T)gauges were placed in the drillstring—one at the drill floor, one atthe midpoint between the drill floor and the BOP, and one abovethe BOP stack. The gauges confirmed significant heat up as thesystem was pressured up for each test. The pressure decreased asthe system cooled back toward the ambient temperature. Modelingtechniques were developed to understand the system response.
This paper presents salient aspects of data acquisition, datainterpretation, and modeling techniques. Results demonstrate thepotential to significantly impact the industry, with respect tosafety, time, and costs for BOP testing.
IntroductionThe challenges of obtaining valid BOP pressure tests in an effi-cient manner have increased because of greater water depths,deeper drilling horizons, and higher test pressures. Fig. 1 showsthe important components involved in testing a subsea BOP stack.The system is a pressure vessel comprising the test line from theCU and the drillpipe from the surface of the rig to the BOP stack.In this work, the capacity of the pressure vessel is referred to as thetest volume. The valves in the BOP stack are tested in sequence byclosing each valve and then pumping fluid from the CU into thetest volume until a target pressure is reached (the pumping phase).At the target pressure, pumping stops and the test volume is closeduntil a test is deemed valid (the shut-in phase). In deepwater wells,the duration of the shut-in phase can be as long as 45 minutes whenSBMs are used.
Regulations state that a test is valid when the required pressureis held steady for 5 minutes.1 Data from a BOP test are typicallyrecorded on a 4-hour circular-chart recorder, as shown in Fig. 2.Test validation established by the pressure trace on a chart recorderis based on individual judgment. Often, a test must be repeatedwhen visual inspection of the chart-recorder trace deems it invalid.Frequently, test durations are longer than necessary to ensure avalid test. The chart recorder (patented more than 100 years ago2)is still used on the majority of the rigs today. However, recent
advances in digital technology and the relative ease of data pro-cessing with inexpensive personal-computer technology create aclear opportunity for improvement in the recording, analysis, andvalidation of BOP tests.
During a recent BOP test, the reasons for the gradual decay ofpressure with time were examined. Field experience and anecdotalevidence suggest that test durations are considerably longer withSBM than with water-based muds. Discussions with rig personneland engineers indicate that though “pressure decay” is recognizedas a characteristic deepwater phenomenon, it has not been rigor-ously examined. Further discussions imply that the test durationcan be significantly optimized if the physical mechanisms thatcontrol the P/T response of the test volume during the differentphases of testing are identified and quantified. As a result of thenumerous benefits from a reduction of test duration, a project tounderstand the physics of the BOP-test process was initiated.
To understand the P/T response of the system, a series of in-creasingly complex data-acquisition exercises was initiated. Ineach case, real-time PVT data at different points of the test volumewere acquired and analyzed. It originally hypothesized that thefluid in the test volume is heated because of compressional effects.Subsequently, when the pressurized system is shut in, the subse-quent cooling of the fluid causes a gradual pressure decay, thusextending the time required for a pressure-validation test.
This paper presents an analysis of real-time PVT data fromBOP tests during the pumping and shut-in phases. The PVT be-havior that characterizes a valid test and differentiates it from aninvalid test (i.e., when there is a leak) is described and identified.It is shown that the system response during a valid test for a givenconfiguration (e.g., drillpipe geometry and fluid-PVT properties) isrepeatable and quantifiable. The physical mechanisms that governthe observed trends are identified and explained through the de-velopment of a simple theoretical model. The potential impact ofthis analysis on BOP-test methodology is also examined. An ac-ceptable test protocol should consistently identify leaks when theyoccur in the system. It is shown that the acquisition and use ofreal-time digital pressure data during a BOP test allow the operatorto differentiate between valid and invalid tests and simultaneously,reduce the time required to ascertain a valid test.
Field-Data Collection SummaryTo further understand the physics of the BOP test, a series ofdata-acquisition exercises is performed. In each of these exercises,pressure and temperature measurements are obtained at differentlocations in the system.
Initially, a temperature probe is placed on the discharge side ofthe CU. In the high-pressure tests, the magnitude of temperatureincrease is between 10 and 27°F. In comparison, the choke-manifold high-pressure tests recorded a temperature increase of 3to 5°F. The thermocouple probes used to record temperatures havea resolution of ±1°F.
The next sequence of tests determines the temperature increaseresulting from the frictional effects between the pump and fluid, byplacing a temperature probe at the suction and discharge of the CU.The temperature increase is the discharge temperature minus thesuction temperature. The inlet temperature during the testing pe-riod is observed to change during the day as it fluctuates withenvironmental influences.
A subsequent test is designed to determine the temperatureresponse inside the drillpipe resulting from the pressure cycles.Further, this test is designed to separate the temperature increase
Copyright © 2005 Society of Petroleum Engineers
This paper (SPE 87155) was first presented at the 2004 IADC/SPE Drilling Conference,Dallas, 2–4 March and revised for publication. Original manuscript received for review 19May 2004. Revised manuscript received 07 July 2005. Paper peer approved 02 October2005.
238 December 2005 SPE Drilling & Completion

caused by pump frictional effects from the internal-energy tem-perature increase as a function of increasing the system pressure.Three memory P/T gauges are placed in the drillstring (see Fig. 1)—one at surface, one midway to the BOP, and one at the BOP. Thememory gauges use internal-strain gauges to measure temperatureand pressure independently. Baffle plates with holes are built sothat the gauge can be screwed onto the baffle plate, and the baffleplate is simply set into the tool joint. The drillstring (with the P/Tgauges in place) is run in the hole, and the test plug is landed in thewellhead. Using a data-acquisition system for cementing opera-tions, the temperature, pressure, rate, and volume are recordedduring the test. Upon completion of the BOP test, the memorygauges in the drillstring are retrieved, and the data are sequencedwith the data recorded at the CU.
Data Analysis and InterpretationThis section analyzes and interprets the real-time data obtainedfrom the downhole P/T gauges. Fig. 3 shows the CU dischargepressure, flow rate, and temperature data recorded by the P/Tgauges placed in the drillpipe. In a typical test, the pumping phaselasts for approximately 21⁄2 minutes, during which a total of 3.5 to4.0 bbl is pumped. For the drillpipe and test-line configuration ofFig. 1, the addition of this volume creates a fluid volumetric (com-pressive) strain of nearly 3%. During this phase, the pressure in-creases linearly with respect to volume pumped.
A summary of the CU-discharge temperatures for the pressure-up and shut-in phases is shown in Fig. 4. The temperature of thefluid at the CU discharge varies from 90 to 128°F. During the
high-pressure tests, the temperature at the CU discharge increasesby 19°F, on average. The more fluid that is pumped, the greaterthe temperature increase that is observed. Two of the BOP tests(#8 and #9) additionally pressure up the chokeline and kill line,in which the volume pumped is 8.8 bbl compared to a normal testvolume of 3.5 to 4.0 bbl. As shown in Fig. 4, Test #8 recordsan increase of 25°F, and Test #9 records an increase of 34°F at theCU discharge.
To potentially mitigate the heating-up and cooling-down effect,Test #11 uses water to pressurize the test volume, although SBMremained in the drillstring. As illustrated in Fig. 4, the rise in watertemperature at the CU discharge is less than 3°F. Because 97% ofthe pressurized test volume still contained SBM, the duration ofthe shut-in phase of the test is 37 minutes, which is comparable tothe duration of the shut-in phase of the other tests.
Fig. 5 shows the temperature recorded by the P/T gauges in thedrillpipe for all 11 tests. To identify individual tests, the pressure atthe CU discharge is plotted on the right-hand ordinate. The followingfeatures characterize the temperature response of the gauges:
• At each gauge location, the temperature response approxi-mately mimics the pressure response (i.e., rapid increase during thepumping phase, gradual decay during the shut-in phase, and rapiddecrease when the test ends).
• The temperature decay at the CU discharge during the shut-inphase is much greater than the decay at any of the P/T-gauge locations.
• The average temperature amplitudes (i.e., difference betweenthe maximum and minimum values of temperature recorded in agiven test) at the various locations are as follows:
Fig. 1—Schematic of components involved in testing the BOP stack.
239December 2005 SPE Drilling & Completion

CU discharge 19°F,Top gauge 24°F,Middle gauge 7°F, andBottom gauge 5°F.
Note that the minimum temperature at any location is typicallyrecorded at the beginning (just before commencement of pumping)or at the end of the test (when the pressure is released).
The temperature amplitudes at the CU discharge and top gaugeare of the same order of magnitude. The amplitudes at the middleand bottom gauges are comparable, but they differ significantlyfrom the values at the top gauge and the CU discharge. There is 2.6bbl of fluid between the CU discharge and the top gauge. Because3.5 to 4.0 bbl of fluid is pumped into the system during a typicaltest, the top gauge is influenced to a greater degree because of the
Fig. 3—Real-time pressure and temperature data from a BOP test.
Fig. 2—Trace of pressure vs. time on a circular-chart recorder used in a BOP test.
240 December 2005 SPE Drilling & Completion

pump-frictional effects (see Fig. 1). Furthermore, the magnitude ofthe change in volumetric strain is highest at the top of the drillpipe;therefore, the compressive work per unit volume is a maximum atthe top of the fluid column, which explains the significantly highertemperature amplitudes at the top-gauge location. Using themiddle gauge to represent the temperature increase caused by com-pression, resulting in an increase in internal energy, the averageincrease is 7°F.
Finally, during the shut-in phase, the rate of change of tem-perature at the CU discharge (0.39°F/min) is nearly twice the rateof change at the top-gauge location (0.18°F/min). The fluid in the
section between the CU and the drillpipe is approximately at aconstant temperature and loses heat by convection to the (isother-mal) ambient air. However, the fluid in the drillpipe is subject tothe relative insulating effects of the fluid in the drillpipe/riserannulus. Therefore, the rate of cooling inside the drillpipe is lower,as evidenced by the relatively similar rates of temperature decay atall three drillpipe P/T-gauge locations.
Fig. 6 shows the pressure and temperature at the CU dischargefor the low-pressure tests in which the target pressures vary from200 to 300 psi. The figure shows that when pumping stops, thefluid frequently heats up rather than cools down, thus resulting in
Fig. 5—Temperatures measured by the gauges.
Fig. 4—Temperature measured at the CU discharge unit.
241December 2005 SPE Drilling & Completion

increasing pressure. It is theorized that the fluid heat up is a resultof heat from the pipe being imparted back into the fluid from theprevious high-pressure-test heating of the pipe.
The temperature increase in the fluid is a result of two differentmechanisms: pump friction and an increase in fluid internal en-ergy. The pump friction is responsible for heating the fluid fromthe suction tank as it is being discharged into the test volume. The
internal energy of the fluid is related to the thermal states of thefluid molecules. An increase of internal energy usually raises thesystem’s temperature, and conversely, a decrease of internal en-ergy usually lowers the system’s temperature.3
Fig. 7 summarizes the pressure and temperature response in atypical high-pressure test. The figure indicates that the variation ofthe local pressure and temperature with time are different. When
Fig. 6—Illustration of low-pressure-test response.
Fig. 7—Pressure and temperature in the drillpipe during a typical high-pressure test.
242 December 2005 SPE Drilling & Completion

the system is shut in, the average temperature of the fluid decreasesbecause of the gradual loss of heat (to the ambient sea thatsurrounds the drillpipe/riser and to the atmosphere at the rigsurface), thus resulting in a corresponding decrease in pressure.The pressure appears to stabilize on a circular-chart recorder (seeFig. 2) because of the lack of resolution. However, the electronicdata show the pressure is continuing to decline (see Fig. 8).The derivative curve in Fig. 8 shows pressure continuing to dropat the rate of 4 psi/min at the end of the test. In summary, thedata collected by the downhole P/T gauges indicate the following(see Fig. 5):
• In the absence of a system leak, the pressure increase in thefluid is proportional to the volumetric (compressive) strain in thefluid. The net volumetric strain in the fluid is a result of the massadded to the system. For a given test volume and fluid, the slopeof the pressure-vs.-volume curve during the pumping phase is acalculable constant. By knowing the PVT behavior of the fluid andother parameters (described in Appendix A), the testing processcan be modeled.
• When the system is shut in, the pressure change is a functionof the rate of change of the average fluid temperature. If the rateof change of the average fluid temperature is known, the pressuredecay during shut-in can be predicted. This is analogous to calcu-lating annular pressure buildup (APB) in sealed subsea annuli inthe wellbore.4,5 In principle, the average temperature in the fluidcan be calculated by knowing (1) the rates of convection from thedrillpipe to the sea (via the riser and annular fluid in the drillpipeand riser), (2) the ambient marine-temperature profile, and (3) thetemperature profile in the fluid when the system is shut in.
Such calculations require the identification of variables such asthe rates of axial conduction in the drillpipe and fluid, the lateralconvection from its surface, the ambient temperature as a functionof depth (which can vary, depending on sea conditions), and thethermal properties of the drilling mud. Heat generated because offluid compression and pump friction determines the temperatureprofile in the fluid when it is shut in. However, the net averagetemperature of the fluid decreases monotonously after shut-in. Apredictive model to determine the rate of change of the average
fluid temperature requires an understanding of the heat-transfermechanisms during the pumping phase and immediately after shut-in.
Most deepwater drilling muds are emulsions containing syn-thetic-based fluids, brine phases, and weighting agents. Thermalproperties of the individual components of the mud system and theemulsion are not well understood. However, the necessity to man-age and mitigate APB in subsea wells has led to the study anddocumentation of the equations of state that describe the behaviorof SBM,6 but data on the thermophysical properties (specific heatand thermal conductivity) of the base fluids and brines of the SBMare still lacking. Nevertheless, order-of-magnitude analyses and anexamination of the data indicate that the rate of change of pressurewith time is a system characteristic.
Proposed Methodology for Test ValidationAnalysis of the electronic data provides insight toward a method-ology for validating a BOP test during the pumping and shut-inphases. A test can be validated by the analysis of the pressure vs.cumulative volume pumped during the pumping phase of a test (asshown in Fig. 9). Because a given volume added to a closedsystem results in a given (calculable) pressure increase, a valid testis ensured by the constant slope of the pressure vs. cumulativevolume. If the test volumes are unchanged, the pressure-vs.-cumulative-volume curves are parallel lines. A line that is notparallel allows immediate diagnosis of an invalid test. Such adetermination ensures that the test is terminated in a shorter periodof time than with a conventional chart recorder.
The traces of temperature and pressure vs. time during theshut-in phase show the effects of fluid cooling. The percent-pressure-decay-vs.-time curves shown in Fig. 10 provide the basisfor establishing a meaningful correlation between the relative pres-sure change and shut-in times as a function of the system param-eters (i.e., the heat loss from the shut-in fluid and the systemgeometry). Despite variance in the data from tests, a narrow group-ing in the percent pressure change vs. time curves can be observed.The variance is within 1% of the net percent change of pressurefor each test. Because of the tight band, within which the pressure-vs.-time curves lie during the shut-in phase, and the constancy of
Fig. 8—Rate of pressure change during the shut-in phase.
243December 2005 SPE Drilling & Completion

slope (of the pressure-vs.-time curves) during the pumping phase,a methodology has been identified for validating a BOP test inreal time in a fraction of the time required by current chart-re-corder methodology.
On the basis of analysis of the data collected during this project,it is postulated that a test can be validated in the minimum testtimes required per the governing regulations.
Modeling and Leak Detection
Fig. 11 shows the modeled pressure as a function of time forvarious leak sizes. The results are obtained from a simulationbased on a model described in Appendix A. A leak in the testvolume is characterized by its location (i.e., depth) and rate of fluidloss. The leak can occur anywhere in the test volume (e.g., pipe
Fig. 10—Pressure decline during the shut-in phase.
Fig. 9—Leak detection during the pumping phase.
244 December 2005 SPE Drilling & Completion
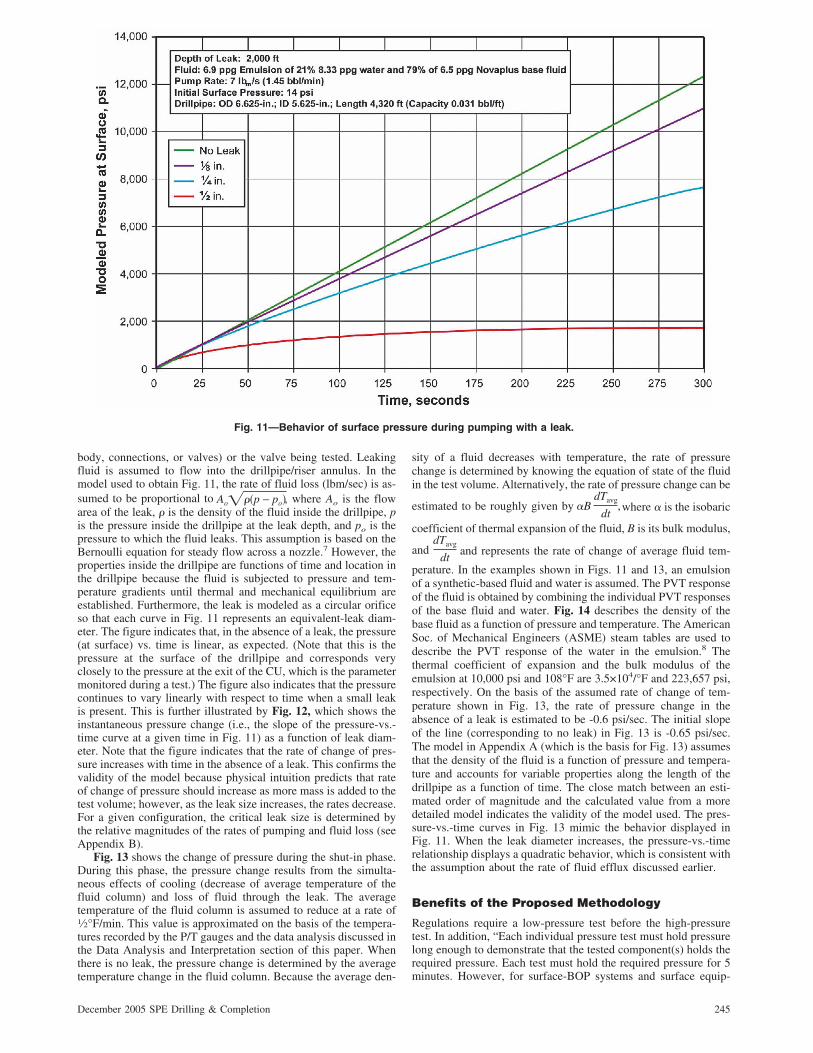
body, connections, or valves) or the valve being tested. Leakingfluid is assumed to flow into the drillpipe/riser annulus. In themodel used to obtain Fig. 11, the rate of fluid loss (lbm/sec) is as-sumed to be proportional to Ao���p − po�, where Ao is the flowarea of the leak, � is the density of the fluid inside the drillpipe, pis the pressure inside the drillpipe at the leak depth, and po is thepressure to which the fluid leaks. This assumption is based on theBernoulli equation for steady flow across a nozzle.7 However, theproperties inside the drillpipe are functions of time and location inthe drillpipe because the fluid is subjected to pressure and tem-perature gradients until thermal and mechanical equilibrium areestablished. Furthermore, the leak is modeled as a circular orificeso that each curve in Fig. 11 represents an equivalent-leak diam-eter. The figure indicates that, in the absence of a leak, the pressure(at surface) vs. time is linear, as expected. (Note that this is thepressure at the surface of the drillpipe and corresponds veryclosely to the pressure at the exit of the CU, which is the parametermonitored during a test.) The figure also indicates that the pressurecontinues to vary linearly with respect to time when a small leakis present. This is further illustrated by Fig. 12, which shows theinstantaneous pressure change (i.e., the slope of the pressure-vs.-time curve at a given time in Fig. 11) as a function of leak diam-eter. Note that the figure indicates that the rate of change of pres-sure increases with time in the absence of a leak. This confirms thevalidity of the model because physical intuition predicts that rateof change of pressure should increase as more mass is added to thetest volume; however, as the leak size increases, the rates decrease.For a given configuration, the critical leak size is determined bythe relative magnitudes of the rates of pumping and fluid loss (seeAppendix B).
Fig. 13 shows the change of pressure during the shut-in phase.During this phase, the pressure change results from the simulta-neous effects of cooling (decrease of average temperature of thefluid column) and loss of fluid through the leak. The averagetemperature of the fluid column is assumed to reduce at a rate of1⁄2°F/min. This value is approximated on the basis of the tempera-tures recorded by the P/T gauges and the data analysis discussed inthe Data Analysis and Interpretation section of this paper. Whenthere is no leak, the pressure change is determined by the averagetemperature change in the fluid column. Because the average den-
sity of a fluid decreases with temperature, the rate of pressurechange is determined by knowing the equation of state of the fluidin the test volume. Alternatively, the rate of pressure change can be
estimated to be roughly given by �BdTavg
dt,where � is the isobaric
coefficient of thermal expansion of the fluid, B is its bulk modulus,
anddTavg
dtand represents the rate of change of average fluid tem-
perature. In the examples shown in Figs. 11 and 13, an emulsionof a synthetic-based fluid and water is assumed. The PVT responseof the fluid is obtained by combining the individual PVT responsesof the base fluid and water. Fig. 14 describes the density of thebase fluid as a function of pressure and temperature. The AmericanSoc. of Mechanical Engineers (ASME) steam tables are used todescribe the PVT response of the water in the emulsion.8 Thethermal coefficient of expansion and the bulk modulus of theemulsion at 10,000 psi and 108°F are 3.5×10⁴/°F and 223,657 psi,respectively. On the basis of the assumed rate of change of tem-perature shown in Fig. 13, the rate of pressure change in theabsence of a leak is estimated to be -0.6 psi/sec. The initial slopeof the line (corresponding to no leak) in Fig. 13 is -0.65 psi/sec.The model in Appendix A (which is the basis for Fig. 13) assumesthat the density of the fluid is a function of pressure and tempera-ture and accounts for variable properties along the length of thedrillpipe as a function of time. The close match between an esti-mated order of magnitude and the calculated value from a moredetailed model indicates the validity of the model used. The pres-sure-vs.-time curves in Fig. 13 mimic the behavior displayed inFig. 11. When the leak diameter increases, the pressure-vs.-timerelationship displays a quadratic behavior, which is consistent withthe assumption about the rate of fluid efflux discussed earlier.
Benefits of the Proposed Methodology
Regulations require a low-pressure test before the high-pressuretest. In addition, “Each individual pressure test must hold pressurelong enough to demonstrate that the tested component(s) holds therequired pressure. Each test must hold the required pressure for 5minutes. However, for surface-BOP systems and surface equip-
Fig. 11—Behavior of surface pressure during pumping with a leak.
245December 2005 SPE Drilling & Completion

ment of a subsea-BOP system, a 3-minute test duration is accept-able if you record your test pressures on the outermost half of a4-hour chart, on a 1-hour chart, or on a digital recorder.”1
As per the regulations, and with the proposed methodology, aconservative estimate of time savings per BOP test is 9.3 hours;see Table 1. Of the 9.3 hours of time savings, 4.8 hours is critical-
path time savings. Many times, a test may be repeated and the timesavings is even greater. Assuming a rig tests BOPs 20 times in 1year, a conservative estimate of time savings is 186 hours; of that,96 hours is critical-rig-path time savings. A conservative estimateof 4 days rig-time savings per year holds a significant impact,especially when considering a number of rigs. Four days of rig
Fig. 13—Behavior of surface pressure during shut-in with a leak.
Fig. 12—Effect of leak size on rate of pressure change during pumping.
246 December 2005 SPE Drilling & Completion

time can easily equate to U.S. $1.5 million savings per year. Inaddition to time and cost savings, a large improvement in safetyresults in significantly less time exposure of personnel to high-pressure lines.
Conclusions1. The real-time methodology using digital data will have a sig-
nificant impact on safety, resulting from minimizing exposure tohigh-pressure lines.
Fig. 14—PVT response of synthetic-based fluid used in the BOP tests.
247December 2005 SPE Drilling & Completion

2. The proposed methodology for validating tests will have a sub-stantial impact on the industry as a result of time and costsavings.
3. During BOP tests, the fluid heats up by means of the combinedeffects of pump friction and increased internal energy.
4. Decaying pressure vs. time is a verified result of the fluid cool-ing after being heated during the pumping phase.
NomenclatureAo � flow area of leak, L2, in. 2
A(z) � drillpipe bore area, LT−2, in.2
B � bulk modulus, ML−1T−2, psiCp � specific heat of fluid, L2T−2�−1, Btu (lbm-°F)Dp � region of integration from top of drillpipe to the depth
at which it is pluggedg � acceleration caused by gravity, LT−2, ft/sec2
m � mass, M, lbmm(t) � mass at time t in the test volume, M, lbmm(t) � rate of change of mass or mass-flow rate at time t,
MT−1, lbm/secp � pressure, ML−1T−2, psi
p(z,t) � pressure at depth z and time t, ML−1T−2, psiQ(t) � volume flow rate at exit of the CU, L3T−1, bbl/min
T(z,t) � temperature at depth z and time t, �, °Ft � time, T−1, sec
V � test volume, L3, bblz � depth below rig surface, L, ft� � isobaric coefficient of thermal expansion of fluid, �−1,
°F−1
� � isothermal-fluid compressibility, M−1LT2, psi−1
�o � density of fluid at rig-surface temperature andpressure, ML−3, ppg
�(z,t) � fluid density at depth z and time t, ML−3, ppg
Subscriptsavg �average
e � condition at exit or at the leaki � condition at inlet
L � condition at depth of leako � initial value
AcknowledgmentsThe authors wish to extend a thank you to BP management forsupporting the work and permission to publish. A special thanks tothe men and women on the Transocean Horizon rig for their input,and to Cory Arceneaux with Halliburton Inc. for his assistance.
The authors also thank Tammy Knight of Knight Global En-terprises LLC for help in preparing and revising the manuscript.
References1. “Blowout Preventer (BOP) System Tests, Inspections, and Mainte-
nance,” Code of Federal Regulations, Title 30—Mineral Resources,Vol. 2, Sec. 250.407, U.S. DOI, Washington, DC (1 July 1999).
2. Wittmer, G.X.: “Recording Apparatus for Fluid Meters,” U.S. PatentNo. 716,973 (1902).
3. Van Wylen, G.J. and Sonntag, R.E.: Fundamentals of Classical Ther-modynamics, John Wiley and Sons Inc., New York City (1973) 97–105.
4. Halal, A.S. and Mitchell, R.F.: “Casing Design for Trapped AnnulusPressure Buildup,” SPEDC (June 1994) 107.
5. Payne, M.L. et al.: “Advanced Topics for Critical Service DeepwaterWell Design,” paper presented at the 2003 Penwell Deep OffshoreTechnology Conference, Marseilles, France, 19–21 November.
6. Zamora, M., Broussard, P.N., and Stephens, M.P.: “The Top 10 Mud-Related Concerns in Deepwater Drilling Operations,” paper SPE 59019presented at the 2000 SPE International Petroleum Conference andExhibition in Mexico, Villahermosa, Mexico, 1–3 February.
7. White, F.M.: Fluid Mechanics, second edition, McGraw-Hill, NewYork City (1986) 351–369.
8. ASME Steam Tables, third edition, American Soc. of Mechanical En-gineers, New York City (1977).
9. Timoshenko, S.: “Strength of Materials, Part 2,” Advanced Theory andProblems, third edition, D. Van Nostrand Co., Princeton, New Jersey(1968) 205–210.
10. Chapman, A.J.: Heat Transfer, fourth edition, Macmillan, New YorkCity (1984) 27–29.
11. ANSI/ASME Measurement Uncertainty Code, PTC 19.1-1985, Ameri-can Soc. of Mechanical Engineers, New York City (1986).
Appendix A—Modeling the Test ProcessLet p(z,t) and T(z,t) denote the pressure and temperature, respec-tively, in the drillpipe fluid at a depth z and time t. With referenceto Fig. 1, depth z�0 corresponds to the surface of the rig. Theorigin for time is arbitrary and can be chosen when pumpingbegins. The density �(z,t) of the fluid in the drillpipe is a functionof pressure and temperature. Therefore, the density varies withtime and location in the drillpipe. Further, if A(z) denotes the borearea of the drillpipe at depth z, the mass of fluid m(t) in thedrillpipe (test volume) at any time t is given by:
m�t� = �DP
��x,t�A�z�dz, . . . . . . . . . . . . . . . . . . . . . . . . . . . . . . . (A-1)
where DP denotes the region of integration and extends from thetop of the drillpipe to the depth at which it is plugged. Let mi(t)denote the instantaneous mass-flow rate at which fluid is added tothe test volume. Also, assume that a leak exists at a depth zL andthat the instantaneous mass-flow rate of the fluid exiting the leakis mo(t). Conservation of mass requires that:
mi�t� − mo�t� =dm�t�
dt, . . . . . . . . . . . . . . . . . . . . . . . . . . . . . . . . (A-2)
where m(t) is defined in Eq. A-1. In the test process, mi(t) isgenerally known from the volume flow rate Q(t) (bbl/min) gener-ated by the CU. If �o is the density of the fluid at rig-surfacetemperature and pressure, the instantaneous mass-flow rate into thetest volume is:
mi�t� = �oQ�t�. . . . . . . . . . . . . . . . . . . . . . . . . . . . . . . . . . . . . . . (A-3)
The rate of fluid loss from the leak is determined by assumingthat the leak is at a depth zL. The flow across the leak is driven bythe difference between the instantaneous internal pressure in thedrillpipe at this depth and the external pressure �o. This externalpressure is immediately downstream of the leak, and it may beassumed to represent the hydrostatic pressure of the fluid in thedrillpipe/riser annulus at the leak depth zL. If viscous flow lossacross the leak is neglected, the steady-state Bernoulli equationmay be applied to determine the flow velocity across the leak. Thisis essentially equivalent to assuming that the potential energy ofthe fluid caused by the hydrostatic head is converted entirely toflow energy. This is a standard approach used to determine invis-cid flow through orifices.7 Therefore, the mass-flow rate exitingthe test volume can be shown to be given by:
mo�t� = �Ao�2��zL,t��p�zL,t� − po�zL,t��, p�zL,t� � po�zL,t�
0, p�zL,t� � po�zL,t��.
. . . . . . . . . . . . . . . . . . . . . . . . (A-4)
Note that the right-hand side of Eq. A-4 is a function of time.Because the density and the pressure are continuously changing,the expression for mo(t) is valid for small intervals of time so thatthe assumption of constant pressure and density inside the drillpipeis justified. Furthermore, note that the mass-flow rate is zero whenthe drillpipe pressure is less than the pressure outside the leak orwhen the leak area Ao is zero. The instantaneous net rate of changeof net mass in the drillpipe is determined by substituting Eqs. A-3and A-4 into Eq. A-2.
If flow losses caused by a leak are neglected, force balancerequires that:
248 December 2005 SPE Drilling & Completion

dp�z,t�
dz= ��z,t�g, . . . . . . . . . . . . . . . . . . . . . . . . . . . . . . . . . . . . (A-5)
where g denotes the acceleration caused by gravity. (If the densityis measured in ppg and the pressure gradient in psi/ft, g on theright-hand side of Eq. A-5 is replaced by the conversion factor0.0519.) Eq. A-5 states that hydrostatic conditions prevail in thedrillpipe at all times. This is a reasonable assumption, unless theleak is copious and the leak area is comparable to the drillpipe borearea. Because the aim of the model is to detect small leaks, it isreasonable to assume that quasihydrostatic conditions prevail at alltimes. Also, note that the added fluid behaves more like a slug offluid that compresses the original fluid inside the drillpipe.
The equation of state for the fluid describes the density of thefluid as a function of pressure and temperature:
� = ��p,T�. . . . . . . . . . . . . . . . . . . . . . . . . . . . . . . . . . . . . . . . . . (A-6)
Because the state description of the fluid is included in the model,effects of variable compressibility and thermal expansivity areimplicit in the results.
The equation of state enables the determination of the densityin the drillpipe as a function of depth at any given time, providedthe local pressure and temperature are known.
During the pumping phase, the fluid undergoes compression.The rate of temperature change because of the compressive workdone on the fluid is given by:
dT�z,t�
dt=�
1
Cp
p�z,t�
���z,t��2
d��z,t�
dt,
d��z,t�
dt� 0
0,d��z,t�
dt� 0
, . . . . . . . . . . . . . (A-7)
where Cp denotes the specific heat of the fluid at constant pressure.Note that compressive work is done only when the local densityincreases. Local density decreases are accompanied by local cool-ing, which is neglected in this model. Finally, in addition to thetemperature change described by Eq. A-7, the fluid experiencestemperature changes because of heat transfer by the addition of hotfluid from the CU during the pumping phase and heat loss to theambient sea.
The hot fluid added from the CU transfers heat to the coolerfluid (that is originally present) in the drillpipe mainly by conduc-tion. The temperature profile at any point in the drillpipe is thusdetermined by the competing effects of conduction from the hotslug of pumped fluid and convection to the ambient sea from thedrillpipe outside diameter (OD). Modeling the heat transfer in thedrillpipe involves the computation of a transient heat-conductionprocess. In this paper, the temperature profiles are assumed orestimated on the basis of the analysis of the data gathered from thedownhole P/T gauges installed in the drillpipe.
If the instantaneous temperature profile is known in the drill-pipe, the simultaneous equations, Eqs. A-2, A-5, and A-6, can besolved numerically. The use of the equation of state (Eq. A-6)ensures that the variation of thermophysical properties of the drill-ing mud with depth and time are properly accounted for.
Finally, an unstated assumption that underlies Eq. A-1 is ex-amined. The drillpipe bore area A(z) is assumed constant. Thevariation of the drillpipe OD and inside diameter with pressure andtemperature changes has not been included. In the tests describedin this paper, a thick-walled 65⁄8-in. drillpipe (0.500-in. wall thick-ness) is used. Application of Lame’s equation for a cylinder9 in-dicates that the drillpipe volumetric strain for a 12,000-psi changeof pressure at surface is of the order of 0.08%. The compressivevolumetric strain caused by added fluid during the pumping phaseis of the order of 3.5%. Therefore, neglecting the increase of thedrillpipe volume because of pressurization does not lead to appre-ciable error. If thinner-wall drillpipe is used, the term A(z) must bemodified by using Lame’s equations, so that it becomes a functionof the instantaneous pressure in the drillpipe and, hence, a functionof time.
Appendix B—The Critical Leak SizeConsider a rigid container of volume V into which fluid is pumpedat a rate mi(t). Let fluid be lost because of the leak at a rate me(t).The notion of a critical leak size is best illustrated by assuming thatthe pressure, temperature, and density of the fluid are uniformthroughout the container at any given time. Mass is conserved inthe container according to Eq. A-2. If the density of the fluid ata given instant of time is constant throughout the container, Eq.A-1 becomes:
m�t� = V��t�. . . . . . . . . . . . . . . . . . . . . . . . . . . . . . . . . . . . . . . . (B-1)
Substituting Eq. B-1 into Eq. A-2 yields the following relationfor the rate of change of fluid density in the container:
d��t�
dt=
mi�t� − me�t�
V. . . . . . . . . . . . . . . . . . . . . . . . . . . . . . . . . (B-2)
The equation of state for the fluid (i.e., Eq. A-6) can be used toobtain an expression for the change in density (��) required be-cause of infinitesimal changes in temperature (�T) and pressure(�P), so that:
���p,T�
��p,T�=
1
��p,T�
���p,T�
�T �P
�T +1
��p,T�
���p,T�
�P �T
�p
= ��T + ��p. . . . . . . . . . . . . . . . . . . . . . . . . . . . . . . . (B-3)
In Eq. B-3, the coefficients of �T and �p are the isobaric co-efficient of thermal expansion � and the isothermal compressibil-ity of the fluid (�), respectively.10 Note that the reciprocal of � iscommonly referred to as the bulk modulus. Although � and � arefunctions of pressure and temperature, they are treated as constantsin this Appendix.
By combining Eq. B-3 with Eq. B-2, and then substituting theexpression for the rate of mass efflux given in Eq. A-4, the fol-lowing equation for the rate of pressure change is obtained:
dp�t�
dt=
1
� �mi
m− �
dT�t�
dt � −1
�mAo�2m�p�t� − po�
V, p�t� � po.
. . . . . . . . . . . . . . . . . . . . . . . . . (B-4)
Eq. B-4 relates the instantaneous pressure to the rate of changeof temperature (dT(t)/dt) resulting from cooling or heating of thefluid and the rates of fluid entering and leaving the container. Thefirst term on the right-hand side of Eq. B-4 describes the pressurechange caused by mass influx and temperature change. The termmi
mdescribes the volumetric (compressive) strain rate in a rigid
container, while the term �dT�t�
dtdenotes the volumetric-strain rate
from thermal expansion of the fluid. The rate of mass exiting the
container is given by�2m�p�t� − po�
V, so that
1
m�2m�p�t� − po�
V
is the volumetric-strain rate caused by fluid loss from the leak.Multiplying the strain rate by the reciprocal of the compressibilityyields the rate of pressure change. Therefore, the relative magni-tudes of the rate of pressure change caused by mass influx andtemperature change vs. fluid loss from the leak are indicated by theratio of the two terms on the right-hand side of Eq. B-4.
Fig. 10 illustrates the pressure decay for the various tests duringthe shut-in phase. Though the test volumes and the peak pressuresdo not vary significantly across the tests (with the exception ofTests #8 and #9), the pressure-vs.-time data show some scattercaused by the inevitable variation of parameters (e.g., changes inambient temperature, variation of properties of added fluid, chang-ing sea conditions) that control the pressure. In addition, the mea-surement error (in the pressure transducer and the data-acquisitionsystem) contributes to the scatter shown in Fig. 10. Therefore, thepressure measurement is characterized by an “error band” that is afunction of the uncertainty/variability in the system parameters andthe measuring system. The error band can be quantified by using
249December 2005 SPE Drilling & Completion

standard techniques of uncertainty analysis.11 The critical leak sizeis the smallest leak that can be detected unambiguously. In light ofthe discussion thus far, the smallest identifiable leak is the one thatgenerates a pressure that lies outside the error band of a valid test.
SI Metric Conversion Factorsbbl × 1.589 873 E–01 � m3
°F (°F–32)/1.8 � °Cin.2 × 6.451 6* E+00 � cm2
lbm/sec × 4.535 924 E–01 � kg/spsi × 6.894 757 E+00 � kPa
psi/ft × 2.62 059 E+01 � Pa/m
*Conversion factor is exact.
C. Mark Franklin is a drilling superintendent with BP AmericaInc., Houston (e-mail: [email protected]). His 21-year careerbegan in the Rocky Mountains, continued to numerous inter-national locations, and includes the shelf and deepwater pro-jects in the Gulf of Mexico. He has held various engineeringand operation positions in drilling, completions, and produc-tion. He holds a BS degree in petroleum engineering from theU. of Louisiana at Lafayette. Richard Vargo is currently a tech-nical adviser for Halliburton’s Gulf of Mexico operations, work-ing in Houston (e-mail: [email protected]). Previ-ously, he worked for Vastar, then BP America Inc., with theirdeepwater projects in Houston. Vargo joined Halliburton in
1993 and worked in various operations-engineering capacitiesfrom 1993 through 1999, including cementing, stimulation, andlogging. He holds a BS degree in mechanical engineering fromWest Virginia U. Udaya B. Sathuvalli is a consultant with BladeEnergy Partners, Dallas (e-mail: ubsathuvall [email protected]). Before becoming a consultant, he was a re-search engineer with the drilling and completion group atArco E&P Technology in Plano, Texas. During the last few years,his work has focused on the development of solutions to spe-cial problems in drilling and production, with particular focuson solid/fluid mechanics and heat transfer. His current interestsinclude mechanics of cellular solids, application of probabilis-tic methods to OCTG design and analysis, and coiled-tubingmechanics. Sathuvalli holds a BS degree in electrical engineer-ing from Karnataka Regional Engineering College, Surathkal,India; an MS degree in high-voltage engineering from the In-dian Inst. of Science, Bangalore, India; and a PhD degree inmechanical engineering from Rice U., Houston. Mike Payne isa senior adviser for BP America Inc. in their E&P TechnologyGroup; previously, he was an adviser for Arco. He has 23 yearsof drilling experience, including operations, computing, tech-nology, and consulting. He has been published extensively inthe industry, is Chairman of the American Petroleum Inst. PipeCommittee (SC5), and Convener of ISO SC5 WG2 and SC4WG1. Payne holds BS and PhD degrees in mechanical engi-neering from Rice U., an MS degree in petroleum engineeringfrom the U. of Houston, and an executive education from theU. of Chicago GSB. He serves on the board of the Drilling En-gineering Assn., has been recognized by SPE as a DistinguishedLecturer, and is the SPE International Drilling Engineering Awardrecipient for 2000.
250 December 2005 SPE Drilling & Completion