adt – advanced dvorak technique - world … – advanced dvorak technique tim olander and chris...
TRANSCRIPT

ADT – Advanced Dvorak Technique
Tim Olander and Chris Velden
University of Wisconsin – Madison
Cooperative Institute for Meteorological Satellite Studies (CIMSS)
2nd International Workshop onSatellite Analysis of Tropical Cyclones
Honolulu, Hawaii16-18 February, 2016

We wish to acknowledge the valuable feedback from variousoperational users, specifically:
- Jack Beven and many other forecasters/specialists at the NOAA/National Hurricane Center
- Andrew Burton and Joe Courtney with the AustralianBureau of Meteorology
Special thanks to Jeff Hawkins and the Naval Research Laboratory/Office of Naval Research, as well as to NOAA/NESDIS
for providing R&D support towards the continued ADT development and operational implementation.
Advanced Dvorak TechniqueAcknowledgments
Advanced Dvorak TechniquePresentation Outline
• ADT Overview and Upgrades• Recent Validation• Current Status and Availability• Coming and Future Capabilities
Advanced Dvorak TechniquePresentation Outline
• ADT Overview and Upgrades• Recent Validation• Current Status and Availability• Coming and Future Capabilities
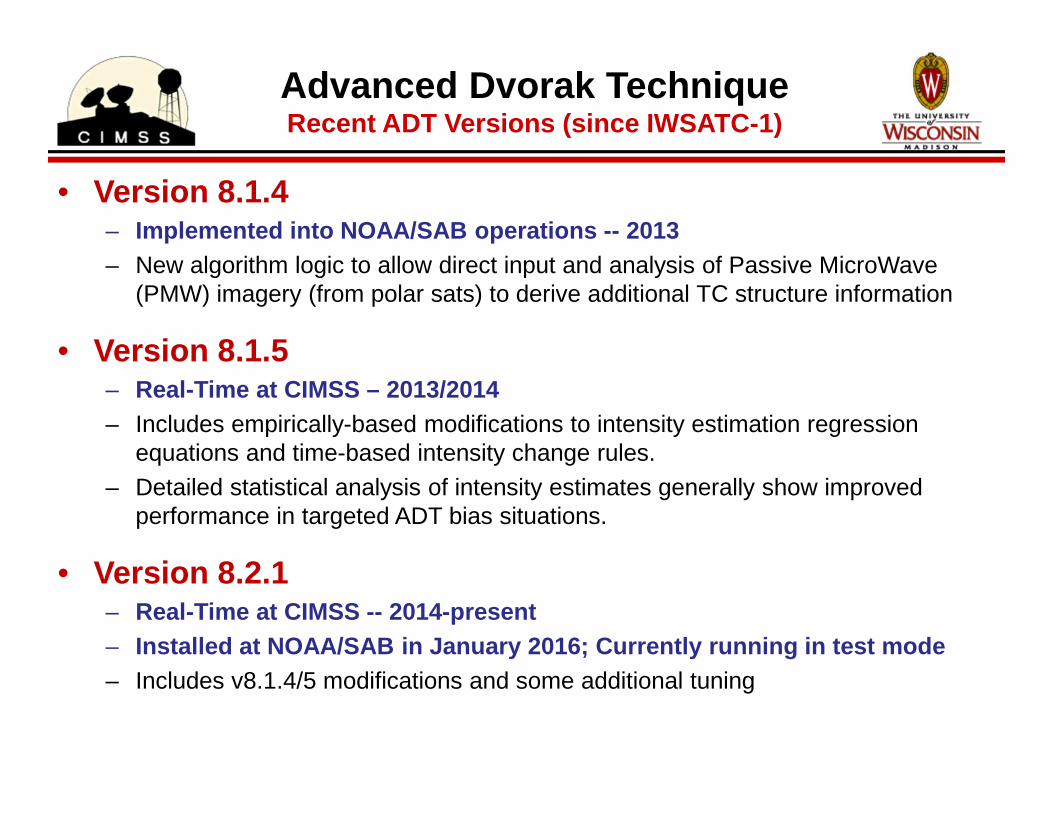
• Version 8.1.4– Implemented into NOAA/SAB operations -- 2013– New algorithm logic to allow direct input and analysis of Passive MicroWave
(PMW) imagery (from polar sats) to derive additional TC structure information
• Version 8.1.5– Real-Time at CIMSS – 2013/2014– Includes empirically-based modifications to intensity estimation regression
equations and time-based intensity change rules.– Detailed statistical analysis of intensity estimates generally show improved
performance in targeted ADT bias situations.
• Version 8.2.1– Real-Time at CIMSS -- 2014-present– Installed at NOAA/SAB in January 2016; Currently ru nning in test mode– Includes v8.1.4/5 modifications and some additional tuning
Advanced Dvorak TechniqueRecent ADT Versions (since IWSATC-1)
Summary• ADT now incorporates passive microwave (PMW) information from
polar satellites in developing TC stages to aid in the detection of increased organization when the IR-based objective scene identification scheme cannot discern developing eye/eyewall features due to high-level overcast (ADT T#s often “plateau” around T3.5).
• Algorithm now inputs SSMIS, AMSR2 or GMI data from near-real-time polar satellite passes over TCs. Based on the amount of organization (banding or eyewall wrap and strength) in 85-91GHz, a PMW “score” is calculated.
• If the score exceeds empirically-determined thresholds, it is converted to a CI# value and can over-ride the IR-based CI#.
• Most effective in CDO conditions prior to emergence of eye in IR.
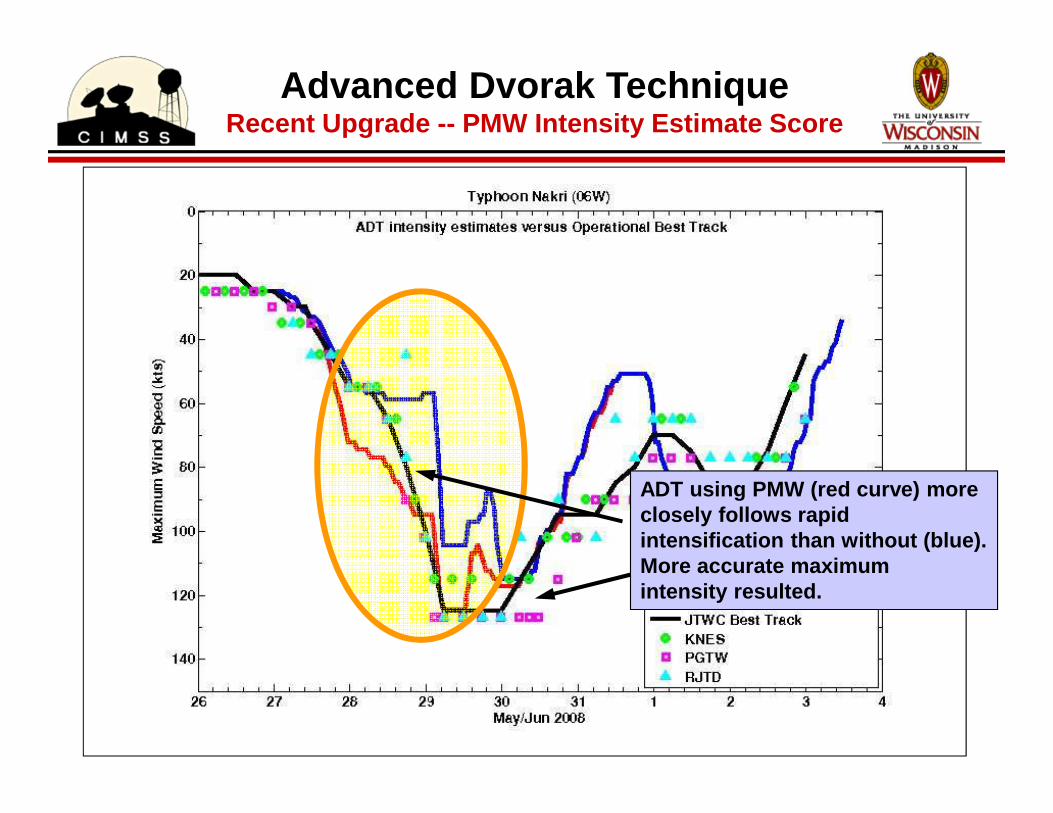
Advanced Dvorak TechniqueRecent Upgrade -- PMW Intensity Estimate Score

• Uses PMW 85-91GHz brightness temperature signal to deduce the vigor and organization of the developing eyewall/eye, and calculate an intensity score
• If score thresholds are exceeded, they are converted to either T# of 4.3 (72 kts) or 4.8 (85 kts) in the ADT, over-riding the current T# based on IR
• Successful in alleviating the intensity “plateau” around T3.5 in many TC cases
Warmest eye pixel
Coldest eyewall temperature
Hurricane Dolly, 23 July 2008 1126 UTC
DMSP SSMIS 85GHz (H) brightness temperature
Advanced Dvorak TechniqueRecent Upgrade -- PMW Intensity Estimate Score
Amount ofeyewall wrap
Advanced Dvorak TechniqueRecent Upgrade -- PMW Intensity Estimate Score
ADT using PMW (red curve) more closely follows rapid intensification than without (blue).More accurate maximum intensity resulted.

Intensity range affected most by addition of PMW information
Comparison of ADT version with PMW (v8.1.4+) and previous version w/out PMW (v7.2.3)
7.2.3 Mean Error7.2.3 Bias8.1.4 Mean Error8.1.4 Bias
Advanced Dvorak TechniqueRecent Upgrade -- PMW Intensity Estimate Score
Vmax
IntensityBins(kts)
(vs. NHC Recon-aidedBest Track)

Advanced Dvorak TechniqueRecent Upgrade -- PMW Textual & Graphical Products
• PMW data input and eye score analysis now done internally within ADT algorithm (still need external PMW data source feed to algorithm)
• Graphical interface allows for visual inspection of PMW analysis.
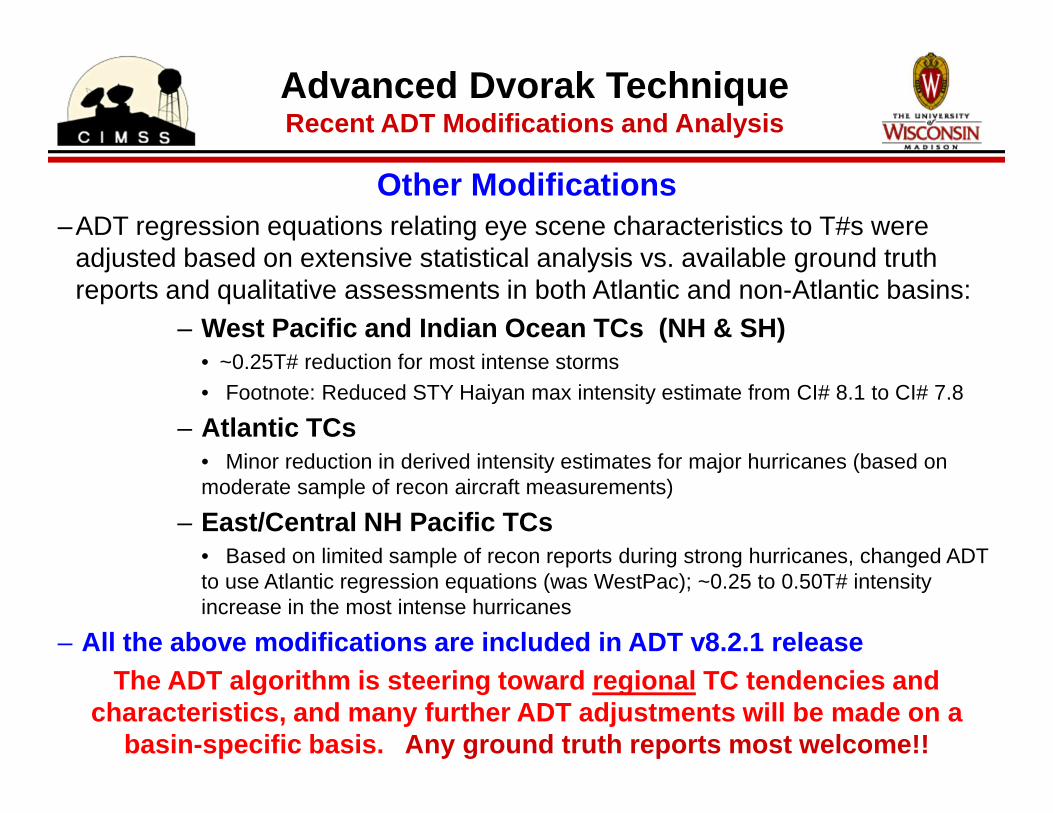
Other Modifications –ADT regression equations relating eye scene characteristics to T#s were
adjusted based on extensive statistical analysis vs. available ground truth reports and qualitative assessments in both Atlantic and non-Atlantic basins:
– West Pacific and Indian Ocean TCs (NH & SH)• ~0.25T# reduction for most intense storms• Footnote: Reduced STY Haiyan max intensity estimate from CI# 8.1 to CI# 7.8
– Atlantic TCs• Minor reduction in derived intensity estimates for major hurricanes (based on moderate sample of recon aircraft measurements)
– East/Central NH Pacific TCs• Based on limited sample of recon reports during strong hurricanes, changed ADT to use Atlantic regression equations (was WestPac); ~0.25 to 0.50T# intensity increase in the most intense hurricanes
– All the above modifications are included in ADT v8. 2.1 releaseThe ADT algorithm is steering toward regional TC tendencies and
characteristics, and many further ADT adjustments will be made on a basin-specific basis. Any ground truth reports most welcome!!
Advanced Dvorak TechniqueRecent ADT Modifications and Analysis
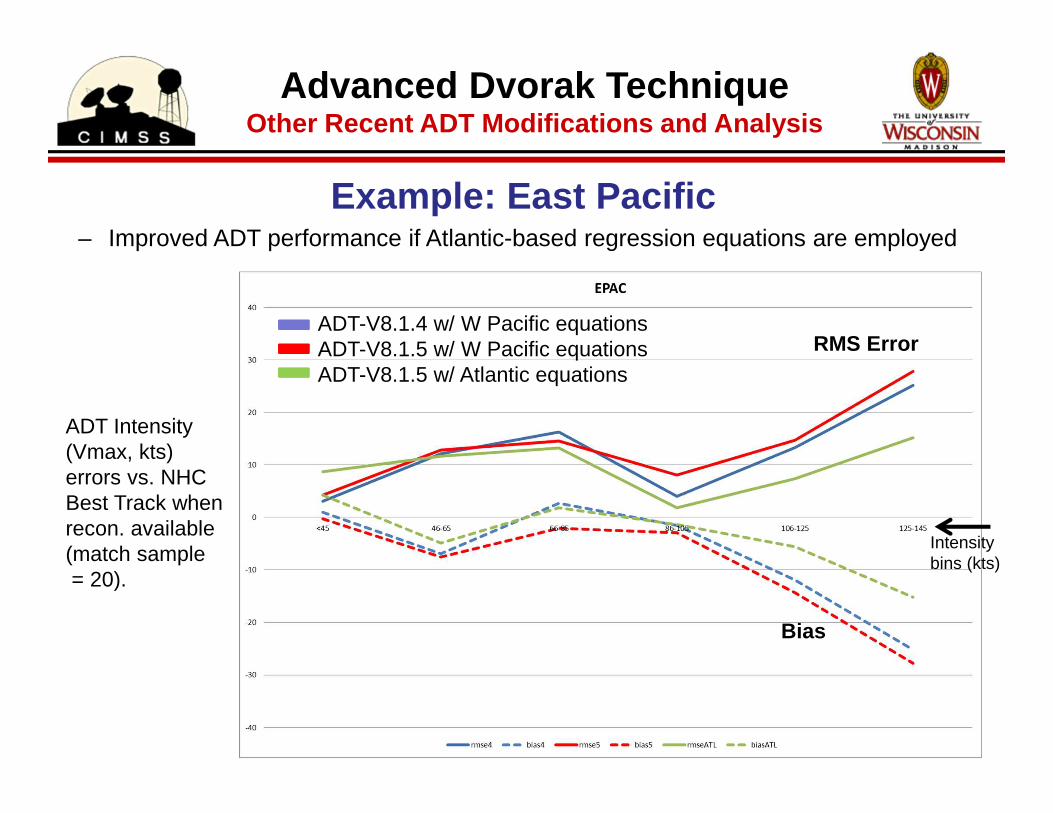
Example: East Pacific– Improved ADT performance if Atlantic-based regression equations are employed
Advanced Dvorak TechniqueOther Recent ADT Modifications and Analysis
Bias
RMS ErrorADT-V8.1.4 w/ W Pacific equationsADT-V8.1.5 w/ W Pacific equationsADT-V8.1.5 w/ Atlantic equations
ADT Intensity(Vmax, kts)errors vs. NHCBest Track whenrecon. available (match sample= 20).
Intensitybins (kts)

Advanced Dvorak TechniquePresentation Outline
• ADT Overview and Upgrades• Recent Validation• Current Status and Availability• Coming and Future Capabilities
• ADT performance statistics derived annually– Performance analysis conducted for individual storms and basin-wide for
TC seasons, globally:• North Atlantic, East/Central Pacific, West Pacific, South Pacific, N & S Indian
Ocean basins
• Comparisons vs. NHC or JTWC Best Track intensities– Precision and accuracy statistics derived for intensity and position
• East/Central Pacific: NHC Best Track (recon aided, when available)• West Pacific, South Pacific, and Indian Ocean: JTWC Best Track• Atlantic: NHC Best Track coincident (+/- 3 hours) with aircraft recon
– JTWC Best Track data utilized since it is readily a vailable and updated frequently (RSMC/TCWC BT could be used if a vailable)
• ATCF “B-deck” files obtained via FTP or SCP
Advanced Dvorak TechniqueValidation

• 2015 Atlantic and East/Central Pacific Seasons– E/C Pac: ADT comparisons utilize NHC Working BT wi thin +/- 30 minutes– ATL: NHC Working BT within +/- 3 hours of aircraft reconnaissance
Advanced Dvorak TechniqueRecent Validation
Atlantic - 47 total matchesbias aae stdv
CI# 0.00 0.46 0.60Wind(kts)-0.83 9.15 12.07MSLP(mb) -0.89 8.06 10.62
E/C Pacific - 711 total matchesbias aae stdv
CI# 0.15 0.45 0.58Wind(kts) 2.52 8.71 11.77MSLP(mb) -1.98 7.61 10.49
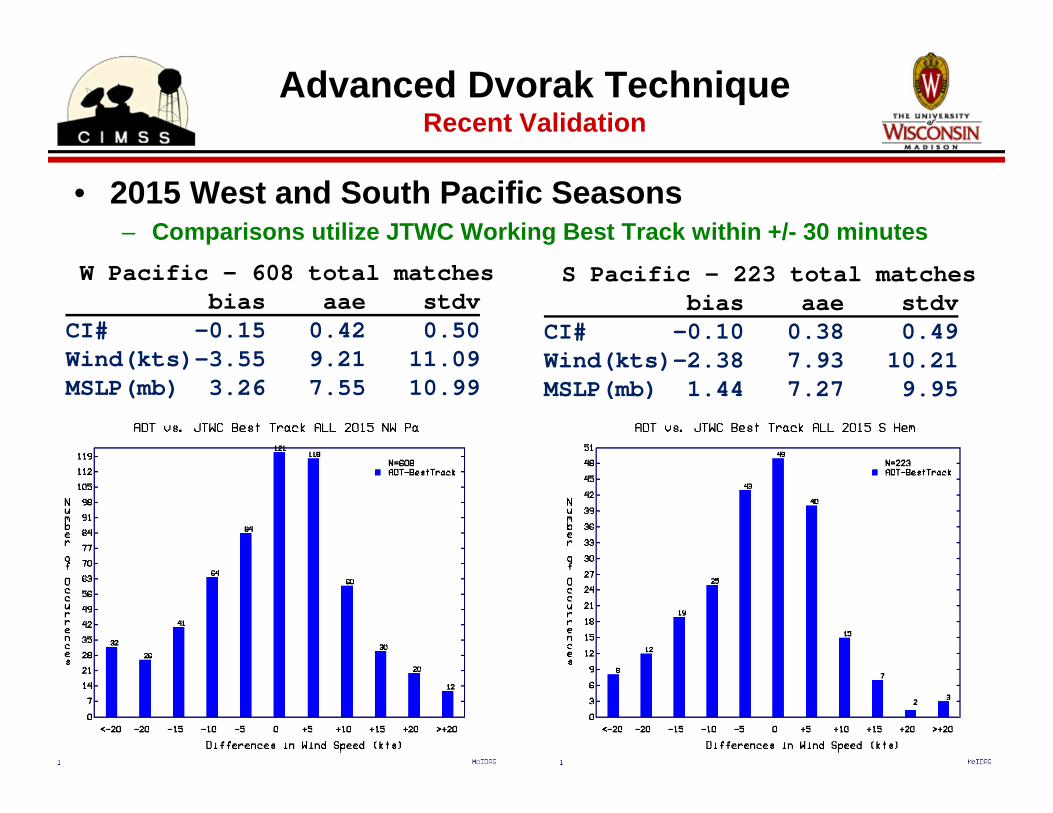
• 2015 West and South Pacific Seasons– Comparisons utilize JTWC Working Best Track within + /- 30 minutes
Advanced Dvorak TechniqueRecent Validation
W Pacific - 608 total matchesbias aae stdv
CI# -0.15 0.42 0.50Wind(kts)-3.55 9.21 11.09MSLP(mb) 3.26 7.55 10.99
S Pacific - 223 total matchesbias aae stdv
CI# -0.10 0.38 0.49Wind(kts)-2.38 7.93 10.21MSLP(mb) 1.44 7.27 9.95

HURRICANE PATRICIA DISCUSSION NUMBER 8NWS NATIONAL HURRICANE CENTER MIAMI FL EP202015400 AM CDT THU OCT 22 2015
“Patricia has become significantly better organized overnight, with an eye evident on infrared imagery, and the system now has well-defined convective banding features. The initial intensity estimate is set at 75 kt, which is above the Dvorak estimates from TAFB and SAB at 0600 UTC to account for the increased organization since that time. This is also in good agreement with the most recent ADT estimates .”
AIRCRAFT RECON
Patricia was the strongest hurricane everobserved in the Western Hemisphere
The ADT correctly analyzed the record-settingmaximum winds just before landfall
on the coast of Mexico
ADT Tropical Cyclone Intensity Estimates--Maximum Sustained 1-min Wind Speed (knots)--
Advanced Dvorak TechniqueIntensity Estimates for Hurricane Patricia

Advanced Dvorak TechniquePresentation Outline
• ADT Overview and Upgrades• Recent Validation• Current Status and Availability• Coming and Future Capabilities
• Real-time global ADT intensity estimates are routin ely accessed and utilized by many tropical agencies from the CIMSS T C web site:
http://tropic.ssec.wisc.edu/real-time/adt/adt.html
• Version 8.2.1 is currently operational on the CIMSS TC web site– Includes PMW image ingest and inline score determination algorithms
• NOAA/NESDIS/SAB runs the ADT in real time for all g lobal TC basins to provide operational estimates on their web site and via ATCF– Version 8.2.1 is currently being tested; operational soon
• ADT v8.2.1 is available from CIMSS upon request and authorization-- No-cost license agreement (no redistribution)-- McIDAS-X is required for installation and data ingest-- Will become available in McIDAS-V in 2017
• Updated versions of the ADT will become available a s they are successfully tested
Advanced Dvorak TechniqueCurrent Status and Availability

Advanced Dvorak TechniqueCurrent Status and Availability
ADT real-time homepage: http://tropic.ssec.wisc.edu/real-time/adt

Advanced Dvorak TechniquePresentation Outline
• ADT Overview and Upgrades• Recent Validation• Current Status and Availability• Coming and Future Capabilities
• Improving ADT performance during/after Extratropica l Transition– A general small intensity bias (ADT too weak) has been identified during ET– Two experimental modifications are currently being tested and evaluated
• Investigating a modified ADT for use in Sub-Tropica l systems– Examination underway on past ST cases to identify potential modified T#s– Possible new ADT scene type and/or identifier
• Integrating latest ARCHER (v2.0) objective TC cente r fix algorithm– Initial ARCHER 2.0 routines have been implemented and tested– Transitioning code to real-time usage and defining utilization of ARCHER
information w/in ADT
• Examining the impact of 10-min. Himawari-8 data– Comparing parallel runs utilizing 30-min. vs 10-min. Him-8 images to assess
impacts on ADT response/performance especially in rapid intensity flux situations
• Completing the implementation of the ADT into McIDA S-V– Code has been converted to JAVA with the initial GUI written and tested– Need to integrate code into McIDAS-V architecture– Expect availability to users in 2017
Advanced Dvorak TechniqueCurrent Research Efforts
Advanced Dvorak TechniqueCurrent Research Efforts -- Extratropical Transition
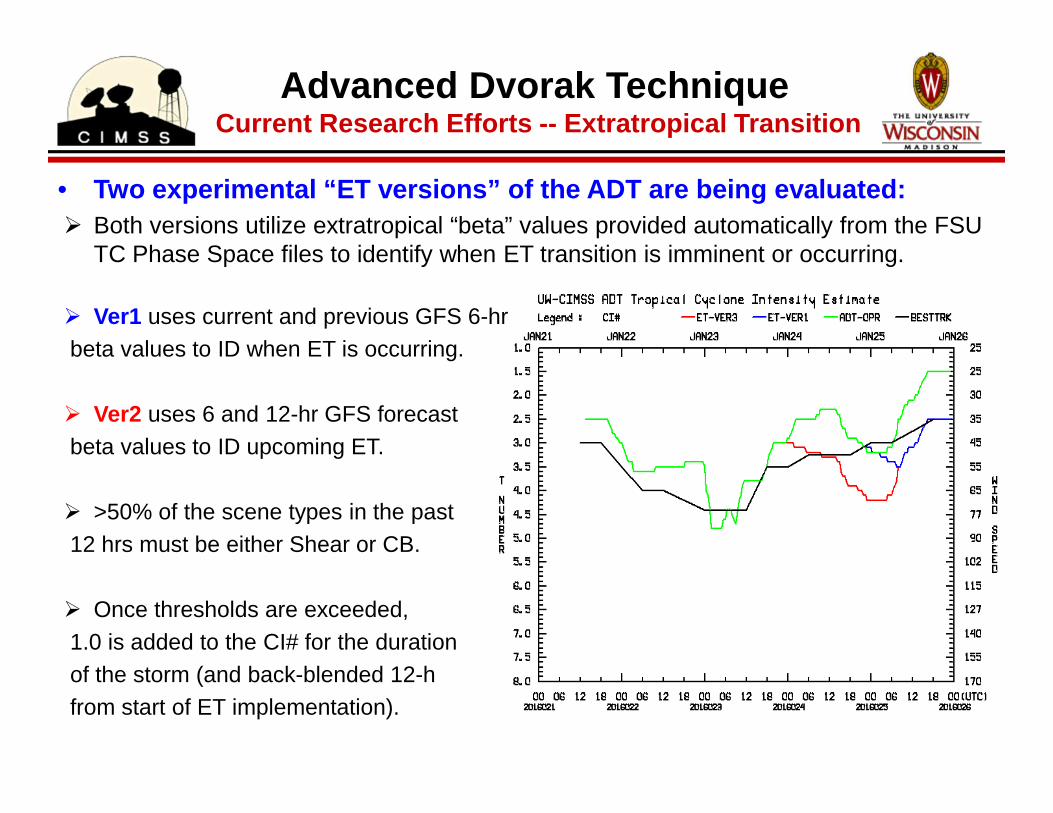
• Two experimental “ET versions” of the ADT are being evaluated:� Both versions utilize extratropical “beta” values provided automatically from the FSU
TC Phase Space files to identify when ET transition is imminent or occurring.
� Ver1 uses current and previous GFS 6-hrbeta values to ID when ET is occurring.
� Ver2 uses 6 and 12-hr GFS forecastbeta values to ID upcoming ET.
� >50% of the scene types in the past12 hrs must be either Shear or CB.
� Once thresholds are exceeded, 1.0 is added to the CI# for the durationof the storm (and back-blended 12-h from start of ET implementation).
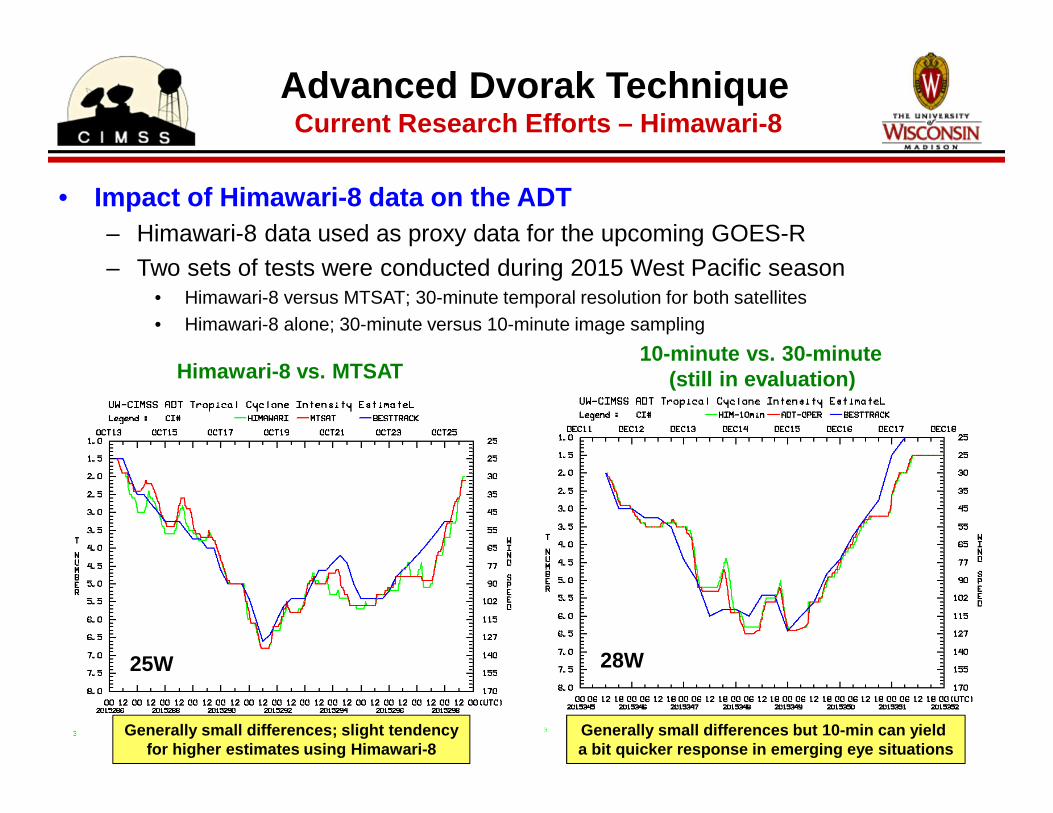
Advanced Dvorak TechniqueCurrent Research Efforts – Himawari-8
• Impact of Himawari-8 data on the ADT– Himawari-8 data used as proxy data for the upcoming GOES-R– Two sets of tests were conducted during 2015 West Pacific season
• Himawari-8 versus MTSAT; 30-minute temporal resolution for both satellites• Himawari-8 alone; 30-minute versus 10-minute image sampling
Himawari-8 vs. MTSAT
25W
10-minute vs. 30-minute(still in evaluation)
28W
Generally small differences; slight tendencyfor higher estimates using Himawari-8
Generally small differences but 10-min can yield a bit quicker response in emerging eye situations

• Adapt to GOES-R (expected launch -- Fall of 2016)
• Develop ADT “Front End” for pre-genesis disturbance tracking and intensity analysis
– Identify and track developing cloud clusters and classify systems in T# 1-0 to 2.0 range. – Help to better initialize ADT in developing TC stage– Experimental version run during 2015 TC season produced mixed results; additional
research needed
• Improve Curved Band and Shear scene intensity estim ates– Need improved analysis capabilities (especially during TC formation stage) – Employ a regression-based methodology (as with Eye and CDO scene types); Initial
tests show some improvement over current “Dvorak-based” methods
• Continue to explore ‘IR/WV differencing’ (Olander and Velden, W&F, 2009)
– Initial algorithm developed but follow-up analysis not yet completed– Shows some predictive elements with rapid deepening cases– Could be used to improve ADT regression-based CI# correlations for pre-Eye scene
types (CDO and Embedded Center)
Advanced Dvorak Technique(Possible) Future Applications & Research

Advanced Dvorak Technique
Questions?