admiral markets as unaudited interim report 2019
TRANSCRIPT

Admiral Markets AS
Unaudited interim report
2019

Commercial Registry no. 10932555
Address Maakri 19/1, Tallinn, 10145
Telephone 372 6 309 300
Fax 372 6 309 304
E-mail [email protected]
Main area of activity Investment services
Beginning and end date of interim report period 01. January - 31. December
Chairman of the Management Board Sergei Bogatenkov
Members of the Management BoardDmitry KuravkinDmitri LaušJens Chrzanowski
Chairman of the Supervisory Board Aleksander Tsikhilov
Members of the Supervisory Board Anton TikhomirovAnatolii Mikhalchenko
Auditor PricewaterhouseCoopers AS
Admiral Markets AS
Unaudited interim report 2019

3
Management Board declarationThe 2019 interim report of Admiral Markets AS consists of the management report and financial statements.
The data and the additional information provided by Admiral Markets AS in the 2019 interim report are true and complete.
The accounting policies adopted in preparing the financial statements are in accordance with the International Financial Reporting Standards as adopted by the European Union and give a true and fair view of the financial position, financial performance and cash flow of the entity.
The financial statements of the interim report of 2019 are unaudited.
/digitally signed/Sergei BogatenkovChairman of the Management Board
Tallinn, 28.02.2020

4
Highlights 2019• Net trading income was EUR 23.2 million (2018: EUR 24.2 million)
• EBITDA1 was EUR 5.8 million (2018: EUR 10.1 million)
• EBITDA margin was 25% (2018: 42%)
• Net profit was EUR 4.6 million (2018: EUR 9.5 million)
• Net profit margin was 20% (2018: 39%)
• Cost to income ratio was 83% (2018: 63%)
• Value of trades up 3% to EUR 590 billion (2018: EUR 572 billion)
• Number of trades up 6% to 31.8 million (2018: 30.1 million)
1 Earnings before interest, taxes, depreciation and amortization
EBITDA margin 25% Net profit EUR 4.6m
25%
42%
33%
4.6
9.5
6.0
2019
2018
2017
2019
2018
2017
Cost to income ratio 83%
83%
63%
66%
EBITDA EUR 5.8m
5.8
10.1
6.4
2019
2018
2017
2019
2018
2017
Net trading income EUR 23.2m
23.22019
24.22018
19.32017
Number of trades 31.8m
31.8
30.1
21.2
2019
2018
2017
39%
Value of trades EUR 590 bn
Net profit margin 25%
20%
31%
590
572
407
2019
2018
2017
2019
2018
2017

5
Another successful year has passed and as the CEO of one of the successful global pioneers of the industry, I must say: Well done! Admiral Markets has continued the implementation of its long-term strategy and 2030 vision, strengthened its position among competitors, and increased its market share and client base with growth that exceeds market expectations. This means that we have, continuously, made it possible and more easily accessible for Admiral Markets’ existing and potential clients to use our services, take part in the financial markets, invest and trade, and buy and sell financial instruments, while developing and implementing the best technological solutions in favour of an outstanding customer experience and personal approach. We continued the strategic approach of recent years and made a leap forward entering new markets. Maintaining our stability and position in Europe, we simultaneously increased our global presence in Asia, Canada and Africa. This has all been possible because of our international, hard-working and loyal team who bring the best know-how and expertise to the company. Since the introduction of additional requirements to the leverage offered to retail customers in the European Union by the European Securities and Markets Authority (ESMA) in August 2018, retail European clients currently trade in general 2 times lower volumes than before the implementation. Despite that, we have still managed to increase our base of active clients and have therefore maintained our turnover and revenue.
We learned to use the opportunities of data analysis to extend our client base, while keeping the acquisition costs equal. The number of sign ups has reached 25,000 per month in December. In terms of business volumes, the parent company of Admiral Markets AS, Admiral Markets Group AS, had ca 14,800 monthly active clients by the end of December 2019, compared to the same time in 2018, when the corresponding figure was ca 10,500. The active clients’ assets grew by 45% and the total number of registered clients increased by more than 20%. Such growth depends highly on last year’s large-scale IT projects, which provide our clients with an even faster, safer and more user-friendly trading experience. Our new IT core has been successful and flexible while implementing new technologies. Even more, I am proud to say that our IT and processes showed excellent performance regarding customer evaluation. Our strategic goal is to provide the client with a world-class customer experience, so he or she would be a long-term customer. As mentioned earlier, our global expansion and success has always depended on our team. As a team leader and CEO, I am extremely proud that our people represent the best talent. They have been actively engaged in creating a work environment where we show respect, trust and encouragement towards everyone in our global network of Admiral Markets’ superstars. We value highly new members of our team who share their competence, experience and market practice in the global market with us.
To the investors of Admiral Markets

6
2019 was also the year when Admiral Markets reached new heights. We made it to the top 10 in the Exporter of the Year Award in Enterprise Estonia’s Entrepreneurship Awards. The Entrepreneurship Award competition is the highest recognition in the country for outstanding and progressive companies. We also won all relevant industry awards in Germany, thus being the absolute quality market leader. Not to mention the upgrade from 135th place in TOP 100 Estonian companies to 31st. More and more each year, Admiral Markets wants to give back to society and has taken CSR principles more actively into implementation. As the world’s climate is changing at a rapid speed, then Admiral Markets, as one of the most international Estonian companies, must also seriously engage in actions that can help lessen our ecological footprint. Thus, we have started implementing Admiral Markets’
Green Manifesto, which will set the path for being green and at the same time socially and environmentally responsible for our actions. We were also the background force of SOS Children’s Village campaign #OlemeKoos. In the fall, we announced our participation in the Dubai Expo 2020, opening up the global fintech success story to the 192 countries present at the EXPO.
We continue to support new talents in their studies, and in the spring and autumn, granting the Admiral Markets AS Scholarship in cooperation with Tallinn University of Technology.
I am grateful to our employees, clients, investors and good partners.
Sergei BogatenkovChairman of the Management Board Tallinn28th February, 2020

7
Table of ContentsManagement report 8Our company 8
Economic environment 10
Financial review 14
Capitalisation 17
Interim Financial Statements 19Statement of Financial Position 19
Statement of Comprehensive Income 21
Statement of Cash Flows 22
Statement of Changes in Equity 24
Notes to the interim financial statements 25Note 1. General information 25
Note 2. Presentation and classification changes 28
Note 3. Risk management 30
Note 4. Due from credit institutions and investment firms 30
Note 5. Financial assets and liabilities at fair value through profit or loss 31
Note 6. Loans and receivables 31
Note 7. Liabilities and prepayments 33
Note 8. Financial and operating lease 34
Note 9. Subordinated debt securities 36
Note 10. Off-balance sheet assets 36
Note 11. Share capital 37
Note 12. Segment reporting 38
Note 13. Net income from trading 38
Note 14. Operating expenses 39
Note 15. Transactions with related parties 40
Note 16. Events after the balance sheet date 41

8
ADMIRAL MARKETS AS was founded in 2003. In 2009, the Estonian Financial Supervisory Authority granted Admiral Markets AS the activity licence no. 4.1-1/46 for the provision of investment services. The Company is part of an international group (hereinafter as “Group”) which operates under a joint trademark – Admiral Markets. Admiral Markets Group AS, the parent company of Admiral Markets AS, owns 100% of the shares of Admiral Markets AS.
The main activity of Admiral Markets AS is the provision of trading and investment services (mainly leveraged and derivative products) to retail, professional and institutional clients. Customers are offered leveraged Contract for Difference (CFD) products in the over-the-counter market, Forex as well as listed instruments. The Company’s activities have mostly been targeted at experienced traders, but this year we have also strengthened our position in the beginner’s segment. Therefore, the Company focuses on the improvement of the general trading skills of experienced traders and the training of new enthusiasts as well.
In addition to the provision of other support services, under White Label agreements, Admiral Markets AS, being the administrator and developer of the platform, provides all sister companies that are part of the same consolidation group the possibility of using the investment platform. In line with the Group’s strategy, the sister investment companies of Admiral Markets AS hedge the risks arising from their customers’ transactions in Admiral Markets AS, who is also their sole liquidity partner. Due to this, the results of Admiral Markets AS depend on other companies in the Group.
Management reportOur company
In addition to the services offered to retail, professional and institutional customers, Admiral Markets AS also acts as a provider of support services for its consolidation group companies, being responsible for all key middle and back-office functions:
• Administration and development of IT platforms in cooperation with AMTS Solutions OÜ and Runa Systems, the subsidiaries of Admiral Markets Group AS;
• Risk management;
• Liquidity provision – Admiral Markets AS is the sole liquidity provider for all investment companies in Admiral Markets Group AS;
• Marketing;
• Financial services;
• Compliance.
The licenced investment companies that are part of the same consolidation group as Admiral Markets AS are Admiral Markets UK Ltd, Admiral Markets Pty Ltd and Admiral Markets Cyprus Ltd. Admiral Markets AS has a licence granted by the Estonian Financial Supervisory Authority (EFSA). Since Admiral Markets AS and other licenced investment companies that are part of the same consolidation group use the same joint trademark, the reputation of the trademark of Admiral Markets has a major direct impact on the financial indicators as well as business success of Admiral Markets AS.
Currently Admiral Markets AS has a branch in Poland, a representative office in the Russian Federation

9
and a newly created subsidiary in Canada. Other companies that are part of the same consolidation group as Admiral Markets AS at the end of year 2019 and at the time of publishing this report are Runa Systems, AMTS Solution OÜ, AM Asia Operations Sdn. Bhd., AM INVESTMENTS AND TRADING SA (PTY) LTD and Gateway2am OÜ (former name Admiral Virtual OÜ). In 2019, AM Asia Operations Sdn. Bhd (Malaysia) and AM INVESTMENTS AND TRADING SA (PTY) LTD (Republic of South Africa) were established. Admiral Markets Chile SpA, which had been inactive for several years, was
Admiral Markets Group AS structure
The structure of Admiral Markets Group AS, the parent company of Admiral Markets AS as of 31.12.2019:
Admiral Markets Group AS owns 100% of the shares of all its subsidiaries as of 31.12.2019, except for AMTS Solutions OÜ, where Admiral Markets Group AS has 62% ownership.
sold in November 2019. Runa Systems and AMTS Solution OÜ offer IT and other intra-group services. Gateway2am OÜ is inactive at the moment.
Admiral Markets AS intends to close its branch in Poland during 2020. This change has no impact on either client relationships or the investment services provided to the clients as clients can continue trading on a cross-border basis through entities of the Group holding respective licence.

10
Economic environment
Over the year of 2019, the trade dispute between the US and China has been the main theme – not only for the world of politics, but also among traders around the globe. Q4/2018 was very volatile due to fears that the US Federal Reserve (FED) ‘Put’ might not be available anymore (note: ‘FED put’ refers to the notion the central bank would take action aimed at shoring up asset prices in the event of a tumble), with the FED announcing that the reduction of the FED Balance Sheet was running on auto-pilot and further interest rate hikes might be necessary to reflect the positive US economic outlook. However, the FED announced a U-turn in January 2019 with FED chairman Powell telling market participants the FED would be more flexible, especially in regard to the reduction of the balance sheet. After the trade dispute between the US and China continued heating up in the first half of 2019, with US president Trump implementing tariffs on multiple Chinese goods worth billions of dollars, and global economic projections pointed to an economic slowdown with the 2-10 year US Treasury yield curve inverting in August and September, instead of hiking interest rates, the FED stepped in and cut interest rates by 25 basis points in July, September and October. In addition to that, the FED began injecting billions of dollars of liquidity into the repo market from mid-September onwards, when a confluence of events sent the cost of overnight loans as high as 10%.
At exactly this point, one year ago, we asked: “Can the global economy keep on growing without the
help of the liquidity provided by global central banks?” In 2020, the answer is an obvious “No”. So, for 2020 and beyond, the FED, European Central Bank (ECB), Bank of Japan and other global central banks must prevent the global economy from drifting into a recession, by supporting the fragile economic environment with liquidity. However, this might be even more difficult with the US election at the end of the year 2020 and US president Trump being a politician who is not only very erratic but who has made it clear that he is willing to put pressure on global trading partners by installing trade barriers and protectionist policies that could easily lead to an global economic downturn. The difficulties do not only arise from Trump’s trade politics, but also from the fact that central banks need support from all nations combined, ramping up fiscal stimulus and economy-supporting packages, with the target to form an alliance to fight the demon of global recession. As the UK and several other European countries have conservative, right-wing and nationalist parties gaining increasing support, it’s very difficult to see such a united alliance being formed.
Global Economy

11
The Eurozone quarterly economic growth was confirmed at 0.2% in the third quarter of 2019, the same as in the previous three-month period. Household consumption, government spending and fixed investment supported the expansion, while net trade and inventory changes contributed negatively to Gross Domestic Product (GDP). Among the bloc’s largest economies, Germany’s GDP growth was confirmed at a seasonally adjusted 0.1% in the third quarter of 2019, compared to a 0.2% contraction in the previous three-month period. Italy’s economy grew 0.1% on quarter in the three months to September 2019, the same pace as in
The US economy grew by an annualised 2.1% in Q3/2019, unchanged from the second quarter estimate and following a 2% expansion in the previous three-month period. The increase in real GDP in the third quarter reflected positive contributions from personal consumption expenditures (PCE), federal government spending, residential investment, exports, and state and local government spending that were partly offset by negative contributions from non-residential fixed investment and private inventory investment. Imports, which are a subtraction in the calculation of GDP, increased.
The economic growth in the United Kingdom was revised slightly higher to 0.4% in the third quarter of 2019. Nevertheless, the CBI Business Optimism Indicator for the UK dropped to -44 in the last quarter of 2019 from -32 in the previous three-month period. It was the lowest reading since the third quarter of 2019, amid Brexit uncertainty. Optimism about export prospects for the year ahead also worsened
The Eurozone
The United States
The United Kingdom
the previous period and in line with preliminary estimates, while France’s quarterly economic growth was confirmed at 0.3% in the third quarter of 2019. After launching further quantitative easing at the September 2019 meeting, ECB president Christine Lagarde has called on European governments to cooperate more closely over fiscal policy to stimulate the stuttering Eurozone economy, clearly showing that future support from the ECB, but also a strong cooperation between the countries of the EU, is necessary to avoid a strong recessive tendency in the Eurozone.
At the last FED decision in December 2019, forecasts for inflation and the GDP remained unchanged over the forecast horizon with a median FED long-run GDP growth forecast at 1.9%, a jobless rate at 4.1% and a PCE Price Index at 2.0%. In general, the December dot plot shows that the Federal Open Market Committee sees interest rates lower than previously expected over the next few years, pointing to the expectation of a slower US and thus slower global economic growth.
to the greatest extent since October 2001 and investment intentions deteriorated, with plans to spend on buildings, plant & machinery and training & retraining at their most negative since the financial crisis.
In regard to Brexit, the withdrawal agreement passed its second reading in the House of Commons on

12
The Chinese economy advanced 6.0% year-on-year in the September quarter of 2019, slowing from a 6.2% expansion in the previous quarter and compared with market expectations of 6.1%. It was the weakest growth rate since the first quarter of 1992, amid persistent trade tensions with the US, weakening
GDP in Estonia expanded 1% in the third quarter of 2019 over the previous quarter and advanced 4.2% year-on-year in the third quarter of 2019, following an upwardly revised 3.8% growth in the previous period. Growth has stabilised at the highest annual growth rate since the last quarter of 2017.
China
Estonian Economy
global demand and alarming off-balance-sheet borrowings by local governments. Trading Economics expects the Chinese economy to grow by 6.1% by the end of the first quarter of 2020 and stand at 5.8% in 12 months time.
Government spending expanded faster in Q3 compared to Q2 2019 (3.8% vs 0.9%). Meanwhile, both fixed investment (8.1% vs 24.6%) and private consumption (1.2% vs 2.4%) increased at a slower rate in Q3 when compared with Q2. On the other hand, net exports contributed positively to GDP growth, as exports grew by 7.0% (vs 3.3%), while imports
December 20, 2019 the United Kingdom and Gibraltar left the European Union on January 31, 2020.
Now the clock is ticking in regard to the tangible changes that Brexit will bring: new arrangements for Britain’s trade, customs, travel and regulation with the EU and the rest of the world.
Until then, an 11-month transition period ensures that everyday friction points and the biggest challenges
of the Brexit project — cross-border travel, personal rights and immigration — remain unchanged until at least December 31.
That said, the main focus will now be on how the slowing economy in Germany will affect the UK’s GDP growth, which is also vulnerable to slowing in 2020. The Bank of England has forecast UK GDP to pick up from 0.4% in 2020 Q1 to 1.4% in 2021 Q1, 1.6% in 2022 Q1, and 2.0% in 2023 Q1.
• US House of Representatives impeaches President Donald Trump
• US ends support for Syrian Kurds
• Protests in streets of Hong Kong against the Chinese Government
• Growing geopolitical tensions in the Persian Gulf
• US-China Trade War
• Brexit upends British politics
• North Korea-US Nuclear talks stall
Significant global events in 2019:
13
rose at a softer 4.4% (vs 5.4%). On the production side, the main contributors to economic growth were information and communication; agriculture, forestry and fishing; professional, scientific & technical activities; wholesale and retail trade, and manufacturing, transportation and storage. On a seasonally adjusted quarterly basis, Estonia’s GDP
went up by 1.0% in the third quarter, accelerating from an upwardly revised 0.8% growth in Q2. Eesti Pank estimates the Estonian GDP Annual Growth Rate to be around 3.5% by the end of Q1/2020 and sees the Estonian GDP Annual Growth Rate at 2.8% in 12 months’ time.
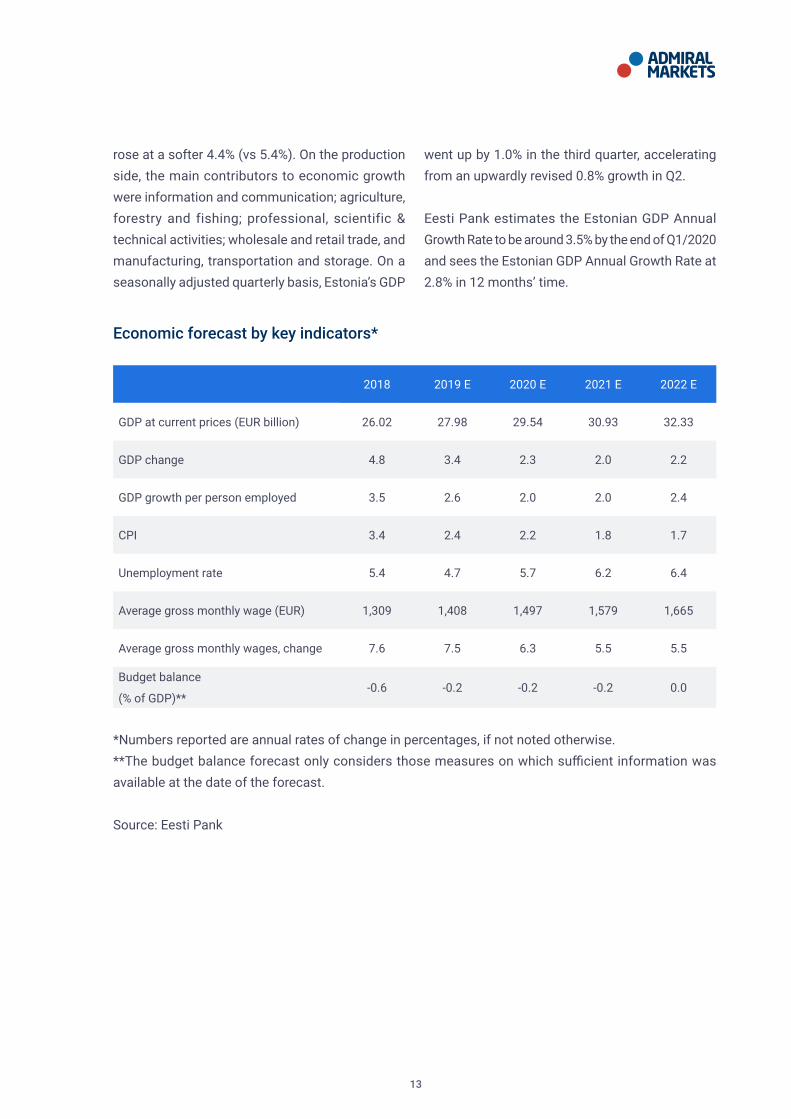
Economic forecast by key indicators*
2018 2019 E 2020 E 2021 E 2022 E
GDP at current prices (EUR billion) 26.02 27.98 29.54 30.93 32.33
GDP change 4.8 3.4 2.3 2.0 2.2
GDP growth per person employed 3.5 2.6 2.0 2.0 2.4
CPI 3.4 2.4 2.2 1.8 1.7
Unemployment rate 5.4 4.7 5.7 6.2 6.4
Average gross monthly wage (EUR) 1,309 1,408 1,497 1,579 1,665
Average gross monthly wages, change 7.6 7.5 6.3 5.5 5.5
Budget balance
(% of GDP)**-0.6 -0.2 -0.2 -0.2 0.0
*Numbers reported are annual rates of change in percentages, if not noted otherwise.**The budget balance forecast only considers those measures on which sufficient information was available at the date of the forecast.
Source: Eesti Pank

14
2019 2018Change 2019 vs
20182017 2016 2015*
Income statement
Net trading income, mln EUR 23.2 24.2 -4% 19.3 18.0 16.5
Operating expenses, mln EUR -19.2 -15.2 26% -12.7 -12.5 -19.4
EBITDA, mln EUR 5.8 10.1 -43% 6.4 6.3 -2.3
EBIT, mln EUR 4.9 9.8 -50% 6.2 5.9 -2.5
Net profit (loss),
mln EUR4.6 9.5 -52% 6.0 5.9 -2.5
EBITDA margin, % 25% 42% -17 33% 35% -14%
EBIT margin, % 21% 40% -19 32% 33% -15%
Net profit (loss) margin, % 20% 39% -19 31% 33% -15%
Cost to income
ratio, %83% 63% 20 66% 69% 118%
Financial review
Main Financial Indicators of Admiral Markets AS

15
2019 2018Change 2019
vs 20182017 2016 2015*
Business volumes
Due from credit
institutions and
investment companies,
mln EUR
26.5 22.2 19% 22.0 18.0 15.6
Debt securities, mln
EUR9.3 10.8 -14% 3.3 2.4 0
Shareholders’ equity,
mln EUR38.8 35.6 9% 27.4 22.8 17.3
Total assets, mln EUR 47.2 39.4 20% 30.6 24.1 20.4
Off-balance sheet
assets (client assets),
mln EUR
2.7 3.6 -25% 3.3 4.4 7.8
Number of employees 147 123 20% 124 119 122
*Without the extraordinary allowance for doubtful receivables arising from the Swiss franc price fluctuation operating expenses and net profit in 2015 were EUR 9.4 million and EUR 7.5 million respectively.
EBITDA margin, % = EBITDA / Net trading incomeEBIT margin, % = EBIT / Net trading incomeNet profit margin, % = Net profit / Net trading incomeCost to income ratio, % = Operating expenses / Net trading income
Equations used for the calculation of ratios:
16
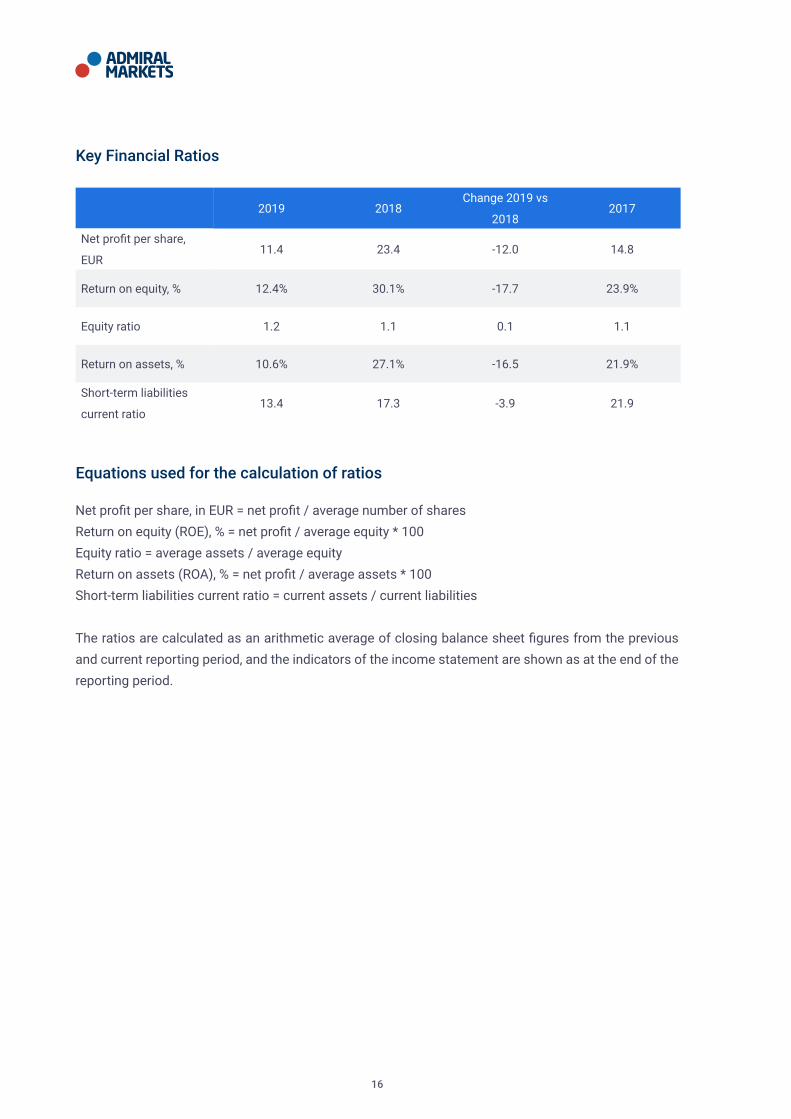
2019 2018Change 2019 vs
20182017
Net profit per share,
EUR11.4 23.4 -12.0 14.8
Return on equity, % 12.4% 30.1% -17.7 23.9%
Equity ratio 1.2 1.1 0.1 1.1
Return on assets, % 10.6% 27.1% -16.5 21.9%
Short-term liabilities
current ratio13.4 17.3 -3.9 21.9
Key Financial Ratios
Net profit per share, in EUR = net profit / average number of sharesReturn on equity (ROE), % = net profit / average equity * 100Equity ratio = average assets / average equityReturn on assets (ROA), % = net profit / average assets * 100Short-term liabilities current ratio = current assets / current liabilities
The ratios are calculated as an arithmetic average of closing balance sheet figures from the previous and current reporting period, and the indicators of the income statement are shown as at the end of the reporting period.
Equations used for the calculation of ratios
17
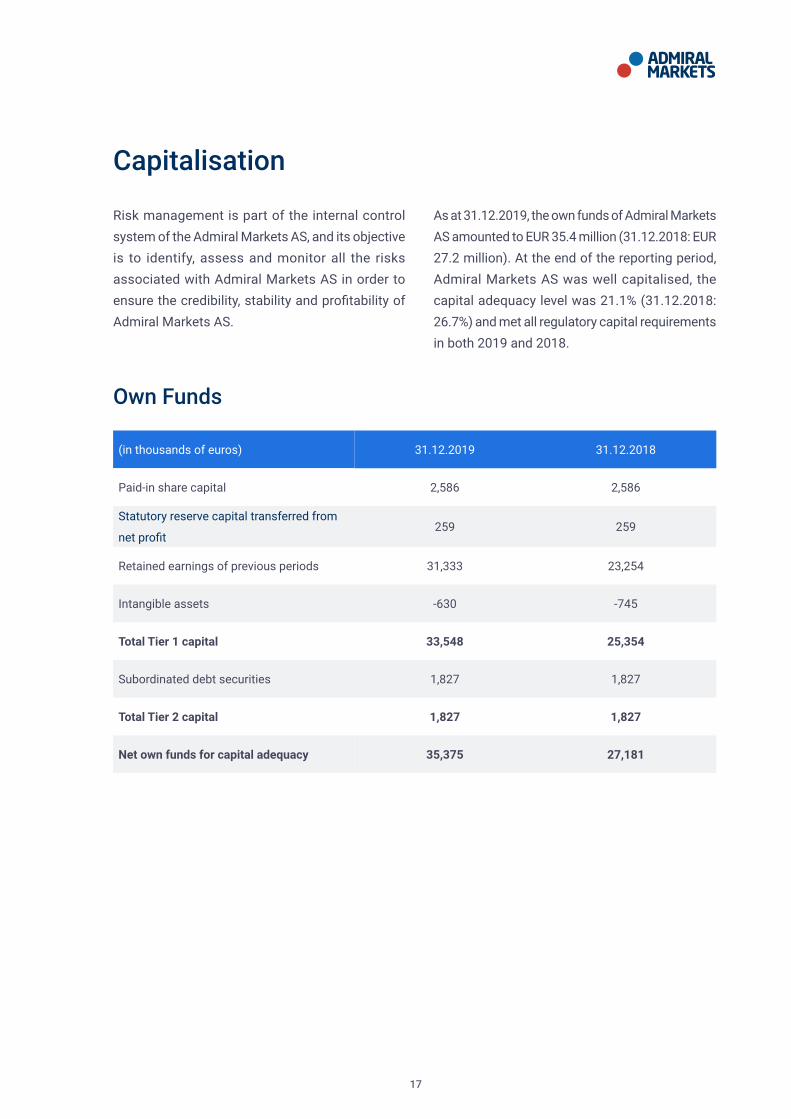
Capitalisation
Risk management is part of the internal control system of the Admiral Markets AS, and its objective is to identify, assess and monitor all the risks associated with Admiral Markets AS in order to ensure the credibility, stability and profitability of Admiral Markets AS.
As at 31.12.2019, the own funds of Admiral Markets AS amounted to EUR 35.4 million (31.12.2018: EUR 27.2 million). At the end of the reporting period, Admiral Markets AS was well capitalised, the capital adequacy level was 21.1% (31.12.2018: 26.7%) and met all regulatory capital requirements in both 2019 and 2018.
(in thousands of euros) 31.12.2019 31.12.2018
Paid-in share capital 2,586 2,586
Statutory reserve capital transferred from
net profit259 259
Retained earnings of previous periods 31,333 23,254
Intangible assets -630 -745
Total Tier 1 capital 33,548 25,354
Subordinated debt securities 1,827 1,827
Total Tier 2 capital 1,827 1,827
Net own funds for capital adequacy 35,375 27,181
Own Funds

18
(in thousands of euros) 31.12.2019 31.12.2018
Credit institutions and investment companies under
standardised approach6,416 5,810
Retail claims under standardised approach 7,571 4,330
Other items under standardised approach 10,593 5,510
Total credit risk and counterparty credit risk 24,580 15,650
Currency risk under standardised approach 71,263 37,677
Position risk under standardised approach 19,243 6,483
Commodity risk under standardised approach 13,263 7,972
Total market risk 103,769 52,132
Credit valuation adjustment risk under standardised
method25 13
Operational risk under basic indicator approach 39,133 34,017
Total capital requirements for capital adequacy
calculation 167,507 101,812
Capital Requirements
31.12.2019 31.12.2018
Capital adequacy 21.1% 26.7%
Tier 1 capital ratio 20.0% 24.9%
Capital Adequacy

19
Interim Financial StatementsStatement of Financial Position
(in thousands of euros) Note 31.12.2019 31.12.2018 01.01.2018
Assets
Due from credit institutions 4 19,757 15,467 16,346
Due from investment companies 4 6,786 6,738 5,656
Financial assets at fair value through
profit or loss5 9,759 11,047 3,411
Loans and receivables 6 3,983 3,044 3,368
Inventories 0 61 0
Other assets 912 1,045 1,330
Tangible assets 1,283 1,267 398
Right-of-use asset 4,059 0 0
Intangible assets 630 745 93
Total assets 47,169 39,414 30,602
Liabilities
Financial liabilities at fair value through profit
or loss5 66 176 177
Liabilities and prepayments 7 2,349 1,843 1,175
Subordinated debt securities 9 1,827 1,827 1,827
Lease liabilities 8 4,145 0 0
Total liabilities 8,387 3,846 3,179

20
Equity
Share capital 11 2,586 2,586 2,586
Statutory reserve capital 259 259 259
Retained earnings 35,937 32,724 24,579
Total equity 38,782 35,568 27,423
Total liabilities and equity 47,169 39,414 30,602

21
Statement of Comprehensive Income
(in thousands of euros) Note 2019 2018
Net gains from trading of financial assets at fair value through profit or loss with clients and liquidity providers
34,838 34,081
Brokerage fee income 71 85
Brokerage and commission fee expense -11,708 -9,960
Other trading activity related income 31 74
Other trading activity related expense -22 -44
Net income from trading 13 23,210 24,236
Other income 777 475
Other expense -202 -98
Interest income calculated using the effective interest method
75 67
Interest income similar to interest 183 99
Interest expense -224 -147
Net gains on exchange rate changes 266 380
Net gains at fair value through profit or loss 50 0
Personnel expenses -7,006 -5,082
Operating expenses 14 -11,268 -9,843
Depreciation of tangible and intangible assets -526 -283
Depreciation of right-of-use assets -420 0
Profit before income tax 4,915 9,804
Income tax -311 -334
Profit for the reporting period 4,604 9,470
Total comprehensive income for the reporting period 4,604 9,470
Basic and diluted earnings per share 11 11.40 23.44

22
Statement of Cash Flows
(in thousands of euros) Note 2019 2018
Cash flow from operating activities
Profit 4,604 9,470
Adjustments for:
Depreciation of tangible and intangible assets 946 283
Gains on the sale of tangible assets 9 0
Interest income -258 -166
Interest expense 224 147
Allowance for doubtful receivables 25 49
Corporate income tax expenses 311 334
Other financial income and expenses -266 -380
Gain of financial assets at fair value through profit or loss -50 0
Operating cash flows before working capital changes 5,545 9,737
Changes in working capital:
Change in amounts due from investment companies -49 -1,081
Change in trade receivables 6 61 504
Change in other assets 133 1,148
Change in derivative assets -31 -55
Change in payables and prepayments 885 -667
Change in the derivative liabilities -110 -1
Changes in inventories 61 -61
Operating cash flows before interest and tax 6,496 9,524

23
Interest received 61 55
Interest paid -223 -146
Corporate income tax paid -311 -334
Net cash from operating activities 6,023 9,099
Cash flow from investing activities
Disposal of tangible and intangible assets 20 2
Purchase of tangible and intangible assets -496 -1,800
Loans granted 6 -1,000 -300
Acquisition of financial assets at fair value through profit or loss
-4,906 -18,342
Proceeds from disposal of financial assets at fair value through profit or loss
6,466 11,519
Net cash used in investing activities 84 -8,921
Cash flow from financing activities
Dividends paid 11 -1,390 -1,325
Repayment of principal elements of lease liability -406 0
Net cash from/used in financing activities -1,796 -1,325
TOTAL CASH FLOWS 4,311 -1,147
Cash and cash equivalents at the beginning of the period 4 15,467 16,014
Change in cash and equivalents 4,311 -1,147
Effect of exchange rate changes on cash and cash equivalents
-21 600
Cash and cash equivalents at the end of the period 4 19,757 15,467

24
(in thousands of euros) Share capitalStatutory reserve
capitalRetained earnings
Total
Balance as at 01.01.2018 2,586 259 24,579 27,423
Dividends paid 0 0 -1,325 -1,325
Profit for the reporting period 0 0 9,470 9,470
Total comprehensive income forthe reporting period
0 0 9,470 9,470
Balance as at 31.12.2018 2,586 259 32,724 35,568
Balance as at 01.01.2019 2,586 259 32,724 35,568
Dividends paid 0 0 -1,390 -1,390
Profit for the reporting period 0 0 4,604 4,604
Total comprehensive income forthe reporting period
0 0 4,604 4,604
Balance as at 31.12.2019 2,586 259 35,938 38,782
Statement of Changes in Equity
For more information of share capital refer to Note 11.

25
Notes to the interim financial statementsNote 1. General information
ADMIRAL MARKETS AS is an investment company since 05.06.2009. The Company’s head office is located at Maakri 19/1, Tallinn, Estonia.
The interim financial report of Admiral Markets AS has been prepared in accordance with the international financial reporting standard IAS 34 “Interim Financial Reporting”, as adopted by the European Union and in accordance with the International Financial Reporting Standards (IFRS), as adopted by the European Union.
The interim financial report should be read in conjunction with the Company’s annual report as at 31 December 2018. The accounting policies used
Admiral Markets AS has applied IFRS 16 “Leases” for the first time since 1st of January 2019. The rest of the revised standards did not have a significant impact on the Company’s 12-month interim report.
Company as a lessee from 1 January 2019IFRS 16 sets out the principles for the recognition, measurement, presentation and disclosure of leases. All leases result in the lessee obtaining the right to use an asset at the start of the lease and, if lease payments are made over time, also obtaining financing. Accordingly, IFRS 16 eliminates the classification of leases as either operating leases or finance leases as is required by IAS 17 and, instead, introduces a single lessee accounting
in the preparation of the interim financial report are the same as the accounting policies used in the annual report for the year ended 31 December 2018, except for accounting principles related to new IFRS standards adopted by the European Union, which became effective from 1 January 2019. The changes in accounting principles are disclosed in Note 1, subsection “Changes in accounting policies”.
The interim financial statements are unaudited and do not contain all the information required for the preparation of annual financial statements.
The interim financial statements are presented in thousands of euros, unless otherwise stated.
model. Lessees will be required to recognise: (a) assets and liabilities for all leases with a term of more than 12 months, unless the underlying asset is of low value; and b) depreciation of lease assets separately from interest on lease liabilities in the income statement. IFRS 16 substantially carries forward the lessor accounting requirements in IAS 17. Accordingly, a lessor continues to classify its leases as operating leases or finance leases, and accounts for those two types of leases differently.
The Company is as lessee in all lease agreements. Admiral Markets AS leases office space. At the inception of a contract, the Company assesses whether the contract is, or contains, a lease. A
Changes in accounting policies

26
contract is, or contains, a lease if the contract conveys the right to control the use of an identified asset for a period of time in exchange for consideration.
The Company determines the lease term as the non-cancellable period of a lease, together with both periods covered by an option to extend the lease if the lessee is reasonably certain to exercise that option; and periods covered by an option to terminate the lease if the lessee is reasonably certain not to exercise that option. A lessee reassesses whether it is reasonably certain to exercise an extension option, or not to exercise a termination option, upon the occurrence of either a significant event or a significant change in circumstances that is within the control of the lessee; and affects whether the lessee is reasonably certain to exercise an option not previously included in its determination of the lease term, or not to exercise an option previously included in its determination of the lease term. The Company revises the lease term if there is a change in the non-cancellable period of a lease.
Initial measurementAt the commencement date, a lessee shall recognise a right-of-use asset and a lease liability. At the commencement date, a lessee shall measure the right-of-use asset at cost. The cost of the right-of-use asset shall comprise:
• the amount of the initial measurement of the lease liability;
• any lease payments made at or before the commencement date, less any lease incentives received;
• any initial direct costs incurred by the lessee;
• an estimate of costs to be incurred by the lessee in dismantling and removing the underlying asset, restoring the site on which it is located or restoring the underlying asset to the condition required by the terms and conditions of the lease.
Right-of-use asset is recorded on the separate line in the statement of financial position.
At the commencement date, the Company measures the lease liability at the present value of the lease payments that are not paid at that date. The lease payments shall be discounted using the interest rate implicit in the lease, if that rate can be readily determined. If that rate cannot be readily determined, the lessee shall use the lessee’s incremental borrowing rate, being the rate that the individual lessee would have to pay to borrow the funds necessary to obtain an asset of similar value to the right-of-use asset in a similar economic environment with similar terms, security and conditions.
Subsequent measurementAfter the commencement date, the Company recognises leases as a right-of-use asset and a corresponding liability at the date at which the leased asset is available for use applying a cost model. To apply a cost model, a lessee measures the right-of-use asset at cost less any accumulated depreciation and any accumulated impairment losses and adjusted for any remeasurement of the lease liability. Right-of-use assets are generally depreciated over the shorter of the asset’s useful life and the lease term on a straight-line basis.
After the commencement date, a lessee shall measure the lease liability by:
• increasing the carrying amount to reflect interest on the lease liability;
• reducing the carrying amount to reflect the lease payments made; and
• remeasuring the carrying amount to reflect any reassessment or lease modifications or to reflect revised in-substance fixed lease payments.
Interest on the lease liability in each period during the lease term shall be the amount that

27
produces a constant periodic rate of interest on the remaining balance of the lease liability. After the commencement date, a lessee recognises in profit or loss interest on the lease liability.
If there are changes in lease payments, there may be need to remeasure the lease liability. A lessee shall recognise the amount of the remeasurement of the lease liability as an adjustment to the right-of-use asset. However, if the carrying amount of the right-of-use asset is reduced to zero and there is a further reduction in the measurement of the lease liability, a lessee shall recognise any remaining amount of the remeasurement in profit or loss.
A lessee shall account for a lease modification as a separate lease if both: (a) the modification increases the scope of the lease by adding the right to use one or more underlying assets; and (b) the consideration for the lease increases by an amount commensurate with the stand-alone price for the increase in scope and any appropriate adjustments to that stand-alone price to reflect the circumstances of the particular contract.
Each lease payment is allocated between finance cost (interest expense) and the principal repayments of the lease liability, that is, to reduce the carrying amount of the liability. The finance cost is charged to profit or loss over the lease period to produce a constant periodic rate of interest on the remaining balance of the liability at any given time.
Admiral Markets AS leasesThe Company has adopted IFRS 16 “Leases” retrospectively from 1 January 2019, but has not restated comparatives for the 2018 reporting period, as permitted under the specific transition provisions in the standard. Therefore, the information about the comparatives for the 2018 reporting period are presented under the previous leasing standard IAS 17 and respective interpretations.
Lease agreements are concluded for a fixed period up to 10 years and usually include extension and termination rights. Rental conditions are agreed on an individual basis and may include different conditions.
On initial application at 1st of January 2019, the Company applied the following weighted average lessee’s incremental borrowing rates to the lease liabilities: 2% for premises.
In applying IFRS 16 for the first time, the Company has used the following practical expedients permitted by the standard for leases previously classified as operating leases:
• applying a single discount rate to a portfolio of leases with reasonably similar characteristics;
• not to apply the requirements of IFRS 16 to leases for which the lease term ends within 12 months of the date of initial application;
• leases of low value assets have been excluded; and
• exclude initial direct costs from the measurement of the right-of-use asset at the date of initial application.
The Company has elected not to apply the requirements of IFRS 16 to short-term leases and leases for which the underlying asset is of low value. Payments associated with short-term leases and all leases of low-value assets are recognised on a straight-line basis as an expense in profit or loss. Short-term leases are leases with a lease term of 12 months or less. Low-value assets comprise of parking rent and IT equipment.
More information about the right-of-use asset and lease liability are given in note 8.

28
Note 2. Presentation and classification changesIn 2019, the Company has decided to follow the financial statements presentation of best market practices for credit institutions and investment companies and due to that has changed the presentation of its statement of financial position and statement of cash flows. The statement of
financial position is now presented in order of liquidity because the entity does not have any identifiable operating cycle. In addition, some immaterial classification errors have been corrected due to the new presentation to provide better comparability between the reporting periods.
Leases accounting principles until 31 December 2018A finance lease is a lease relationship where substantial risks and rewards related to the ownership of the asset are transferred to the lessee. Other lease agreements are treated as operating leases.
Company as the lessee
Operating lease payments are recognised as an expense in the statement of profit or loss on a straight-line basis over the lease term.
Statement of Financial Position line item31.12.2018 new
presentationImpact of change
31.12.2018 old presentation
Cash and cash equivalents 0 -22,205 22,205
Due from credit institutions 15,467 15,467 0
Due from investment companies 6,738 6,738 0
Short-term loans, receivables and prepayments
0 -1,639 1,639
Long-term loans 0 -2,500 2,500
Loans and receivables 3,044 3,044 0
Other assets 1,045 1,045 0
Financial assets and liabilities at fair value through profit and loss
11,047 50 10,997
Inventories 61 0 61
Tangible assets 1,267 0 1,267
Intangible assets 745 0 745
Total assets 39,414 0 39,414
Impact of presentation change on the statement of financial position:

29
Due to the changes in statement of financial positions presentation, several presentation changes have also occurred for statement of cash flows. The most important change is due to the presentation of due from credit institutions and investment companies, as stated above. Together with the presentation change, management has changed its previous significant judgment that funds deposited at investment companies meet the cash and cash equivalents criteria. Although the funds
deposited in investment companies are still highly liquid and subject to insignificant risk of change in value, the management has decided to present these deposits as receivables and not as cash and cash equivalents, considering the nature and purposes of these balances in the entity’s activities. Therefore, the cash and cash equivalents balance as at 1.1.2018 and 31.12.2018 and the related line items in the statement of cash flows have been restated as follows:
Statement of Cash flows line item31.12.2018 new
presentationImpact of change
31.12.2018 old presentation
Change in balances due from investment companies
-871 -871 0
Change in trade receivables 291 291 0
Change in other assets 1,148 1,148 0
Change in receivables and prepayments relating to operating activities
0 -1,321 1,321
Net cash from operating activities 9,099 -870 9,969
TOTAL CASH FLOWS -1,147 -870 -277
Cash and cash equivalents at the beginning of the period
16,014 -5,657 21,671
Change in cash and equivalents -1,147 -870 -277
Cash and cash equivalents at the end of the period
15,467 -6,527 21,994

30
31.12.2019 31.12.2018
Demand and term deposits with maturity less than 3 months* 19,757 15,467
Demand deposits on trading accounts 6,786 6,738
Total 26,543 22,205
Note 3. Risk management
Note 4. Due from credit institutions and investment firms
Risk Management is part of the internal control system of Admiral Markets AS, and its objective is to identify, assess and monitor all of the risks associated with Admiral Markets in order to ensure the credibility, stability and profitability of Admiral Markets AS.
There have been no changes in the risk management policies since the end of year 2018.
*cash and cash equivalents in the statement of cash flows

31
Note 5. Financial assets and liabilities at fair value through profit or loss
Instrument Asset Liability Asset Liability
Bonds 9,339 0 10,813 0
Convertible loan 153 0 101 0
Equity investments at fair value through profit or loss
153 0 50 0
Currency pairs 28 12 51 116
CFD derivatives 72 42 15 44
Other derivatives 14 12 17 16
Total 9,759 66 11,047 176
31.12.2019 31.12.2018
Note 6. Loans and receivables
31.12.2019 31.12.2018 Note
Financial assets
Trade receivables 13 0
Doubtful receivables -2 0
Settlements with employees 14 81
Loans granted 3,725 2,725
Receivables from group companies 0 166 15
Other short-term receivables 233 72
Total 3,983 3,044

32
31.12.2019Up to 1
year2-5
years
Loan 1 25 25 012 month
Euribor + 4%03.2020 EUR 7 15
Loan 2 200 200 0 2% 12.2020 EUR 4 15
Loan 3 2,500 0 2,500 2% 12.2023 EUR 0 15
Loan 4 1,000 0 1,000 2% 11.2024 EUR 0 15
Total 3,725 225 3,500 11
Distribution bymaturity
Interestrate
Duedate
Basecurrency
Interest receivable
as at 31.12.2019
Note
Based on management assessment of these loan exposures, there have not been significant increase in credit risk after initial recognition of these loan exposures, hence all loans have been assessed to
31.12.2018Up to 1
year2-5
years
Loan 1 25 25 012 month
Euribor + 4%03.2019 EUR 6 15
Loan 2 200 200 0 2% 12.2019 EUR 0 15
Loan 3 2,500 0 2,500 2% 12.2023 EUR 0 15
Total 2,725 225 2,500 6
Distribution bymaturity
Interestrate
Duedate
Basecurrency
Interest receivable
as at 31.12.2018
Note
be in stage 1 as of the balance sheet date. 12-month ECL has been considered immaterial, given the low probability of default and loss given default.

33
Note 7. Liabilities and prepayments
Type of liability 31.12.2019 31.12.2018 Note
Financial liabilities
Liabilities to trade creditors 646 824
Payables to related parties 989 460 15
Interest payable 1 0
Other accrued expenses 97 111
Subtotal 1,733 1,395
Non-financial liabilities
Payables to employees 361 175
Taxes payable 255 273
Subtotal 616 448
Total 2,349 1,843
34
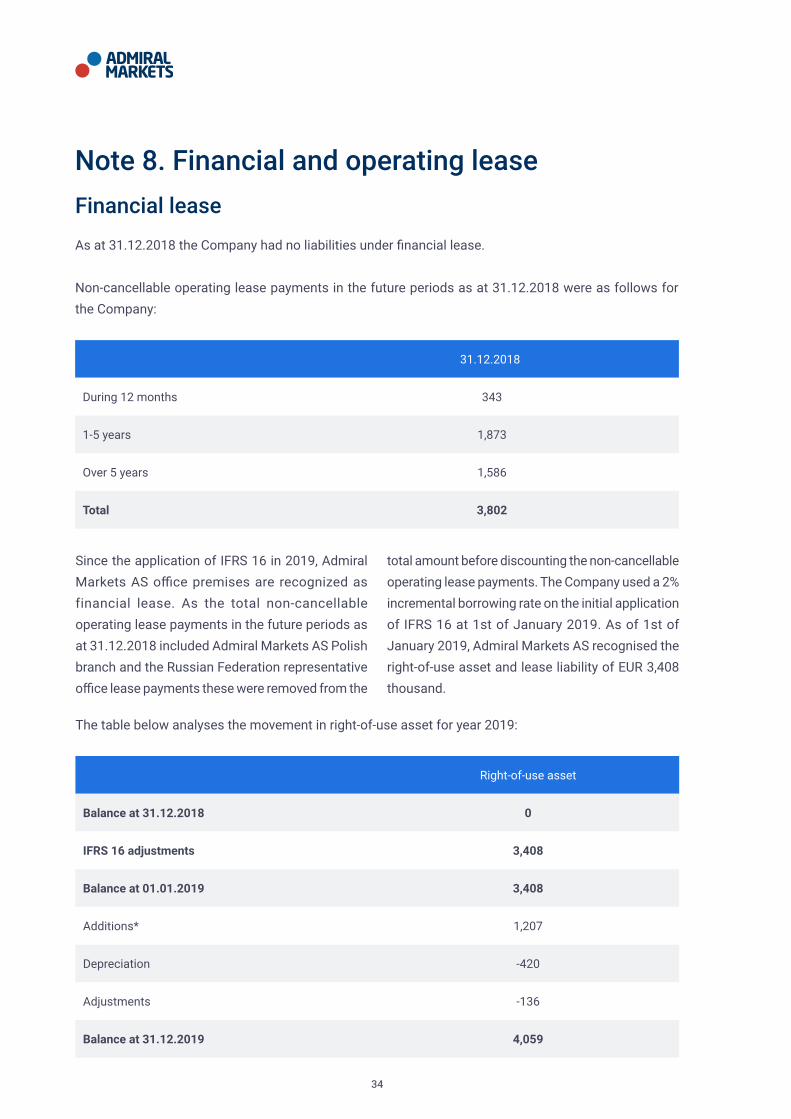
Note 8. Financial and operating lease
As at 31.12.2018 the Company had no liabilities under financial lease.
Non-cancellable operating lease payments in the future periods as at 31.12.2018 were as follows for the Company:
Financial lease
31.12.2018
During 12 months 343
1-5 years 1,873
Over 5 years 1,586
Total 3,802
Since the application of IFRS 16 in 2019, Admiral Markets AS office premises are recognized as financial lease. As the total non-cancellable operating lease payments in the future periods as at 31.12.2018 included Admiral Markets AS Polish branch and the Russian Federation representative office lease payments these were removed from the
total amount before discounting the non-cancellable operating lease payments. The Company used a 2% incremental borrowing rate on the initial application of IFRS 16 at 1st of January 2019. As of 1st of January 2019, Admiral Markets AS recognised the right-of-use asset and lease liability of EUR 3,408 thousand.
The table below analyses the movement in right-of-use asset for year 2019:
Right-of-use asset
Balance at 31.12.2018 0
IFRS 16 adjustments 3,408
Balance at 01.01.2019 3,408
Additions* 1,207
Depreciation -420
Adjustments -136
Balance at 31.12.2019 4,059

35
The table below analyses the movement in lease liabilities for year 2019:
* New lease contracts and extension of the lease period for existing contracts
The right-of-use asset and lease liability are recorded on separate lines in the statement of financial position.
Operating lease
In 2019 operating lease expenses amounted to 57 thousand EUR (2018: EUR 303 thousand). The costs include Admiral Markets AS parking premises rent and Polish branch and Russian representative office rent.
Lease liabilities
Balance at 31.12.2018 0
IFRS 16 adjustments 3,408
Balance at 01.01.2019 3,408
Additions* 1,203
Repayment of lease liability -406
Interest expense 76
Adjustments -136
Balance at 31.12.2019 4,145

36
Note 9. Subordinated debt securities
In 2017 Admiral Markets AS issued 18,268 subordinated debt securities and listed these on 11.01.2018 on the Nasdaq Tallinn Stock Exchange. The maturity date for bonds is 2027. The total number of shareholders at the end of the year was 305. Bondholder structure according to holders groups as at 31.12.2019 was the following:
• Private persons: 54%
• Legal persons: 46%
The note contains changes in subordinated debt securities, including monetary or non-monetary movements and exchange rate effects, if they have occurred during the reporting period or comparable period. No non-monetary transactions were executed.
In 2019, 72 transactions in the amount of EUR 269 thousand were made with Admiral Markets AS bonds.
Subordinated debt Issuance year Amount Interest rate Maturity date
Subordinatedbonds (ISIN: EE3300111251)
2017 1,827 8% 28.12.2027
Note 10. Off-balance sheet assetsOff-balance sheet assets are funds of these clients who use the trading systems mediated by Admiral Markets AS. Because of the specific feature of the system, Admiral Markets AS deposits these funds
Off-balance sheet assets 31.12.2019 31.12.2018
Bank accounts 2,521 3,148
Interim accounts of card payment systems
135 41
Stock 75 401
Total 2,731 3,590
in personalized accounts in banks and in other investment companies. The Company does not use client funds in its business operations and accounts for them off-balance sheet.

37
31.12.2019 31.12.2018
Share capital 2,586 2,586
Number of shares (pc) 404,000 404,000
Nominal value of shares 6.4 6.4
Basic and diluted earnings per share 11.40 23.44
Note 11. Share capital
Under the articles of association, the minimum share capital of the investment company is EUR 766,940 and the maximum share capital is EUR 3,067,759, in the range of which share capital can be increased and decreased without amending the articles of association. All issued shares are fully paid.
Basic and diluted earnings per share are calculated as follows:
31.12.2019 31.12.2018
Profit attributable to the equity holders of the Company 4,604 9,470
Weighted average number of ordinary shares (pc) 404,000 404,000
Basic and diluted earnings per share 11.40 23.44
Each share grants one vote at the general annual meeting of shareholders of Admiral Markets AS.
In 2019, owners were paid dividends in the total amount of EUR 1,390 thousand i.e. EUR 3.44 per share (2018: 1,325 thousand i.e. EUR 3.27 per share).

38
Note 12. Segment reporting
The Management Board is responsible for the allocation of resources and assessment of the results of operating segments. In 2019 and 2018, the Management Board monitored the operations of the Company as one operating segment.
The Company’s internal reports prepared for the Management Board are drawn up on the basis of the same accounting principles and in a form that has been used in this annual report.
Note 13. Net income from trading
2019 2018
Net gains from trading of financial assets at fair value through profit or loss with clients
37,542 36,472
Net loss from trading of financial assets at fair value through profit or loss with liquidity providers
-2,704 -2,391
Brokerage income 71 85
Brokerage and commission fee expenses -11,708 -9,960
Other trading activity related income 31 74
Other trading activity related expenses -22 -44
Net income from trading 23,210 24,236

39
Note 14. Operating expenses
Type of expense 2019 2018 Note
Marketing expenses -5,525 -4,773
IT expenses -2,400 -2,090
Other outsourced services -239 -491
VAT expenses -621 -445
Rent and utilities expenses -165 -372
Legal and audit services -283 -338
Regulative reporting services -318 -183
Transport and communication costs -107 -102
Travelling expenses -238 -116
Supervision fee of the Financial Supervision Authority -79 -62
Small tools -212 -96
Other operating expenses -519 -64
Intra-group expenses -562 -711 15
Total operating expenses -11,268 -9,843

40
Relation 2019 2018
Revenue from brokerage andcommission fees*
Companies in the same consolidation Group
35,806 34,254
ServicesCompanies in the sameconsolidation Group
400 265
Interest incomeSenior management andcompanies related to them
5 5
Interest income Parent company 52 62
Total transactions with relatedparties
36,263 34,586
Note 15. Transactions with related parties
Transactions with related parties are transactions with the parent company, shareholders, members of the management, their close relatives and entities that they control or over which they have significant
* The majority of clients have concluded trading contracts with the entities which are part of the same consolidation group that mediate their trading transactions with the entity and to whom the entity pays a commission fee (see the next table).
Revenue
Expenses
influence. The parent company of Admiral Markets AS is Admiral Markets Group AS. Mr. Alexander Tsikhilov has the ultimate control over the Company.
Relation 2019 2018 Note
Commission feesCompanies in the sameconsolidation Group
-11,359 -9,554
ServicesCompanies in the sameconsolidation Group
-83 -288 14
Services Parent company -479 -423 14
Total transactions with relatedparties
-11,921 -10,265

41
Payables
The payments made and benefits granted to the management (gross) were EUR 465 thousand and EUR 423 thousand respectively in 2019 and 2018.
As at 31.12.2019 outstanding unpaid salaries were in amount of 17 thousand EUR.
31.12.2019 31.12.2018 Note
Receivables from other companies in the same consolidation Group (short-term)
0 166 6
Loans from parent company (long-term) 3,500 2,500 6
Receivables from companies related tohigher management
255 302
Total receivables from related parties 3,755 2,968
Loans and receivables
Jens Chrzanowski was appointed on 10.02.2020 as member of the Management Board of Admiral Markets AS. Jens Chrzanowski has been a member of the Management Board of Admiral Markets Group AS since 2017. He founded the Berlin Office of Admiral Markets in 2011 and under his leadership Admiral Markets has won the most significant
awards and recognitions in the financial world in Germany in 2019. Prior to joining Admiral Markets, Jens Chrzanowski has worked at FXCM, a finance firm, as a senior sales associate, at E*Trade as a sales manager and as a brokerage consultant at Deutsche Bank.
Note 16. Events after the balance sheet date
31.12.2019 31.12.2018 Note
Payables to other companies in the same consolidation Group 989 460 7
Total payables to related parties 989 460