admiral markets as unaudited interim report on the first 6
TRANSCRIPT

Admiral Markets AS
Unaudited interim report on the first 6 months of 2020

Commercial Registry no. 10932555
Address Maakri 19/1, Tallinn, 10145
Telephone +372 6 309 300
Fax +372 6 309 304
E-mail [email protected]
Main area of activity Investment services
Activity licence no 4.1-1/46
Beginning and end date of interim report period 01. January - 30. June
Chairman of the Management Board Sergei Bogatenkov
Members of the Management BoardDmitri LaušJens Chrzanowski
Chairman of the Supervisory Board Aleksander Tsikhilov
Members of the Supervisory Board Anton TikhomirovAnatolii Mikhalchenko
Auditor PricewaterhouseCoopers AS
Admiral Markets AS
Unaudited interim report on the first 6 months of 2020
3
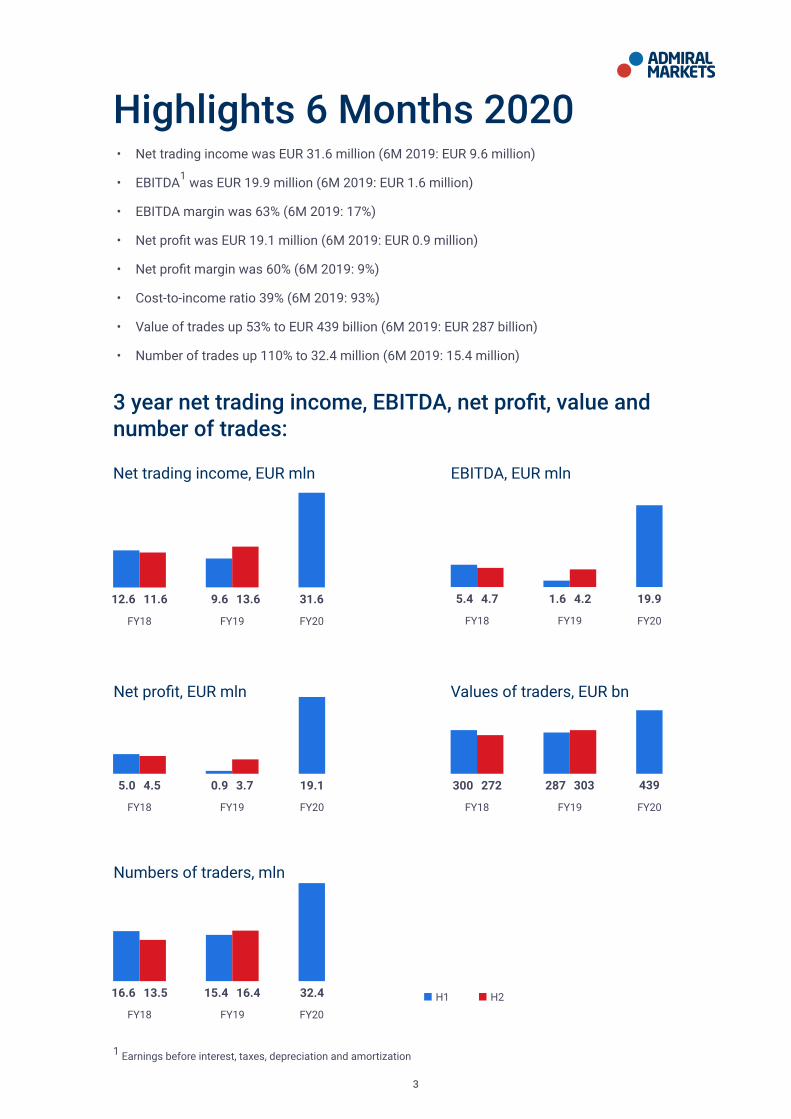
Highlights 6 Months 2020
3 year net trading income, EBITDA, net profit, value and number of trades:
• Net trading income was EUR 31.6 million (6M 2019: EUR 9.6 million)
• EBITDA1 was EUR 19.9 million (6M 2019: EUR 1.6 million)
• EBITDA margin was 63% (6M 2019: 17%)
• Net profit was EUR 19.1 million (6M 2019: EUR 0.9 million)
• Net profit margin was 60% (6M 2019: 9%)
• Cost-to-income ratio 39% (6M 2019: 93%)
• Value of trades up 53% to EUR 439 billion (6M 2019: EUR 287 billion)
• Number of trades up 110% to 32.4 million (6M 2019: 15.4 million)
12.6
FY18
FY18 FY18
FY18 FY19
FY18
H1 H2
9.6
FY19
FY19 FY19
FY19
11.6 13.6 31.6
FY20 FY20
Net trading income, EUR mln
4.7 1.65.4 4.2 19.9
EBITDA, EUR mln
5.0 0.94.5 3.7 19.1
FY20
FY20
FY20
Net profit, EUR mln
300 287272 303 439
Values of traders, EUR bn
16.6 15.413.5 16.4 32.4
Numbers of traders, mln
1 Earnings before interest, taxes, depreciation and amortization
4
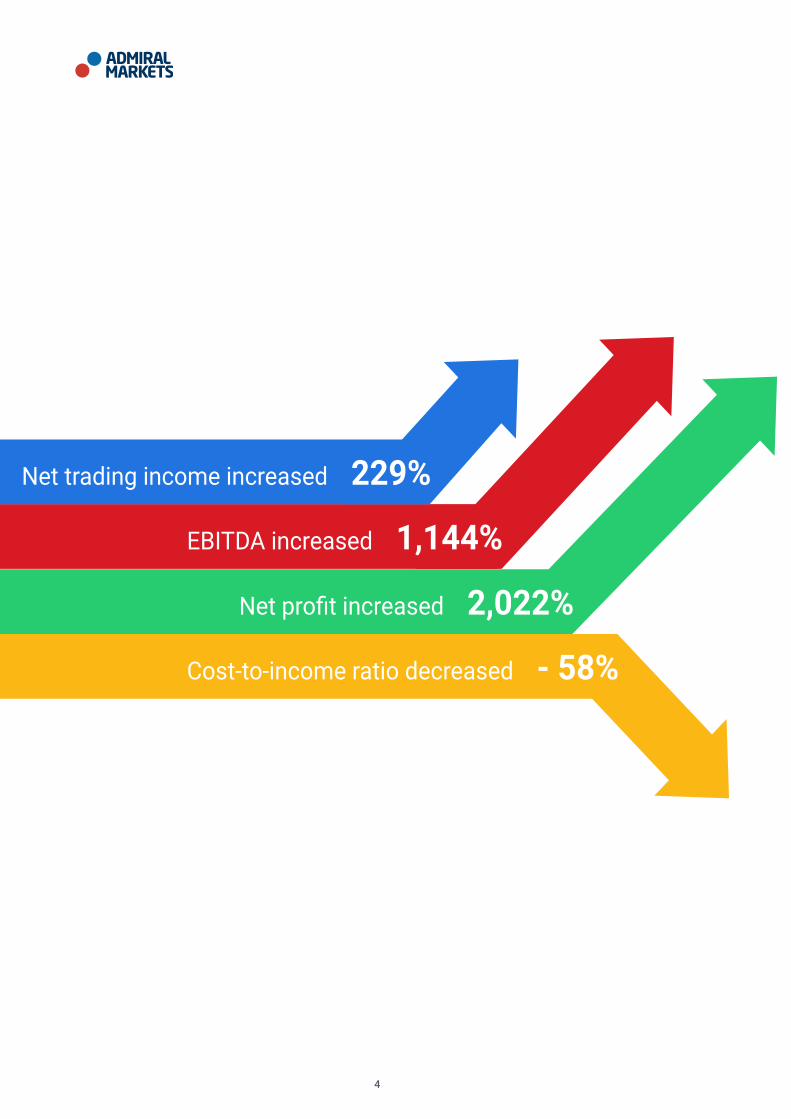
Cost-to-income ratio decreased - 58%
Net profit increased 2,022%
EBITDA increased 1,144%
Net trading income increased 229%

5
The interim report of Admiral Markets AS for the first 6 months of 2020 consists of the management report and financial statements.
The data and additional information provided by Admiral Markets AS in the interim report for the first 6 months of 2020 is true and complete.
The accounting policies adopted in preparing the financial statements are in accordance with the
International Financial Reporting Standards as adopted by the European Union and give a true and fair view of the financial position, financial performance and cash flow of the entity.
The financial statements of the interim report on the first 6 months of 2020 are unaudited.
Management Board declaration
/digitally signed/Sergei BogatenkovChairman of the Management BoardTallinn, 31.07.2020

6
Dear investor,
At the end of 2019, I told my team that 2020 would be a landmark year. It is time to realize the future in terms of environmental, economic, and technological matters even more than we have done before.
2020 began for all of us in a way that no one could have foreseen, what seemed to be more of a topic of a movie, soon developed into a struggle for the whole world. How to prevent infection with COVID19 became a crucial issue.
Despite the uncertain times, Admiral Markets Group AS and its subsidiary Admiral Markets AS exceeded all expectations and hit all-time highs, breaking records set since its establishment 19 years ago, in terms of our net trading revenue. The net trading revenue of Admiral Markets AS reached 31,6 million euros in the first half of 2020. The net trading revenue of Admiral Markets Group AS, the parent company of Admiral Markets AS, reached 37,9 million euros. Admiral Markets Group is a financially secure company, with clients in more than 135 countries and offices in 19 countries worldwide. While delivering successful partnerships for our clients, we continue to provide our incredibly hard-working, loyal, engaged, and dedicated team - opportunities for self-realisation.
After the declaration of a state of emergency, we immediately set up home offices for our HQ in Estonia and everywhere else where Admiral Markets is present worldwide, proving full-scale adaptability to the rapidly changing times. As the quality leader of the market, it was essential to maintain the work routines and workflow while doing it from a distance,
from the safe environment of our homes. Regardless of the missing office life, we managed to maintain the high standards we have for our quality of work and our client-oriented approach. We also set a record in net profit, and the number of new clients, which grew by 1,321% and 260% respectively, group-wise, compared to the same period last year. Our fantastic team, who succeeded perfectly in their self-management and responsible approach towards their tasks, made it possible.
Even in the home office and with the increased demand and load, we kept the promise to our clients - to offer them the high-end quality and customer support. As we are in the digital transformation period and target aggressive active clients’ growth, we went live with the new and personalised application to offer native trading experience. The product-centric development has been replaced by the client-oriented design, focusing on the clients’ real needs.
The start of 2020 provides confidence in the success towards realisation of Vision 2030. In February, we had 4,000 new applications in a month to open a real account with us. In April, the number had increased to 10,000. Today, people have choices, but we can offer them the personalised trading and investing experience, local customer service support. Admiral Markets stands always for speed, innovation, flexibility, and modern tech.
Today, we are digitally mature, having made remarkable progress in terms of IT development. Digitally mature is not just a combination of words, but stands for stable leadership, long-term vision, and digital interactions that work in favor of the company and its clients. Large-scale projects have been completed, and this has resulted in record-
To the investors of Admiral Markets

7
breaking revenue and value-producing. We adhere to the platform approach in building our business in the ecosystem format. We transferred all frontend client environments to the API, rewrote the client dashboard from scratch with a mobile 1st approach, and released a multi-currency wallet. Content, a seamless client journey, gamification, hyper-personalization, storytelling, and loyalty instruments, while building ecosystems are the trends we see and ride along.
We opened ourselves to new markets and established ourselves in South and West Europe. France, Italy, and Spain showed excellent results in the increase of new clients and their assets. In Malaysia, our gateway to Asia, local presence supports our expansion plans in the region. It is a reliable indicator of the efficient work we have been carrying on to open ourselves to new markets.
Our full dedication to providing premium quality trading and investing experience to our clients has resulted in prestigious awards and recognition from authorities from many countries. Up to now, we have been granted over 40 international awards for excellence in trading.
Nature, and the environment around us, are changing at a speed we cannot slow down unless we change the way we think and act. In Estonia, we have joined the Tech Green Pledge, and we are about to dive globally more into green initiatives. At the beginning of 2020, we started implementing the Green Manifesto of Admiral Markets, a landmark and guidelines on how to be more green as a company and individually.
Last year I participated in the delegation of Estonian president’s visit to UAE, looking for new business and investment opportunities. As a result, we decided to be part of the region. We also declared our presence at Dubai EXPO, which is now happening in 2021 and will open Admiral Markets up to the new areas. What is more, from now on, you can find Admiral Markets in Tallinn Airport, as we greet you from the Admiral Markets branded gate no 5.
Admiral Markets believes in giving back to society. We are thrilled to have partnered with Pärnu Music Festival, the outstanding world-class classical musical event in Pärnu, which celebrated its 10th anniversary this summer.
I am pleased with and forever grateful for our fantastic people. There is no doubt that the past months have affected us in terms of our social well-being and health. To keep safe, we all had to maintain social distance and that was not easy. But we managed to do very well despite everything. The results we achieved in terms of our business were outstanding because of our exceptional team and their effort. We managed to stand together even when it was not physically possible.
I am thankful to the people of Admiral Markets, our investors, clients, and right partners with whom all this we achieved in the first half of 2020 were possible. I hope everybody is safe in times that test our values and willingness to stay together.
Sergei BogatenkovChairman of the Management Board Tallinn31.07.2020

8
Table of ContentsManagement report 9Our company 9
Key events in 2020 11
Management 16
Organisation 17
Financial results 18
Capitalisation 27
Interim Financial Statements 29Statements of Financial Position 29
Statement of Comprehensive Income 31
Statement of Cash Flows 32
Statement of Changes in Equity 34
Notes to the Interim Financial Statements 35Note 1. General information 35
Note 2. Presentation and classification changes 35
Note 3. Risk management 36
Note 4. Due from credit institutions and investment companies 36
Note 5. Financial assets and liabilities at fair value through profit or loss 37
Note 6. Loans and receivables 37
Note 7. Liabilities and prepayments 39
Note 8. Finance and operating lease 39
Note 9. Subordinated debt securities 40
Note 10. Off-balance sheet assets 40
Note 11. Share capital 41
Note 12. Segment reporting 41
Note 13. Net income from trading 42
Note 14. Operating expenses 42
Note 15. Transactions with related parties 43

9
ADMIRAL MARKETS AS was founded in 2003. In 2009, the Estonian Financial Supervisory Authority granted Admiral Markets AS the activity licence no. 4.1-1/46 for the provision of investment services. The Company is part of an international group (hereinafter “Group”) which operates under a joint trademark – Admiral Markets. Admiral Markets Group AS, the parent company of Admiral Markets AS, owns 100% of the shares of Admiral Markets AS.
The main activity of Admiral Markets AS is the provision of trading and investment services (mainly leveraged and derivative products) to retail, professional and institutional clients. Customers are offered leveraged Contract for Difference (CFD) products in the over-the-counter market, Forex as well as listed instruments. The Company’s activities have mostly targeted experienced traders, but since last year we have also strengthened our position in the beginner’s segment. Therefore, the Company focuses on the improvement of general trading skills of experienced traders and the training of new enthusiasts as well.
In addition to the provision of other support services, under White Label agreements, Admiral Markets AS, being the administrator and developer of the platform, provides all sister companies that are part of the same consolidation group the possibility of using the investment platform. In line with the Group’s strategy, the sister investment companies of Admiral Markets AS hedge the risks arising from their customers’ transactions in Admiral Markets AS, who is also their sole liquidity partner. Due to this, the results of Admiral Markets AS depend on other companies in the Group.
In addition to the services offered to retail, professional and institutional customers, Admiral
Management reportOur company
Markets AS also acts as a provider of support services for its consolidation group companies, being responsible for all key middle and back-office functions:
• Administration and development of IT platforms in cooperation with AMTS Solutions OÜ and Runa Systems, the subsidiaries of Admiral Markets Group AS;
• Risk management;
• Liquidity provision – Admiral Markets AS is the sole liquidity provider for all investment companies in Admiral Markets Group AS;
• Marketing;
• Financial services;
• Compliance.
The licenced investment companies that are a part of the same consolidation group as Admiral Markets AS are Admiral Markets UK Ltd, Admiral Markets Pty Ltd and Admiral Markets Cyprus Ltd. Admiral Markets AS has a licence granted by the Estonian Financial Supervisory Authority. Since Admiral Markets AS and other licenced investment companies that are part of the same consolidation group use the same joint trademark, the reputation of the trademark of Admiral Markets has a major direct impact on the financial indicators as well as the business success of Admiral Markets AS.
Admiral Markets AS has a branch in Poland, a representative office in Russia, a subsidiary in Canada and a recently established subsidiary in Jordan. Currently, the branch in Poland is in the process of being liquidated. The branch is being closed in connection with shaping the strategy of Admiral Markets AS’ parent company Admiral

10
Markets Group AS for the coming years. As the branch is not engaged in providing investment services and the branch has no clients, the closing of the branch will not have a significant impact on Admiral Markets AS’ business or financial results. Admiral Markets Cyprus Ltd is establishing several branches in the Member States of the European Union, including the Republic of Poland. As the continuation of the Admiral Markets AS branch in the same country has been deemed unnecessary and expedient, Admiral Markets AS has decided to continue serving its existing and potentially new customers on the basis of a cross-border license.
Admiral Markets Group AS structure
The structure of Admiral Markets Group AS, the parent company of Admiral Markets AS at the time of publishing this report is as follows:
At the time of publishing this report Admiral Markets Group AS owns 100% of the shares of all its subsidiaries, except for AMTS Solutions OÜ, where Admiral Markets Group AS has 62% ownership. Currently, the Latvian branch of Admiral Markets UK Ltd is in the process of being liquidated. This
Other companies that are part of the same consolidation group as Admiral Markets AS at the time of publishing this report are Runa Systems, AMTS Solution OÜ, AM Asia Operations Sdn. Bhd., AM INVESTMENTS AND TRADING SA (PTY) LTD and Gateway2am OÜ (former name Admiral Virtual OÜ). AM Asia Operations Sdn. Bhd (Malaysia) and AM INVESTMENTS AND TRADING SA (PTY) LTD (Republic of South Africa) were established in 2019. Admiral Markets Chile SpA, which had been inactive for several years, was sold in November 2019. Runa Systems and AMTS Solution OÜ offer IT and other intra-group services. Gateway2am OÜ is inactive at the moment.
change has no impact on either client relationships or the investment services provided to the clients as clients can continue trading on a cross-border basis through entities of the Group holding the respective licence.

11
Key events in 2020
During the first 6 months of 2020, a number of new large-scale IT developments and projects were launched, contributing to the Company’s digital maturity.
We adhere to the platform approach in the process of building our business in the ecosystem format. We transferred all frontend client environments to the API, rewrote the client dashboard from scratch with a ‘mobile-first’ approach, and released a multi-currency wallet.
On our way becoming a financial hub for a variety of trading, investing, social trading and financial added value services, the Company launched a Mobile App, an ultimate mobile application that a person needs to trade-on-the-go. It provides access to an extensive product offering: Forex, CFDs on stocks, indices, commodities, cryptocurrencies, ETFs and stocks and ETFs. The app has a user-friendly interface, which allows the user to trade on
The Company expanded its stock and share CFD offering to include a range of US companies with a market capitalisation of over $1 billion. This provides the opportunity for traders and investors to incorporate high-value companies into their portfolio. Also, there is still an ongoing promotion of
The Company has won over 40 international awards for excellence in Forex and CFD trading. This is proof that when you choose to trade with Admiral Markets, you can rest assured that you are deciding to trade
mobile devices at any time, any place, opening up a more personal and easier native trading experience than ever. It is possible to switch between Demo and Live Trading modes.
Rewriting the client Dashboard from scratch is a new benchmark for the client, enabling them to easily navigate between the Dashboard and the public website without logging out, thus making it super user-friendly. Both, the Company’s public websites and Dashboard use from now on the same components (buttons, input fields, cards etc) that result in a similar look and user experience.
We expanded the growth and development of our exclusive Premium Analytics portal to include featured trading ideas from Trading Central. Admiral Markets’ Premium Analytics portal is the ultimate toolbox traders can use to stay up-to-date, with market news, economic calendars, market sentiment and technical analysis all in a single portal.
a zero-spread offering on US/EU/UK stock CFDs and US/EU/UK EFT CFDs. On the Invest MT5 account, the Company offers over 4,500 stocks and 200 ETFs. New FX currency pairs USDCLP and USDBRL have been added to the portfolio.
with the best possible trading terms and the best customer service. The year began with news from Deutsches Kundeninstitut, who named us Germany’s Top CFD Broker 2020. This was the fifth year in a row
IT and Mobile developments
New instruments
Rewards
12
High market volatility in the first half of 2020 together with a variety of projects and campaigns led the Company to record numbers in the lead prospective and overall acquisition numbers.
During the first half of 2020, various campaigns were launched which were related to the best clients’ offers for trading activities. These bonus campaigns, that were promoted in Google, Bing, Facebook and at a variety of 40+ industry sources set the record amount of new clients registered in the Company, and also a new record for trading volumes.
We’ve all seen how COVID19 has shaken up the markets, but it also gave great opportunities to improve communication with clients. Admiral Markets pays a lot of attention to its clients’ education and the quality of the analytical materials. Based on these high standards, during the first 6 months of 2020 the following projects in this direction were launched:
• “Traders Talk” webinars were launched and the wide list of new educational programs.
• The Company and one of the most famous traders in the world, Alexander Elder, made a decision to proceed in 2020 with cooperation in various directions, like educational webinars, books, and masterclasses.
• An annual sponsorship project of the weekly analytical podcasts in cooperation with dv.ee was launched.
• Besides sponsorship of external podcasts, the Company’s analytical team launched a project with its own analytical podcasts in English, German, French and Russian languages
• All the English and Russian speaking clients got a possibility to download the book “Blockchain Basics” by Alexander Tsikhilov - co-founder of Admiral Markets.
Marketing
that Admiral Markets has been recognised as one of Germany’s leading CFD brokers. We won three awards for 2020 in the Global Banking and Finance Review awards - Best Forex Broker in Spain, Best
Forex Education & Training in Germany, and the Brokerage CEO of the Year in Europe. Also, we have been awarded top marks in all several categories from the esteemed Focus Money magazine.
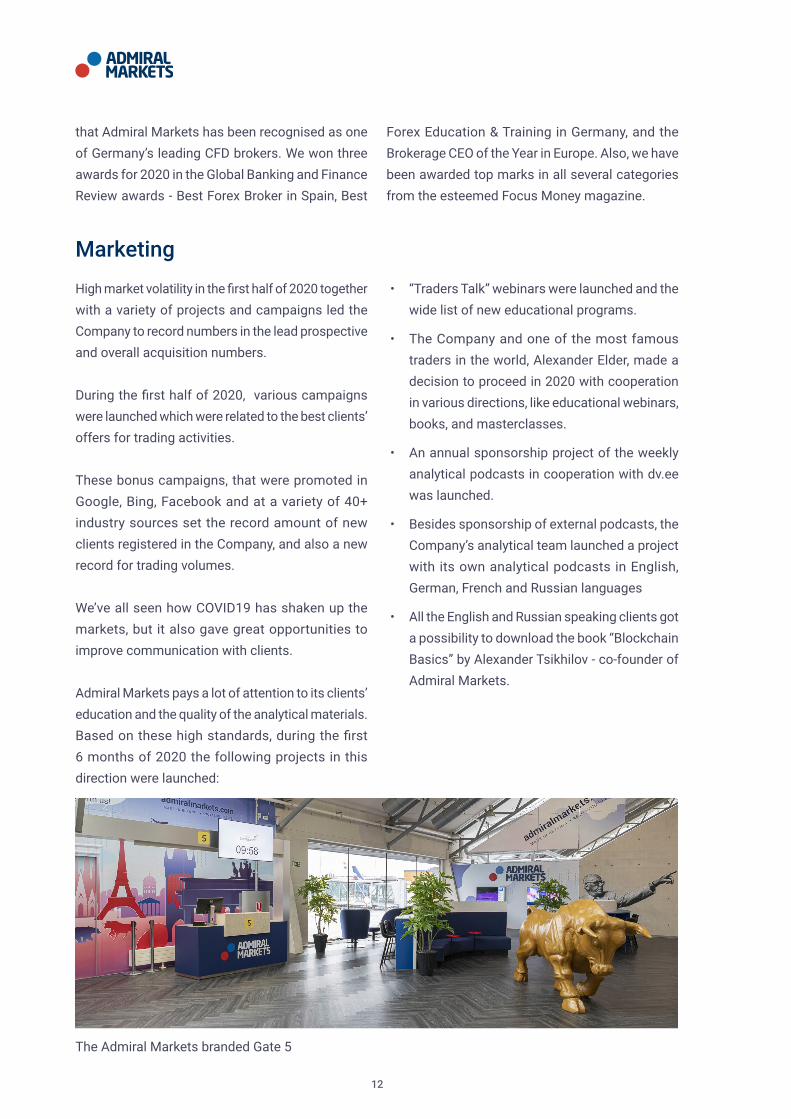
The Admiral Markets branded Gate 5
13
In March 2020 the Company branded the Gate 5 in the Lennart Meri Airport in Tallinn. While waiting for flights, people may open a trading account and get educational information about trading financial markets with special videos.
Admiral Markets offers its clients options to trade all over the world, and that’s why in the first part of the year it launched a redesign for the mobile App, which was highly appreciated in the traders’ society. Successful advertising campaigns were launched in such countries as Peru, Argentina, Austria, Moldova, and Poland.
Besides direct advertising, a successful project with bloggers and opinion leaders was launched in various regions, and more than 40 local industry partners were onboarded as a sponsorship project began with the famous Estonian skydiver Sigrid Alias. As Admiral Markets highly appreciates its clients’ feedback, Trustpilot service was successfully implemented in the first half of 2020.

14
The biggest challenge for the first half of 2020 was definitely the remote work context due to COVID19.
Although we learned that our company can operate fully online, it was a very challenging time for the Company, and together we made it through by supporting everyone step-by-step to return back to a “new normal.”
As a Company, we kept growing even during the quarantine time, and all of our employees were
safe and healthy - the Company did not have to lay off people or reduce wages. Instead, we paid even more attention to internal communication, sent our employees gifts, e.g. fruit baskets and vitamins, and initiated team events by giving out additional team-building budget, which teams began using when the COVID19 peak was over, and we slowly returned back to our office to make team spirit stronger and elevate communication and motivation. This initiative was appreciated by everyone as all teams had used the opportunity by the end of June.
Employer initiative
The main key aspects of 2020 have been the development of our people and organizational culture. At the beginning of the year, a yearly training plan was approved, according to which we started to offer people various internal training opportunities to improve their technical and soft skills. At the beginning of the year, we also launched the new Engagement and Performance platform Culture Amp. It is software with powerful analytics which will help us to keep performance evaluated and makes it easy to collect, understand, and act on employee feedback. The first engagement survey was conducted in February. Also, we started our leadership development with our middle-level managers, including a tailored training program and external mentors and continued with development
plans for the top leaders of the Management and Supervisory Board.
The Company also continued its financial training Fundamentals of Financial Markets and provided its employees with the opportunity to complement their knowledge of financial markets and instruments. Switching onto remote work during COVID19 pandemic heat point proved us that we need to be able to offer training for our employees virtually, for that to happen conveniently, agreement with Training platform provider Coursy started and during the second half of 2020, we will implement several full training programs related to onboarding and manager support.
People
15
In the first half of 2020, no new laws or regulations that would significantly affect the activities of the Company were introduced. Admiral Markets AS continued its usual activities in compliance with the applicable Estonian and European Union laws and regulations in the areas of investment services regulation, anti-money laundering and counter-terrorist financing and personal data protection. In addition to conducting our usual activities in
The Company is constantly growing, and many new people are being recruited externally. There has also been a positive trend in the internal movements of the organisation - 16 employees have moved
accordance with the highest standards of the applicable laws and regulations, Admiral Markets AS has put a lot of effort into training its staff in order to further enhance a compliance culture throughout the Company. Admiral Markets is actively monitoring the potential impacts arising from Brexit, in order to be able to promptly implement any necessary amendments in our structure, systems and processes.
to new positions within the Company in the first half of 2020. This year, we continue with different projects related to the employer external branding.
Regulations
Internal movements
Keeping Distance to Stay Together - Quarantine 2020

16
Management
Admiral Markets AS is managed by a three-member Management Board and supervised by a three-member Supervisory Board. The members of the Management Board actively participate in the Company’s daily business operations and have clear responsibilities. The Supervisory Board shapes the vision and business strategy of the Company,
actively guiding its growth and development and also supervises activities of the Management Board.
In the first six months of 2020, the remuneration of the management, including social security taxes, totalled EUR 242 thousand (6 months 2019: EUR 247 thousand).
The members of the Management Board of Admiral Markets AS at the time of preparation of the interim report are Sergei Bogatenkov, Dmitri Lauš and Jens Chrzanowski.
Management Board of Admiral Markets AS
The members of the Supervisory Board of Admiral Markets AS at the time of preparation of the interim report are Alexander Tsikhilov, Anatolii Mikhalchenko and Anton Tikhomirov.
Supervisory Board of Admiral Markets AS

17
Organisation
The Company’s management is responsible for the organisational structure and technical arrangement of Admiral Markets AS. To manage its activities, the Company mainly uses specialists and experts employed under employment contracts, but it also purchases services from professionals in compliance with the terms and procedures laid down in the legislation, relevant guidelines and established internal procedures on the basis of the decisions made by the Supervisory Board and the Management Board.
At the end of the first half of 2020, the Company had 129 employees (2019: 153 employees). The employees were allocated between Admiral Markets AS, its branch and representative office as follows: Admiral Markets AS – 124 employees, the Polish branch – 2 employees and the Russian representative office – 3 employees. In the reporting period, remuneration paid to employees including social security taxes amounted to EUR 4,0 mln (6 months 2019: EUR 3.3 mln).

18
The US economy shrank by an annualized 5% in Q1/2020, ending the longest period of expansion in the country’s history, and indicating the biggest drop in GDP since Q4/2008.
What remains to be seen is how substantial the real impact on the US economy from the Coronavirus lockdown will be, since many of the restrictions were not put in place until the second half of March.
The United States
Financial results
During the first half of 2020, global economies were principally driven by the impact of COVID19. As of today, it is still not yet clear how deep the economic impact of the ‘Corona lockdown’ will be. The full scope of the economic impact from the COVID19 pandemic is not yet fully reflected in published economic data from around the globe, since the counter-measures taken (the ‘Corona lockdown’) were only implemented for the two last weeks of the first quarter. As a result, the Eurozone economy shrank by 3.6% quarter on quarter in the first three months of 2020, while the US economy shrank by an annualized 5% in the first quarter of 2020. That said, the International Monetary Fund’s (IMF) projection for the global economy sees a contraction of a sharp –3%, assuming that the pandemic fades during the second half of 2020 and containment efforts can be gradually unwound. The global economy is projected to grow by 5.8 per cent in 2021, as economic activity normalizes and is helped by massive policy support. Whether this plays out in this way definitely remains to be seen, particularly as the European Commission’s
“European Summer Economic Forecast” expects GDP Annual Growth Rate in the EU to be -14.2% by the end of Q2/2020, thus much worse than during the 2008/09 financial crisis. As a result, global central banks, and especially the Federal Reserve (Fed), are expected to do everything necessary and flood markets with liquidity to avoid a collapse of the global economy, even though pumping trillions of USD, Euro, JPY, etc. into global markets does not result in increasing demand and consumption. Here, political developments in the US also play an important role: as of now, chances of a re-election of Donald Trump in November start to decrease more and more. His potential successor, Joe Biden, could implement increased tax and regulation, reversing some of the very market-friendly actions that Trump has taken over the course of the last 3-4 years which could weigh heavily on financial and, more severely, the equity markets. In general, a period of significantly slower economic growth can already be seen on several fronts.
Economic environment
Global Economy

19
In the U.K., the government borrowed at a negative interest rate for the first time on May 20, amid growing fears of a deep global recession and expectations of further bond-buying from central banks. Britain’s economy shrank by 2.2% in Q1/2020, compared to Q4/2019, seeing the largest drop in UK GDP since Q3/1979, as the Coronavirus lockdown from mid-March forced non-essential businesses to close and consumers to stay at home. Meanwhile, the CBI Business Optimism indicator tumbled to -87 in the second quarter of 2020 from +23 in Q1/2020. This was its lowest level since records began in the 1950s, as manufacturers took a sharp hit during the shutdown in response to COVID19, as firms in the industry sector expect output and orders to fall at a much faster pace, while employment is seen contracting as the fastest
rate since 1980. For Q2/2020, analysts from the National Institute of Economic and Social Research expect a GDP contraction by around 20%. In all other economies around the globe, it needs yet to be seen how severe the economic impact will be, and how governments will decide on the long-run impact of coronavirus on the UK economy and public finances. When looking at previous epidemics, it seems realistic to assume a period of three years for the real GDP to return to its pre-epidemic level. Brexit could possibly be positive for the UK, which puts the United Kingdom in quite a flexible position to situate itself as an attractive place to be for small- and medium-sized firms, which could be free of some of the regulatory burden that comes with EU membership.
The United Kingdom
The Chinese economy shrank 6.8% (YoY) in Q1/2020 after a 6% growth in Q4/2019, showing the first GDP contraction since records began in 1992, reflecting the severe damage caused by the COVID19 outbreak after Chinese authorities enforced a near two-month-long shutdown of all non-essential business activity. In addition to the long-term negative impact of the Coronavirus pandemic, China is also in an exhausting trade war with the US.
With almost 20% of China’s economy coming from exports, according to data from the World Bank in 2018, the Chinese export market should be expected to drop significantly and weigh heavily on the Chinese economic growth outlook, resulting capital outflows from China could continue in the months to come and limit the economic growth prospects of the Chinese economy in H2/2020.
China
That is particularly worrisome, as the US labour market crashed and labour data points to a loss of jobs by 20.5 million in April, making this the steepest plunge in payrolls since the Great Depression.
The Fed tried to dampen the negative economic effect, pumping its balance to over 7 trillion USD
and expanding it by over 50% in only two months, with further monetary stimulus to be expected in the near- and mid-term. But whether or not these measures from the US central bank are successful will be seen in time, as monetary and fiscal stimulus does not necessarily result in increased demand and consumption.

20
The Estonian economy shrank by 0.7% year-on-year in Q1/2020, following a 3.9% growth in Q4/2019. It was the first contraction of the Estonian economy since Q1/2010, as both government spending (-0.3% vs 1.4% in Q4 2019) and fixed investment (-6.9% vs 6.7%) contracted while private consumption growth eased (0.3% vs 2.2%). On the production side, negative contributions to GDP came from the energy sector and manufacturing.
On a seasonally adjusted quarterly basis, the GDP contracted by 3.7% in Q1/2020, reversing from a 0.9% growth in Q4. Due to the negative global economic impact from the Coronavirus pandemic, current economic policy statements from Eesti Pank projects the Estonian GDP Annual Growth Rate to be -12.5% by the end of Q2/2020 and to stand around -3% in 12 months time.
Estonian Economy
The Eurozone economy shrank by 3.6% quarter on quarter in the first three months of 2020, as the European Commission’s “European Summer Economic Forecast” expects the GDP Annual Growth Rate in the EU to be -14.2% by the end of Q2/2020. What needs to be seen, is whether the massive monetary and fiscal action and support offered to countries like Italy and Spain which were hit hard by the Coronavirus will be enough and result in a sharp economic recovery. While the ECB set up a bond-buying stimulus package of €1.35 trillion, set to run through at least
• January 16: Donald Trump impeachment trial starts
• March: Coronavirus lockdowns begin worldwide
• November 3: United States presidential election
• December 31: Expiration of the UK’s current transition period for negotiations on a future relationship with the EU
the end of June 2021, it was supplemented by an EU commission proposal of a 750 Billion-Euro package, with 390 billion Euro in grants and 360 billion in loans to EU countries. Still, the ECB has emphasized again and again that the pace of the Eurozone’s economic recovery is very uncertain, the previously mentioned “European Summer Economic Forecast” from the European Commission forecasts for June 2020 suggests that Eurozone GDP will fall 8.7% in 2020 and inflation will remain below the 2% target until at least 2022.
The Eurozone
Significant global events in 2020:

21
Income statement
(in millions of euros)6M 2020 6M 2019 change
Net trading income 31.6 9.6 229%
Operating expenses 12.4 8.9 39%
EBITDA 19.9 1.6 1,144%
Net profit 19.1 0.9 2,022%
EBITDA margin, % 63% 17% 46
Net profit margin, % 60% 9% 51
Cost-to-income ratio, % 39% 93% -54
Business volumes
(in millions of euros)30.06.2020 31.12.2019 change
Due from credit institutions and
investment companies35.4 26.5 34%
Debt securities 9.6 9.3 3%
Shareholders’ equity 56.5 38.8 46%
Total assets 65.8 47.2 39%
Off-balance sheet assets (client assets) 3.0 2.7 11%
Financial review
Main financial indicators of Admiral Markets AS
EBITDA margin, % = EBITDA / Net trading incomeNet profit margin, % = Net profit / Net trading incomeCost-to-income ratio, % = Operating expenses / Net trading income
Equations used for the calculation of ratios:

22
The Company earned record-breaking revenue during the first six months of 2020. Net trading income for the period was EUR 31.6 million, a 229% increase compared to the first half of 2019. Also, the Group’s net trading income rose substantially (171% year-on-year) and reached EUR 37,9 million by the end of June 2020. The results of Admiral Markets AS depends on other companies in the Group, particularly its sister investment companies, as its sister investment companies hedge the risks arising from their clients’ transactions in Admiral Markets AS only. Active clients for the first half of 2020 increased by 104% year-on-year in the Group and the value of trades went up by 53%, reaching EUR 439 billion.
In the first half of 2020, Forex products accounted for 28%, Indices CFDs 42%, commodities CFDs 28% and the share of other products, such as stocks, ETFs etc was 2% of total gross income. Admiral Markets decided already 3 years ago to bring a higher focus to index trading, as the trading volume and volatility in this segment is significant and our product offer is one of the leading ones globally here. Our commercial, balanced product offer of Forex and indices, stocks and commodities CFDs, as well as stocks and ETFs are designed to meet the demand and expectations of the markets.
Net trading income
2%
42%
28% 28%
Gross revenue by assets class, 6 months 2020, %
Other (stocks, ETFs, bonds etc)
Commodities CFD’s
Indices CFD’sForex

23
LICENSED PARTNERDAX ®

24
The Company’s operating expenses increased by 39% in the first half of 2020, mainly due to increases in marketing and personnel expenses.
The largest share of total operating expenses (which includes payroll and depreciation expenses) for the Company in the first half of 2020 comes from marketing expenses. Marketing expenses were EUR 4.2 million which is a 79% increase year-on-year and account for 34% of total operating expenses. The increase in marketing expenses together with the effect of high volatility in global markets resulted in a 104% higher number of active clients (year-on-year) for the Group during the first half of 2020 as well as a 260% higher number of new clients.
In the first half of 2020, personnel expenses increased 18% compared to the previous year
Admiral Markets AS has a strong and growing balance sheet, with EUR 56.5 million of shareholders’ equity and long-term debt of only EUR 6.2 million. Admiral Market AS’ balance sheet is liquid as around 70% of the balance sheet consists of liquid assets.
As of 30 June 2020, the assets of the Company totaled EUR 65.8 million. Ca 54% of assets are balances due from credit institutions and investment companies. Balances due from credit institutions and investment companies have increased 33% in 2020. A large part of the latter was invested in debt securities in 2020. The debt securities portfolio only
EBITDA and net profit of the Company were EUR 19.9 million and EUR 19.1 million, respectively, by the end of the first half of 2020.
and reached EUR 4.0 million by the end of June 2020. Personnel expenses account for 32% of total operating expenses. There was an increase in personnel expenses mostly due to the increase in bonuses paid to employees in the first half of 2020 as the Company introduced a new Internal Motivation System in 2019 in the form of the bonus pool which is dependent on employee development and financial and operational results of the Company.
IT expenses make up around 10% of total operating expenses. Other larger expense types for the Company are legal and audit services, other outsourced services, VAT and intra-group expenses.
The cost-to-income ratio decreased to 39% by the end of June 2020 as a result of improvement in the operational efficiency of the Company.
consists of high-quality liquid assets and accounts for 15% of total assets.
The Company’s non-current assets increased in 2020 by EUR 5.9 million mainly due to the Company establishing a subsidiary in Jordan with a EUR 4.2 million share capital and taking on additional office space in the Tallinn headquarters.
The Company’s long-term debt consists of subordinated debt securities and finance lease and makes up 9% of the balance sheet total. The increase in liabilities in 2020 is due to the Company taking on
The return on equity of the Company was 40.1% at the end of June 2020 (30.06.2019: 2.6%).
Expenses
Statement of Financial Position
Net profit

25
Key financial ratios
Net profit per share, in EUR = net profit / average number of sharesReturn on equity (ROE), % = net profit / average equity * 100Equity ratio = average assets / average equityReturn on assets (ROA), % = net profit / average assets * 100Short-term liabilities current ratio = current assets / current liabilities
The ratios are calculated as an arithmetic average of the closing balance sheet figures from the previous and current reporting period, and the indicators of the income statement are shown as at the end of the reporting period.
Equations used for the calculation of ratios:
additional office space in the Tallinn headquarters. All other liabilities are short-term and are mainly liabilities to trade creditors and related parties, taxes payable and payables to employees.
The off-balance sheet assets (client assets) of the Company totaled EUR 3.0 million by the end of June 2020 (31.12.2019: EUR 2.7 million). Historically, the amount of off-balance sheet assets has decreased
for Admiral Markets AS as the strategy of the Group changed and instead of Admiral Markets AS, its sister company Admiral Markets UK Ltd, became the main retail office of the Group’s European customers. The latter strategy was mainly chosen due to the high reputation of the United Kingdom business environment and the existence of broader investor protection (Financial Services Compensation Scheme – FSCS).
6M 2020 6M 2019 change
Net profit per share, EUR 47.3 2.3 45.0
Return on equity, % 40.1% 2.6% 37.5
Equity ratio 1.2 1.2 0.0
Return on assets, % 33.8% 2.2% 31.6
Short-term liabilities current ratio 16.2 20.4 -4.2
The number of active clients in the Group increased by 104% year-on-year. The Group had 34,439 active clients (clients who have traded at least once in the past 6 months) in the first half of 2020, the strongest indicator ever since the establishment of the Group
19 years ago. Admiral Markets AS direct client base constitutes circa 5% of the total clients of the Group. As the sister investment companies of Admiral Markets AS hedge the risks arising from their clients’ transactions in Admiral Markets AS, who is also
Client trends

26
their sole liquidity partner, the number of clients in the Group, together with their trading volumes, has a direct impact on the Company’s financial results. The Group’s client assets increased by 42% from year-end to EUR 65.1 million as of June 30, 2020.
Since 2018, when new ESMA regulations were established, Admiral Markets eligible clients
could apply to be categorised as professional customers if the client meets the requirements of this amendment. This gives clients access to reduced margin requirements (increased leverage) and full access to all existing and prospective bonus programs. With the new EU regulation, professional clients exclusively get access to higher leverage than retail clients (the leverage varies between products).
Main consolidated financial indicators of the parent company of Admiral Markets AS,
Admiral Markets Group AS
Income statement
(in millions of euros)6M 2020 6M 2019 change
Net trading income 37.9 14.0 171%
Operating expenses 18.2 12.8 42%
EBITDA 21.0 2.1 900%
Net profit 19.9 1.4 1,321%
EBITDA margin, % 55% 15% 40.0
Net profit margin, % 53% 10% 43.0
Cost-to-income ratio, % 48% 91% -43.0
Business volumes
(in millions of euros)30.06.2020 31.12.2019 change
Due from credit institutions and
investment companies49.2 33.7 46%
Debt securities 9.6 9.3 3%
Shareholders’ equity 60.6 42.4 43%
Total assets 71.4 52.0 37%
Off-balance sheet assets (client assets) 65.1 45.9 42%

27
Capitalisation
Risk management is part of the internal control system of the Admiral Markets AS, and its objective is to identify, assess and monitor all the risks associated with Admiral Markets AS in order to ensure the credibility, stability and profitability of Admiral Markets AS.
As at 30.06.2020, the own funds of Admiral Markets AS amounted to EUR 38.7 million (31.12.2019: EUR 35.4 million). At the end of the reporting period, Admiral Markets AS was well capitalised, the capital adequacy level was 23.2% (31.12.2019: 21.1%) and met all regulatory capital requirements.
(in thousands of euros) 30.06.2020 31.12.2019
Paid-in share capital 2,586 2,586
Statutory reserve capital transferred from
net profit259 259
Retained earnings of previous periods 34,567 31,333
Intangible assets -546 -630
Total Tier 1 capital 36,866 33,548
Subordinated debt securities 1,827 1,827
Total Tier 2 capital 1,827 1,827
Net own funds for capital adequacy 38,693 35,375
Own Funds

28
(in thousands of euros) 30.06.2020 31.12.2019
Credit institutions and investment companies under
standardised approach7,745 6,416
Retail claims under standardised approach 6,647 7,571
Other items under standardised approach 19,952 10,593
Total credit risk and counterparty credit risk 34,344 24,580
Currency risk under standardised approach 67,926 71,263
Position risk under standardised approach 14,868 19,243
Commodity risk under standardised approach 6,948 13,263
Total market risk 89,742 103,769
Credit valuation adjustment risk under standardised
method96 25
Operational risk under basic indicator approach 42,651 39,133
Total capital requirements for capital adequacy
calculation 166,833 167,507
30.06.2020 31.12.2019
Capital adequacy 23.2% 21.1%
Tier 1 capital ratio 22.1% 20.0%
Capital Requirements
Capital Adequacy

29
Interim Financial StatementsStatement of Financial Position
(in thousands of euros) Note 30.06.2020 31.12.2019
Assets
Due from credit institutions 4 25,881 19,757
Due from investment companies 4 9,533 6,786
Financial assets at fair value through profit or loss 5 11,915 9,759
Loans and receivables 6 6,842 3,983
Other assets 1,098 912
Long-term investments 4,180 0
Tangible assets 1,365 1,283
Right-of-use asset 4,447 4,059
Intangible assets 546 630
Total assets 65,807 47,169
Liabilities
Financial liabilities at fair value through profit or loss 5 133 66
Liabilities and prepayments 7 2,739 2,349
Subordinated debt securities 9 1,827 1,827
Lease liabilities 4,584 4,145
Total liabilities 9,283 8,387

30
Equity
Share capital 11 2,586 2,586
Statutory reserve capital 259 259
Retained earnings 53,679 35,937
Total equity 56,524 38,782
Total liabilities and equity 65,807 47,169

31
Statement of Comprehensive Income
(in thousands of euros) Note 6M 2020 6M 2019
Net gains from trading of financial assets at fair value through profit or loss with clients and liquidity providers
39,878 14,940
Brokerage fee income 57 20
Brokerage and commission fee expense -8,338 -5,352
Other trading activity related income 12 22
Other trading activity related expense -18 -9
Net income from trading 13 31,591 9,621
Other income 611 421
Other expense -237 -10
Interest income calculated using the effective interest method
48 34
Other income similar to interest 98 82
Interest expense -122 -75
Net gains on exchange rate changes -250 87
Personnel expenses -3,950 -3,343
Operating expenses 14 -7,855 -5,170
Depreciation of tangible and intangible assets -292 -254
Depreciation of right-of-use assets -263 -170
Profit before income tax 19,379 1,223
Income tax -266 -311
Profit for the reporting period 19,113 912
Comprehensive income for the reporting period 19,113 912
Basic and diluted earnings per share 11 47.31 2.26

32
Statement of Cash Flows
(in thousands of euros) Note 6M 2020 6M 2019
Cash flow from operating activities
Profit 19,113 912
Adjustments for non-cash income or expenses:
Depreciation of tangible and intangible assets 555 424
Interest income -146 -116
Interest expense 122 75
Corporate income tax expenses 266 -87
Other financial income and expenses 250 311
Operating cash flows before working capital changes 20,159 1,519
Changes in working capital:
Change in amounts due from investment companies -2,747 -211
Change in trade receivables 6 -504 -867
Change in other assets -185 -34
Change in derivative assets -307 -37
Change in payables and prepayments 389 1,132
Change in the derivative liabilities 67 -110
Changes in inventories 0 -160
Operating cash flows before interest and tax 16,872 1,232
Interest received 158 92
Interest paid -121 -73
Corporate income tax paid -266 -311
Net cash from operating activities 16,643 940
33
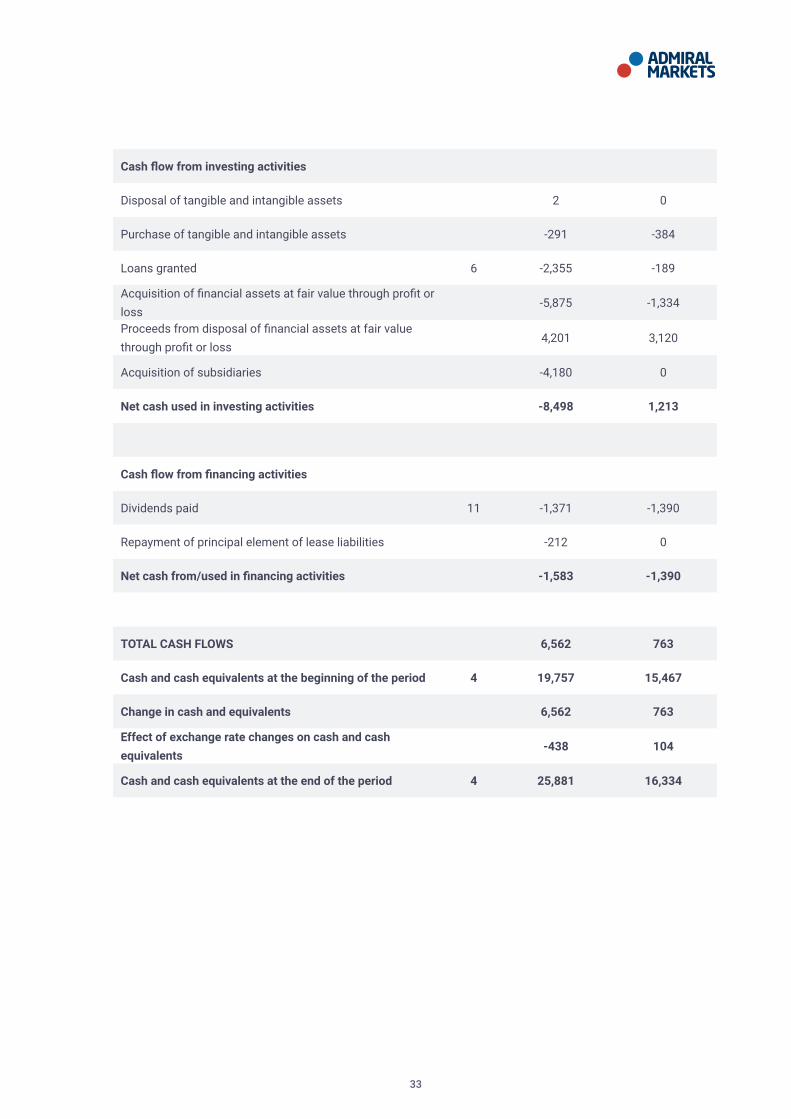
Cash flow from investing activities
Disposal of tangible and intangible assets 2 0
Purchase of tangible and intangible assets -291 -384
Loans granted 6 -2,355 -189
Acquisition of financial assets at fair value through profit or loss
-5,875 -1,334
Proceeds from disposal of financial assets at fair value through profit or loss
4,201 3,120
Acquisition of subsidiaries -4,180 0
Net cash used in investing activities -8,498 1,213
Cash flow from financing activities
Dividends paid 11 -1,371 -1,390
Repayment of principal element of lease liabilities -212 0
Net cash from/used in financing activities -1,583 -1,390
TOTAL CASH FLOWS 6,562 763
Cash and cash equivalents at the beginning of the period 4 19,757 15,467
Change in cash and equivalents 6,562 763
Effect of exchange rate changes on cash and cash equivalents
-438 104
Cash and cash equivalents at the end of the period 4 25,881 16,334

34
(in thousands of euros) Share capitalStatutory reserve
capitalRetained earnings
Total
Balance as at 01.01.2019 2,586 259 32,724 35,568
Dividends paid 0 0 -1,390 -1,390
Profit for the reporting period 0 0 912 912
Total comprehensive income forthe reporting period
0 0 912 912
Balance as at 30.06.2019 2,586 259 32,245 35,090
Balance as at 01.01.2020 2,586 259 35,938 38,782
Dividends paid 0 0 -1,371 -1,371
Profit for the reporting period 0 0 19,113 19,113
Total comprehensive income forthe reporting period
0 0 19,113 19,113
Balance as at 30.06.2020 2,586 259 53,680 56,524
Statement of Changes in Equity
For more information of share capital refer to Note 11.

35
Notes to the Interim Financial Statements
Note 1. General information
Note 2. Presentation and classification changes
ADMIRAL MARKETS AS has been an investment company since 05.06.2009. The Company’s head office is located at Maakri 19/1, Tallinn, Estonia.
Admiral Markets AS has a branch in Poland, a representative office in Russia, a subsidiary in Canada and a recently established subsidiary in Jordan. Admiral Markets AS established a subsidiary in Jordan in May 2020 with a 4,180 thousand euros contribution to the company.
The interim financial statements of Admiral Markets AS have been prepared in accordance with the international financial reporting standard IAS 34 “Interim Financial Reporting”, as adopted by the European Union and with International Financial
In 2019, the Company decided to follow the financial statements presentation of best market practices for credit institutions and investment companies and due to that the presentation of its statement of cash flows for 6 months 2019 has changed. In addition, some immaterial classification errors have been corrected due to the new presentation to provide better comparability between the reporting periods.
The most important change is due to the presentation of due from credit institutions and investment companies. Together with the presentation change, management has changed its previous significant
Reporting Standards (IFRS), as adopted by the European Union.
The interim financial statements should be read in conjunction with the Company’s annual report as of 31 December 2019. The accounting policies used in the preparation of the interim financial report are the same as the accounting policies used in the annual report for the year ended 31 December 2019.
The interim financial statements are unaudited and do not contain all the information required for the preparation of annual financial statements.
The interim financial statements are presented in thousands of euros, unless otherwise stated.
judgment that funds deposited at investment companies meet the cash and cash equivalents criteria. Although the funds deposited in investment companies are still highly liquid and subject to insignificant risk of change in value, the management has decided to present these deposits as receivables and not as cash and cash equivalents, considering the nature and purposes of these balances in the entity’s activities. Therefore, the line items related to the cash and cash equivalents balances in the 6 months 2019 statement of cash flows have been restated as follows:

36
30.06.2020 31.12.2019
Demand and term deposits with maturity less than 3 months* 25,881 19,757
Demand deposits on trading accounts 9,533 6,786
Total 35,414 26,543
Note 3. Risk management
Note 4. Due from credit institutions and investment companies
Risk Management is part of the internal control system of Admiral Markets AS, and its objective is to identify, assess and monitor all of the risks associated with the Company in order to ensure the credibility, stability and profitability of Admiral Markets AS.
There have been no changes in the risk management policies since the year end.
*cash and cash equivalents in the statement of cash flows
Statement of Cash flows line item6M 2019 new presentation
Impact of change6M 2019 old presentation
Change in balances due from investment companies
-211 -211 0
Change in trade receivables -867 -867 0
Change in other assets -34 -34 0
Change in receivables and prepayments relating to operating activities
0 1,868 -1,868
Net cash from operating activities 940 756 184
TOTAL CASH FLOWS 763 756 7
Cash and cash equivalents at the beginning of the period
15,467 -6,527 21,994
Change in cash and equivalents 763 756 7
Cash and cash equivalents at the end of the period
16,334 -5,771 22,105

37
Note 5. Financial assets and liabilities at fair value through profit or loss
Instrument Asset Liability Asset Liability
Bonds 9,558 0 9,339 0
Convertible loan 1,503 0 153 0
Equity investments at fair value through profit or loss
433 0 153 0
Currency pairs 39 28 28 12
CFD derivatives 105 84 72 42
Other derivatives 277 21 14 12
Total 11,915 133 9,759 66
30.06.2020 31.12.2019
Note 6. Loans and receivables
30.06.2020 31.12.2019
Financial assets
Trade receivables 610 13
Doubtful receivables -2 -2
Settlements with employees 16 14
Loans granted 6,080 3,725
Receivables from group companies 27 0
Other short-term receivables 111 233
Total 6,842 3,983

38
31.12.2019Up to 1
year2-5
years
Loan 1 25 25 012M Euribor
+ 4%3.2020 EUR 7 15
Loan 2 200 200 0 2% 12.2020 EUR 4 15
Loan 3 2,500 0 2,500 2% 12.2023 EUR 0 15
Loan 4 1,000 0 1,000 2% 11.2024 EUR 0 15
Total 3,725 225 3,500 11
Distribution bymaturity
Interestrate
Duedate
Basecurrency
Interest receivable
as at 31.12.2019
Note
30.06.2020Up to 1
year2-5
years
Loan 1 25 25 012M Euribor
+ 4%3.2020 EUR 8 15
Loan 2 200 200 0 2% 12.2020 EUR 2 15
Loan 3 55 55 0 2% 4.2021 EUR 0 15
Loan 4 2,300 2,300 0 2% 5.2021 EUR 0 15
Loan 5 2,500 0 2,500 2% 12.2023 EUR 0 15
Loan 6 1,000 0 1,000 2% 11.2024 EUR 0 15
Total 6,080 2,580 3,500 10
Distribution bymaturity
Interestrate
Duedate
Basecurrency
Interest receivable
as at 30.06.2020
Note

39
Note 7. Liabilities and prepayments
Type of liability 30.06.2020 31.12.2019 Note
Financial liabilities
Liabilities to trade creditors 926 646
Payables to related parties 739 989 15
Interest payable 1 1
Other accrued expenses 228 97
Subtotal 1,894 1,733
Non-financial liabilities
Payables to employees 527 361
Taxes payable 318 255
Subtotal 845 616
Total 2,739 2,349
Note 8. Finance and operating lease
Operating lease expense includes office leases of the Polish branch and the Russian representative office. As of 30.06.2020 the lease expense was EUR 19 thousand (30.06.2019: EUR 25 thousand). The operating lease agreement of the Polish branch has been terminated at the time of publishing the interim report.
In 2020, the Company’s tangible assets increased by EUR 652 thousand as the Company added office space on the 9th floor. This is reflected in the statement of financial position as a right-of-use asset and lease liability.
6M 2020 6M 2019
Rental costs 19 25
Utilities 67 64

40
Note 10. Off-balance sheet assetsOff-balance sheet assets are funds of these clients who use the trading systems mediated by Admiral Markets AS. Because of the specific feature of the system, Admiral Markets AS deposits these funds
Off-balance sheet assets 30.06.2020 31.12.2019
Bank accounts 2,234 2,521
Interim accounts of card payment systems
590 135
Stock 211 75
Total 3,035 2,731
in personalized accounts in banks and in other investment companies. The Company does not use client funds in its business operations and accounts for them off-balance sheet.
Note 9. Subordinated debt securitiesIn 2017 Admiral Markets AS issued 18,268 subordinated debt securities and listed these on 11.01.2018 on the Nasdaq Tallinn Stock Exchange. The maturity date for bonds is 2027. The total number of shareholders end of June 2020 was 312. Bondholder structure according to holders’ groups as at 30.06.2020 was the following:• Private persons: 55%
• Legal persons: 45%
Subordinated debt Issuance year Amount Interest rate Maturity date
Subordinated bonds (ISIN: EE3300111251)
2017 1,827 8% 28.12.2027
In the first half of 2020, 45 transactions in the amount of EUR 88 thousand were made with Admiral Markets AS bonds.

41
30.06.2020 31.12.2019
Share capital 2,586 2,586
Number of shares (pc) 404,000 404,000
Nominal value of shares 6.4 6.4
Basic and diluted earnings per share 47.31 11.40
Note 11. Share capital
Under the articles of association, the minimum share capital of the investment company is EUR 766,940 and the maximum share capital is EUR 3,067,759 in the range of which share capital can be increased and decreased without amending the articles of association. All issued shares are fully paid.
30.06.2020 31.12.2019
Profit attributable to the equity holders of the Company 19,113 4,604
Weighted average number of ordinary shares (pc) 404,000 404,000
Basic and diluted earnings per share 47.31 11.40
In 2020, owners were paid dividends in the total amount of EUR 1,371 thousand, i.e. EUR 3.39 per share.
Each share grants one vote at the general annual meeting of shareholders of Admiral Markets AS.
Note 12. Segment reporting
The Management Board is responsible for the allocation of resources and assessment of the results of operating segments. In 2020 and 2019, the Management Board monitored the operations of the Company as one operating segment.
The Company’s internal reports prepared for the Management Board are drawn up on the basis of the same accounting principles and in a form that has been used in this interim report.

42
Note 13. Net income from trading
6M 2020 6M 2019
Net gains from trading of financial assets at fair value through profit or loss with clients
44,460 16,193
Net loss from trading of financial assets at fair value through profit or loss with liquidity providers
-4,582 -1,253
Brokerage income 57 20
Brokerage and commission fee expenses -8,338 -5,352
Other trading activity related income 12 22
Other trading activity related expenses -18 -9
Net income from trading 31,591 9,621
Note 14. Operating expenses
Type of expense 6M 2020 6M 2019 Note
Marketing expenses -4,262 -2,381
IT expenses -1,253 -1,213
Other outsourced services -275 -294
VAT expenses -637 -286
Rent and utilities expenses -86 -88
Legal and audit services -215 -159
Regulative reporting services -45 -114
Transport and communication costs -82 -58
Travelling expenses -38 -41
Supervision fee of the Financial Supervision Authority -59 -31

43
Note 15. Transactions with related parties
Transactions with related parties are transactions with the parent company, shareholders, members of the management, their close relatives and entities that they control or over which they have significant
influence. The parent company of Admiral Markets AS is Admiral Markets Group AS. Mr. Alexander Tsikhilov has the ultimate control over the Company.
Small tools -47 -135
Other operating expenses -462 -264
Intra-group expenses -394 --106 15
Total operating expenses -7,855 -5,170
Relation 6M 2020 6M 2019
Revenue from brokerage andcommission fees*
Companies in the same consolidation Group
42,268 15,404
ServicesCompanies in the sameconsolidation Group
108 110
Interest income Parent company 39 25
Interest incomeSenior management andcompanies related to them
5 2
Total transactions with relatedparties
42,420 15,541
* The majority of clients have concluded trading contracts with the entities which are part of the same consolidation group that mediate their trading transactions with Admiral Markets AS and to whom Admiral Markets AS pays a commission fee (see the next table).
Revenue

44
Payables
In the first six months of 2020, the remuneration of the management, including social security taxes, totaled EUR 242 thousand (6 months 2019: EUR 247 thousand).
30.06.2020 31.12.2019 Note
Receivables from other companies in the same consolidation Group (short-term)
2,327 0 6
Loans from parent company (long-term) 3,500 3,500 6
Receivables from companies related tohigher management
896 255
Total receivables from related parties 6,723 3,755
Loans and receivables
30.06.2020 31.12.2019 Note
Payables to other companies in the same consolidation Group 739 989 7
Total payables to related parties 739 989
Expenses
Relation 6M 2020 6M 2019 Note
Commission feesCompanies in the sameconsolidation Group
-8,050 -5,109
ServicesCompanies in the sameconsolidation Group
-70 -10 14
Services Parent company -324 -96 14
Total transactions with relatedparties
-8,444 -5,215

45
OUR VISION
OUR MISSION
To be the global financial hub in supporting people to make money.
With leadership, education and quality, we bring the financial community together into one powerful marketplace.