administrative and managerial matters
TRANSCRIPT

E
Executive Board Annual Session
Rome, 4–8 June 2007
������������������������� ��������
�������������
Distribution: GENERAL ������������������������
6 June 2007 ORIGINAL: ENGLISH
��������������� ���� ������������������� ��� ����!���"�������#�
This document is printed in a limited number of copies. Executive Board documents are available on WFP’s WEB site (http://www.wfp.org/eb).
E
����������������
2 WFP/EB.A/2007/12-A/Rev.1
����������$" ���������
This document is submitted to the Executive Board for consideration.
The Secretariat invites members of the Board who may have questions of a technical nature with regard to this document to contact the WFP staff focal point indicated below, preferably well in advance of the Board's meeting.
Director, ODM: Mr T. Due tel.: 066513-2008
Should you have any questions regarding matters of dispatch of documentation for the Executive Board, please contact Ms C. Panlilio, Administrative Assistant, Conference Servicing Unit (tel.: 066513-2645).

WFP/EB.A/2007/12-A/Rev.1 3
$" ���� ������
WFP continues to seek to improve reporting instruments, procurement procedures, tracking systems, cooperating partner loss tracking and feedback mechanisms. Improvements in shipping and transport procedures and packaging specifications have been put in place for susceptible foods such as vegetable oil and corn-soya blend. Monitoring at delivery points has been improved to ensure that only the highest quality commodities are distributed. Implementation of comprehensive risk profiling has begun. WFP continues to encourage purchases from local suppliers wherever possible to limit transport time and spoilage.
This report concerns country-specific and commodity-specific issues and describes the measures taken by WFP to keep post-delivery commodity losses to a minimum. The reporting period covered is the calendar year 1 January to 31 December 2006. Annexes I, II and III to this report list commodity losses by reason, commodity and country. Losses equal to or greater than 2 percent of the total net cost, insurance and freight value of commodities handled in any individual country and greater than US$20,000 in absolute value are included in Annex III and ranked in terms of the amount lost in US dollars. The largest losses, both in terms of absolute and proportional net cost, insurance and freight value, receive specific mention in this report; significant but proportionally small losses in countries where large programmes are being implemented are also mentioned.
The estimated total net cost, insurance and freight value of losses during the 2006 reporting period was US$9.9 million, or 0.56 percent of the cost, insurance and freight value of all commodities handled: 4.99 million mt at a total estimated cost, insurance and freight value of US$1.78 billion. In commodity terms, net losses are 24,133 mt, 0.48 percent of the total handled. Compared with the 2005 reporting period, there was a small increase in absolute terms of US$400,000. This may be attributable in part to improved reporting at the country level through greater training and awareness-raising on the issue of post-delivery losses, and to small increases in commodity prices. The fact that the proportional level of losses remained relatively low can be attributed to a number of remedial efforts, which are described in this report. In WFP’s Strategic Plan (2004–2007), one of the five operational indicators is losses; this clearly indicates WFP’s commitment to reducing losses wherever possible.
4 WFP/EB.A/2007/12-A/Rev.1
�������"�����%
In considering the Report on Post-Delivery Losses for the Period 1 January - 31 December 2006 (WFP/EB.A/2007/12-A/Rev.1), the Board notes the country-specific and commodity-specific losses suffered and the corrective actions taken by WFP, governments and other partners to minimize post-delivery losses. It encourages the Secretariat to take all necessary measures to ensure that losses are reduced, to seek reimbursement from governments that lost commodities through negligence and to continue to report to the Board annually.
* This is a draft decision. For the final decision adopted by the Board, please refer to the Decisions and Recommendations document (document WFP/EB.A/2007/15) issued at the end of the session.

WFP/EB.A/2007/12-A/Rev.1 5
"���"����"���������������&�� � ��"��������� �����
�'((')�*+�,'�-,�./0(��*12,�'3��'4,���(2��.5�"'66'12,5� '44�4��1. In 2005, the National Accounting Office of the United Kingdom, at the request of
WFP’s Executive Board, conducted an audit of the arrangements for reporting post-delivery food losses to the Board. The findings of the audit were presented at the Board’s 2006 First Regular Session.
2. The document “Review of the Arrangements for Reporting Post-Delivery Food Losses to the Executive Board: a Report by External Auditor” (WFP/EB.1/2006/6-B/1) makes recommendations on loss reporting, in response to which WFP is taking action.
3. Recommendation 1 asks WFP to consider risk profiling as a basis for focused monitoring in that more sensitive and reliable statistical assessments of total food loss might be reported. A project document to assess the feasibility of applying statistical sampling methods to the assessment of post-delivery losses was produced; funding for the project has been approved and research has started: activities are expected to be operational in the second and third quarters of 2007, overseen by an inter-divisional working group and supported by consultants as required. Field visits are being organized; these will include Bangladesh, where sampling is being applied systematically to determine post-delivery losses. An analysis of risk-profiling methods used by country offices was incorporated into the annual reporting exercise that ended on 31 March 2007. Consolidation of this analysis began in April; it will be developed in consultation with the Risk Planning Group to make recommendations that country offices adopt a corporate approach.
4. Recommendations 4 and 7 suggest (i) a review of reporting by cooperating partners in the local office system with a view to ensuring that a single system is used by all and (ii) continued development of the Commodity Movement Processing and Analysis System (COMPAS) to provide complete reporting throughout the food-supply chain. In 2006, COMPAS management guidelines were amended to include quarterly release of post-delivery losses and regular process-control reports to ensure that country office reporting is accurate. Country offices responded by issuing quarterly losses reports throughout 2006.
�6+.'��6�/,4�2/�"'66'12,5��.'7*.�6�/,�,'��2/2628�� '44�4�5. In 2006, WFP purchased 2.015 million mt of food valued at US$600 million.
Procurement initiatives at Headquarters and in the field have been instrumental in reducing post-delivery losses. It must be noted that procurement depends on the cooperation of units involved in food handling, particularly logistics.
6. At Headquarters, the Food Procurement Service (ODTP) concluded an agreement with a superintendent company for quality control and assurance of processed foods. In addition to the normal quality controls, the superintendent will provide annual audits of production facilities according to good manufacturing practices (GMP) and hazard analysis critical control point (HACCP) principles for a limited number of processed foods that WFP buys in the European Union. WFP plans to expand this to parts of the world where it buys processed foods. It is expected that these preventive controls will result in improved quality and reduced losses.
7. Inadequate packaging of oil, particularly during transport over long distances on rough
6 WFP/EB.A/2007/12-A/Rev.1
roads, can result in significant losses. To counteract this, WFP engaged a consultant to analyse packaging and recommend improvements to plastic containers and cartons. Since November 2006, new specifications for heavier cartons, bottles and cans have been in place. Initial feedback from country offices indicates that oil losses have decreased as a result.
8. At the field level, WFP’s procurement office in West Africa is working with country offices to plan purchases and deliveries of maize meal in line with requested times of arrival to reduce storage time and avoid the resulting losses. This policy is in line with the supply chain optimization project that WFP implemented as part of the New Business Model. Since 2006, maize meal bought in Cameroon is now fortified, resulting in longer shelf-life.
9. In Southern Africa, WFP conducted a HACCP/GMP compliance project for maize meal to ensure that WFP suppliers in the region have adequate quality controls in place with a view to ensuring that high quality maize meal is produced. To detect quality problems before delivery, WFP has enforced the system of quality checks by superintendents at loading points, even in case of delivery-duty-unpaid contracts.
10. In 2006, the procurement unit in East and Central Africa initiated a food supplier monitoring tool that takes into consideration the quality of food delivered, the quantity delivered against contracts and adherence to delivery schedules. WFP carries out in-house quality awareness and is planning an annual quality-control workshop to ensure that all stakeholders operate at the same level.
11. In Asia, WFP continues to buy food in containers, particularly internationally provided rice and regionally procured beans. The inspection company has a standard instruction to check that all containers are seaworthy and that they are lined with Kraft paper and have silica gel added to absorb excess humidity. WFP’s regional quality-control officer investigates all reported incidences of major damage. It is standard procedure to share damage reports with the procurement unit: this feedback and reports from recipients are important in that they enable the procurement section to identify bad suppliers and where necessary adjust quality specifications for food and packaging.
12. In all offices, procurement units continue to hold regular meetings with suppliers to increase awareness of the importance of quality conformity. In the East and central Africa Regional Bureau (ODK), the unit holds quarterly supplier meetings during which senior management communicates setbacks in the pipeline that are a result of negligence by suppliers and discussions are held to devise ways of avoiding such incidents.
'44��2/26280,2'/�0,�,9����:2'/0(� ���(�13. Each regional bureau produces an annual results-based work plan: objectives include the
monitoring of post-delivery losses. As part of WFP’s decentralization initiative, regional logistics officers support country offices on all logistics issues, including post-delivery losses, which contributes to awareness of loss containment. Further examples are provided below.

WFP/EB.A/2007/12-A/Rev.1 7
14. To help to prevent food losses, the Asia Regional Bureau (ODB) has launched initiatives to mitigate losses and improve food quality. A website–http://foodquality.wfp.org−provides a wealth of information on best practices to control food quality. ODB has also:
� defined sampling procedures for superintendent companies;
� encouraged local food production, particularly in the Lao People’s Democratic Republic and Indonesia, reducing storage times and ensuring timely delivery and availability of fresh food;
� worked with WFP’s corporate partner Kemin to define the most suitable process for producing fortified blended foods that are digestible and have good nutritional value, energy density and shelf life; and
� started work on a loss-control database that will provide information for analysis of trends and prioritization of actions.
15. To discourage transit losses caused by transporters or cooperating partners, WFP deducts the value of any loss incurred from their invoices.
16. The West Africa region continued to reduce post-delivery losses despite adverse weather in the region, poor infrastructure and long transit times for landlocked countries. In particular, commodity tracking systems were improved in 2006 through training at the regional level and on-the-job training and support missions to country offices in Burkina Faso, Cape Verde, the Central African Republic, The Gambia, Guinea Bissau, Niger and Senegal. Warehouse and food management training for cooperating partners was rolled out in Benin, Burkina Faso, Chad, Côte d’Ivoire, Mauritania and Niger.
17. Ultimately, closer tracking of the supply chain – including coordination between programme, procurement and logistics – is being implemented to reduce transit times and optimize stocks levels.
18. In southern Africa, post-delivery losses have been reduced by frequent inspections of food in warehouses, regular spraying and fumigation of warehouses, review visits to extended delivery points (EDPs) and direct deliveries. Losses resulting from transport, handling and theft are deducted from invoices presented by service providers. Provisions are made for training warehouse staff and managers.
�/:'2/:��'.;�'3�,9��"'66'12,5��0/0:�6�/,��'.;2/:��.'*+�19. The Commodity Management Working Group, established by WFP’s Transport and
Procurement Division (ODT) in 2001, continues to identify causes of losses in order to develop food management policies, procedures and guidelines. Warehouse management training was coordinated for WFP staff and cooperating partners in collaboration with country offices. Specifications were prepared for standard warehouse support equipment. The Arabic version of the WFP Warehouse Management Manual was published.

8 WFP/EB.A/2007/12-A/Rev.1
"��������� ������ ������������� ��������"���������������������#�
���.�2�)�20. This report covers the period from 1 January to 31 December 2006, during which WFP
handled 4.99 million mt of commodities with an estimated cost, insurance and freight (c.i.f.) value of US$1.78 billion The net c.i.f. value of losses during the period was US$9.9 million, or 0.56 percent of the c.i.f. value of all commodities handled.
21. WFP recovered US$2.8 million through the sale of commodities no longer fit for human consumption or through recovery actions for losses suffered by private contractors. Salvage sales take place only when food is certified unfit for human consumption but have value as animal feed or for industrial purposes. These sales are subject to strict controls to ensure that they cannot be reintroduced for human consumption. For example, when the country office in the Lao People’s Democratic Republic discovered damaged corn-soya blend (CSB), it obtained approval from the provincial food and drug department to sell the CSB as animal feed, for which local companies were invited to bid. All WFP and donor bag markings were obliterated. Of 316 mt of CSB, 306 mt was sold as animal feed; the rest was destroyed.
'44�4�<5�"0*4��22. The most prominent cause was problems at origin, amounting to US$2.87 million —
28.9 percent of all losses for the year. Other major reasons for losses include theft, infestation, civil strife, poor handling and incorrect or excessively long storage. Annex I shows that 20.9 percent of all losses during 2006 (US$2.08 million) were the result of quantities shortlanded.
'44�4�<5�"'66'12,5�23. Annex II shows that the most significant losses in terms of net c.i.f. value were of
cereals such as bulgur wheat, maize, maize meal, rice, wheat and wheat flour, followed by pulses and vegetable oil. Losses in these three foods amounted to 63 percent of all those reported.
'44�4�<5���4+'/42<(���0.,5�24. Approximately 71.7 percent of all post-delivery losses were incurred while under the
direct management of WFP, 19.0 percent were suffered by government counterparts and 9.3 percent were incurred by non-government implementing partners WFP continues to manage the greatest proportion of the food entrusted to it by donors, especially in large and complex emergency operations. For this reason, WFP suffers a correspondingly higher proportion of all losses. The accurate reporting of commodity movements not under WFP’s direct management continues to receive attention.

WFP/EB.A/2007/12-A/Rev.1 9
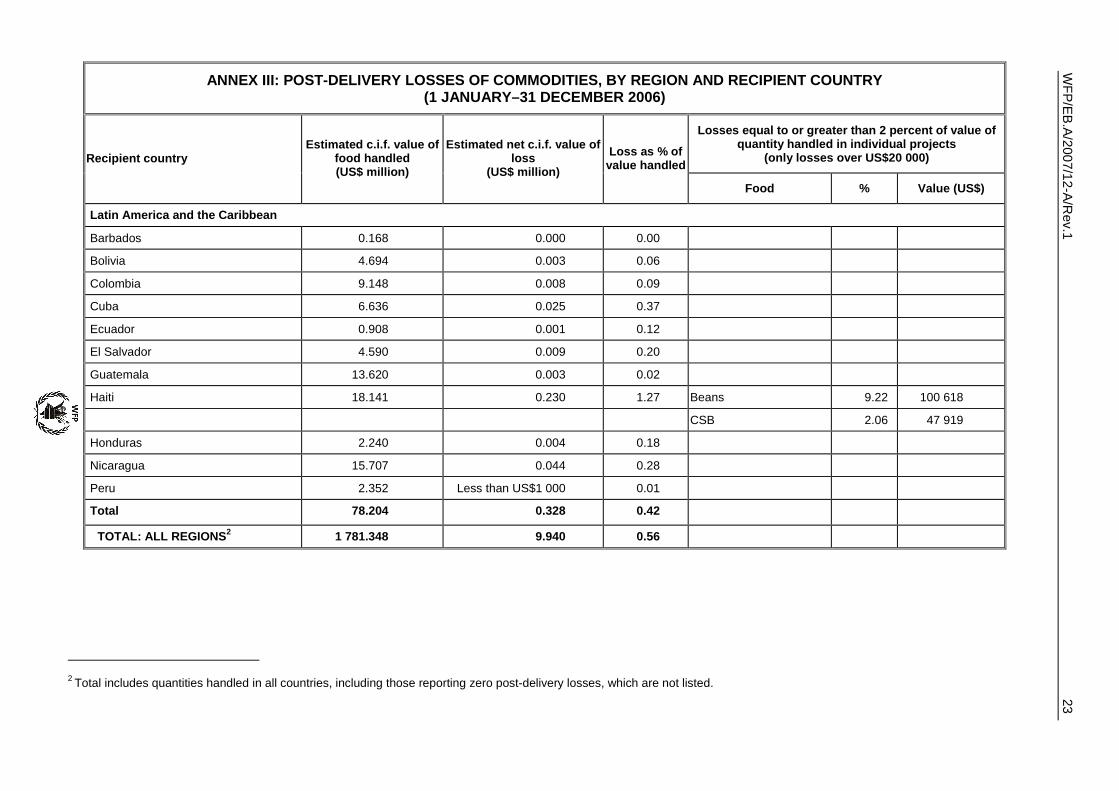
'44�4�<5���72+2�/,�"'*/,.5�25. As Annex III indicates, there were 21 projects in 18 countries registering net commodity
losses equal to or greater than 2 percent of the total value handled, with an absolute net c.i.f. value of US$20,000. The countries involved are Bhutan, Cape Verde, Chad, Congo, Djibouti, Côte d’Ivoire, Haiti, Iraq, the Lao People’s Democratic Republic, Kenya, Mauritania, Mozambique, Pakistan, Sri Lanka, the Sudan, the United Republic of Tanzania, Timor Leste and Zimbabwe. Ten countries – Chad, Côte d’Ivoire, Ethiopia, Haiti, Kenya, the Lao People’s Democratic Republic, Niger, Sri Lanka, the Sudan and Zimbabwe – incurred post-delivery commodity losses with an absolute net c.i.f. value greater than US$100,000. They are described in greater detail below.
⇒ �������26. In 2006, WFP Bhutan sustained post-delivery losses totalling 179 mt from a total
quantity handled of 4,650 mt, 3.85 percent – a high loss in view of the tonnage handled during the reporting period. The most significant losses were 169 mt of CSB, net c.i.f. value US$65,364.
27. WFP recalled CSB from schools because of the poor quality of the shipment received from the factory; the additional handling was problematic, especially for the remote schools, which caused the loss. In future, WFP will ensure strict adherence to quality control criteria when receiving in-kind donations from overseas. The loss of other food, mainly yellow split peas, resulted from long storage in inappropriate conditions. To address this, WFP has upgraded or constructed stores, implemented staggered timing of local procurements and provided warehouse management training for storekeepers.
⇒ ����� �28. Cape Verde recorded losses of 2.9 percent of total food handled – 83.9 mt – which was
declared unfit for human consumption mainly because of long storage of maize meal transferred from the previous programme and to poor storage conditions at schools. Last year’s warm weather had a negative impact on storage conditions; to address it, the country office is (i) calling forward small quantities of maize meal to reduce storage time, (ii) providing further training for warehouse managers and (iii) increasing the involvement of national counterparts in monitoring and evaluation (M&E); the Government is planning a survey to diagnose issues surrounding food losses and identify solutions to the problem. The subsequent sale of the 70 mt of maize meal generated US$10,000, which was allocated for M&E and improvement of storage conditions.
⇒ ��� �29. Chad’s post-delivery losses totalled 1,212 mt out of 66,319 mt; the estimated net c.i.f.
loss value was US$790,900. These losses account for 2.14 percent of the value of food handled during the reporting period. The most significant losses were vegetable oil, cereals and pulses looted from the Abeche warehouse following a rebel attack on 27 November 2006. To address this, WFP has hired additional security guards. The loss of CSB resulted from poor commodity management: the CSB was not distributed before spoilage occurred. Training in commodity management was given to all warehouse personnel and heads of sub-offices.

10 WFP/EB.A/2007/12-A/Rev.1
⇒ ��������������������30. The Republic of the Congo received a containerized consignment of 253.557 mt of
beans in late 2005, of which the WFP superintendent found that 42.250 mt contained detritus. The beans were declared unfit for human consumption after laboratory analysis. There were 384 torn and 205 missing bags; during reconditioning, only 6 mt out of 19 mt were recovered; the rest were spoiled. Cattle farmers bought 51.768 mt, sold on the advice of Headquarters, for US$2,235. Headquarters took up the losses with the supplier because they were the result of negligence on his part; discussions are pending with the supplier and the inspection company.
⇒ ���������31. Djibouti suffered post-delivery losses of 85.6 mt, estimated net c.i.f. value US$34,427
out of 15,484 mt handled. A significant amount of CSB was lost as a result of high humidity and long storage; limited staff availability prevented rapid remixing. WFP will ensure that in future CSB is sent to country offices that can remix the food promptly and ensure that it is fit for human consumption.
⇒ ��������32. Ethiopia recorded losses of 1,553 mt of wheat and CSB out of 385,304 mt handled, or
0.4 percent, valued at US$514,315. The country office has instituted improved commodity tracking using physical counts and COMPAS reports. Stock inventory counts were made quarterly and monthly; periodic quality assessments were made of stocks in WFP warehouses. Periodic fumigation and spraying helped to prevent losses caused by insects. Translated versions of WFP’s Commodity Management Handbook published in the three main languages improved the commodity-management capacity of government counterpart staff, resulting in reduced storage losses.
⇒ ������33. The Haiti country office recorded 437.717 mt of post-delivery losses, c.i.f. value
US$230,221, out of 27,457 mt handled. Losses of beans and CSB exceeded 2 percent of the tonnage handled during the reporting period. Losses of beans resulted from the poor quality supplied: the beans were unfit for human consumption and destroyed. The country office reconditioning exercise reduced the loss to 193 mt, 4.9 percent of the volume handled during the reporting period. This quality issue was reported to ODT and the Legal Services Division (LEG). Losses of CSB – 2.25 percent of the volume handled during the reporting period – resulted from remixing of over-fortified CSB with normal CSB and from shipments damaged by moisture.
WFP/EB.A/2007/12-A/Rev.1 11
⇒ ���� �������34. During 2006, Côte d’Ivoire sustained post-delivery losses of 900 mt – net c.i.f. value
US$468,033 – 2.9 percent of the annual WFP tonnage; 81 percent of the losses occurred during civil strife in January 2006 in Guiglo field office, where all WFP food and non-food stocks were looted; all humanitarian agencies suffered losses of assets. The Emergency Relief Coordinator has sent the bill for losses sustained by United Nations agencies and non-governmental organizations (NGOs) to the Ivorian authorities. To avoid such losses in one field office, the country office has reduced stocks in volatile areas: one month’s distribution is available in the field office at any time. The other 19 percent of losses occurred during inland transport; the values have been deducted from the transporters’ invoices. WFP has provided specialized logistics, handling and transport training for all WFP and country staff dealing with food movements.
⇒ �����35. WFP Iraq sustained post-delivery losses of 58 mt of wheat flour, estimated net c.i.f.
value US$27,922, of a total of 1,251 mt wheat handled, a 4.65 percent loss; the value of wheat flour handled during the reporting period was US$453,356. Losses were mainly a result of prolonged storage because of disrupted distribution cycles, deterioration in security conditions at distribution sites and poor storage in the warehouse. WFP and government counterparts have plans to distribute the food as soon as security permits. Training was given to all warehouse personnel; storage conditions were monitored. Given the unpredictable security conditions, all WFP implementing partners ensure that storage time is limited.
⇒ �� ��36. There were significant losses in Kenya totalling 1,038 mt of CSB and maize, estimated
net c.i.f. value US$309,988; 1.7 percent of the 398,057 mt of food handled. The maize was cleared in good condition on arrival in the port, but part of the consignment was rejected by beneficiaries because of changed colouring; WFP sought laboratory testing. Of a consignment of 7,549 mt, 231 mt had high moisture content: it was unfit for human consumption and destroyed. Of a consignment of 7,690 mt of CSB, 391 mt were infested with weevils and had to be destroyed. WFP Kenya is monitoring the food surveys, which must note more accurately the status of consignments on arrival. WFP appeals to donors to monitor shipping agents to ensure proper storage during trans-shipment. WFP is conducting additional training for its warehouse staff to ensure that storage conditions are adequate.
⇒ !��"���#���$��%���������������37. The Lao People’s Democratic Republic recorded post-delivery losses in 2006 of 316 mt
out of 1,550 mt – 20 percent – of internationally procured CSB handled, estimated net c.i.f. value US$152,000. The loss resulted from spoilage on arrival: bags were torn, damaged and infested with insects. The food was confirmed unfit for human consumption by laboratory tests at the National Resources Institute at the University of Greenwich, London. The Lao People’s Democratic Republic produces sufficient maize and soya beans and there is a local CSB producer, so the country office has decided to procure it locally as long as prices are competitive.

12 WFP/EB.A/2007/12-A/Rev.1
⇒ &����������38. Post-delivery losses in Mauritania in 2006 were 249 mt, net c.i.f. value US$91,489,
0.66 percent of 37,886 mt handled. The most significant losses were 139 mt of wheat, 0.55 percent of the total handled; 42 mt of CSB, 1.89 percent of the total handled; and 39.4 mt of wheat-soya blend (WSB), 100 percent of the total handled, which was damaged in 2005; laboratory analyses confirming it unfit for human consumption were received in 2006. The entire tonnage was sold by tender to brokers for animal consumption; US$1,568 was recovered, 11 percent of the loss value. The principal reason for the losses was climatic conditions. The country office, in collaboration with government counterparts, has (i) improved pipeline management, particularly monitoring of shelf-life, and (ii) enhanced food and warehouse management. Government counterpart store supervisors received training-of-trainers instruction in warehouse management in 2006; the same training is scheduled for storekeepers. Regular fumigations have been carried out since 2006.
⇒ &�'�%�����39. Mozambique sustained post-delivery losses of 93 mt of soya-fortified maize meal in
2006, c.i.f. value US$36,336, 63.6 percent of the 146 mt handled, the balance of a shipment of 7,030 mt received in 2003; 53 mt still fit for human consumption was distributed in 2006 and the remaining 93 mt was declared a loss because of long storage while awaiting customs clearances. This was an exceptional case: the cargo had arrived as surplus – the quantity was not reflected in shipping and clearance documents – which delayed clearance for so long that the food was damaged beyond recovery when finally cleared. The procedures for clearing surplus cargo have been improved; with advanced notice to customs authorities, such delays no longer occur.
⇒ (����40. Niger sustained post-delivery losses of 567 mt of CSB, estimated net c.i.f. value
US$360,700, 2.5 percent of the 22,550 mt handled. The loss, mainly a result of infestation during sea transport, was in the initial phase when the consignment was received at the port of Cotonou; after transit to the WFP warehouses, serious infestation was detected. To address this, WFP and the Government initiated a laboratory analysis, which showed that a quantity could be recovered after reconstitution; a large quantity of the consignment was recovered. Instructions have been issued to WFP superintendents to ensure that in future thorough inspection of consignments is carried out before dispatch to Niger; infested food will be fumigated.
⇒ #�)�$����41. Activity 2 of the Pakistan country programme (CP) sustained post-delivery losses of
51.8 mt of vegetable oil, estimated value US$52,400, 2.19 percent of 2,373 mt handled. The most significant individual losses of 10 mt and 37.3 mt were discovered in two locations in March and September 2006; the main reason for both losses was misappropriation by the government transporter or by warehouse managers. Under the CP, the Government is responsible for receiving WFP food, inland transport to EDPs, storage and distribution. The matter was reported to the authorities, who conducted an investigation and identified those responsible; actions for recovery are ongoing and are being followed up by WFP sub-offices. Other small losses resulted from poor packaging in plastic bottles, mishandling in stores and poor storage conditions. Warehouse management training workshops were held for personnel of the Ministry of Education and Ministry of
WFP/EB.A/2007/12-A/Rev.1 13
Health in all four provinces of Pakistan. Training for staff of the education component has been completed; training for the health component is in progress. By mid-2007, Government officials and storekeepers handling WFP oil will be trained. The country office conducted training for selected government staff on the commodity tracking system (CTS) and introduced WFP's waybill system for use by the Government.
⇒ *���"��)��42. During 2006, Sri Lanka recorded significant post-delivery losses of 152 mt of canned
fish and 1,571 mt of CSB, estimated net c.i.f. value US$649,992, 2.45 percent of the US$18.9 million value of food handled and 3.0 percent of the 57,963 mt of food handled. These losses resulted mainly from the low quality of products received, as certified by quality testing in collaboration with the regional bureau and Headquarters, and poor packaging that allowed contamination and infestation. Storage in poor warehouse conditions for long periods in an adverse climate was a factor in high losses of CSB. To address this, CSB quality and packaging have been improved by the procurement unit and the regional quality-control officer; the origin of food is scrutinized, and the pipeline is monitored more effectively. The Government has increased its quality control of shipments on arrival and has improved warehouse management. WFP has asked the Government to reimburse the project in kind or in services to improve commodity management and cover the losses where they were their responsibility.
⇒ *� ���43. In the Sudan, where most of the infrastructure is seriously degraded and there are
significant security constraints, there were post-delivery losses of 7,883 mt valued at US$2.86 million. In its review of post-delivery losses, the Sudan Regional Bureau (ODS) concluded that most losses resulted from leaking fuel as transporters covered the vast distances involved. Of the total losses, ODS has recovered US$2.2 million from transport billings, equivalent to 79 percent; these recoveries were turned into income for ODS and re-programmed to local purchases of sorghum and sugar. To address recurrent damage to food from leaking fuel, ODS has introduced more stringent transporting requirements, assessed truck quality and revised delivery routes. ODS uses the best quality trucks with large fuel tanks and uses routes with refuelling stations to reduce the need to transport fuel with the food; ODS also introduced improved tarpaulin coverings to protect food when fuel is carried. To address the warehouse losses, the Sudan logistics section emphasizes continuous warehouse management training for its staff and for cooperating partners.
⇒ !��'�����44. Tanzania sustained post-delivery losses of 673 mt, estimated net c.i.f. value
US$218,800, of 121,068 mt handled, 0.61 percent of the US$36.1 million value of food handled during the 2006 reporting period. At Dar-es-Salaam on 10 October 2006, a high proportion of decayed beans were found when containers were destuffed; this was a result of high humidity when the beans were packed. To address this, WFP and Tanzania International Container Terminal Services prioritized destuffing containers of food such as kidney beans that are susceptible to humidity and high temperatures. WFP and the port superintendent ensure that storage of food in Dar-es-Salaam is minimized in future.

14 WFP/EB.A/2007/12-A/Rev.1
⇒ !�%���"$��45. Timor Leste sustained post-delivery losses of 103 mt of CSB, 3.3 percent of the
3,127 mt handled, valued at US$38,019. This loss occurred when the CSB was repacked for take-home rations, which could not be delivered to health centres for distribution because of a security and political crisis in April–June 2006. The CSB remained in the warehouse in Dili until operations resumed in September 2006, during which time it was infested with weevils; laboratory tests confirmed it unfit for human consumption. To prevent a recurrence, the country office has stopped repackaging items with a short shelf life: food is delivered in its original packaging to final delivery points (FDPs). Handling partners have been informed about the dangers of prolonged storage, and pest controls, fumigation and inspections are carried out regularly.
⇒ +�%���,�46. Of the 1,781 mt of losses for 2006 reported in Zimbabwe, 1,450 mt or 81 percent was
CSB that was not distributed in 2005 because it was of poor quality. Lengthy government procedures meant that the food was destroyed and the action reported in 2006.
������ �������� ��������� ������������������� ��������������������������� ��������#�
47. In 2006, 31 commodity losses from previous reporting periods were reported for the first time. The total quantity lost was 3,896 mt in Bangladesh, Guinea, India, the Lao People’s Democratic Republic, Liberia, Mozambique, Niger and Zimbabwe; this includes 240 mt from India that has been under investigation since 2002. Of the remaining losses, 45 percent were from a single 2005 wheat loss in Bangladesh resulting from long storage.
�� ��� ����� ����� ��������"������� ������������ �����������������
48. In 2005, losses under investigation by WFP were reported in Bangladesh, Kenya, the Lao People’s Democratic Republic, Liberia, Niger, Pakistan, Tajikistan, Tanzania, Zambia and Zimbabwe
⇒ #�)�$������ �+�%����
49. There were no extra losses to report for Pakistan or Zambia in 2005.
⇒ ������ $��50. Bangladesh confirms losses of 1,630 mt of wheat resulting from leakage, lack of storage
space, under-payment of entitlements and unauthorized distributions; 81 mt of lost rice that was to be verified in 2005 is still under negotiation and will be reported at a later date.
⇒ �� ��51. Of the 248 mt of losses being verified in Kenya, 230 mt was spoiled and declared a loss
in 2006.
WFP/EB.A/2007/12-A/Rev.1 15
⇒ "���#���$��%���������������52. The Lao People’s Democratic Republic confirmed the theft of 17.4 mt of rice;
90 percent of the value has been repaid in kind and subsequently distributed, with the remaining 10 percent to be repaid in 2007.
⇒ "������53. Liberia confirms theft and transit losses of 1,307 mt of rice, bulgur wheat and CSB. The
staff concerned have been dismissed and security measures and training for cooperating partners have been put in place.
⇒ (�����54. At the end of 2005, 846 mt of CSB was being analysed, of which 226 mt was found to
be unsuitable for human consumption. This loss is reported under protracted relief and recovery operation (PRRO) 10509.0, to which the food was transferred during 2006. After reconstitution, 574 mt was recovered and distributed under emergency operation (EMOP) 10398.0 and PRRO 10509.0; 46 mt was lost, of which 33 mt was reported under EMOP 10398.0 and 13 mt under PRRO 10509.0.
⇒ !��'�����55. In 2005, 264 mt of beans was declared unfit for human consumption at the port of entry
and subsequently written off as a loss for 2006.
⇒ !���)�$����56. In December 2005, 8 mt of wheat flour was damaged in a vehicle fire; the US$1,738 loss
was recovered from the transporter in 2006.
⇒ +�%���,�57. Actual losses exceeded the 11 mt reported in 2005. The country office now imposes
higher deduction rates as a deterrent and is conducting training in food handling.
�����" ���� �� ��������"���������������� ��� � ���� � ���������
58. WFP is currently verifying commodity losses in Bangladesh, Colombia, Côte d’Ivoire and Somalia. Updated accounts of these losses will be provided in future reports.

16 WFP/EB.A/2007/12-A/Rev.1
ANNEX I
POST-DELIVERY LOSSES OF COMMODITIES, BY MAJOR REASON FOR LOSS (1 JANUARY–31 DECEMBER 2006)
Reason for loss Estimated net c.i.f. value (US$ million)
% of total loss
Losses mainly attributable to problems at origin
Deterioration of food 0.060 0.6
Deterioration of packaging 0.157 1.6
Other 2.657 26.7
Subtotal 2.873 28.9
Losses mainly attributable to problems in recipient country
Shortlanded quantities 2.076 20.9
Poor handling 0.327 3.3
Civil strife 0.437 4.4
Infestation 0.704 7.1
Theft/unauthorized distribution 0.903 9.1
Improper/long storage 0.275 2.8
Natural disasters 0.017 0.2
Reconstitution/rebagging/repacking 0.213 2.1
Other 2.116 21.3
Subtotal 7.067 71.1
Total 9.940 100.0

WFP/EB.A/2007/12-A/Rev.1 17
ANNEX II POST-DELIVERY LOSSES OF COMMODITIES, BY COMMODITY
(1 JANUARY–31 DECEMBER 2006)
Food Estimated net c.i.f. value of quantity handled1 (US$ million)
Estimated net c.i.f. value of quantity lost (US$ million)
Loss as % of net c.i.f. value of quantity handled
Cereals
Maize meal 69.691 0.473 0.68
Bulgur wheat 40.864 0.039 0.10
Maize 211.933 0.400 0.19
Rice 141.454 0.524 0.37
Wheat 301.941 1.247 0.41
Wheat flour 63.662 0.155 0.24
Sorghum/millet 149.993 0.596 0.40
Pasta 7.465 0.011 0.15
Other cereals 2.124 0.039 1.86
Oil and fat
Vegetable oil 258.100 1.575 0.61
Other fat 0.867 0.012 1.36
Dairy products
Enriched dried skim milk 6.951 0.051 0.73
Other dairy products 3.969 0.002 0.04
Pulses
Peas 99.045 0.449 0.45
Beans 65.446 0.490 0.75
Lentils 51.993 0.239 0.46
Other
CSB/WSB 177.725 3.042 1.71
Sugar 29.236 0.166 0.57
Canned fish and meat 32.779 0.304 0.93
Salt 3.427 0.017 0.49
Biscuits 37.751 0.076 0.20
Faffa, likuna phala and Indiamix
14.632 0.005 0.04
Pea-wheat blend 5.784 0.017 0.29
High energy supplements
2.254 0.002 0.09
Miscellaneous 2.263 0.010 0.45
All commodities 1 781.348 9.940 0.56
1 Total quantity handled is calculated as: opening stock + amount received in country.

18 W
FP/EB.A/2007/12-A/R
ev.1
ANNEX III: POST-DELIVERY LOSSES OF COMMODITIES, BY REGION AND RECIPIENT COUNTRY(1 JANUARY–31 DECEMBER 2006)
Losses equal to or greater than 2 percent of value ofquantity handled in individual projects
(only losses over US$20 000)Recipient countryEstimated c.i.f. value of
food handled(US$ million)
Estimated net c.i.f. value ofloss
(US$ million)Loss as % of
value handled
Food % Value (US$)
Eastern and Central Africa region
Burundi 33.593 0.045 0.13
Democratic Republic of the Congo 26.776 0.186 0.70
Republic of Congo 3.033 0.043 1.40 Beans 11.68 26 105
Djibouti 5.819 0.034 0.59 CSB 11.64 26 018
Eritrea 22.633 0.003 0.01
Ethiopia 218.925 0.626 0.29 Wheat 0.28 293 577
CSB 0.63 172 313
Kenya 125.450 0.485 0.39 CSB 5.09 171 157
Maize 3.06 44 479
Rwanda 19.427 0.021 0.11
Somalia 38.950 0.046 0.12
United Republic of Tanzania 36.063 0.219 0.61 Beans 27.20 90 987
Uganda 80.104 0.129 0.16
Total 610.775 1.839 0.30
Sudan 259.077 2.861 1.10 Vegetable oil 2.08 816 915
Split peas 17.57 25 300
Yellow split peas 2.21 125 957
Sorghum/millet 0.58 431 649
Wheat 1.05 681 380
CSB 1.77 480 920
Lentils 0.72 109 808

WFP/EB
.A/2007/12-A/Rev.1
19
ANNEX III: POST-DELIVERY LOSSES OF COMMODITIES, BY REGION AND RECIPIENT COUNTRY(1 JANUARY–31 DECEMBER 2006)
Losses equal to or greater than 2 percent of value ofquantity handled in individual projects
(only losses over US$20 000)Recipient countryEstimated c.i.f. value of
food handled(US$ million)
Estimated net c.i.f. value ofloss
(US$ million)Loss as % of
value handled
Food % Value (US$)
Southern Africa region
Angola 16.014 0.068 0.42
Lesotho 12.079 0.032 0.27
Madagascar 5.471 0.030 0.56
Malawi 46.984 0.092 0.20
Mozambique 37.873 0.182 0.48 Soya-fortified maize 63.63 36 336
Namibia 2.777 0.001 0.03
Swaziland 7.395 0.003 0.04
Zambia 36.248 0.097 0.27
Zimbabwe 67.930 0.771 1.13 CSB 16.43 652 838
Total 232.772 1.276 0.55
West Africa region
Benin 3.758 0.024 0.63
Burkina Faso 4.761 0.033 0.69
Cameroon 2.474 0.017 0.69
Cape Verde 2.143 0.031 1.43 Maize meal 7.99 24 986
Central African Republic, the 5.998 0.014 0.23
Chad 36.977 0.791 2.14 Maize meal 4.54 51 781
Sugar 21.04 32 782
Vegetable oil 4.99 60 618
Rice 19.16 99 396
Yellow split peas 12.95 23 816
Enriched DSM 54.49 50 310

20 W
FP/EB.A/2007/12-A/R
ev.1
ANNEX III: POST-DELIVERY LOSSES OF COMMODITIES, BY REGION AND RECIPIENT COUNTRY(1 JANUARY–31 DECEMBER 2006)
Losses equal to or greater than 2 percent of value ofquantity handled in individual projects
(only losses over US$20 000)Recipient countryEstimated c.i.f. value of
food handled(US$ million)
Estimated net c.i.f. value ofloss
(US$ million)Loss as % of
value handled
Food % Value (US$)
CSB 3.17 106 412
Beans 3.84 57 341
Côte d'Ivoire 15.180 0.468 3.08 Maize meal 2.63 121 506
CSB 11.00 51 784
Vegetable oil 3.67 85 861
Beans 2.18 21 398
Yellow split peas 2.13 29 131
Rice 1.84 125 366
Gambia 1.999 0.018 0.89
Ghana 2.571 0.014 0.53
Guinea 10.379 0.014 0.13
Guinea-Bissau 2.762 0.005 0.17
Liberia 27.604 0.027 0.10
Mali 16.900 0.037 0.22
Mauritania 11.836 0.091 0.77 WSB 100.00 13 969
Níger 33.046 0.366 1.11 CSB 2.60 360 372
São Tomé and Principe 1.195 0.002 0.15
Senegal 8.064 0.007 0.09
Sierra Leone 9.758 0.032 0.33
Togo 0.231 Less than US$1 000 0.17
Total 197.638 1.988 1.01
WFP/EB
.A/2007/12-A/Rev.1
21
ANNEX III: POST-DELIVERY LOSSES OF COMMODITIES, BY REGION AND RECIPIENT COUNTRY(1 JANUARY–31 DECEMBER 2006)
Losses equal to or greater than 2 percent of value ofquantity handled in individual projects
(only losses over US$20 000)Recipient countryEstimated c.i.f. value of
food handled(US$ million)
Estimated net c.i.f. value ofloss
(US$ million)Loss as % of
value handled
Food % Value (US$)
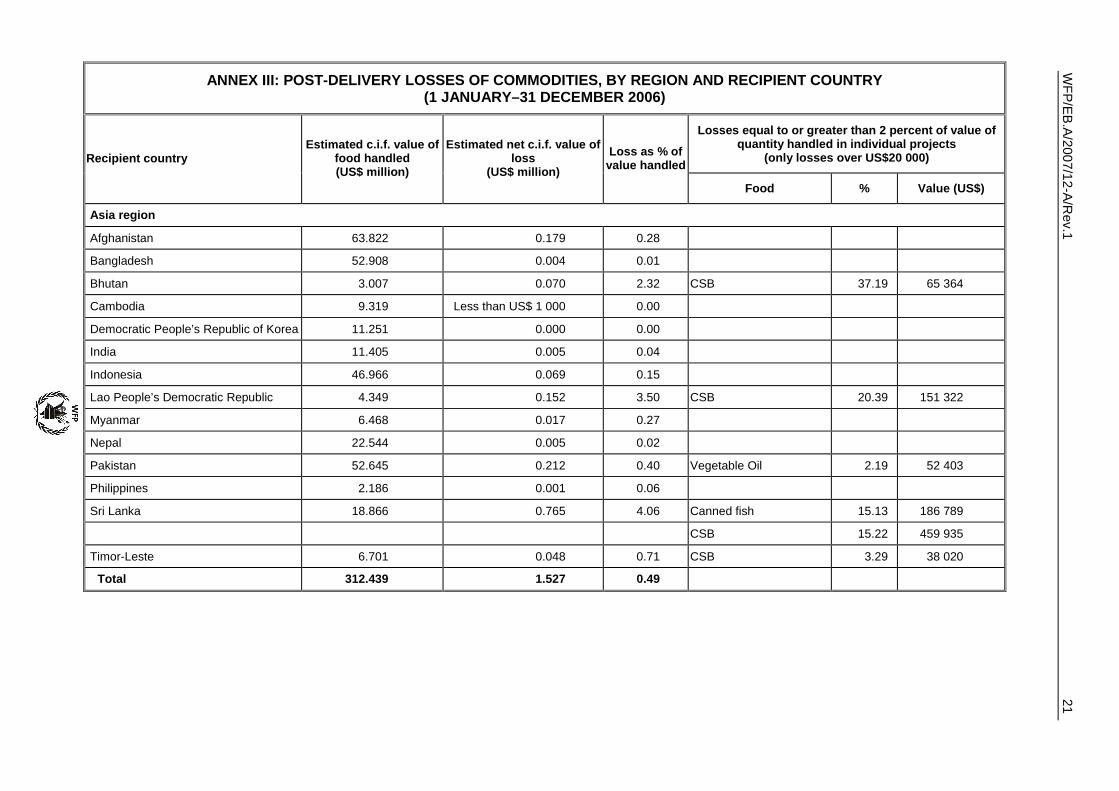
Asia region
Afghanistan 63.822 0.179 0.28
Bangladesh 52.908 0.004 0.01
Bhutan 3.007 0.070 2.32 CSB 37.19 65 364
Cambodia 9.319 Less than US$ 1 000 0.00
Democratic People’s Republic of Korea 11.251 0.000 0.00
India 11.405 0.005 0.04
Indonesia 46.966 0.069 0.15
Lao People’s Democratic Republic 4.349 0.152 3.50 CSB 20.39 151 322
Myanmar 6.468 0.017 0.27
Nepal 22.544 0.005 0.02
Pakistan 52.645 0.212 0.40 Vegetable Oil 2.19 52 403
Philippines 2.186 0.001 0.06
Sri Lanka 18.866 0.765 4.06 Canned fish 15.13 186 789
CSB 15.22 459 935
Timor-Leste 6.701 0.048 0.71 CSB 3.29 38 020
Total 312.439 1.527 0.49
22 W
FP/EB.A/2007/12-A/R
ev.1
ANNEX III: POST-DELIVERY LOSSES OF COMMODITIES, BY REGION AND RECIPIENT COUNTRY(1 JANUARY–31 DECEMBER 2006)
Losses equal to or greater than 2 percent of value ofquantity handled in individual projects
(only losses over US$20 000)Recipient countryEstimated c.i.f. value of
food handled(US$ million)
Estimated net c.i.f. value ofloss
(US$ million)Loss as % of
value handled
Food % Value (US$)
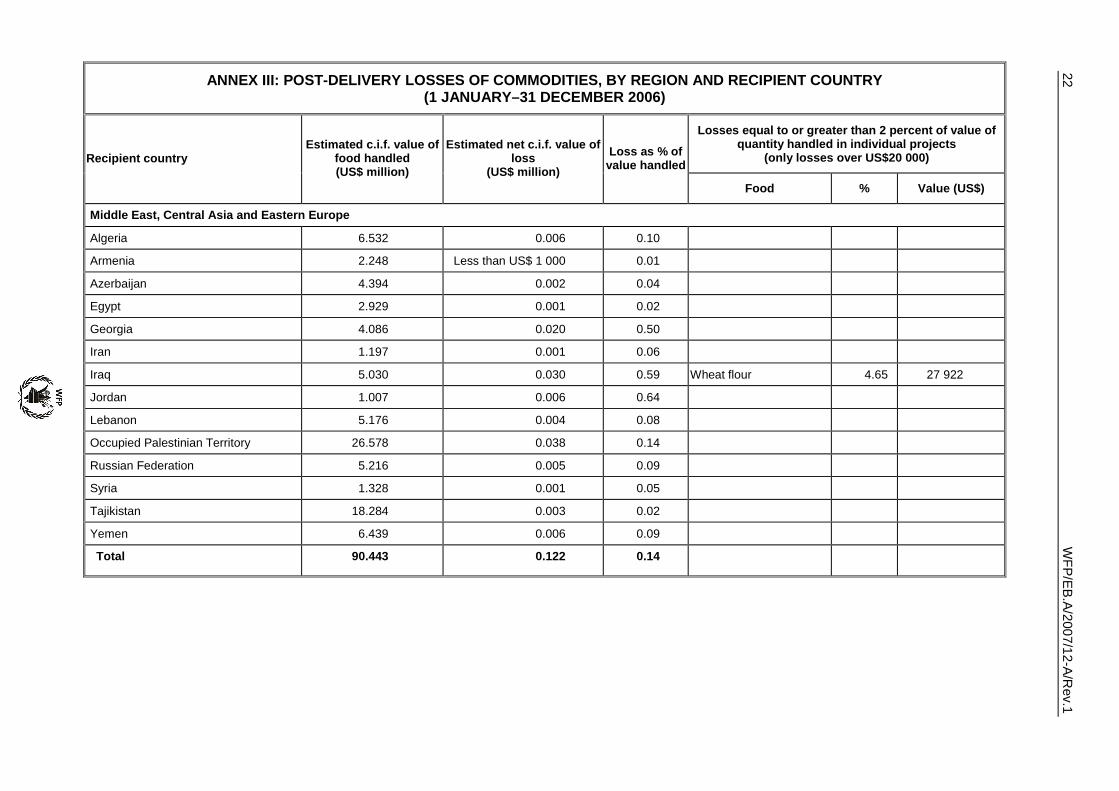
Middle East, Central Asia and Eastern Europe
Algeria 6.532 0.006 0.10
Armenia 2.248 Less than US$ 1 000 0.01
Azerbaijan 4.394 0.002 0.04
Egypt 2.929 0.001 0.02
Georgia 4.086 0.020 0.50
Iran 1.197 0.001 0.06
Iraq 5.030 0.030 0.59 Wheat flour 4.65 27 922
Jordan 1.007 0.006 0.64
Lebanon 5.176 0.004 0.08
Occupied Palestinian Territory 26.578 0.038 0.14
Russian Federation 5.216 0.005 0.09
Syria 1.328 0.001 0.05
Tajikistan 18.284 0.003 0.02
Yemen 6.439 0.006 0.09
Total 90.443 0.122 0.14
WFP/EB
.A/2007/12-A/Rev.1
23
ANNEX III: POST-DELIVERY LOSSES OF COMMODITIES, BY REGION AND RECIPIENT COUNTRY(1 JANUARY–31 DECEMBER 2006)
Losses equal to or greater than 2 percent of value ofquantity handled in individual projects
(only losses over US$20 000)Recipient countryEstimated c.i.f. value of
food handled(US$ million)
Estimated net c.i.f. value ofloss
(US$ million)Loss as % of
value handled
Food % Value (US$)
Latin America and the Caribbean
Barbados 0.168 0.000 0.00
Bolivia 4.694 0.003 0.06
Colombia 9.148 0.008 0.09
Cuba 6.636 0.025 0.37
Ecuador 0.908 0.001 0.12
El Salvador 4.590 0.009 0.20
Guatemala 13.620 0.003 0.02
Haiti 18.141 0.230 1.27 Beans 9.22 100 618
CSB 2.06 47 919
Honduras 2.240 0.004 0.18
Nicaragua 15.707 0.044 0.28
Peru 2.352 Less than US$1 000 0.01
Total 78.204 0.328 0.42
TOTAL: ALL REGIONS2 1 781.348 9.940 0.56
2 Total includes quantities handled in all countries, including those reporting zero post-delivery losses, which are not listed.

24 WFP/EB.A/2007/12-A/Rev.1
�"������� �����������" ����c.i.f. cost, insurance and freight
COMPAS Commodity Movement Processing and Analysis System
CP country programme
CSB corn-soya blend
CTS Commodity Tracking System
EDP extended delivery point
EMOP emergency operation
FDP final delivery point
GMP good manufacturing practice
HACCP hazard analysis critical control point
LEG Legal Services Division
M&E monitoring and evaluation
NGO non-governmental organization
ODB Asia Regional Bureau
ODK East and central Africa Regional Bureau
ODM Programme Management Division
ODS Sudan Regional Bureau
ODT Transport and Procurement Division
ODTP Food Procurement Service
PRRO protracted relief and recovery operation
WSB wheat-soya blend
AM-EBA2007-7525E-REV.1-7793E /