administration dept contents - index /...
TRANSCRIPT

ADMINISTRATION DEPT CONTENTS
PAGE
State of Minnesota Page 1 2012-13 Biennial Budget 2/15/2011
Agency Profile................................................................................................................................................................ 3
Agency Fiscal Page (Gov Rec) ..................................................................................................................................... 6
Change Items ................................................................................................................................................................. 8
Agency Change Items � Increase In Smart Funding ................................................................................................................................ 10
� Transfer Env Quality Bd To Mpca...................................................................................................................... 11
� Operating Budget Reductions............................................................................................................................ 12
� Enterprise Real Property Contributions ............................................................................................................. 14
Programs Govt And Citizen Services .............................................................................................................................. 15 Program Summary ..................................................................................................................................... 16 Budget Activities Developmental Disability Counc.......................................................................................................... 18 Budget Activity Summary ............................................................................................................. 20 Environmental Quality Board............................................................................................................... 21 Budget Activity Summary ............................................................................................................. 23 Fleet And Surplus Services ................................................................................................................. 24 Budget Activity Summary ............................................................................................................. 30 Information Policy Analysis.................................................................................................................. 31 Budget Activity Summary ............................................................................................................. 33 Materials Management ........................................................................................................................ 34 Budget Activity Summary ............................................................................................................. 40 Mn Geospatial Info Office .................................................................................................................... 41 Budget Activity Summary ............................................................................................................. 43 Office Of Enterprise Cont Impr ............................................................................................................ 44 Budget Activity Summary ............................................................................................................. 45 Office Of Grants Management............................................................................................................. 46 Budget Activity Summary ............................................................................................................. 48 Office Of State Archaeologist .............................................................................................................. 49 Budget Activity Summary ............................................................................................................. 51 Plant Management .............................................................................................................................. 52 Budget Activity Summary ............................................................................................................. 62 Real Estate And Constr Service .......................................................................................................... 63 Budget Activity Summary ............................................................................................................. 65 Risk Management................................................................................................................................ 66 Budget Activity Summary ............................................................................................................. 71 Smart................................................................................................................................................... 72 Budget Activity Summary ............................................................................................................. 73 Star ..................................................................................................................................................... 74 Budget Activity Summary ............................................................................................................. 76 State Demographer ............................................................................................................................. 77 Budget Activity Summary ............................................................................................................. 79
Administrative Mgmt Services........................................................................................................................ 80

- CONTENTS (Continued)
PAGE
State of Minnesota Page 2 2012-13 Biennial Budget 2/15/2011
Program Summary ..................................................................................................................................... 81
Budget Activities Executive Support ............................................................................................................................... 82 Budget Activity Summary ............................................................................................................. 83 Financial Mgmt And Reporting ............................................................................................................ 84 Budget Activity Summary ............................................................................................................. 85 Human Resources............................................................................................................................... 86 Budget Activity Summary ............................................................................................................. 87
Fiscal Agent ..................................................................................................................................................... 88 Program Summary ..................................................................................................................................... 89
Budget Activities Public Broadcasting............................................................................................................................. 90 Budget Activity Summary ............................................................................................................. 92 In Lieu Of Rent .................................................................................................................................... 93 Budget Activity Summary ............................................................................................................. 94 Misc Grants/Studies/Other .................................................................................................................. 95 Budget Activity Summary ............................................................................................................. 96
Federal Funds Summary ............................................................................................................................................... 97
Agency Revenue Summary Fiscal Page ...................................................................................................................... 100 � Designates that this item is a change item

Background
ADMINISTRATION DEPT Agency Profile
State of Minnesota Page 3 2012-13 Biennial Budget Background 2/15/2011
Agency Purpose The Department of Administration (Admin) for over 80 years has provided a diverse portfolio of services, products, and tools that help state government agencies successfully address the needs of citizens.
At a Glance Facilities management services • 4.4 million square feet of space cleaned, repaired,
and maintained • 22 facilities involved in improving energy efficiency • 18 million pieces of mail processed
Procurement services • $2.1 billion in state purchases annually • Approximately 1,500 goods and services contracts
negotiated and managed • Over 900 local government and other eligible
members in Cooperative Purchasing Venture • 46 states are members of Minnesota’s
pharmaceutical and medical supply purchasing cooperative
Government-to-government services • $12 billion in property and 13,400 vehicles insured • 60,000 employees served through workers’
compensation program • 145 rapid improvement events at 18 agencies • $18.4 million in state agency surplus goods sold • 15 small agencies, boards, and commissions
served by SmART • 92 development projects reviewed for
archaeological significance
Construction and space leasing services • 400-plus building projects and $166 million in
capital appropriations under management • Over 3.6 million square feet of non-state space
leased • Provides guidance to ensure state-funded capital
improvements achieve sustainability objectives
Government management services • 17% of state agency motor fuel purchases are E85 • 14% decline in energy consumption in two years at
17 state-owned buildings • 31% lower workers’ compensation costs for state
employees compared to other employers • 98% of labor grievances resolved before arbitration
Citizen services • Second-highest Census 2010 state response rate • 25 cabinet-level agencies report goals, measures,
performance at www.accountability.state.mn.us • 578 Capitol-area public rallies and other events • 789 Minnesota graduates of Partners in
Policymaking leadership training program • 1,146 assistive technology devices loaned to
citizens through five non-profit partnerships
General Fund
Federal Funds
Other Funds
Est. FY 2010-11 Expenditures by Fund
Govern-ment and
Citizen Services
Admin Mgmt
Support
Fiscal Agent
Est. FY 2010-11 Expenditures by Program
Source data is the Minnesota Accounting and Procurement System (MAPS) FY 2010 expenditures and encumbrances as of 8-20-10. FY 2011 is based on current budget as of 8-20-2010.
Source data is the Minnesota Accounting and Procurement System (MAPS) FY 2010 expenditures and encumbrances as of 8-20-10. FY 2011 is based on current budget as of 8-20-2010.
Background
ADMINISTRATION DEPT Agency Profile
State of Minnesota Page 4 2012-13 Biennial Budget Background 2/15/2011
Admin’s mission is to help its customers succeed; its goals are to • provide customers with valuable services, products, advice, and expertise; • be recognized for innovation and efficiency; • reduce costs by working across government; and • offer a safe environment where people thrive and enjoy their work.
Although the agency primarily serves other state agencies, some activities serve many other populations as well. For example, Materials Management Division assists local governments, the education community, and other states to achieve best value in the procurement of goods and services. The Developmental Disabilities Council and the System of Technology to Achieve Results (STAR) Program assist government and the public by working to ensure that persons with disabilities are fully engaged in society. The Minnesota Geospatial Information Office coordinates the development, implementation, support, and use of geospatial information technology among state agencies; between the state and other units of government; and among non-government stakeholders.
Strategies The agency’s primary strategies are to: • Ensure the wise use, allocation, and maintenance of existing structures and make sustainable investments in
new facilities that support the mission and service delivery of the agencies we serve; • Conserve natural and economic resources through the wise use of energy, sustainable design, and
environmentally responsible purchasing; • Offer customers sound policy and organizational advice, based on well-grounded research and experience,
for better state decision-making; • Build and sustain a continuous improvement culture in the delivery of government services; and • Manage the state's procurement process to achieve enterprise-wide economies of scale.
Operations Admin’s operations are categorized as either Government and Citizen Services or Admin Management Services. Government and Citizen Services • The Developmental Disabilities Council seeks to assure that people with developmental disabilities receive
necessary services and support for achieving increased independence, productivity, integration, and inclusion into the community.
• The Environmental Quality Board develops policy and reviews proposed projects that could significantly affect the environment. In addition, staffing and administrative support are provided to the board.
• Fleet and Surplus Services provides fleet management services to state agencies, including long-term vehicle leasing, maintenance support, fuel, and insurance. The division also assists in the acquisition, storage, disposal, and reuse of federal, state, and local surplus government goods.
• Information Policy Analysis Division advances understanding of and compliance with the Minnesota Government Data Practices Act, the Open Meeting Law, and other government-information policy laws.
• Materials Management Division acquires goods and services via methods that ensure the best value for the state’s dollars and that conform to the highest ethical standards of public procurement. The division facilitates and oversees an average of $2.1 billion in state agency purchases annually and administers three statewide and/or national cooperative purchasing programs.
• The Minnesota Geospatial Information Office (MnGeo) provides leadership and coordination for the effective use of geographic information and technology tools and systems across the state enterprise.
• The Office of Enterprise Continuous Improvement provides enterprise-wide expertise and training for improving organizational performance and results in state government agencies.
• The Office of Grants Management is responsible for standardizing, streamlining, and improving statewide grant-making practices and for increasing public access to information about state grant opportunities.
• The Office of State Archaeologist helps manage the state’s archaeological resources, sponsors, conducts, and directs research into prehistoric and historic archaeology, and enforces laws concerning archaeological sites.

Background
ADMINISTRATION DEPT Agency Profile
State of Minnesota Page 5 2012-13 Biennial Budget Background 2/15/2011
• Plant Management Division maintains 4.4 million square feet of space in 22 state-owned facilities, ensures the efficient use of energy in these facilities, works to reduce disposed waste, provides grounds maintenance, mail processing, and delivery services; manages parking services for employees and visitors in the Capitol complex; and operates Minnesota’s Bookstore.
• Real Estate and Construction Services manages state remodeling and construction projects; ensures the sustainable design, construction, and operation of state facilities; and designs, acquires, leases, and disposes of office and other space.
• Risk Management Division operates the state’s insurance program and manages the state workers’ compensation and safety programs.
• The Small Agency Resource Team (SmART) delivers consolidated and streamlined human resources and financial management services to small state agencies, boards, and councils.
• The State Demographer’s Office estimates, forecasts, and investigates changes in the state’s population, analyzes census data, and distributes information. Serves as Minnesota’s liaison to the U.S. Census Bureau.
• The STAR Program helps people of all ages with disabilities gain access to and acquire assistive technology that will maintain, improve, or increase their functional capabilities at home, school, and work.
Admin Management Services • Executive Support provides leadership, communications, legislative, emergency preparedness planning and
support, and data practices compliance services for the agency. • Financial Management and Reporting Division provides financial management support, coordinates
agency internal control activities, and performs fiscal agent functions. • Human Resources Division provides training, safety, and personnel services to employees; administers
labor agreements; and is responsible for agency payroll and employee benefit services.
Budget Trends
$-
$100,000
$200,000
$300,000
$400,000
$500,000
FY 2002-03 FY 2004-05 FY 2006-07 FY 2008-09 FY 2010-11*
Thou
sand
s
Total Expenditures by Fund$ in Thousands
Other
Federal
General
Source data is the Minnesota Accounting and Procurement System (MAPS) expenditures as of 8-20-10 for FY 2002-09. FY 2010 is based on MAPS expenditures and encumbrances as of 8-20-10. FY 2011 is based on current budget as of 8-20-2010 less the lease rate savings reduction.
Contact Department of Administration 50 Sherburne Avenue Saint Paul, Minnesota 55155 Office of the Commissioner: (651) 201-2555
Email: [email protected] Website: http://www.admin.state.mn.us Strategic Plan: http://www.admin.state.mn.us/admin_strategicplan.html Department Results: http://www.accountability.state.mn.us/Departments/Administration/

ADMINISTRATION DEPT Agency Overview
Dollars in Thousands Current Governor Recomm. Biennium FY2010 FY2011 FY2012 FY2013 2012-13
State of Minnesota Page 6 2012-13 Biennial Budget Governor’s Recommendation 2/15/2011
Direct Appropriations by Fund General Current Appropriation 21,638 20,864 20,864 20,864 41,728 Recommended 21,638 20,864 20,105 19,990 40,095 Change 0 (759) (874) (1,633) % Biennial Change from 2010-11 -5.7% Miscellaneous Special Revenue Current Appropriation 250 0 0 0 0 Recommended 250 0 0 0 0 Change 0 0 0 0 % Biennial Change from 2010-11 -100% Arts And Cultural Heritage Current Appropriation 6,500 7,900 7,900 7,900 15,800 Recommended 6,500 7,900 0 0 0 Change 0 (7,900) (7,900) (15,800) % Biennial Change from 2010-11 -100%
Expenditures by Fund Carry Forward General 279 561 10 0 10 Direct Appropriations General 20,428 21,291 20,105 19,990 40,095 Miscellaneous Special Revenue 0 250 0 0 0 Arts And Cultural Heritage 6,305 7,831 0 0 0 Clean Water 0 70 70 0 70 Open Appropriations General 842 2,468 1,942 1,990 3,932 Statutory Appropriations Miscellaneous Special Revenue 37,741 46,881 42,486 43,950 86,436 Federal 1,849 1,810 1,581 1,507 3,088 Federal Stimulus 216 2,751 4,237 0 4,237 Risk Management 10,347 12,482 12,866 13,155 26,021 Gift 67 3 0 0 0 Plant Management 43,753 48,396 46,454 47,758 94,212 Documents And Publications 1,227 1,374 1,362 1,391 2,753 Central Motor Pool 14,729 16,795 17,499 18,344 35,843 Central Stores 2,811 1,017 0 0 0 Materials Distribution 11,318 13,771 14,564 14,942 29,506 Central Mailing 9,102 8,878 9,114 9,411 18,525 Total 161,014 186,629 172,290 172,438 344,728
Expenditures by Category
Total Compensation 33,051 34,609 33,625 34,521 68,146 Other Operating Expenses 97,935 119,253 115,779 114,733 230,512 Capital Outlay & Real Property 1,088 390 85 75 160 Local Assistance 8,923 10,328 2,431 2,429 4,860 Other Financial Transactions 20,017 22,049 20,705 21,015 41,720 Transfers 0 0 (335) (335) (670) Total 161,014 186,629 172,290 172,438 344,728
Expenditures by Program Govt And Citizen Services 142,855 167,033 160,482 160,630 321,112 Administrative Mgmt Services 1,526 1,905 1,718 1,718 3,436 Fiscal Agent 16,633 17,691 10,090 10,090 20,180 Total 161,014 186,629 172,290 172,438 344,728

ADMINISTRATION DEPT Agency Overview
Dollars in Thousands Current Governor Recomm. Biennium FY2010 FY2011 FY2012 FY2013 2012-13
State of Minnesota Page 7 2012-13 Biennial Budget Governor’s Recommendation 2/15/2011
Full-Time Equivalents (FTE) 480.7 489.7 476.6 478.0
ADMINISTRATION DEPT Change Summary
Dollars in Thousands Governor’s Recomm. Biennium FY2011 FY2012 FY2013 2012-13
State of Minnesota Page 8 2012-13 Biennial Budget Governor’s Recommendation 2/15/2011
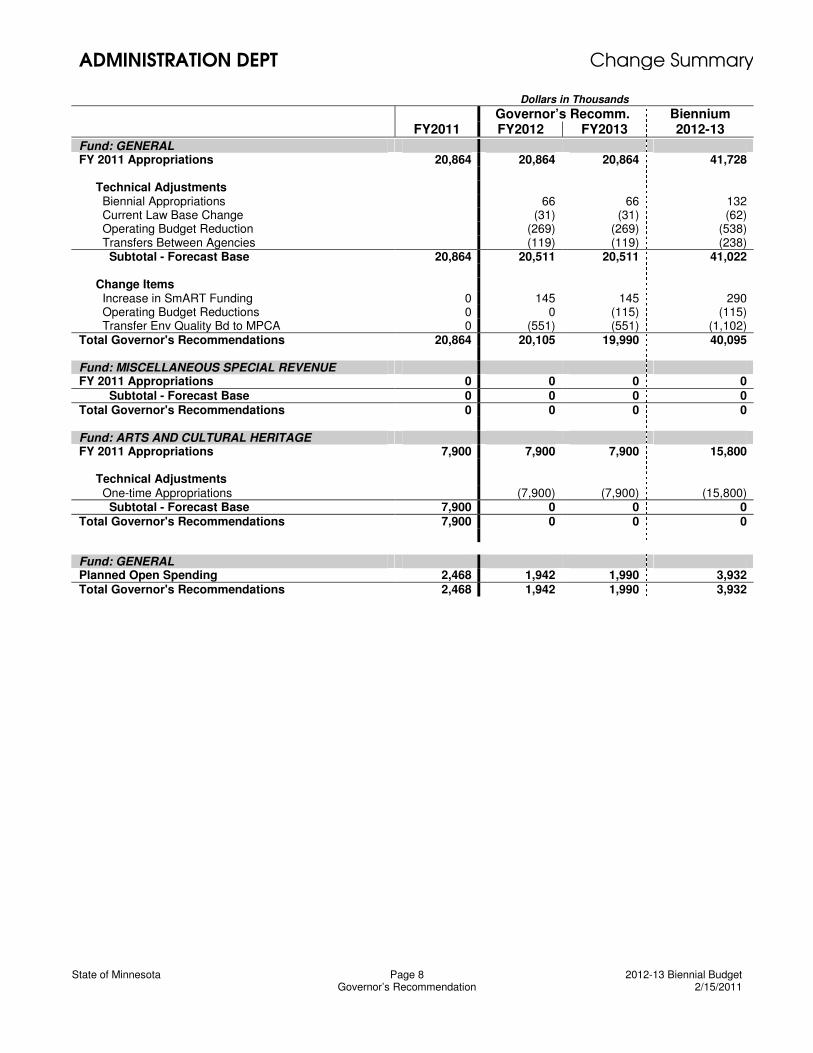
Fund: GENERAL FY 2011 Appropriations 20,864 20,864 20,864 41,728 Technical Adjustments Biennial Appropriations 66 66 132 Current Law Base Change (31) (31) (62) Operating Budget Reduction (269) (269) (538) Transfers Between Agencies (119) (119) (238) Subtotal - Forecast Base 20,864 20,511 20,511 41,022 Change Items Increase in SmART Funding 0 145 145 290 Operating Budget Reductions 0 0 (115) (115) Transfer Env Quality Bd to MPCA 0 (551) (551) (1,102) Total Governor's Recommendations 20,864 20,105 19,990 40,095 Fund: MISCELLANEOUS SPECIAL REVENUE FY 2011 Appropriations 0 0 0 0 Subtotal - Forecast Base 0 0 0 0 Total Governor's Recommendations 0 0 0 0 Fund: ARTS AND CULTURAL HERITAGE FY 2011 Appropriations 7,900 7,900 7,900 15,800 Technical Adjustments One-time Appropriations (7,900) (7,900) (15,800) Subtotal - Forecast Base 7,900 0 0 0 Total Governor's Recommendations 7,900 0 0 0
Fund: GENERAL Planned Open Spending 2,468 1,942 1,990 3,932 Total Governor's Recommendations 2,468 1,942 1,990 3,932

ADMINISTRATION DEPT Change Summary
Dollars in Thousands Governor’s Recomm. Biennium FY2011 FY2012 FY2013 2012-13
State of Minnesota Page 9 2012-13 Biennial Budget Governor’s Recommendation 2/15/2011
Fund: GENERAL Planned Statutory Spending 561 10 0 10 Total Governor's Recommendations 561 10 0 10 Fund: MISCELLANEOUS SPECIAL REVENUE Planned Statutory Spending 46,881 42,486 43,950 86,436 Total Governor's Recommendations 46,881 42,486 43,950 86,436 Fund: FEDERAL Planned Statutory Spending 1,810 1,581 1,507 3,088 Total Governor's Recommendations 1,810 1,581 1,507 3,088 Fund: FEDERAL STIMULUS Planned Statutory Spending 2,751 4,237 0 4,237 Total Governor's Recommendations 2,751 4,237 0 4,237 Fund: RISK MANAGEMENT Planned Statutory Spending 12,482 12,866 13,155 26,021 Total Governor's Recommendations 12,482 12,866 13,155 26,021 Fund: GIFT Planned Statutory Spending 3 0 0 0 Total Governor's Recommendations 3 0 0 0 Fund: PLANT MANAGEMENT Planned Statutory Spending 48,396 46,454 47,758 94,212 Total Governor's Recommendations 48,396 46,454 47,758 94,212 Fund: DOCUMENTS AND PUBLICATIONS Planned Statutory Spending 1,374 1,362 1,391 2,753 Total Governor's Recommendations 1,374 1,362 1,391 2,753 Fund: CENTRAL MOTOR POOL Planned Statutory Spending 16,795 17,499 18,344 35,843 Total Governor's Recommendations 16,795 17,499 18,344 35,843 Fund: CENTRAL STORES Planned Statutory Spending 1,017 0 0 0 Total Governor's Recommendations 1,017 0 0 0 Fund: MATERIALS DISTRIBUTION Planned Statutory Spending 13,771 14,564 14,942 29,506 Total Governor's Recommendations 13,771 14,564 14,942 29,506 Fund: CENTRAL MAILING Planned Statutory Spending 8,878 9,114 9,411 18,525 Total Governor's Recommendations 8,878 9,114 9,411 18,525
ADMINISTRATION DEPT
Change Item: Increase in SmART Funding
State of Minnesota Page 10 2012-13 Biennial Budget Governor’s Recommendation 2/15/2011
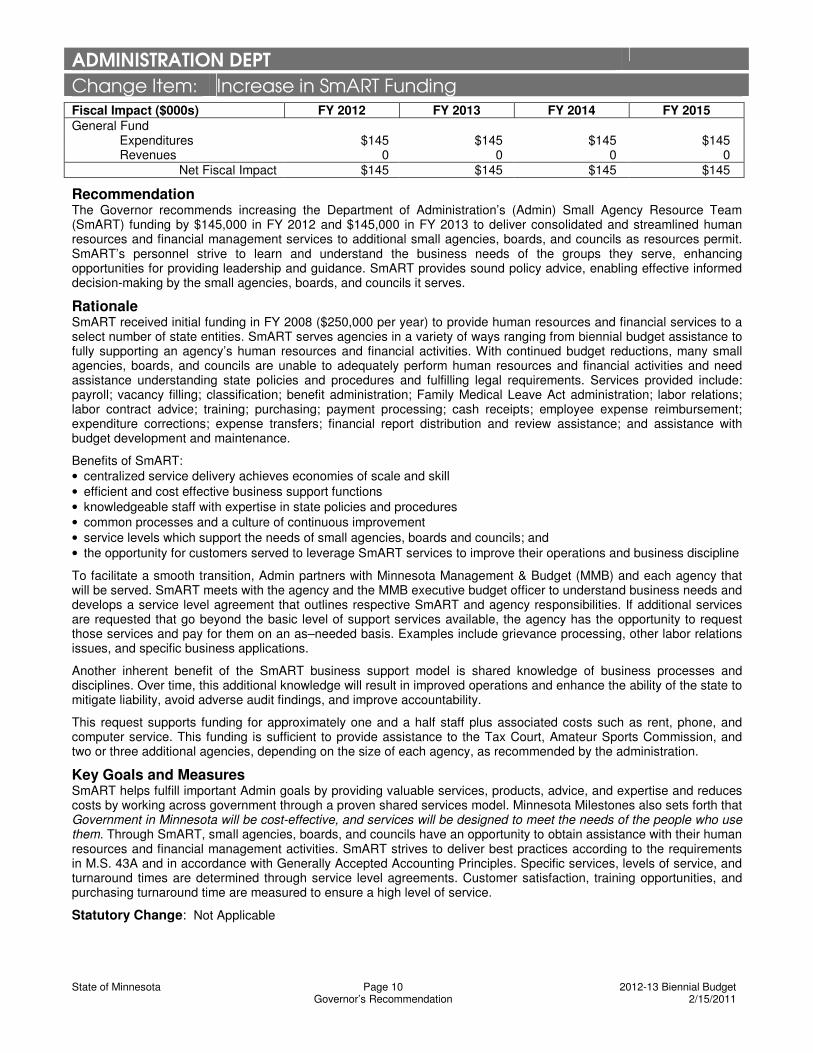
Fiscal Impact ($000s) FY 2012 FY 2013 FY 2014 FY 2015 General Fund Expenditures $145 $145 $145 $145 Revenues 0 0 0 0
Net Fiscal Impact $145 $145 $145 $145
Recommendation The Governor recommends increasing the Department of Administration’s (Admin) Small Agency Resource Team (SmART) funding by $145,000 in FY 2012 and $145,000 in FY 2013 to deliver consolidated and streamlined human resources and financial management services to additional small agencies, boards, and councils as resources permit. SmART’s personnel strive to learn and understand the business needs of the groups they serve, enhancing opportunities for providing leadership and guidance. SmART provides sound policy advice, enabling effective informed decision-making by the small agencies, boards, and councils it serves.
Rationale SmART received initial funding in FY 2008 ($250,000 per year) to provide human resources and financial services to a select number of state entities. SmART serves agencies in a variety of ways ranging from biennial budget assistance to fully supporting an agency’s human resources and financial activities. With continued budget reductions, many small agencies, boards, and councils are unable to adequately perform human resources and financial activities and need assistance understanding state policies and procedures and fulfilling legal requirements. Services provided include: payroll; vacancy filling; classification; benefit administration; Family Medical Leave Act administration; labor relations; labor contract advice; training; purchasing; payment processing; cash receipts; employee expense reimbursement; expenditure corrections; expense transfers; financial report distribution and review assistance; and assistance with budget development and maintenance.
Benefits of SmART: • centralized service delivery achieves economies of scale and skill • efficient and cost effective business support functions • knowledgeable staff with expertise in state policies and procedures • common processes and a culture of continuous improvement • service levels which support the needs of small agencies, boards and councils; and • the opportunity for customers served to leverage SmART services to improve their operations and business discipline
To facilitate a smooth transition, Admin partners with Minnesota Management & Budget (MMB) and each agency that will be served. SmART meets with the agency and the MMB executive budget officer to understand business needs and develops a service level agreement that outlines respective SmART and agency responsibilities. If additional services are requested that go beyond the basic level of support services available, the agency has the opportunity to request those services and pay for them on an as–needed basis. Examples include grievance processing, other labor relations issues, and specific business applications.
Another inherent benefit of the SmART business support model is shared knowledge of business processes and disciplines. Over time, this additional knowledge will result in improved operations and enhance the ability of the state to mitigate liability, avoid adverse audit findings, and improve accountability.
This request supports funding for approximately one and a half staff plus associated costs such as rent, phone, and computer service. This funding is sufficient to provide assistance to the Tax Court, Amateur Sports Commission, and two or three additional agencies, depending on the size of each agency, as recommended by the administration.
Key Goals and Measures SmART helps fulfill important Admin goals by providing valuable services, products, advice, and expertise and reduces costs by working across government through a proven shared services model. Minnesota Milestones also sets forth that Government in Minnesota will be cost-effective, and services will be designed to meet the needs of the people who use them. Through SmART, small agencies, boards, and councils have an opportunity to obtain assistance with their human resources and financial management activities. SmART strives to deliver best practices according to the requirements in M.S. 43A and in accordance with Generally Accepted Accounting Principles. Specific services, levels of service, and turnaround times are determined through service level agreements. Customer satisfaction, training opportunities, and purchasing turnaround time are measured to ensure a high level of service.
Statutory Change: Not Applicable
ADMINISTRATION DEPT
Change Item: Transfer Environmental Quality Board to MPCA
State of Minnesota Page 11 2012-13 Biennial Budget Governor’s Recommendation 2/15/2011
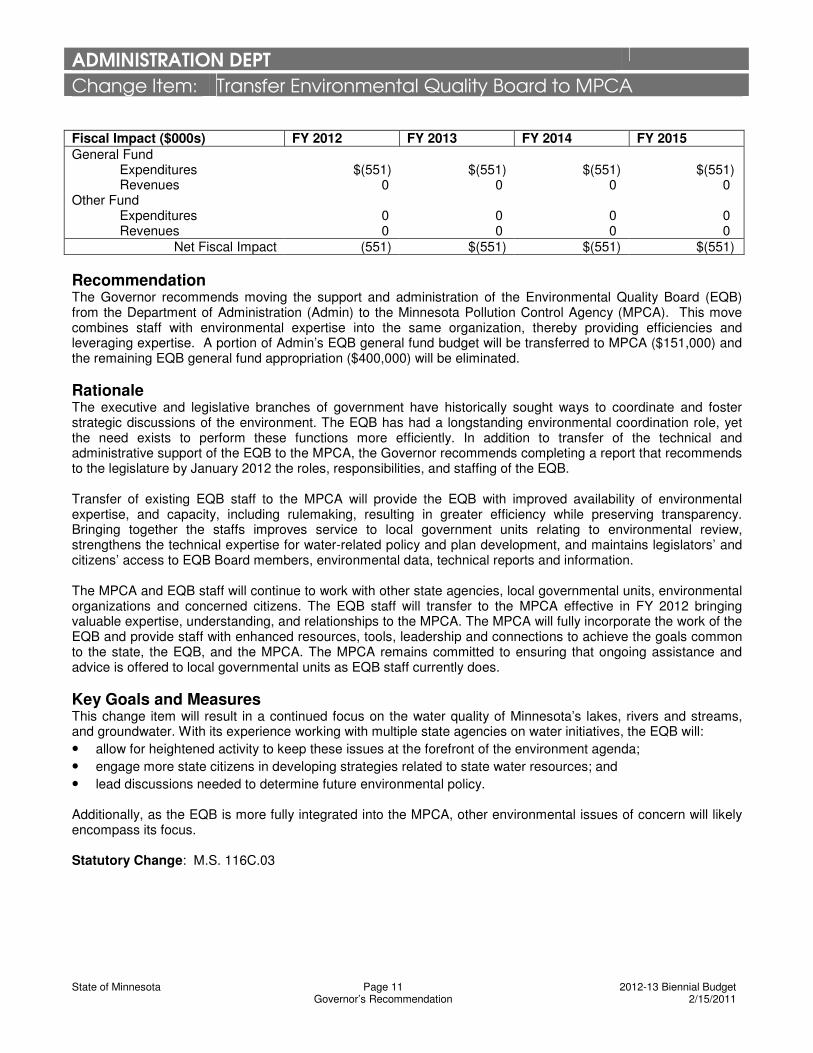
Fiscal Impact ($000s) FY 2012 FY 2013 FY 2014 FY 2015 General Fund Expenditures $(551) $(551) $(551) $(551) Revenues 0 0 0 0 Other Fund Expenditures 0 0 0 0 Revenues 0 0 0 0
Net Fiscal Impact (551) $(551) $(551) $(551)
Recommendation The Governor recommends moving the support and administration of the Environmental Quality Board (EQB) from the Department of Administration (Admin) to the Minnesota Pollution Control Agency (MPCA). This move combines staff with environmental expertise into the same organization, thereby providing efficiencies and leveraging expertise. A portion of Admin’s EQB general fund budget will be transferred to MPCA ($151,000) and the remaining EQB general fund appropriation ($400,000) will be eliminated. Rationale The executive and legislative branches of government have historically sought ways to coordinate and foster strategic discussions of the environment. The EQB has had a longstanding environmental coordination role, yet the need exists to perform these functions more efficiently. In addition to transfer of the technical and administrative support of the EQB to the MPCA, the Governor recommends completing a report that recommends to the legislature by January 2012 the roles, responsibilities, and staffing of the EQB. Transfer of existing EQB staff to the MPCA will provide the EQB with improved availability of environmental expertise, and capacity, including rulemaking, resulting in greater efficiency while preserving transparency. Bringing together the staffs improves service to local government units relating to environmental review, strengthens the technical expertise for water-related policy and plan development, and maintains legislators’ and citizens’ access to EQB Board members, environmental data, technical reports and information. The MPCA and EQB staff will continue to work with other state agencies, local governmental units, environmental organizations and concerned citizens. The EQB staff will transfer to the MPCA effective in FY 2012 bringing valuable expertise, understanding, and relationships to the MPCA. The MPCA will fully incorporate the work of the EQB and provide staff with enhanced resources, tools, leadership and connections to achieve the goals common to the state, the EQB, and the MPCA. The MPCA remains committed to ensuring that ongoing assistance and advice is offered to local governmental units as EQB staff currently does. Key Goals and Measures This change item will result in a continued focus on the water quality of Minnesota’s lakes, rivers and streams, and groundwater. With its experience working with multiple state agencies on water initiatives, the EQB will: • allow for heightened activity to keep these issues at the forefront of the environment agenda; • engage more state citizens in developing strategies related to state water resources; and • lead discussions needed to determine future environmental policy. Additionally, as the EQB is more fully integrated into the MPCA, other environmental issues of concern will likely encompass its focus. Statutory Change: M.S. 116C.03
ADMINISTRATION DEPT
Change Item: Operating Budget Reductions
State of Minnesota Page 12 2012-13 Biennial Budget Governor’s Recommendation 2/15/2011
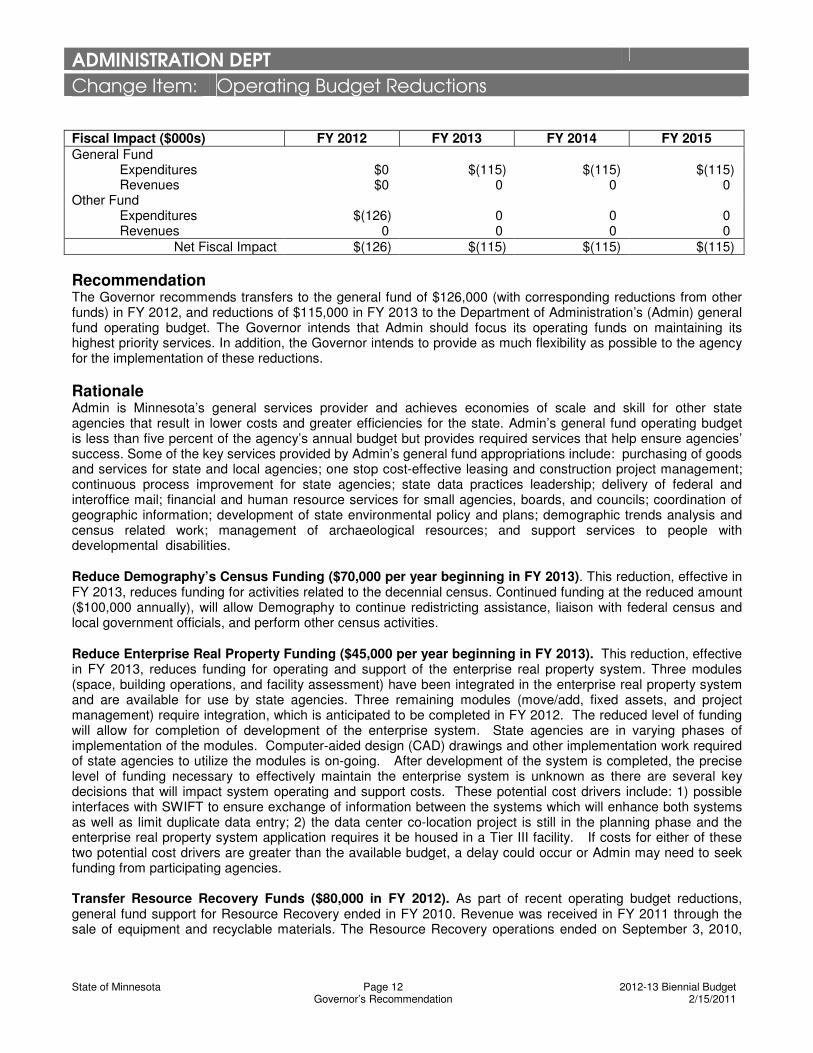
Fiscal Impact ($000s) FY 2012 FY 2013 FY 2014 FY 2015 General Fund Expenditures $0 $(115) $(115) $(115) Revenues $0 0 0 0 Other Fund Expenditures $(126) 0 0 0 Revenues 0 0 0 0
Net Fiscal Impact $(126) $(115) $(115) $(115)
Recommendation The Governor recommends transfers to the general fund of $126,000 (with corresponding reductions from other funds) in FY 2012, and reductions of $115,000 in FY 2013 to the Department of Administration’s (Admin) general fund operating budget. The Governor intends that Admin should focus its operating funds on maintaining its highest priority services. In addition, the Governor intends to provide as much flexibility as possible to the agency for the implementation of these reductions.
Rationale Admin is Minnesota’s general services provider and achieves economies of scale and skill for other state agencies that result in lower costs and greater efficiencies for the state. Admin’s general fund operating budget is less than five percent of the agency’s annual budget but provides required services that help ensure agencies’ success. Some of the key services provided by Admin’s general fund appropriations include: purchasing of goods and services for state and local agencies; one stop cost-effective leasing and construction project management; continuous process improvement for state agencies; state data practices leadership; delivery of federal and interoffice mail; financial and human resource services for small agencies, boards, and councils; coordination of geographic information; development of state environmental policy and plans; demographic trends analysis and census related work; management of archaeological resources; and support services to people with developmental disabilities.
Reduce Demography’s Census Funding ($70,000 per year beginning in FY 2013). This reduction, effective in FY 2013, reduces funding for activities related to the decennial census. Continued funding at the reduced amount ($100,000 annually), will allow Demography to continue redistricting assistance, liaison with federal census and local government officials, and perform other census activities.
Reduce Enterprise Real Property Funding ($45,000 per year beginning in FY 2013). This reduction, effective in FY 2013, reduces funding for operating and support of the enterprise real property system. Three modules (space, building operations, and facility assessment) have been integrated in the enterprise real property system and are available for use by state agencies. Three remaining modules (move/add, fixed assets, and project management) require integration, which is anticipated to be completed in FY 2012. The reduced level of funding will allow for completion of development of the enterprise system. State agencies are in varying phases of implementation of the modules. Computer-aided design (CAD) drawings and other implementation work required of state agencies to utilize the modules is on-going. After development of the system is completed, the precise level of funding necessary to effectively maintain the enterprise system is unknown as there are several key decisions that will impact system operating and support costs. These potential cost drivers include: 1) possible interfaces with SWIFT to ensure exchange of information between the systems which will enhance both systems as well as limit duplicate data entry; 2) the data center co-location project is still in the planning phase and the enterprise real property system application requires it be housed in a Tier III facility. If costs for either of these two potential cost drivers are greater than the available budget, a delay could occur or Admin may need to seek funding from participating agencies. Transfer Resource Recovery Funds ($80,000 in FY 2012). As part of recent operating budget reductions, general fund support for Resource Recovery ended in FY 2010. Revenue was received in FY 2011 through the sale of equipment and recyclable materials. The Resource Recovery operations ended on September 3, 2010,
ADMINISTRATION DEPT
Change Item: Operating Budget Reductions
State of Minnesota Page 13 2012-13 Biennial Budget Governor’s Recommendation 2/15/2011
and remaining funds are no longer needed. This will transfer funds that were not used for recycling operations between July 1, 2010, and the close of operations.
Transfer Funding from Office Supply Connections (OSC) ($39,000 in FY 2012). The office supply function transitioned to a new service model in which customers purchase directly from a contract vendor and a private, non-profit day training and habilitation provider licensed by the Department of Human Services. The new model includes cost savings for customers; easy-to-use catalog ordering and online tools for managing office supply purchases more efficiently; direct delivery; and increased employment opportunities for persons with disabilities. This will transfer remaining funds to the general fund.
Reduce Savings Monitoring System (SMS) ($7,000 in FY 2012). The SMS monitored energy savings from interest free loans issued to implement energy efficiency improvements under M.S. 16B.32 subd. 2. State agencies that participated in the program repaid the loans based on energy savings over ten years or less. Funds were collected from the state agencies to pay the vendor that monitored the SMS. The current program is complete and other funding options are available to state agencies for financing energy savings. This will transfer remaining funds to the general fund.
Statutory Change: Not Applicable

ADMINISTRATION DEPT
Change Item: Enterprise Real Property Contributions
State of Minnesota Page 14 2012-13 Biennial Budget Governor’s Recommendation 2/15/2011
Fiscal Impact ($000s) FY 2011 FY 2012 FY 2013 FY 2014 FY 2015 General Fund Expenditures $0 $0 $0 $0 $0 Revenues 0 0 0 0 0Other Fund Expenditures (399) 229 170 0 0 Revenues 0 0 0 0 0
Net Fiscal Impact $(399) $229 $170 $0 $0
Recommendation The Governor recommends that Minnesota Laws of 2009, Chapter 101, Article 2, Section 106 be amended to provide for the use of funds through the FY 2012-13 biennium. The law sets forth that the commissioner of administration shall determine the amount to be contributed by each executive agency to maintain the enterprise real property technology system for the FY 2010-11 biennium. The 2009 authorization was for $399,000. Continued use of these funds, combined with additional funding from state agencies, will ensure achievement of the objective to complete computer-aided design (CAD) drawings for state buildings by no later than the end of FY 2013.
Rationale Continued use of the available funds through the next biennium will allow the completion of CAD drawings for executive branch agencies participating in the enterprise real property project. This will maximize utilization of the enterprise system and provide agencies with information needed to manage their facilities.
Completed CAD drawings enable facility managers the ability to obtain accurate space calculations and allocations. Users can easily query the database for information such as area by agency, site, building, floor, and/or room. Queries also provide reports on vacancies, useable to gross square feet ratios, equipment maintenance and other space utilization information.
The enterprise real property technology system includes modules for: • space management, • building operations, • move management,
• asset management, • facility condition assessment, and • project management.
CAD drawings are the foundation upon which the database is built. Facility management effectiveness is enhanced through the availability of CAD drawings and is a building block to a comprehensive enterprise system. If drawings are not completed and cataloged to enterprise standards, there is no way to assure that reports generated from the system are complete or accurate, and agencies without drawing data to work from will not be able to take advantage of some of the advanced modules such as building operations and asset management which offer the greatest opportunity for savings.
Key Goals and Measures Minnesota Milestones sets forth that Government in Minnesota will be cost-effective, and services will be designed to meet the needs of the people who use them. Maintaining an enterprise real property system for the state’s real property is most cost-effective because it promotes more efficient use of capital, shifts the paradigm from reaction to preventative action, uses state-wide standards, leverages purchasing power, controls inventory, enhances productivity from automating manual procedures, and allows for future integration with energy management, emergency preparedness, and geographic information systems.
Approximately seven million square feet of CAD drawings need to be completed out of a total of 28.3 million square feet. The objective is to complete CAD drawings statewide for all state owned facilities by the end of FY 2013, subject to the availability of funding for this purpose. The performance measure is to complete four million square feet by the end of FY 2012 and three million square feet by the end of FY 2013. In addition to this request, it is anticipated that some agencies will be dedicating a portion of their operating budget to complete CAD drawings.
Technology Funding Detail • This is not a new funding proposal but will enhance the previously funded enterprise real property system.
Statutory Change: Laws of 2009, Chapter 101, Article 2, Section 106

ADMINISTRATION DEPT Program: GOVT AND CITIZEN SERVICES Narrative
State of Minnesota Page 15 2010-11 Biennial Budget Background 2/15/2011
Program Description Government and Citizen Services provides a broad range of services to state agencies, local units of government, and citizens of Minnesota. Each activity is focused on providing services, products, advice, and expertise that help customers succeed.
Budget Activities This program includes the following budget activities • Developmental Disabilities Council • Environmental Quality Board • Fleet and Surplus Services • Information Policy Analysis • Materials Management Division • Minnesota Geospatial Information Office • Office of Enterprise Continuous Improvement • Office of Grants Management • Office of State Archaeologist • Plant Management • Real Estate and Construction Services • Risk Management • SmART (Small Agency Resource Team) • STAR (System of Technology to Achieve Results) • State Demographer
Further detail on each of these budget activities is included in subsequent pages of this budget document.

ADMINISTRATION DEPT Program: GOVT AND CITIZEN SERVICES Program Summary
Dollars in Thousands
Current Governor Recomm. Biennium FY2010 FY2011 FY2012 FY2013 2012-13
State of Minnesota Page 16 2012-13 Biennial Budget Background 2/15/2011
Direct Appropriations by Fund General Current Appropriation 9,509 8,884 8,884 8,884 17,768 Technical Adjustments Current Law Base Change (31) (31) (62) Operating Budget Reduction (31) (31) (62) Transfers Between Agencies (119) (119) (238) Subtotal - Forecast Base 9,509 8,884 8,703 8,703 17,406 Governor's Recommendations Increase in SmART Funding 0 145 145 290 Operating Budget Reductions 0 0 (115) (115) Transfer Env Quality Bd to MPCA 0 (551) (551) (1,102) Total 9,509 8,884 8,297 8,182 16,479 Miscellaneous Special Revenue Current Appropriation 250 0 0 0 0 Subtotal - Forecast Base 250 0 0 0 0 Total 250 0 0 0 0
Expenditures by Fund Carry Forward General 279 540 10 0 10 Direct Appropriations General 8,564 9,429 8,297 8,182 16,479 Miscellaneous Special Revenue 0 250 0 0 0 Arts And Cultural Heritage 23 121 0 0 0 Clean Water 0 70 70 0 70 Open Appropriations General 842 2,468 1,942 1,990 3,932 Statutory Appropriations Miscellaneous Special Revenue 37,741 46,881 42,486 43,950 86,436 Federal 1,849 1,810 1,581 1,507 3,088 Federal Stimulus 216 2,751 4,237 0 4,237 Risk Management 10,347 12,482 12,866 13,155 26,021 Gift 54 0 0 0 0 Plant Management 43,753 48,396 46,454 47,758 94,212 Documents And Publications 1,227 1,374 1,362 1,391 2,753 Central Motor Pool 14,729 16,795 17,499 18,344 35,843 Central Stores 2,811 1,017 0 0 0 Materials Distribution 11,318 13,771 14,564 14,942 29,506 Central Mailing 9,102 8,878 9,114 9,411 18,525 Total 142,855 167,033 160,482 160,630 321,112
Expenditures by Category
Total Compensation 31,714 33,255 32,280 33,169 65,449 Other Operating Expenses 89,410 110,587 107,248 106,209 213,457 Capital Outlay & Real Property 1,088 390 85 75 160 Local Assistance 626 752 499 497 996 Other Financial Transactions 20,017 22,049 20,705 21,015 41,720 Transfers 0 0 (335) (335) (670) Total 142,855 167,033 160,482 160,630 321,112

ADMINISTRATION DEPT Program: GOVT AND CITIZEN SERVICES Program Summary
Dollars in Thousands
Current Governor Recomm. Biennium FY2010 FY2011 FY2012 FY2013 2012-13
State of Minnesota Page 17 2012-13 Biennial Budget Background 2/15/2011
Expenditures by Activity Developmental Disability Counc 1,082 1,375 1,099 1,099 2,198 Environmental Quality Board 520 584 0 0 0 Fleet And Surplus Services 15,822 17,998 18,889 19,805 38,694 Information Policy Analysis 470 478 473 473 946 Materials Management 14,964 15,741 15,116 15,423 30,539 Mn Geospatial Info Office 1,739 2,727 1,674 1,540 3,214 Office Of Enterprise Cont Impr 133 138 135 135 270 Office Of Grants Management 97 199 125 125 250 Office Of State Archaeologist 204 211 206 206 412 Plant Management 60,731 71,679 65,614 67,332 132,946 Real Estate And Constr Service 4,146 7,967 8,091 3,750 11,841 Risk Management 41,572 46,539 47,592 49,344 96,936 Smart 207 293 393 393 786 Star 501 484 482 482 964 State Demographer 667 620 593 523 1,116 Total 142,855 167,033 160,482 160,630 321,112
Full-Time Equivalents (FTE) 461.8 470.5 457.9 459.6

ADMINISTRATION DEPT
Program: GOVT AND CITIZEN SERVICES Activity: DEVELOPMENTAL DISABILITY COUNC Narrative
State of Minnesota Page 18 2012-13 Biennial Budget Background 2/15/2011
Activity Description The Governor’s Council on Developmental Disabilities (GCDD), authorized under the Federal Developmental Disabilities Assistance and Bill of Rights Act (DD Act; P.L. 106-402), works to assure that people with developmental disabilities and their families receive the necessary support/services to increase their independence, productivity, self-determination, integration, and inclusion in the community (IPSII). The governor appoints members; 60% are people with disabilities or family members of people with disabilities.
Population Served The GCDD’s primary customer group is comprised of people with developmental disabilities who make up about 1.13% of the state’s population, or about 59,500 individuals, and their families. A developmental disability is a significant lifelong disability.
Services Provided The GCDD is not a direct service provider. The GCDD’s business is information, education, and training for knowledge building, skills development, and attitude changes that lead to measureable IPSII results. The GCDD is involved in several collaborative activities such as MNDisability.Gov and making state e-government services accessible to and usable by people with disabilities. The GCDD also works on public policy issues and serves on interagency committees. At least 70% of the federal funds that GCDD receives each year are awarded as grants. Leadership Training - Partners in Policymaking • Partners Program: Competency/value based leadership training program for adults with disabilities and parents of
young children with developmental disabilities; teaches how to develop positive partnerships with elected officials for systems change. The GCDD also funds Partners in Policymaking graduate workshops, evaluation studies, and cultural outreach programs.
Employment and Document Imaging • Legislation passed by the Minnesota Legislature calls on state government to promote the employment of people
with developmental disabilities in scanning government records. • Information and training sessions about the concept of document imaging, the capabilities of individuals with
developmental disabilities to work in scanning/document imaging positions, and the scanning technology available are arranged with businesses and day programs throughout Minnesota.
Communications and Training • Education/resource materials on best practices are available to citizens through print and web-based formats.
GCDD and Partners in Policymaking websites are maintained and new products and services are added on an ongoing basis. The Partners curriculum was converted to e-learning modules and updates to each of the five courses are being made.
Customer Focus and Quality Improvement • Customer Research: Annual research studies are conducted on issues including the impact of the Americans with
Disabilities Act on Minnesota businesses, use and benefits of information technologies on Minnesota households, and attitudinal changes of the general population about people with developmental disabilities during the past 45 years.
• Application of Malcolm Baldrige Quality Management Framework: Increases knowledge, understanding, and application of the Baldrige criteria to GCDD’s business.
Key Activity Goals & Measures Minnesota Milestones Statewide Goals - All people will be welcomed, respected, and able to participate fully in Minnesota’s communities and economy (http://server.admin.state.mn.us/mm/goal.html)Goal 1) Employment/Document Imaging: This topic addresses Minnesota Milestones indicator 32: Employment of People with Disabilities. Over 600 people with developmental disabilities are working in document imaging jobs in public and private sector businesses that are using current technology to conserve space and preserve business records. Direct employment of people with developmental disabilities in a broad range of businesses, with pay at least at the minimum wage level, is a priority. NOTE: Employment can be full time, part time, intermittent, or temporary.
Activity at a Glance • More than 16,000 Partners in Policymaking
program graduates nationally/internationally since 1987; including 789 graduates from Minnesota
• 738,787 publications distributed (print and downloads)
• A total of 273,212 unique website visitors • More than 600 people with developmental
disabilities employed in the area of digital imaging in public/private sector businesses
• 40 students learned document imaging skills • 800 self advocates attended 49 training
sessions on housing, transportation, employment, and leadership

ADMINISTRATION DEPT
Program: GOVT AND CITIZEN SERVICES Activity: DEVELOPMENTAL DISABILITY COUNC Narrative
State of Minnesota Page 19 2012-13 Biennial Budget Background 2/15/2011
Goal 2) Information/Education/Training: Over 500,000 GCDD publications and documents will be distributed. Performance measures for the next fiscal year are established by the GCDD, identified in Requests for Proposals, and contained in GCDD’s contracts. Performance goals are tracked for each fiscal year for each supplier, and over time through dashboards, IPSII measures, customer satisfaction, cycle time for reporting, progress meetings that correspond with quarterly reporting deadlines, mid-year performance reviews, and final reports.
Activity Funding The GCDD’s annual allocation is part of a congressional appropriation to the U.S. Department of Health and Human Services. The federal fiscal year (FFY) 2010 allocation was $1,025,295. Level funding is anticipated for FFY 2011. A required 25% non-federal match is acquired through a state General Fund appropriation and in-kind contributions from grantees.
Contact Director Phone: (651) 296-9964 MN Relay (800) 627-3529 or 711 Web sites: http://www.mnddc.org http://www.partnersinpolicymaking.com http://www.mncdd.org
050
100150200250300350400450500
2002 2003 2004 2005 2006 2007 2008 2009
Thou
sand
s
Print Publications and Downloads
50
227
489
607
0
100
200
300
400
500
600
700
2006 2007 2008 2009
Number of People with DevelpmentalDisabilities Employed in Digital Imaging

ADMINISTRATION DEPT Program: GOVT AND CITIZEN SERVICES Activity: DEVELOPMENTAL DISABILITY COUNC Budget Activity Summary
Dollars in Thousands
Current Governor’s Recomm. Biennium FY2010 FY2011 FY2012 FY2013 2012-13
State of Minnesota Page 20 2012-13 Biennial Budget Background 2/15/2011
Direct Appropriations by Fund General Current Appropriation 201 193 193 193 386 Technical Adjustments Transfers Between Agencies (119) (119) (238) Subtotal - Forecast Base 201 193 74 74 148 Total 201 193 74 74 148
Expenditures by Fund Direct Appropriations General 74 74 74 74 148 Statutory Appropriations Miscellaneous Special Revenue 0 210 0 0 0 Federal 949 950 1,025 1,025 2,050 Federal Stimulus 59 141 0 0 0 Total 1,082 1,375 1,099 1,099 2,198
Expenditures by Category
Total Compensation 246 214 289 289 578 Other Operating Expenses 338 524 415 415 830 Local Assistance 498 637 395 395 790 Total 1,082 1,375 1,099 1,099 2,198
Full-Time Equivalents (FTE) 3.5 3.0 3.9 3.9

ADMINISTRATION DEPT
Program: GOVT AND CITIZEN SERVICES Activity: ENVIRONMENTAL QUALITY BOARD Narrative
State of Minnesota Page 21 2012-13 Biennial Budget Background 2/15/2011
Activity Description The Environmental Quality Board (EQB) draws together the Governor’s Office, five citizens, and the heads of nine state agencies to coordinate the development of environmental policy and plans, and ensure adequate review of proposed projects that would significantly influence Minnesota’s environment and development. M.S. Chapters 103A, 103B, 116C, and 116D provide for the Environmental Quality Board to: • Administer the statewide environmental review program • Coordinate state environmental policies and programs • Develop the state water plan and water policy reports • Study environmental issues • Convene environmental congresses • Advise the governor and the legislature
EQB staff is a unit within the Office of Geographic and Demographic Analysis.
Population Served EQB serves executive branch agencies, the legislature, and Minnesota’s citizens, focusing on those involved with or affected by development, and those interested in coordinated environmental policy and sustainable management of the state’s natural resources.
Services Provided EQB provides a public forum for discussing state environmental policies and decisions. EQB writes rules and provides guidance about the statewide environmental review program (M.S. 116D.04-.06), including preparation of environmental impact statements, environmental assessment worksheets, alternative urban area wide reviews, and generic environmental impact statements. The board coordinates state water planning activities and develops the state water plan and water policy reports for the governor and legislature (M.S. 103A.204, 103A.43, and 103B.151). The board also has authority concerning the release of genetically modified organisms (M.S. 116C.91-.98), the designation of state critical areas (M.S. Chapter 116G), the study of interagency environmental issues (M.S. 116C.04), the convening of environmental congresses to exchange information and ideas about environmental improvement (M.S. 116C.04), and development of an energy and environment strategy report (M.S. 116D.10-11).
Historical Perspective The EQB was established in 1973 as the state’s environmental coordinating body. Since then, it has undertaken a broad range of environmental studies, including Mississippi River barge fleeting, animal agriculture, forestry, urban development, copper-nickel mining, genetically modified organisms, land use management, water management, and sustainable development. Major changes to board programs occurred in 1980 (decentralization of environmental review), 1983 (addition of water planning duties), 1987 (environmental review and siting requirements for large natural gas and petroleum product pipelines), 1991 (energy and environment strategy reporting), 1995 (siting of large wind energy conversion systems), and 2005 (transfer of energy facilities siting to the Department of Commerce and the Public Utilities Commission).
Activity at a Glance
In FY 2009 and 2010 • Rules revised to streamline and clarify
environmental review in Minnesota • Electronically published the EQB Monitor bi-
weekly • Addressed 1,525 calls for technical assistance • Processed 22 citizen petitions, 180
environmental assessment worksheets, 27 alternative urban area wide reviews, and 36 environmental impact statements
• Adopted water resources report, addressing sustainability of state water supplies
• Developed an innovative Geographic Information System (GIS) web tool to help prospective water users evaluate impacts
• Contributed to four state reports on water sustainability
• Initiated collaborations to streamline state mandates for local land and water planning and assist local governments
• Convened a committee to identify future steps for fulfilling the board’s environmental policy planning and coordination mandates.
ADMINISTRATION DEPT
Program: GOVT AND CITIZEN SERVICES Activity: ENVIRONMENTAL QUALITY BOARD Narrative
State of Minnesota Page 22 2012-13 Biennial Budget Background 2/15/2011
Key Activity Goals & Measures Minnesota Milestones Statewide Goals – Supports Environmental Cluster (http://server.admin.state.mn.us/mm/goal.html)
EQB’s broad focus on coordinating state involvement in environment and development activities supports the environmental cluster of Minnesota Milestones goals—Minnesotans will conserve natural resources to give future generations a healthy environment and a strong economy; improve the quality of the air, water, and earth; restore and maintain healthy ecosystems that support diverse plants and wildlife; and have opportunities to enjoy the state's natural resources.
Goal 1) Improve the efficiency and effectiveness of environmental review for project proposers, responsible governmental units, and the general public.
Measure: Adoption of improved environmental review forms and guidance. The 2010 legislature mandated the Department of Natural Resources (DNR), Minnesota Pollution Control Agency (MPCA), and EQB periodically examine environmental review and customize forms used for certain types of projects. EQB staff and member agencies have initiated a comprehensive review of forms and guidance typically used in environmental review with the objective of improving efficiency and effectiveness.
Goal 2) Move toward sustainable water management.
Measure: Adoption and initial implementation of decadal state water plan in 2010. Together with the University of Minnesota’s Water Sustainability Framework and Clean Water Council recommendations, this plan will articulate state agency directions for the coming decade.
Measure: Substantial progress toward development of a decision support system for the Minnesota River Basin. The EQB is coordinating nonfederal partners and co-leading a state-US Army Corps of Engineers project to identify opportunities to restore ecosystem and economic vitality and water quality in the basin.
Goal 3) Streamline mandates for local land and water planning and integrate assistance to local governments.
Measure: Implementation of measures that streamline local government implementation of state land and water planning requirements, provide assistance and foster local-state partnerships. The EQB has convened interagency working groups to study and recommend improvements.
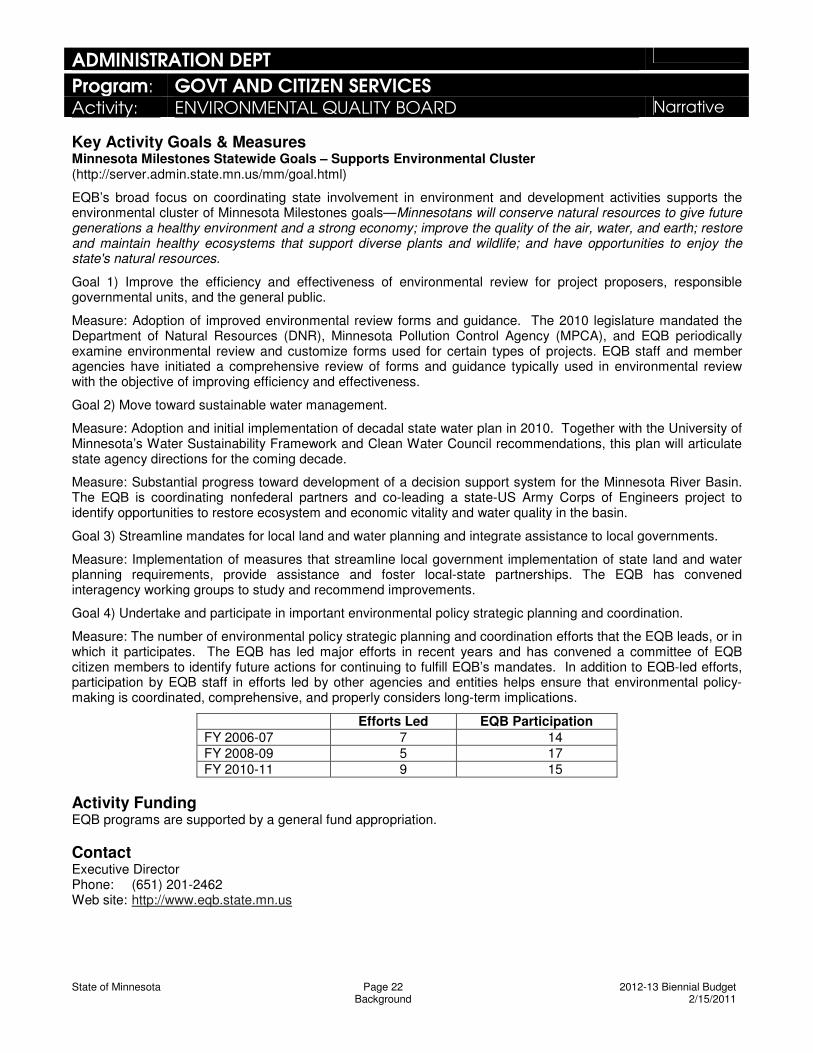
Goal 4) Undertake and participate in important environmental policy strategic planning and coordination.
Measure: The number of environmental policy strategic planning and coordination efforts that the EQB leads, or in which it participates. The EQB has led major efforts in recent years and has convened a committee of EQB citizen members to identify future actions for continuing to fulfill EQB’s mandates. In addition to EQB-led efforts, participation by EQB staff in efforts led by other agencies and entities helps ensure that environmental policy-making is coordinated, comprehensive, and properly considers long-term implications.
Efforts Led EQB Participation FY 2006-07 7 14 FY 2008-09 5 17 FY 2010-11 9 15
Activity Funding EQB programs are supported by a general fund appropriation.
Contact Executive Director Phone: (651) 201-2462 Web site: http://www.eqb.state.mn.us

ADMINISTRATION DEPT Program: GOVT AND CITIZEN SERVICES Activity: ENVIRONMENTAL QUALITY BOARD Budget Activity Summary
Dollars in Thousands
Current Governor’s Recomm. Biennium FY2010 FY2011 FY2012 FY2013 2012-13
State of Minnesota Page 23 2012-13 Biennial Budget Background 2/15/2011
D irect A p p ro p ri at io n s b y F u n d
Cu r r en t Ap p ro p r ia t i on 0 0 0 0 0
T ec h n i ca l Ad j u s t m e n ts
Op e ra t i ng Bu dg e t Red uc t io n ( 2 ) ( 2 ) ( 4 )
Su b t ot a l - F o r ec as t Bas e 0 0 ( 2 ) ( 2 ) ( 4 )
Expenditures by Fund
Direct Appropriations
General 520 584
0 0 0 Total 520 584
0 0 0
Expenditures by Category
Total Compensation 457 482
0 0 0 Other Operating Expenses 63 102
0 0 0 Total 520 584
0 0 0 Full-Time Equivalents (FTE) 4.8 4.9
0.0 0.0

ADMINISTRATION DEPT
Program: GOVT AND CITIZEN SERVICES Activity: FLEET AND SURPLUS SERVICES Narrative
State of Minnesota Page 24 2012-13 Biennial Budget Background 2/15/2011
Activity Description The Fleet and Surplus Services Division (FSS) supplies vehicles to state agencies and political subdivisions for use in the conduct of official business. Support services including maintenance, fuel, and insurance are also provided. FSS assists in the disposal and reuse of state, federal, and political subdivision surplus property using methods that ensure the best value is returned to the state.
Population Served Fleet Services provides vehicles to all branches of state government and to political subdivisions including cities, counties, and school districts. Surplus Services serves state agencies, political subdivisions, various nonprofit organizations, and the public.
Services Provided The division provides a mix of direct service and compliance activities: • operates a long-term rental program providing a wide variety of passenger vehicles and light trucks • assists state agencies in meeting the state and federal requirements for alternative fuel vehicle acquisition • assists agencies in decreasing dependence on petroleum fuels • monitors and adjusts leases to help customers realize best value from fleet equipment • manages the disposal of state surplus property • provides assistance in the re-use of government surplus items • provides storage and handling services for state agencies
Historical Perspective Fleet Services was established in 1961 to help state agencies effectively meet transportation needs. The program has evolved over the years to address more efficiently the changing needs of state government. Vehicle life cycles are monitored closely and tailored to best meet the work requirements of customers.
The Federal Surplus Property (FSP) Program was created and operates under the Federal Property and Administrative Services Act of 1949, as amended. Authority was established by an act of the state legislature, first enacted as Minnesota Session Laws of 1957, Chapter 808. The FSP Program and State Surplus Property (SSP) Program were reorganized under one division in 1986 to maximize resources.
The Surplus Services unit merged with the Fleet Services unit in FY 2008 to become a single division within the Department of Administration (Admin). This co-location has provided opportunities to streamline operations and share support services.
Key Activity Goals & Measures Admin Goal – To provide our customers with valuable services, products, advice, and expertise (http://www.admin.state.mn.us/admin.html)
Goal 1) Fleet Services provides state agencies with a complete vehicle package including acquisition, insurance, maintenance/repair, fuel, and disposal. This allows customers to focus on their governmental missions.
Measure: Fleet Services reviews the use patterns and corresponding life cycles for state agency leased vehicles and adjusts leases to better align vehicle use with assigned life cycle.
Measure: Fleet Services facilitates the move away from petroleum dependency by increasing the use of alternative fuels. State fleet use of E85 fuel has increased by approximately 780 percent from calendar year 2005 to 2010.
Goal 2) Surplus Services provides information and recommendations for the optimal method of disposal to obtain the greatest return while addressing environmental objectives.
Activity at a Glance
• Provides state programs and political subdivisions with long-term rental vehicles and vehicle support services including fuel, insurance, and maintenance/repair
• Assists 19 state agencies and numerous political subdivisions with fleet management planning, implementation, and ongoing review
• Implement enterprise-wide, cost effective, fleet management practices
• Provides assistance in the disposal of nearly $20 million annually in surplus property

ADMINISTRATION DEPT
Program: GOVT AND CITIZEN SERVICES Activity: FLEET AND SURPLUS SERVICES Narrative
State of Minnesota Page 25 2012-13 Biennial Budget Background 2/15/2011
Measure: The Auction Program and Surplus Exchange Program return revenue to participating state agencies and political subdivisions (cities, counties, school districts, and others) to aid customers in replenishing equipment budgets.
Measure: Minnbid online auction software provides a public forum for state agencies and political subdivisions to sell their surplus items from their locations, avoiding time delays and transportation costs associated with transporting items to alternative locations.
Admin Goal – To reduce costs by working across government (http://www.admin.state.mn.us/admin.html)
Goal 1) The physical co-location of the new Fleet and Surplus Services Division enhances the efficient sale of used vehicles. Co-location allows vehicles to be offered for sale as soon as they are physically present at the combined site. Vehicle sales include online auctions and live auctions.
Measure: The average number of days that a vehicle is not in use/assigned to a customer is 30 days or less.
Goal 2) In the current economic climate, government organizations are turning more to Surplus Services for used equipment to meet their needs because purchasing new items may not be a viable option.
Measure: The Property Exchange Program provides a common forum for state agencies and political subdivisions to reuse surplus property.
Measure: The Surplus Store maintains an inventory of usable state and federal surplus property for redistribution to eligible organizations.
Activity Funding Fleet Services operates as an internal service fund that primarily provides services to state agencies. Surplus Services operates as an enterprise fund that provides services to a variety of customers. No money is appropriated to FSS from the state’s general fund. Vehicle lease rates are calculated on an individual vehicle basis and take into account acquisition cost, fuel economy, and life cycle. This rate structure offers customers flexibility in managing vehicle expenses. As of 7-01-10, Fleet Services had eight full-time employees.
General Fund Loans: General fund loans are used to refinance master lease loans so that the repayment schedules work within cash flow parameters. New vehicles are purchased on a regular replacement schedule throughout the year. Cash flow issues arise due to the need to pay for the purchase of fleet vehicles when received, while reimbursement for the vehicle occurs over the life cycle of the vehicle. No general fund loans were used in FY 2010.
Operating Losses/Increases in Retained Earnings: FY 2010 retained earnings increased due to lower than anticipated expenses. Retained earnings are used to improve cash flow and reduce the amount borrowed from the general fund.
History of Rate Changes: Fiscal Year 2007 2008 2009 2010 2011 Change 3.5% 3.5% 0% (3.0%) (3.0%)
Impact of Rate Changes: Assuming the same volume and mix of goods/services as in FY 2010, Fleet Services’ customers will pay 3% less in FY 2011 than in FY 2010 because rates were reduced.
Contact Director Phone: (651) 201-2511 Web site: http://www.fss.state.mn.us

ADMINISTRATION DEPT
Program: GOVT AND CITIZEN SERVICES Activity: FLEET AND SURPLUS SERVICES Narrative
State of Minnesota Page 26 2012-13 Biennial Budget Background 2/15/2011
Fleet Services Internal Service Fund Fund Financial Statement (Dollars in thousands)
* OPERATIONS DATA * ACTUAL ESTIMATED PROJECTED PROJECTED FY 2010 FY 2011 FY 2012 FY 2013
OPERATING REVENUES: NET SALES 13,840 14,699 15,901 16,341 LESS: COST OF SALES
GROSS PROFIT ON SALES 13,840 14,699 15,901 16,341 OTHER REVENUE
NET REVENUES 13,840 14,699 15,901 16,341
LESS: OPERATING EXPENSES:
SALARIES 645 656 767 787 SUPPLIES & EXPENSES 6,758 8,636 8,797 9,022 INDIRECT COSTS 331 435 435 435 AMORTIZATION & DEPRECIATION 4,898 5,458 5,488 5,518
TOTAL OPERATING EXPENSES 12,632 15,185 15,487 15,762
OPERATING INCOME (LOSS) 1,209 (486) 414 579
NON-OPERATING REVENUES (EXPENSES) 114 (210) (50) (50)
NET INCOME (LOSS) 1,322 (696) 364 529
BEGINNING RETAINED EARNINGS 8,330 9,618 8,922 9,286
PRIOR PERIOD ADJUSTMENT (34) 0 0 0
ENDING RETAINED EARNINGS 9,618 8,922 9,286 9,815
RATE INCREASE/(DECREASE): -3.00% -3.00% 3.50% 3.50%
FTE 7.5 9.4 10.2 10.2
Expenditure Reconciliation to BBS Operating Expenses 15,487 15,762 Less amortization & depreciation (non cash) (5,488) (5,518) Plus interest expense and purchase of vehicles and capital assets 7,500 8,100 Total cash payments 17,499 18,344
BBS Amounts - Financing by Fund Travel Management 17,499 18,344
Receipt Reconciliation to BBS Net Revenues 15,901 16,341 Interest Income from Non operating revenue/expenses 300 300 Sale of used vehicles and miscellaneous revenue 1,300 1,300
17,501 17,941 BBS Amounts - Revenue Collected Travel Management 17,051 17,941
Note: Non-operating revenue/expenses generally includes interest revenue, interest expenses, gains/losses on sale of capital assets.

ADMINISTRATION DEPT
Program: GOVT AND CITIZEN SERVICES Activity: FLEET AND SURPLUS SERVICES Narrative
State of Minnesota Page 27 2012-13 Biennial Budget Background 2/15/2011
Fleet Services Internal Service Fund Fund Financial Statement
* FINANCIAL DATA * ACTUAL ESTIMATED FY 2010 FY 2011
ASSETS:
CURRENT ASSETS:
CASH 2,205 2,720 OTHER CURRENT ASSETS 1,705 2,147
TOTAL CURRENT ASSETS 3,910 4,866
NON-CURRENT ASSETS: 17,731 18,009
TOTAL ASSETS 21,641 22,876
LIABILITIES & FUND EQUITY:
LIABILITIES:
CURRENT LIABILITIES: DUE GENERAL FUND - CURRENT 0 0 MASTER LEASE - CURRENT 2,295 3,117 OTHER CURRENT LIABILITIES 322 326
TOTAL CURRENT LIABILITIES 2,616 3,443
NON-CURRENT LIABILITIES: DUE GENERAL FUND - NON-CURRENT 0 0 MASTER LEASE - NON-CURRENT 8,809 9,903 OTHER NON-CURRENT LIABILITIES 96 106
TOTAL NON-CURRENT LIABILITIES 8,905 10,008 TOTAL LIABILITIES 11,521 13,452
FUND EQUITY:
CONTRIBUTED CAPITAL-GENERAL FUND 502 502
RETAINED EARNINGS 9,618 8,922
TOTAL FUND EQUITY 10,120 9,424
TOTAL LIABILITIES & FUND EQUITY 21,641 22,876

ADMINISTRATION DEPT
Program: GOVT AND CITIZEN SERVICES Activity: FLEET AND SURPLUS SERVICES Narrative
State of Minnesota Page 28 2012-13 Biennial Budget Background 2/15/2011
Surplus Services Internal Service Fund Fund Financial Statement
* OPERATIONS DATA * ACTUAL ESTIMATED PROJECTED PROJECTED FY 2010 FY 2011 FY 2012 FY 2013
OPERATING REVENUES: NET SALES 1,293 1,292 1,275 1,275 LESS: COST OF SALES 154 200 175 200
GROSS PROFIT ON SALES 1,139 1,092 1,100 1,075 OTHER REVENUE 0 0 0 0
NET REVENUES 1,139 1,092 1,100 1,075
LESS: OPERATING EXPENSES: SALARIES 489 477 532 544 SUPPLIES & EXPENSES 357 449 605 637 INDIRECT COSTS 75 76 78 80 AMORTIZATION & DEPRECIATION 95 90 70 70
TOTAL OPERATING EXPENSES 1,016 1,092 1,285 1,331
OPERATING INCOME (LOSS) 123 0 (185) (256)
NON-OPERATING REVENUES (EXPENSES)
11 0 0 0
NET INCOME (LOSS) 134 0 (185) (256)
BEGINNING RETAINED EARNINGS 1,258 1,407 1,408 1,223
PRIOR PERIOD ADJUSTMENT 16 0 0 0
ENDING RETAINED EARNINGS 1,407 1,408 1,223 968
RATE INCREASE/(DECREASE): 0.00% 0.00% 0.00% 0.00%
FTE 7.4 7.2 7.7 7.7
Expenditure Reconciliation to BBS Operating Expenses 1,285 1,331 Less amortization & depreciation (non cash) (70) (70) Plus purchase of items for resale (cost of goods sold) 175 200 Total cash payments 1,390 1,461
BBS Amounts - Financing by Fund Materials Distribution - Surplus Property 1,390 1,461
Receipt Reconciliation to BBS Net Sales 1,275 1,275
BBS Amounts - Revenue Collected Materials Distribution - Surplus Property 1,275 1,275

ADMINISTRATION DEPT
Program: GOVT AND CITIZEN SERVICES Activity: FLEET AND SURPLUS SERVICES Narrative
State of Minnesota Page 29 2012-13 Biennial Budget Background 2/15/2011
Surplus Services Internal Service Fund Fund Financial Statement
* FINANCIAL DATA * ACTUAL ESTIMATED FY 2010 FY 2011
ASSETS:
CURRENT ASSETS:
CASH 757.4 828.3 OTHER CURRENT ASSETS 87.1 85.7
TOTAL CURRENT ASSETS 844.5 914.0
NON-CURRENT ASSETS: 818.7 728.7
TOTAL ASSETS 1,663.2 1,642.7
LIABILITIES & FUND EQUITY:
LIABILITIES:
CURRENT LIABILITIES: DUE GENERAL FUND - CURRENT 0 0 MASTER LEASE - CURRENT 0 0 OTHER CURRENT LIABILITIES 53 33
TOTAL CURRENT LIABILITIES 53 33
NON-CURRENT LIABILITIES: DUE GENERAL FUND - NON-CURRENT 0 0 MASTER LEASE - NON-CURRENT 0 0 OTHER NON-CURRENT LIABILITIES 80 80
TOTAL NON-CURRENT LIABILITIES 80 80 TOTAL LIABILITIES 134 113
FUND EQUITY:
CONTRIBUTED CAPITAL-GENERAL FUND 122 122
RETAINED EARNINGS 1,407 1,408
TOTAL FUND EQUITY 1,529 1,530
TOTAL LIABILITIES & FUND EQUITY 1,663 1,643
ADMINISTRATION DEPT Program: GOVT AND CITIZEN SERVICES Activity: FLEET AND SURPLUS SERVICES Budget Activity Summary
Dollars in Thousands
Current Governor’s Recomm. Biennium FY2010 FY2011 FY2012 FY2013 2012-13
State of Minnesota Page 30 2012-13 Biennial Budget Background 2/15/2011
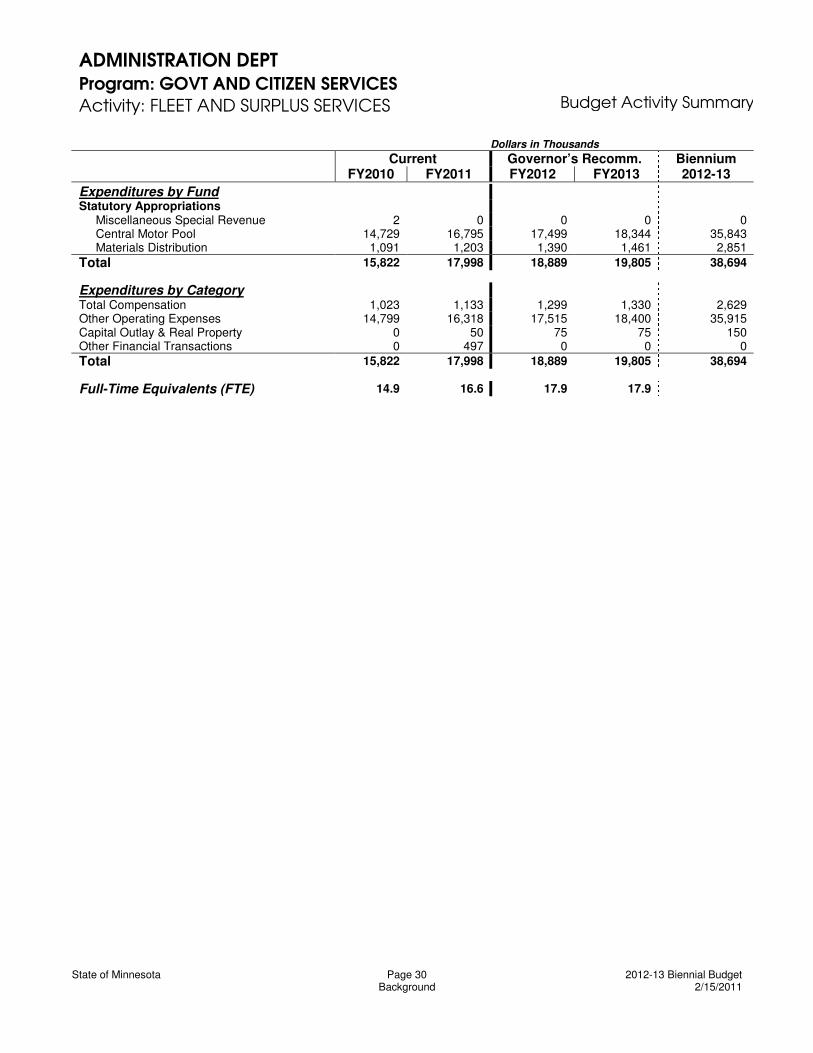
Expenditures by Fund Statutory Appropriations Miscellaneous Special Revenue 2 0 0 0 0 Central Motor Pool 14,729 16,795 17,499 18,344 35,843 Materials Distribution 1,091 1,203 1,390 1,461 2,851 Total 15,822 17,998 18,889 19,805 38,694
Expenditures by Category
Total Compensation 1,023 1,133 1,299 1,330 2,629 Other Operating Expenses 14,799 16,318 17,515 18,400 35,915 Capital Outlay & Real Property 0 50 75 75 150 Other Financial Transactions 0 497 0 0 0 Total 15,822 17,998 18,889 19,805 38,694
Full-Time Equivalents (FTE) 14.9 16.6 17.9 17.9

ADMINISTRATION DEPT
Program: GOVT AND CITIZEN SERVICES Activity: INFORMATION POLICY ANALYSIS Narrative
State of Minnesota Page 31 2012-13 Biennial Budget Background 2/15/2011
Activity Description The Information Policy Analysis Division (IPAD) provides government entities, private sector organizations, the legislature, and citizens with information and training on the Open Meeting Law and data practices issues; help with public policy development; assistance in understanding and complying with complex legislation regulating information; dispute resolution services as they relate to data practices appeals; and assistance in exercising rights regarding access to information, protecting privacy, and challenging inaccurate or incomplete data.
Government information is regulated by extensive rules. These include the Minnesota Government Data Practices Act, the federal Family Educational Rights and Privacy Act and related rules, M.S. 144.291 (the Minnesota Health Records Act), the federal Health Insurance Portability and Accountability Act of 1996 and related rules, the federal Freedom of Information and Privacy Acts, the Minnesota Official Records Act, and the Minnesota Open Meeting Law. Historically, the executive branch and the legislature informally agree that expertise concerning these and other related laws should be available at no charge to government entities and citizens. As a general fund activity, IPAD offers that expertise to government entities and citizens through a variety of functions and services.
Population Served IPAD serves state and local government entities, private citizens, the media, private sector organizations, public and private attorneys, and the legislature.
Services Provided IPAD services include: answer questions about rights under and requirements of various information laws; consult on difficult information policy issues; provide staff services to the commissioner of Administration (Admin) in performing statutory duties that include issuing data practices and open meeting law advisory opinions, act on appeals to challenges to government data, act on applications for temporary classification of data and requests to make new uses of data; prepare and distribute model compliance and informational materials; develop, update, and operate a publicly accessible website that contains all advisory opinions and all informational materials prepared by the division; conduct training for state and local government entities; conduct information sessions for citizens; provide training materials that enable government entities to conduct their own training; answer citizen inquiries and advise on how to exercise their rights; and work with the legislature, citizens, private sector groups, and state and local government agencies on the development of new information policy laws and changes to existing laws.
Historical Perspective The Minnesota Government Data Practices Act was enacted in 1974. Since that time, M.S. Chapter 13 has experienced numerous revisions and additions. Issues of information policy, such as data privacy, fair information practices, genetic privacy, identity theft, security breaches, and government-computer-based systems complaint with the law continue to receive widespread attention.
Key Activity Goals & Measures Admin Goal – To provide our customers with valuable services, products, advice, and expertise (http://www.admin.state.mn.us/admin.html)
Measure: Assess IPAD-sponsored training effectiveness. A high goal was set that 90% of training respondents definitely would utilize the training provided by IPAD in their job. In FY 2010, this goal of was achieved.
Measure: Assess the effectiveness of reactive trainings provided as a part of another organization’s larger agenda or program. When IPAD does not control the overall curriculum nor the audience, it is expected that a smaller percentage of training participants (75%) would definitely utilize the training in their work. In FY 2010, the goal was exceeded slightly with 77%.
Activity at a Glance On average, the Information Policy Analysis Division (IPAD) has annually • Issued 30 advisory opinions • Resolved questions or
requests for assistance from more than 12,000 citizens, media professionals, government entities, and attorneys
• Sponsored and participated in 32 continuing education events and conferences and trained over 1,150 attendees
For the period 7-01-2008 through 6-30-2010, IPAD’s website had 281,968 visits.

ADMINISTRATION DEPT
Program: GOVT AND CITIZEN SERVICES Activity: INFORMATION POLICY ANALYSIS Narrative
State of Minnesota Page 32 2012-13 Biennial Budget Background 2/15/2011
Minnesota Milestones Statewide Goals - Government in Minnesota will be cost-efficient, and services will be designed to meet the needs of the people who use them. (http://server.admin.state.mn.us/mm/goal.html) Measure: IPAD provides technical assistance on complex data practices and Open Meeting Law issues to citizens, members of the media, state and local government entities, and private attorneys each year. Measure: IPAD produces webinars, quarterly electronic newsletters, Power Point presentations, and other informational materials for citizen and government customers. Measure: IPAD continues to develop and implement new training programs on the Open Meeting Law and data practices.
Activity Funding This activity is funded through a general fund appropriation. Special revenue funds are used for seminar activities and collaborative agreements.
Contact Director Phone: (651) 201-2501 www.ipad.state.mn.us

ADMINISTRATION DEPT Program: GOVT AND CITIZEN SERVICES Activity: INFORMATION POLICY ANALYSIS Budget Activity Summary
Dollars in Thousands
Current Governor’s Recomm. Biennium FY2010 FY2011 FY2012 FY2013 2012-13
State of Minnesota Page 33 2012-13 Biennial Budget Background 2/15/2011
D irect A p p ro p ri at io n s b y F u n d
Expenditures by Fund
Direct Appropriations
General 460 468
463 463 926 Statutory Appropriations
Miscellaneous Special Revenue 10 10 10 10 20 Total 470 478 473 473 946
Expenditures by Category
Total Compensation 419 416 416 416 832 Other Operating Expenses 51 62 57 57 114 Total 470 478 473 473 946
Full-Time Equivalents (FTE) 5.0 4.7 4.7 4.5

ADMINISTRATION DEPT
Program: GOVT AND CITIZEN SERVICES Activity: MATERIALS MANAGEMENT Narrative
State of Minnesota Page 34 2012-13 Biennial Budget Background 2/15/2011
Activity Description The Materials Management Division (MMD) acquires goods and services using methods that ensure the best value for taxpayers’ dollars and that conform to the highest ethical standards of public procurement. The division facilitates and oversees an average of $2.1 billion in state agency purchases each year. The statutory framework for the division’s activities is M.S. Chapter 16C – State Procurement.
Population Served MMD operates in close partnership with state agencies to achieve a productive balance of centralized and delegated purchasing. Statewide and multi-state contracts negotiated by MMD currently serve more than 900 local units of government and other authorized entities. MMD also works with Minnesota and out-of-state businesses to ensure fair competition and to resolve vendor performance issues.
Services Provided The division provides a mix of direct services and compliance activities: • purchasing and contracting for goods, services, utilities, and construction; • recruiting and managing vendors; • promoting environmentally responsible purchasing; • managing procurement functions through the Minnesota Accounting and Procurement System (MAPS); • partnering with Minnesota Management & Budget in the development of Statewide Integrated Financial Tools
(SWIFT) procurement functions; • reviewing and overseeing professional/technical contracts; • monitoring compliance with state procurement law and policy, including training and auditing of state
agencies; • conducting other training for agency customers, vendors, and cooperative purchasing members on topics
including local purchasing, effective negotiations, and doing business with the state; and • operating a cooperative purchasing program for Minnesota’s local units of government and other authorized
entities and the Minnesota Multi-State Contracting Alliance for Pharmacy (MMCAP), a pharmaceutical purchasing program on behalf of 46 states and the cities of Chicago and Los Angeles.
Historical Perspective Minnesota’s procurement laws seek to balance numerous interests, including those of state agencies, vendors, small businesses, minority or female-owned or economically disadvantaged businesses, environmental advocates, rehabilitation facilities, correctional industries, persons with disabilities, and others. The legislature re-wrote Minnesota’s procurement laws in 1998, reducing the number of mandates and moving from a “low-bid” to “best value” philosophy of procurement. MMD concurrently shifted to a less centralized approach in which unlimited authority can be delegated to purchasing staff within agencies if they have demonstrated their competence and adherence to state standards. These changes have allowed MMD to reduce its role with respect to one-time, low-dollar-value purchases and to concentrate on more complex and enterprise procurements, including contracts that aggregate public purchasing dollars to achieve volume discounts for standard items.
In 2007, the legislature further amended state procurement laws to support strategic procurement “best practices” that assure the highest value to the state and its taxpayers. Examples of division activities consistent with this legislative direction and the department’s strategic goals are described in “Key Activity Goals & Measures” below.
In December 2009, to reduce costs, gain efficiencies, and provide best value to customers, MMD transitioned its long-standing, in-house office supply operation to contracts with the private sector and a private, non-profit Day Training and Habilitation provider licensed by the Department of Human Services. This change has resulted in cost reductions for office supply purchases by state agencies and other purchasers, along with increased employment opportunities for persons with disabilities.
Activity at a Glance • Oversees an average $2.1 billion annually in
Minnesota state agency purchasing • Negotiates and manages approximately
1,500 enterprise contracts offering volume discounts to state agencies. Over 800 of these contracts are available for use by more than 900 local units of government and other authorized entities
• Reviews an average of approximately 6,000 professional/technical contracts and related documents per year
• Negotiated in excess of $60 million in contract savings and cost avoidance for government entities in FY 2009 and FY 2010
ADMINISTRATION DEPT
Program: GOVT AND CITIZEN SERVICES Activity: MATERIALS MANAGEMENT Narrative
State of Minnesota Page 35 2012-13 Biennial Budget Background 2/15/2011
Key Activity Goals & Measures Admin Goal – To reduce costs by working across government (http://www.admin.state.mn.us/admin.html) Measure: MMD aggressively negotiates state contracts to achieve price reductions below the best competitive offer initially received. In FY 2009, this strategy yielded an estimated savings or cost avoidance valued at $27.8 million on goods and services contracts and $7.3 million on professional and technical contracts over the life of the contracts. In FY 2010, it yielded $9.9 million on goods and services contracts and $15.7 on professional/technical contracts. • MMD awards and manages approximately 1,500 contracts for use by state agencies and other units of
government. These contracts cover frequently-purchased goods (e.g., vehicles, heavy equipment, food, uniforms, computers, cell phones, industrial supplies, furniture), services (e.g. janitorial, interpretation, equipment maintenance, technology consulting) and construction. By utilizing state contracts, local units of government benefit from both the state’s aggregated buying power and the assurance that contracts have been lawfully awarded.
Admin Goal – To provide our customers with valuable services, products, advice, and expertise (http://www.admin.state.mn.us/admin.html) Measure: MMD attempts to review professional/technical contracts, certifications, amendments, and related documents within three days of receipt. The average for the approximately 6,000 documents processed annually has steadily improved over the past five years
FY 2006 2007 2008 2009 2010 Days 2.83 2.58 2.39 1.81 1.44
• MMD promotes and oversees procurement practices that 1) provide the best value to the taxpayers, 2) are open, fair and competitive, and 3) adhere to the highest ethical and legal standards.
• MMD assists agencies with the state’s most complex, high-stakes acquisitions including a new accounting/procurement system (SWIFT), Public Safety’s Minnesota Licensing and Registration System (MnLARS), a 50-state computer contract managed by Minnesota, telecommunications systems, procurement cards and, in conjunction with the Office of Enterprise Technology, a new program that places technical resources in agencies within 48 hours of the identified need (ASAP-IT).
• MMD trains and certifies state employees who are then authorized to make purchases on behalf of their agencies within designated dollar levels. Currently, 661 state employees are so certified. Additionally, the division offers training for state employees on a variety of procurement issues. In FY 2010, approximately 1,600 individuals, primarily state and local government employees and vendors, attended classes, workshops and other presentations on priority topics such as bidding for conference facilities and effective negotiation practices.
Admin Goal – To be recognized for our innovation and efficiency (http://www.admin.state.mn.us/admin.html) Measure: To continue innovative procurement performance worthy of national recognition from objective parties as a “best practices” state. • MMD received the 2010 George Cronin Award for Procurement Excellence. The Cronin Award is presented
by the National Association of State Procurement Officials who describe it as “the premier award for innovations in state government procurement.” The 2010 award is shared between Minnesota and Wisconsin and recognizes this two-state partnership for its inventiveness, costs savings, transferability to other governments, and enhanced services for customers. The initiative was also documented in the August 2010 issue of Governing as “The Great ‘Minnesconsin’ Adventure.”
• MMD was further recognized for leadership in strategic procurement by the Pew Center on the States in a study and white paper issued in May 2010 entitled “States Buying Smarter: Lessons in Purchasing and Contracting from Minnesota to Virginia.”
Activity Funding MMD’s general fund appropriation covers costs associated with delivery of centralized procurement services as well as oversight of delegated purchasing and professional/technical contracts. The division’s cooperative purchasing programs are self-sustaining enterprise funds.
Contact Director Phone: (651) 201-2400 Website: http://www.mmd.admin.state.mn.us

ADMINISTRATION DEPT
Program: GOVT AND CITIZEN SERVICES Activity: MATERIALS MANAGEMENT Narrative
State of Minnesota Page 36 2012-13 Biennial Budget Background 2/15/2011
Cooperative Purchasing Internal Service Fund Fund Financial Statement (Dollars in thousands)
* OPERATIONS DATA * ACTUAL ESTIMATED PROJECTED PROJECTED FY 2010 FY 2011 FY 2012 FY 2013
OPERATING REVENUES: . NET SALES 11,513 13,949 14,296 14,701 LESS: COST OF SALES 0 0 0 0
GROSS PROFIT ON SALES 11,513 13,949 14,296 14,701 OTHER REVENUE 0 0 0 0
NET REVENUES 11,513 13,949 14,296 14,701
LESS: OPERATING EXPENSES: SALARIES 3,154 4,014 4,185 4,282 SUPPLIES & EXPENSES 1,141 1,758 1,866 1,866 INDIRECT COSTS 77 98 98 98 AMORTIZATION & DEPRECIATION 0 0 0 0
TOTAL OPERATING EXPENSES 4,372 5,870 6,149 6,246
OPERATING INCOME (LOSS) 7,141 8,079 8,147 8,455
NON-OPERATING REVENUES (EXPENSES) (6,698) (6,698) (7,025) (7,235)
NET INCOME (LOSS) 443 1,381 1,122 1,220
BEGINNING RETAINED EARNINGS 3,152 2,389 3,770 4,892
PRIOR PERIOD ADJUSTMENT 243 0 0 0
ENDING RETAINED EARNINGS 3,838 3,770 4,892 6,112
RATE INCREASE/(DECREASE): * 0.00% 0.00% 0.00% 0.00%
FTE 37.2 45.6 47.0 47.0
Expenditure Reconciliation to BBS Operating Expenses 6,149 6,246 Less amortization & depreciation (non cash) 0 0 Plus cash payment of rebate in Non-operating revenues/expense 7,025 7,235 Total cash payments 13,174 13,481
BBS Amounts - Financing by Fund
Materials Distribution 13,174 13,481
Receipt Reconciliation to BBS Net Sales 14,296 14,701 Total cash receipts 14,296 14,701 BBS Amounts - Revenue Collected Materials Distribution 14,296 14,701 * Note: Contract fees paid by vendors are determined on a case-by-case basis and may either increase or decrease as specific contracts are negotiated.

ADMINISTRATION DEPT
Program: GOVT AND CITIZEN SERVICES Activity: MATERIALS MANAGEMENT Narrative
State of Minnesota Page 37 2012-13 Biennial Budget Background 2/15/2011
Cooperative Purchasing Internal Service Fund Fund Financial Statement
* FINANCIAL DATA * ACTUAL ESTIMATED FY 2010 FY 2011
ASSETS:
CURRENT ASSETS:
CASH 8,943 8,642 OTHER CURRENT ASSETS 2,436 2,799
TOTAL CURRENT ASSETS 11,379 11,441
NON-CURRENT ASSETS: 0 0
TOTAL ASSETS 11,379 11,441
LIABILITIES & FUND EQUITY:
LIABILITIES:
CURRENT LIABILITIES: DUE GENERAL FUND - CURRENT 0 0 MASTER LEASE - CURRENT 0 0 OTHER CURRENT LIABILITIES 7,222 7,346
TOTAL CURRENT LIABILITIES 7,222 7,346
NON-CURRENT LIABILITIES: DUE GENERAL FUND - NON-CURRENT 0 0 MASTER LEASE - NON-CURRENT 0 0 OTHER NON-CURRENT LIABILITIES 319 325
TOTAL NON-CURRENT LIABILITIES 319 325 TOTAL LIABILITIES 7,541 7,671
FUND EQUITY:
CONTRIBUTED CAPITAL-GENERAL FUND 0 0
RETAINED EARNINGS 3,838 3,770
TOTAL FUND EQUITY 3,838 3,770
TOTAL LIABILITIES & FUND EQUITY 11,379 11,441
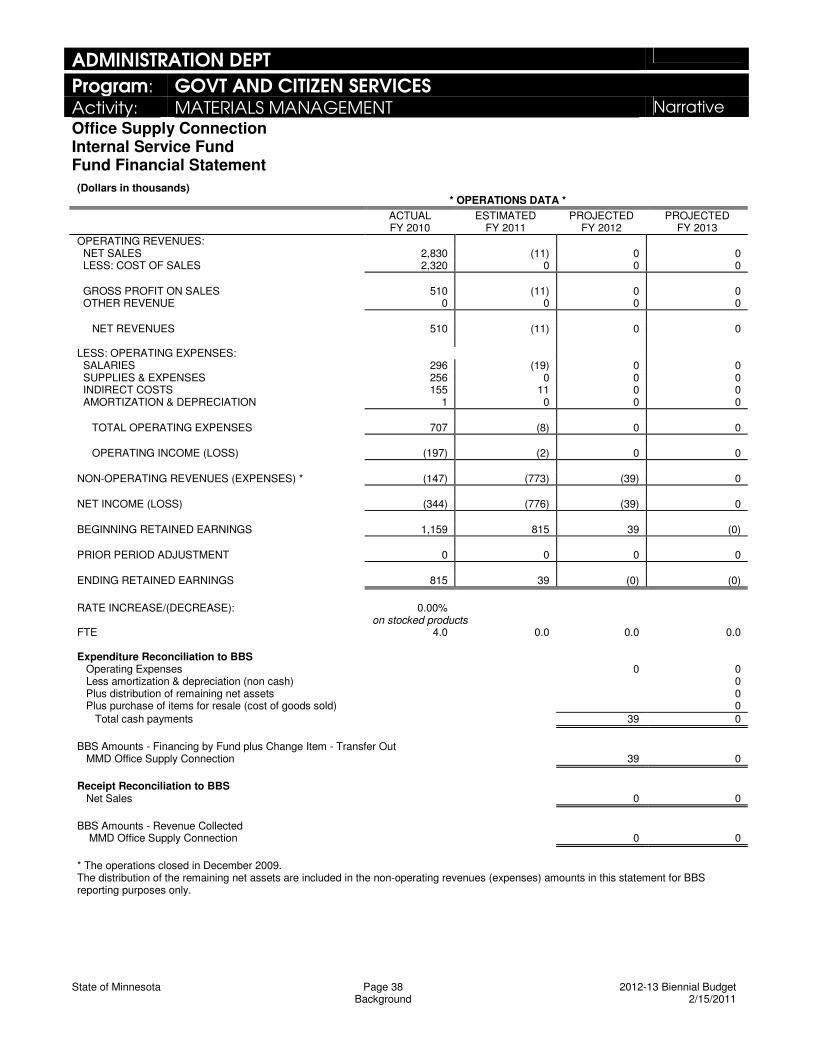
ADMINISTRATION DEPT
Program: GOVT AND CITIZEN SERVICES Activity: MATERIALS MANAGEMENT Narrative
State of Minnesota Page 38 2012-13 Biennial Budget Background 2/15/2011
Office Supply Connection Internal Service Fund Fund Financial Statement (Dollars in thousands)
* OPERATIONS DATA * ACTUAL ESTIMATED PROJECTED PROJECTED FY 2010 FY 2011 FY 2012 FY 2013
OPERATING REVENUES: NET SALES 2,830 (11) 0 0 LESS: COST OF SALES 2,320 0 0 0
GROSS PROFIT ON SALES 510 (11) 0 0 OTHER REVENUE 0 0 0 0
NET REVENUES 510 (11) 0 0
LESS: OPERATING EXPENSES: SALARIES 296 (19) 0 0 SUPPLIES & EXPENSES 256 0 0 0 INDIRECT COSTS 155 11 0 0 AMORTIZATION & DEPRECIATION 1 0 0 0
TOTAL OPERATING EXPENSES 707 (8) 0 0
OPERATING INCOME (LOSS) (197) (2) 0 0
NON-OPERATING REVENUES (EXPENSES) * (147) (773) (39) 0
NET INCOME (LOSS) (344) (776) (39) 0
BEGINNING RETAINED EARNINGS 1,159 815 39 (0)
PRIOR PERIOD ADJUSTMENT 0 0 0 0
ENDING RETAINED EARNINGS 815 39 (0) (0)
RATE INCREASE/(DECREASE): 0.00%
on stocked products FTE 4.0 0.0 0.0 0.0
Expenditure Reconciliation to BBS Operating Expenses 0 0 Less amortization & depreciation (non cash) 0 Plus distribution of remaining net assets 0 Plus purchase of items for resale (cost of goods sold) 0 Total cash payments 39 0
BBS Amounts - Financing by Fund plus Change Item - Transfer Out MMD Office Supply Connection 39 0
Receipt Reconciliation to BBS Net Sales 0 0
BBS Amounts - Revenue Collected MMD Office Supply Connection 0 0
* The operations closed in December 2009. The distribution of the remaining net assets are included in the non-operating revenues (expenses) amounts in this statement for BBS reporting purposes only.

ADMINISTRATION DEPT
Program: GOVT AND CITIZEN SERVICES Activity: MATERIALS MANAGEMENT Narrative
State of Minnesota Page 39 2012-13 Biennial Budget Background 2/15/2011
Office Supply Connection Internal Service Fund Fund Financial Statement
* FINANCIAL DATA * ACTUAL ESTIMATED FY 2010 FY 2011
ASSETS:
CURRENT ASSETS:
CASH 1,257 39 OTHER CURRENT ASSETS 15 0 TOTAL CURRENT ASSETS 1,272 39
NON-CURRENT ASSETS: 0 0
TOTAL ASSETS 1,272 39
LIABILITIES & FUND EQUITY:
LIABILITIES:
CURRENT LIABILITIES: DUE GENERAL FUND - CURRENT 0 0 MASTER LEASE - CURRENT 0 0 OTHER CURRENT LIABILITIES 174 0
TOTAL CURRENT LIABILITIES 174 0
NON-CURRENT LIABILITIES: DUE GENERAL FUND - NON-CURRENT 0 0 MASTER LEASE - NON-CURRENT 0 0 OTHER NON-CURRENT LIABILITIES 18 0
TOTAL NON-CURRENT LIABILITIES 18 0 TOTAL LIABILITIES 192 0
FUND EQUITY:
CONTRIBUTED CAPITAL-GENERAL FUND 265 0
RETAINED EARNINGS 815 39
TOTAL FUND EQUITY 1,080 39
TOTAL LIABILITIES & FUND EQUITY 1,272 39

ADMINISTRATION DEPT Program: GOVT AND CITIZEN SERVICES Activity: MATERIALS MANAGEMENT Budget Activity Summary
Dollars in Thousands
Current Governor’s Recomm. Biennium FY2010 FY2011 FY2012 FY2013 2012-13
State of Minnesota Page 40 2012-13 Biennial Budget Background 2/15/2011
D irect A p p ro p ri at io n s b y F u n d
Expenditures by Fund
Direct Appropriations
General 1,832 2,035
1,931 1,931 3,862 Statutory Appropriations
Miscellaneous Special Revenue 22 11
11 11 22 Federal Stimulus 72 110
0 0 0 Central Stores 2,811 1,017
0 0 0 Materials Distribution 10,227 12,568 13,174 13,481 26,655 Total 14,964 15,741 15,116 15,423 30,539
Expenditures by Category
Total Compensation 5,248 5,872
5,932 6,064 11,996 Other Operating Expenses 3,721 2,146
2,159 2,124 4,283 Other Financial Transactions 5,995 7,723
7,025 7,235 14,260 Total 14,964 15,741
15,116 15,423 30,539 Full-Time Equivalents (FTE) 61.6 67.3
67.8 67.8

ADMINISTRATION DEPT
Program: GOVT AND CITIZEN SERVICES Activity: MN GEOSPATIAL INFO OFFICE Narrative
State of Minnesota Page 41 2012-13 Biennial Budget Background 2/15/2011
Activity Description The Minnesota Geospatial Information Office (MnGeo) coordinates the state’s development, management, and use of geospatial information technology, including Geographic Information Systems (GIS). With broadly defined responsibilities authorized by M.S. 16B.99, MnGeo works closely with state agencies and stakeholders to improve services statewide through the coordinated, affordable, reliable, and effective use of GIS. Headed by the state’s first Geospatial Information Officer, MnGeo works closely with the Office of Enterprise Technology and is guided by advisory councils established to represent state agencies and organizations throughout Minnesota. MnGeo is a unit within the Office of Geographic and Demographic Analysis.
Population Served MnGeo serves the entire state’s population, primarily by supporting state agencies and local governments. MnGeo also serves elected officials, federal agencies, non-government organizations, educators, and citizens.
Services Provided GIS Coordination: MnGeo works with stakeholders throughout Minnesota to coordinate GIS, develop and implement standards and shared services; and integrate GIS with other technologies. For example, MnGeo has negotiated an enterprise license agreement that standardized GIS software among state agencies, expanding its use at savings up to 80% of the previous cost. MnGeo also coordinated statewide programs to acquire high-resolution imagery and elevation data (LiDAR), benefitting state agencies and local governments throughout Minnesota. MnGeo also represents the state’s GIS interests nationally as the state’s liaison with federal agencies.
Data Services: MnGeo serves as the state’s steward of publicly funded spatial data. In this role, MnGeo is responsible for organizing, safeguarding, and improving the value of these public investments by ensuring their availability and supporting their effective use. The Geographic Data Clearinghouse emphasizes services that promote access to data maintained by state agencies through web portals and web services. Clearinghouse services support organizations throughout Minnesota, reducing their costs, and improving their effectiveness.
Project Services: The Project Service Bureau assists state agencies and other government clients by designing and implementing projects that use GIS for analysis, planning, program operations, and decision-support. Unlike other MnGeo functions, which are supported by the general fund, the Service Bureau is entirely funded by project revenues.
Historical Perspective MnGeo succeeds the Land Management Information Center (LMIC), which was established in 1978 to promote the introduction and development of technology for analyzing and mapping the use of land and natural resources within the state. As the state’s first organization devoted to using geographic information systems, LMIC served all of the state’s GIS needs during the early years. As state agencies and local governments adopted the technology, LMIC’s role shifted to coordination of geospatial information technology, promoting access to standardized geospatial data, developing GIS-based decision support tools that help organizations improve their effectiveness, and consulting with agencies in need of GIS assistance. Supported by stakeholders who participated in an extensive statewide assessment of GIS use, 2009 legislation established MnGeo with a broad and comprehensive mandate to coordinate Minnesota’s geospatial information technology. MnGeo is recognized within the state and around the nation for leadership and creativity in the GIS field.
Activity at a Glance
• Coordinates state Geographic Information Systems (GIS) support for response to floods
• Negotiates and manages enterprise GIS software license agreement benefiting 14 agencies
• Provides 14.4 million requested map images through web services in 2010
• 28 GIS consulting projects valued at more than $600,000 of services in 2010
• Coordinates acquisition and management of data valued at more than $3 million in 2010
• Coordinates Minnesota interactions with federal programs involving GIS issues

ADMINISTRATION DEPT
Program: GOVT AND CITIZEN SERVICES Activity: MN GEOSPATIAL INFO OFFICE Narrative
State of Minnesota Page 42 2012-13 Biennial Budget Background 2/15/2011
Key Activity Goals & Measures Admin Goal – To provide our customers with valuable services, products, advice, and expertise (http://www.admin.state.mn.us/admin.html)
Measure: The average quality of service score on MnGeo’s customer satisfaction surveys based upon a five-point scale where four = Good and five = Excellent. For FY 2010, those scores averaged 4.6, with 94% of the evaluations rated as Good or Excellent.
Admin Goal – To be recognized for our innovation and efficiency (http://www.admin.state.mn.us/admin.html)
Measure: The number of map images served by MnGeo web mapping services designed to deliver data effectively and directly to GIS users and web mapping applications. During FY 2010, more than 14.4 million map images were served in “real time” to state agencies, local governments and other users throughout Minnesota. This number will continue to grow as MnGeo acquires and hosts new imagery.
0
1,000
2,000
3,000
4,000
5,000
Thou
sand
s
Map Images Served
Admin Goal – To reduce costs by working across government (http://www.admin.state.mn.us/admin.html)
Measure: Continued agency demand for MnGeo’s Project Service Bureau consulting that is self-supporting at below market rates.
Activity Funding MnGeo depends upon a general fund appropriation to support its core coordination activities. These are supplemented by grants, generally from federal agencies, that involve coordination between the state and federal programs. Project services are funded through contracts with agencies with fees based on rates established through an annual review process with Minnesota Management & Budget (MMB).
Contact Chief Geospatial Information Officer Phone: (651) 201-2460 Web site: http://www.mngeo.state.mn.us
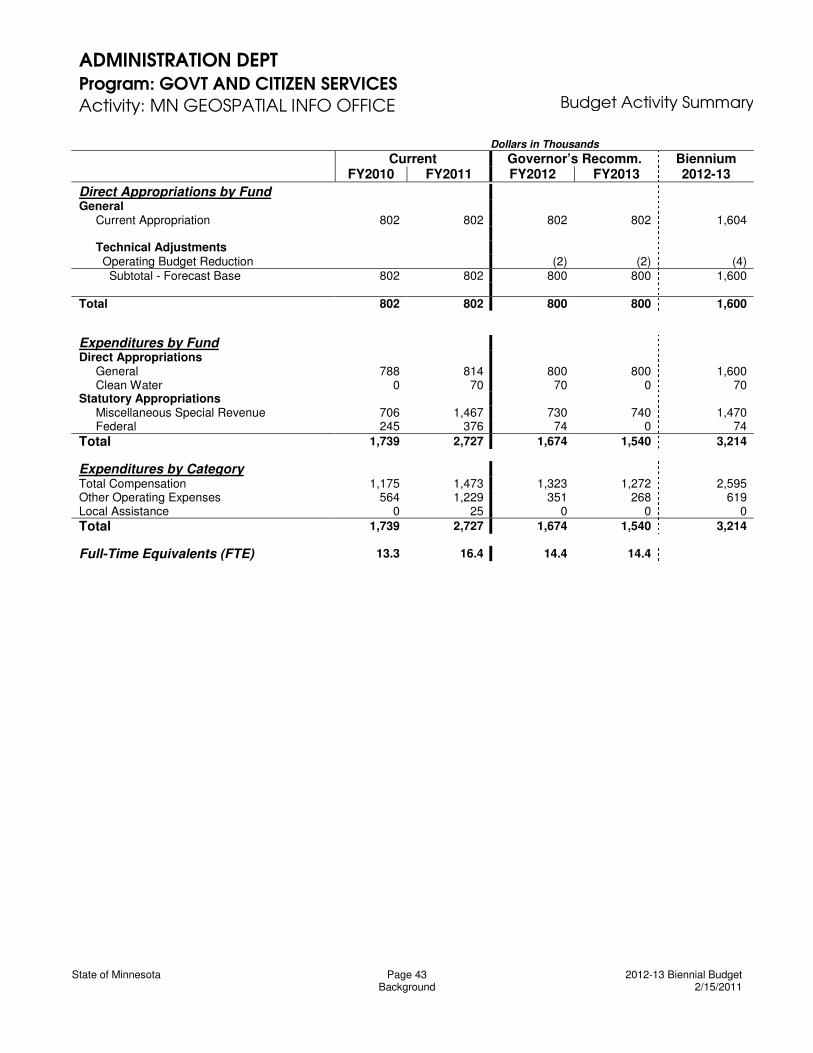
ADMINISTRATION DEPT Program: GOVT AND CITIZEN SERVICES Activity: MN GEOSPATIAL INFO OFFICE Budget Activity Summary
Dollars in Thousands
Current Governor’s Recomm. Biennium FY2010 FY2011 FY2012 FY2013 2012-13
State of Minnesota Page 43 2012-13 Biennial Budget Background 2/15/2011
Direct Appropriations by Fund General Current Appropriation 802 802 802 802 1,604 Technical Adjustments Operating Budget Reduction (2) (2) (4) Subtotal - Forecast Base 802 802 800 800 1,600 Total 802 802 800 800 1,600
Expenditures by Fund Direct Appropriations General 788 814 800 800 1,600 Clean Water 0 70 70 0 70 Statutory Appropriations Miscellaneous Special Revenue 706 1,467 730 740 1,470 Federal 245 376 74 0 74 Total 1,739 2,727 1,674 1,540 3,214
Expenditures by Category
Total Compensation 1,175 1,473 1,323 1,272 2,595 Other Operating Expenses 564 1,229 351 268 619 Local Assistance 0 25 0 0 0 Total 1,739 2,727 1,674 1,540 3,214
Full-Time Equivalents (FTE) 13.3 16.4 14.4 14.4

ADMINISTRATION DEPT
Program: GOVT AND CITIZEN SERVICES Activity: OFFICE OF ENTERPRISE CONT IMPR Narrative
State of Minnesota Page 44 2012-13 Biennial Budget Background 2/15/2011
Activity Description The Office of Enterprise Continuous Improvement reflects the agency’s and state government’s increased emphasis on improving organizational performance. The office has four primary purposes • Simplify the business processes of government for citizens and
employees • Reduce costs and increase the productivity of state government
administrative responsibilities • Develop the knowledge and skills to create an integrated continuous
improvement philosophy and infrastructure using the time-tested Lean approach to organizational improvement
• Assist agencies in identifying process improvement opportunities; and provide training, resources, and expertise to implement efficiency solutions
• Provide a reporting mechanism to monitor and publish performance and status of improvement efforts within agencies
Population Served These activities serve the citizens of Minnesota through enhanced or re-engineered processes that reduce processing time, improve efficiency, reduce cost, and improve quality.
Services Provided Kaizen Improvement Event Facilitation – Provide Kaizen (rapid process improvement events) facilitation for key service processes within state agencies to improve the speed, accuracy, efficiency, and customer service of those processes. Continuous Improvement Infrastructure – Develop the infrastructure and culture within each agency to sustain and expand initial continuous improvement efforts through training, coaching, and material support. Lean Methodology Training – Provide training to state leaders and staff within all cabinet-level agencies to help them understand Lean continuous improvement methods and how they can be implemented within their agency. Reporting Results – Publish the results of individual improvement efforts completed by each agency through the Lean website. Sustainment of Results – Monitor and report on sustainment of improvements through the collection and dissemination of data, and implementation of action plans. Coordination with Other Public Agencies – Share and compare efforts and results with government agencies in other states and other levels of government, benchmark results, and learn from other efforts. Department Results Reporting – Assist 24 cabinet-level agencies with reporting goals, measures, and performance through the Lean Results website, including requesting, organizing, and publishing information from each of the agencies. Enterprise Synchronization – Work across the state enterprise to develop or improve common processes, procedures, and policies with the objective of simplifying government for citizens and employees.
Key Activity Goals & Measures Admin Goal – To reduce costs by working across government (http://www.admin.state.mn.us/admin.html) Through the use of Lean and other process improvements tools, agencies will identify and improve existing business processes to realize measureable reductions in lead time, increased efficiency, and cost savings, while improving enterprise efficiency, reducing redundancy, and improving processing time. Measure: To date, 18 agencies have completed over 145 Kaizen or rapid process improvement events that have reduced lead time by an average of 68%, reduced the amount of task time by an average of 44%, and reduced processing costs by an average of $85,000 per event.
Admin Goal – To provide our customers with valuable services, products, advice, and expertise (http://www.admin.state.mn.us/admin.html) Continuous process improvement tools and methods will be understood by agency leaders and staff, and recognized as valuable tools for reducing waste and improving services. Measure: Nearly 3,000 state leaders and employees have participated in Lean training, through direct participation in process improvement teams, Lean 101, Kaizen facilitator, and other training opportunities, and through leadership symposiums.
Activity Funding This activity is funded through a general fund appropriation.
Contact Continuous Improvement Program Leader Phone: (651) 201-2560 Web site: http://www.lean.state.mn.us
Activity at a Glance • Over 145 rapid process improvement
events (Kaizen) at 18 agencies held since program’s beginning in November 2007, realizing: �� 68% average lead-time reduction �� 44% average task time reduction �� $85,000 average cost-avoidance per
event • Over 2,000 state agency staff have
participated in Lean training • Lean website monitors and reports results,
and serves as an online resource for information, teaching tools, and training materials
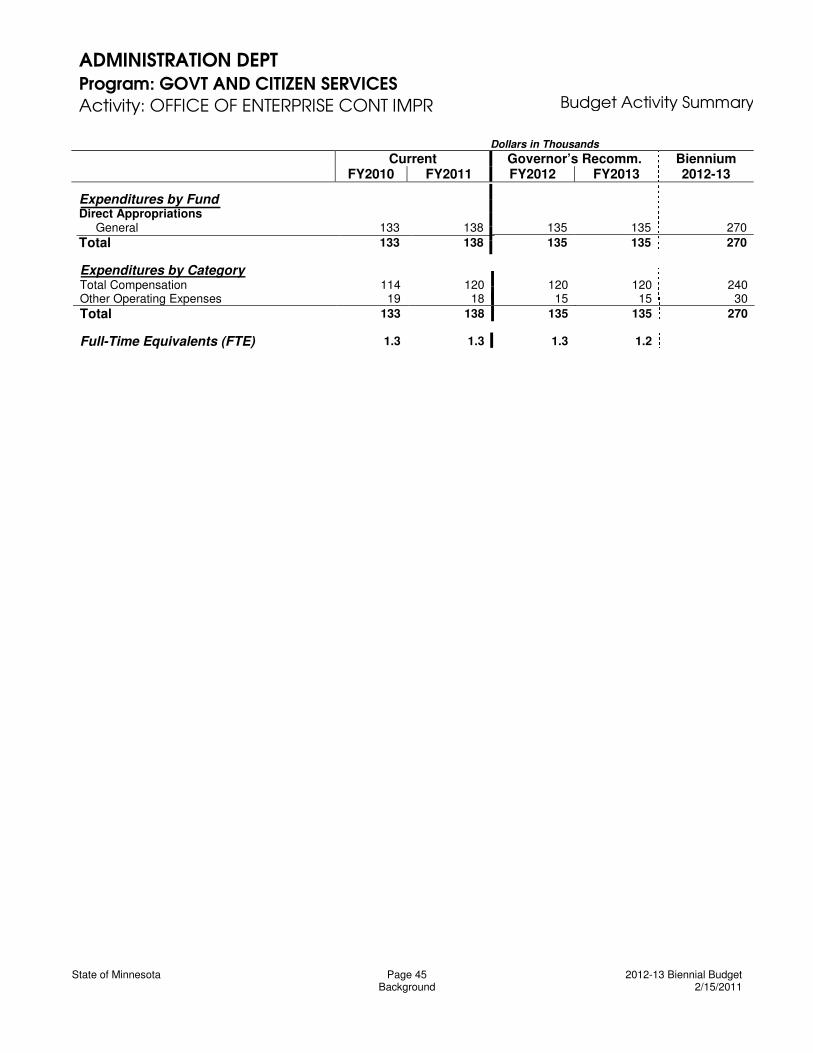
ADMINISTRATION DEPT Program: GOVT AND CITIZEN SERVICES Activity: OFFICE OF ENTERPRISE CONT IMPR Budget Activity Summary
Dollars in Thousands
Current Governor’s Recomm. Biennium FY2010 FY2011 FY2012 FY2013 2012-13
State of Minnesota Page 45 2012-13 Biennial Budget Background 2/15/2011
D irect A p p ro p ri at io n s b y F u n d
Expenditures by Fund
Direct Appropriations
General 133 138 135 135 270 Total 133 138 135 135 270
Expenditures by Category
Total Compensation 114 120
120 120 240 Other Operating Expenses 19 18 15 15 30 Total 133 138 135 135 270
Full-Time Equivalents (FTE) 1.3 1.3
1.3 1.2

ADMINISTRATION DEPT
Program: GOVT AND CITIZEN SERVICES Activity: OFFICE OF GRANTS MANAGEMENT Narrative
State of Minnesota Page 46 2012-13 Biennial Budget Background 2/15/2011
Activity Description The Office of Grants Management (OGM) provides policy leadership and direction to foster consistent, streamlined interaction between executive agencies, funders, and grantees. This enhances access to grant opportunities and information and leads to greater program accountability and transparency. OGM is the central point of contact for allegations of state agency violations and “fraud and waste” in grant processes in accordance with M.S. 16B.98.
Population Served OGM provides leadership on state grants management policies and procedures to executive agencies, boards, commissions, councils, and task forces. The public has increased access to grant opportunities and information.
Services Provided The mission of OGM is to standardize, streamline, and improve state grant-making practices and to increase public information about state grant opportunities. OGM works closely with organizations on standardizing practices, policies, procedures, and on increasing public information about state grant opportunities, information, and resources. Standard policies for grants management in the executive branch that create greater oversight, consistency, and transparency for state grant expenditures have been implemented since the creation of this office. Training is provided to state employees on grant management policies and effective financial management of state grants. An informational website (http://www.admin.state.mn.us/ogm) for state grant-makers features legislation, policy, forms, templates, federal grants resources, best practices, training, and development links. In addition, a one-stop website (http://www.grants.state.mn.us) links all competitive state grant opportunities, providing increased access to grants. OGM works across executive branch agencies to provide public outreach and information on state grants for applicants and ensures the investigation of public complaints about fraud and waste in state grants. A variety of training courses on grant monitoring, outcomes, and policies are also provided. OGM also works with state agencies, boards, commissions, councils, and task forces to provide continuous improvement events (Lean) that lead to improving state grant-making practices.
Historical Perspective Executive branch agencies in FY 2006 granted $1.2 billion to nonprofits and local units of government as a mechanism to deliver programs, services, and other public benefits. OGM was created with a one-time appropriation in FY 2008; its creation responded to a January 2007 Office of the Legislative Auditor report on state grant-making that called for greater consistency and oversight in state grants. In July of 2010, OGM began receiving a general fund appropriation. Legislation was also passed that requires the commissioner of Administration (Admin) to recover the amount of the appropriation through deductions in state grants. State agencies now pay a share of OGM costs to Admin and these funds are returned to the general fund to offset the general fund appropriation. OGM is governed by a Grants Governance Committee that includes representatives from state agencies, the Minnesota Council of Nonprofits, and the Association of Minnesota Counties.
Key Activity Goals & Measures Admin Goal – To provide our customers with valuable services, products, advice, and expertise (http://www.admin.state.mn.us/admin.html).
Measure: OGM provides customers with valuable services, products, advice, and expertise by increasing the transparency of government for citizens. Through its grant opportunities website, OGM provides information about state grant opportunities, as well as extensive information on state grants policies and best practices. The successful resolution of public complaints about fraud and waste in state grants is also a key outcome for the office.
Activity at a Glance • 13 comprehensive grant policies to
improve grant-making • 2 websites to provide information and
assistance to grant-makers and grant-seekers
• 175,000 visitors to grant-seeker website annually/average visit 40 minutes
• 450 state employees participated in 12 training sessions

ADMINISTRATION DEPT
Program: GOVT AND CITIZEN SERVICES Activity: OFFICE OF GRANTS MANAGEMENT Narrative
State of Minnesota Page 47 2012-13 Biennial Budget Background 2/15/2011
Admin Goal – To reduce costs by working across government (http://www.admin.state.mn.us/admin.html)
Measure: OGM reduces costs by providing training through a centralized office. OGM also works with the Enterprise Grants Management Community, a professional network of state grants administrators, to facilitate communication and sharing of best practices in grants management. Adding consistency to policies and procedures and using the Lean process to reduce inefficiencies in grant-making, OGM helps reduce costs and improve the quality of service of all state agencies.
Activity Funding This activity is funded by a general fund appropriation. Legislation requires recovery of the appropriation to offset the general fund appropriation.
Contact Director Phone: (651) 201-2569 http://www.admin.state.mn.us/ogm http://www.grants.state.mn.us/public/

ADMINISTRATION DEPT Program: GOVT AND CITIZEN SERVICES Activity: OFFICE OF GRANTS MANAGEMENT Budget Activity Summary
Dollars in Thousands
Current Governor’s Recomm. Biennium FY2010 FY2011 FY2012 FY2013 2012-13
State of Minnesota Page 48 2012-13 Biennial Budget Background 2/15/2011
Direct Appropriations by Fund General Current Appropriation 150 125 125 125 250 Subtotal - Forecast Base 150 125 125 125 250 Total 150 125 125 125 250
Expenditures by Fund Direct Appropriations General 74 78 125 125 250 Arts And Cultural Heritage 23 121 0 0 0 Total 97 199 125 125 250
Expenditures by Category
Total Compensation 83 106 69 72 141 Other Operating Expenses 14 93 56 53 109 Total 97 199 125 125 250
Full-Time Equivalents (FTE) 1.2 1.6 1.0 1.0

ADMINISTRATION DEPT
Program: GOVT AND CITIZEN SERVICES Activity: OFFICE OF STATE ARCHAEOLOGIST Narrative
State of Minnesota Page 49 2012-13 Biennial Budget Background 2/15/2011
Activity Description The Office of the State Archaeologist (OSA) helps manage the state’s archaeological resources, including sites and data under provisions of the Field Archaeology Act (M.S. 138.31-138.42) and the Private Cemeteries Act (M.S. 307.08). In addition to federal legislation addressing cultural heritage resource management, OSA is responsible for archaeological resource management as specified in the Outdoor Recreation Act (M.S. 86A) and the Minnesota Environmental Rights Act (M.S. 116B).
OSA reviews are critical to preserving Minnesota archaeological resources and controlling impacts to public and private development costs. The processes involve identifying, evaluating, and, in some cases, preserving archaeological sites including unplatted burial sites over 50 years old.
Held annually each spring, Minnesota Archaeology Week is a key component of the OSA’s public participation and education programming. The OSA assumes the lead role in organizing, coordinating, and promoting this statewide series of events that celebrate Minnesota’s archaeological heritage.
Population Served OSA clients include government agencies, representatives of Minnesota’s tribal communities, builders and development associations, cultural resource management firms, county historical societies, private homeowners, professional and avocational archaeologists, local heritage preservation commissions, educators and school districts, other public and private agencies, and individuals.
Services Provided Major service categories include data management, consultation, licensing and project review, compliance enforcement, research, and information dissemination. Both integrated and interdependent, these program services function as a whole. As an example, the scheduling, cost, and progress of both public and private development projects depend on accurate and timely consultative services, which in turn require comprehensive data management, information dissemination, and research capabilities.
Historical Perspective The State Archaeologist was created in 1963 by the Field Archaeology Act. In 1996, Executive Reorganization Order 175 established OSA as a division within the Department of Administration (Admin). OSA is a unit within the Office of Geographic and Demographic Analysis.
Studies by the Management Analysis Division and the Office of the Legislative Auditor explored alternative funding options for the OSA. The Office of the Legislative Auditor’s April 2001 OSA program evaluation report concluded that “... the Office of the State Archaeologist should continue to receive its funding primarily from a General Fund appropriation, (and) the legislature should direct the office to determine the feasibility of charging fees to supplement its budget.” The rationale for the conclusion was based primarily on the state’s obligation to ensure that archaeological resources are protected and that funding the office’s operations through fees was not feasible. In the March 2002 assessment of the feasibility of supplementing OSA’s budget with fee-for-service funds, the Management Analysis Division concluded that “... a fee-for-service model does not appear to be in the best interest of the Office of the State Archaeologist or the state.”
Key Activity Goals & Measures Admin Goal – To provide our customers with valuable services, products, advice, and expertise (http://www.admin.state.mn.us/admin.html)
Activity at a Glance For FY 2009 • Reviewed and licensed 56 archaeological
projects • Evaluated/accepted 203 archaeological site data
forms • Completed 12 burial site investigation cases • Reviewed 92 development projects • Coordinated Archaeology Week, involving 23
events in 17 counties, attended by more than 1,300 individuals

ADMINISTRATION DEPT
Program: GOVT AND CITIZEN SERVICES Activity: OFFICE OF STATE ARCHAEOLOGIST Narrative
State of Minnesota Page 50 2012-13 Biennial Budget Background 2/15/2011
Measure: OSA will review and issue licenses to qualified applicants within ten days of receipt of application. In FY 2010, the turnaround goal was met 100% of the time. A new streamlined process was implemented in May 2006, reducing the total number of licenses issued. In most cases, licenses are now issued on a yearly basis to qualified archaeologists rather than for each project. (Note: OSA response time is not the sole variable in determining turnaround time as the Minnesota Historical Society must sign the licenses.)
Measure: Target for turnaround time for review/correction of site data forms and issuance of Smithsonian Site Designation Numbers (SSDN) is within seven days of receipt of correctly completed site forms. Actual average turnaround time met the goal 100% of the time.
Admin Goal – To be recognized for our innovation and efficiency (http://www.admin.state.mn.us/admin.html)
OSA will be recognized for its innovation and efficiency in protecting Minnesota archaeological resources.
Measure: OSA will provide additional online services to professional archaeologists and public agencies, including archaeological resource locations and predictive models.
Minnesota Milestones Statewide Goals – Government in Minnesota will be cost-efficient, and services will be designed to meet the needs of the people who use them (http://server.admin.state.mn.us/mm/goal.html)
Measure: Success in clarifying and implementing state statutes regarding protection of archaeological resources and burials sites. In FY 2007 and 2008, the State Archeologist worked to clarify and simplify M.S. 307.08 through statutory changes and revised procedural guidelines to increase customer satisfaction and reduce the cost of government services. In FY 2010, the State Archaeologist intensified efforts to map unplatted pioneer cemeteries and to assess remotely burial mound conditions to assist landowners, developers, and planning agencies in avoiding adverse impacts to cemetery sites thus reducing development costs and more rapidly providing essential information.
Activity Funding The program operates through a general fund appropriation.
Contact Archaeologist Phone: (612) 725-2411 http://www.osa.admin.state.mn.us
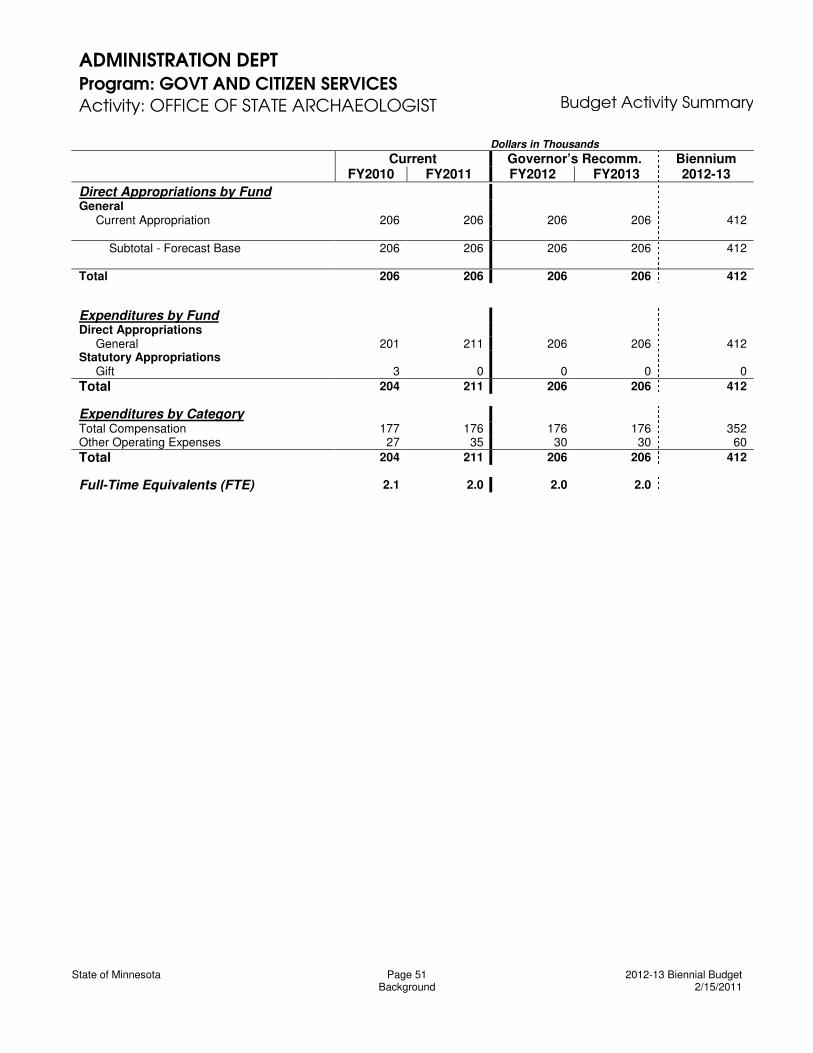
ADMINISTRATION DEPT Program: GOVT AND CITIZEN SERVICES Activity: OFFICE OF STATE ARCHAEOLOGIST Budget Activity Summary
Dollars in Thousands
Current Governor’s Recomm. Biennium FY2010 FY2011 FY2012 FY2013 2012-13
State of Minnesota Page 51 2012-13 Biennial Budget Background 2/15/2011
Direct Appropriations by Fund General Current Appropriation 206 206 206 206 412 Subtotal - Forecast Base 206 206 206 206 412 Total 206 206 206 206 412
Expenditures by Fund Direct Appropriations General 201 211 206 206 412 Statutory Appropriations Gift 3 0 0 0 0 Total 204 211 206 206 412
Expenditures by Category
Total Compensation 177 176 176 176 352 Other Operating Expenses 27 35 30 30 60 Total 204 211 206 206 412
Full-Time Equivalents (FTE) 2.1 2.0 2.0 2.0

ADMINISTRATION DEPT
Program: GOVT AND CITIZEN SERVICES Activity: PLANT MANAGEMENT Narrative
State of Minnesota Page 52 2012-13 Biennial Budget Background 2/15/2011
Activity Description Plant Management Division (PMD) delivers consistent, quality services to ensure cost-effective, clean, safe, and environmentally sound buildings, grounds, and operations. PMD provides mail distribution services and publishing and distribution services to state and local government through the central mail unit and Minnesota’s Bookstore. Division work is outlined in M.S. 16B.24, 16B.48, 16B.49, 16B.58, 14.46, and 16B.51.
Population Served The majority of PMD’s customers are state agencies and the legislature. Non-state agency customers include visitors and event participants, as well as organizations leasing space or needing parking. Minnesota’s Bookstore also provides services to state government, local governments, school districts, higher education entities, and the general public.
Services Provided Services provided by PMD include: • housekeeping, engineering, building management, waste removal, general recycling, grounds maintenance,
snow removal, trade and repair services, event permitting and coordination, cafeteria oversight, energy management, and environmental and fire/life/safety systems
• maintenance of ceremonial grounds, monuments, and memorials as a showplace for all capitol area tenants, visitors, and Minnesota citizens
• mail services including metering, processing, addressing, inserting, and bar-coding for state agencies, with the result of reduced postage costs
• moving, equipment rental, and delivery services • maintaining and managing parking facilities and customer contracts, and providing alternative transportation
services • operating the state of Minnesota Mailing List Service – a centralized production and distribution outlet for the
sale of selected state public licensing data to a national customer base • publishing the State Register – the state’s official publication of record
Historical Perspective PMD ensures that all facilities are operated,, repaired, and maintained in a cost-effective manner to preserve the integrity of the state’s assets and provide a safe and comfortable environment for building tenants and visitors. As part of this goal, PMD maintains an Asset Preservation Program outlining necessary facility repairs. Failure to address deferred maintenance issues will result in serious structural damage, deterioration, and reduction in the life expectancy of buildings.
State agencies within the boundaries of St. Paul are required to use PMD’s central mail unit for outbound mail handling and processing. This centralized operation allows small and large agencies collectively to achieve postage savings through the use PMD’s bar-coding and ink-jet addressing equipment and also helps realize operational efficiencies in staffing, equipment, and space.
Key Activity Goals & Measures Admin Goal – To be recognized for our innovation and efficiency (http://www.admin.state.mn.us/admin.html)
Goal 1: Reduce energy consumption in non-computer server facilities compared with FY 2008 actual consumption. Reduction of 12.0% in FY 2011, 13.5% in FY 2012 and 15.0% in FY 2013. Measure: Less than: 449,000 MMbtu in FY 2011, 441,000 in FY 2012, and 433,000 in FY 2013.
Activity at a Glance • Maintains 4.4 million square feet
of office, ceremonial, meeting room, and other space in 22 buildings
• Maintains 25 monuments and memorials and 32 parking facilities
• 578 special event permits issued for public use of State Capitol and grounds in FY 2010
• $945,000 in postage savings in FY 2010 through automated mail services
• More than 70,000 Minnesota’s Bookstore customers annually
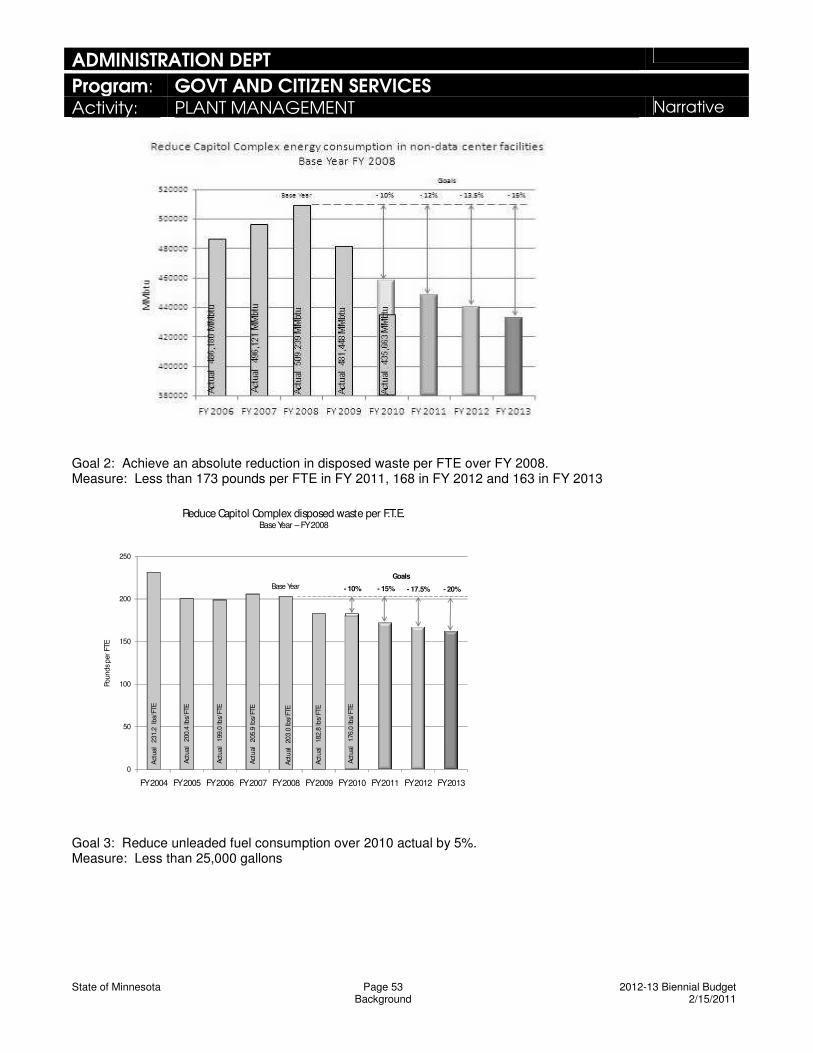
ADMINISTRATION DEPT
Program: GOVT AND CITIZEN SERVICES Activity: PLANT MANAGEMENT Narrative
State of Minnesota Page 53 2012-13 Biennial Budget Background 2/15/2011
Goal 2: Achieve an absolute reduction in disposed waste per FTE over FY 2008. Measure: Less than 173 pounds per FTE in FY 2011, 168 in FY 2012 and 163 in FY 2013
0
50
100
150
200
250
FY 2004 FY 2005 FY 2006 FY 2007 FY 2008 FY 2009 FY 2010 FY 2011 FY 2012 FY 2013
Base Year - 15% - 17.5% - 20%
Goals
Actu
al
231.
2 lb
s/FT
E
Actu
al
200.
4 lb
s/FT
E
Actu
al
205.
9 lb
s/FT
E
Actu
al
203.
0 lb
s/FT
E
Actu
al
182.
8 lb
s/FT
E
Reduce Capitol Complex disposed waste per F.T.E. Base Year – FY 2008
Actu
al
199.
0 lb
s/FT
E
Actu
al
176.
0 lb
s/FT
E
- 10%
Poun
ds p
er F
TE
Goal 3: Reduce unleaded fuel consumption over 2010 actual by 5%. Measure: Less than 25,000 gallons
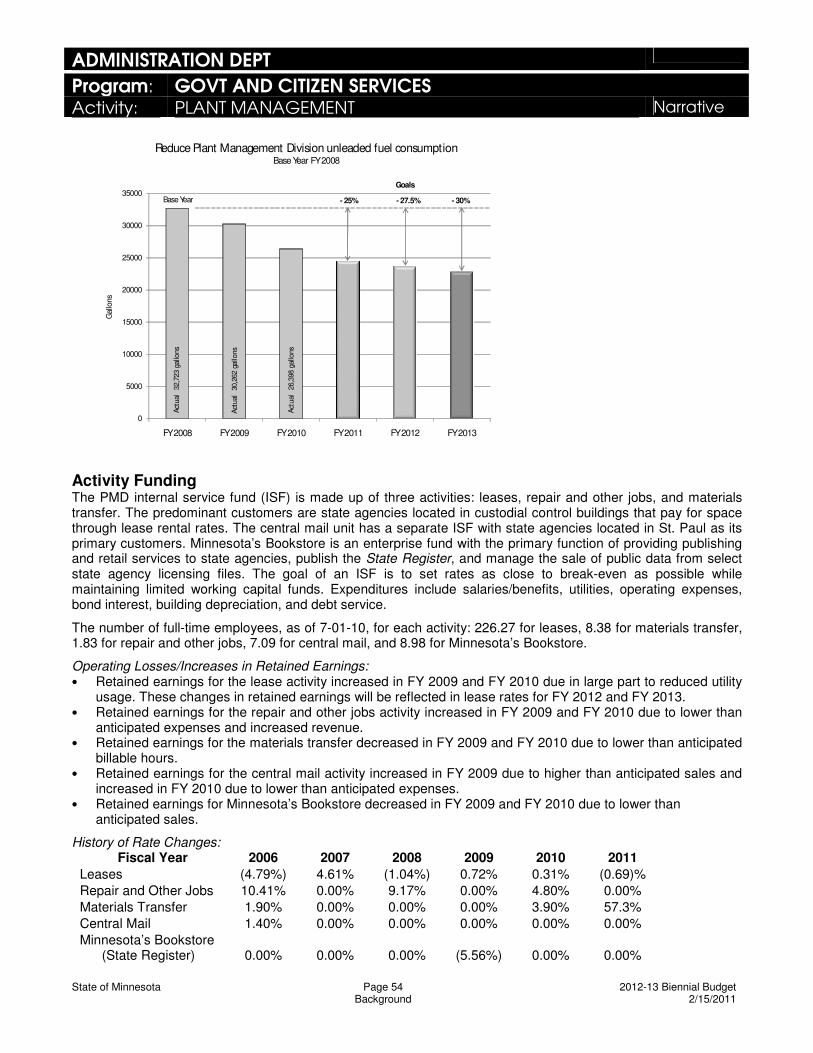
ADMINISTRATION DEPT
Program: GOVT AND CITIZEN SERVICES Activity: PLANT MANAGEMENT Narrative
State of Minnesota Page 54 2012-13 Biennial Budget Background 2/15/2011
0
5000
10000
15000
20000
25000
30000
35000
FY 2008 FY 2009 FY 2010 FY 2011 FY 2012 FY 2013
Base Year - 27.5% - 30%- 25%
GoalsAc
tual
32
,723
gal
lons
Actu
al
30,2
62 g
allo
ns
Reduce Plant Management Division unleaded fuel consumption Base Year FY 2008
Actu
al
26,3
98 g
allo
ns
Gal
lons
Activity Funding The PMD internal service fund (ISF) is made up of three activities: leases, repair and other jobs, and materials transfer. The predominant customers are state agencies located in custodial control buildings that pay for space through lease rental rates. The central mail unit has a separate ISF with state agencies located in St. Paul as its primary customers. Minnesota’s Bookstore is an enterprise fund with the primary function of providing publishing and retail services to state agencies, publish the State Register, and manage the sale of public data from select state agency licensing files. The goal of an ISF is to set rates as close to break-even as possible while maintaining limited working capital funds. Expenditures include salaries/benefits, utilities, operating expenses, bond interest, building depreciation, and debt service.
The number of full-time employees, as of 7-01-10, for each activity: 226.27 for leases, 8.38 for materials transfer, 1.83 for repair and other jobs, 7.09 for central mail, and 8.98 for Minnesota’s Bookstore.
Operating Losses/Increases in Retained Earnings: • Retained earnings for the lease activity increased in FY 2009 and FY 2010 due in large part to reduced utility
usage. These changes in retained earnings will be reflected in lease rates for FY 2012 and FY 2013. • Retained earnings for the repair and other jobs activity increased in FY 2009 and FY 2010 due to lower than
anticipated expenses and increased revenue. • Retained earnings for the materials transfer decreased in FY 2009 and FY 2010 due to lower than anticipated
billable hours. • Retained earnings for the central mail activity increased in FY 2009 due to higher than anticipated sales and
increased in FY 2010 due to lower than anticipated expenses. • Retained earnings for Minnesota’s Bookstore decreased in FY 2009 and FY 2010 due to lower than
anticipated sales.
History of Rate Changes: Fiscal Year 2006 2007 2008 2009 2010 2011
Leases (4.79%) 4.61% (1.04%) 0.72% 0.31% (0.69)% Repair and Other Jobs 10.41% 0.00% 9.17% 0.00% 4.80% 0.00% Materials Transfer 1.90% 0.00% 0.00% 0.00% 3.90% 57.3% Central Mail 1.40% 0.00% 0.00% 0.00% 0.00% 0.00% Minnesota’s Bookstore (State Register)
0.00%
0.00%
0.00%
(5.56%)
0.00%
0.00%

ADMINISTRATION DEPT
Program: GOVT AND CITIZEN SERVICES Activity: PLANT MANAGEMENT Narrative
State of Minnesota Page 55 2012-13 Biennial Budget Background 2/15/2011
Impact of Rate Changes: • Assuming the same volume and mix of goods/services as FY 2010, the five largest Lease customers will pay
0.23% less in FY 2011. • Assuming the same volume and mix of goods/services as FY 2010, the five largest Repair and Other Jobs
customers will pay the same amount in FY 2011. • Assuming the same volume and mix of goods/services as FY 2009, the five largest Materials Transfer
customers will pay approximately 38% more in FY 2011. (Materials Transfer rates became effective November 1, 2010.)
• Assuming the same volume and mix of goods/services as FY 2010, Central Mail’s five largest customers will pay the same amount in FY 2011. Assuming the same volume and mix of goods/services as FY 2010, the State Register’s five largest customers will pay the same amount in FY2011.
In addition to the ISF, PMD receives a general fund appropriation for mail delivery services. PMD also receives revenue from parking fees.
Contact Director Phone: (651) 201-2350 Web site: http://www.admin.state.mn.us/pmd

ADMINISTRATION DEPT
Program: GOVT AND CITIZEN SERVICES Activity: PLANT MANAGEMENT Narrative
State of Minnesota Page 56 2012-13 Biennial Budget Background 2/15/2011
Plant Management Internal Service Fund Fund Financial Statement (Dollars in thousands)
* OPERATIONS DATA * ACTUAL PROJECTED PROJECTED PROJECTED FY 2010 FY 2011 FY 2012 FY 2013
OPERATING REVENUES: NET SALES 63,566 64,472 61,295 61,700 LESS: COST OF SALES
GROSS PROFIT ON SALES 63,566 64,472 61,295 61,700 OTHER REVENUE 1,182 1,182 1,354 1,432
NET REVENUES 64,748 65,654 62,649 63,132
LESS: OPERATING EXPENSES: SALARIES 14,722 14,692 13,994 14,669 SUPPLIES & EXPENSES 14,291 19,566 19,052 19,808 INDIRECT COSTS 674 1,105 1,057 1,073 AMORTIZATION & DEPRECIATION 313 210 183 223
TOTAL OPERATING EXPENSES 30,001 35,573 34,286 35,773
OPERATING INCOME (LOSS) 34,747 30,081 28,363 27,359
NON-OPERATING REVENUES (EXPENSES) (28,213) (28,056) (27,800) (27,734)
NET INCOME (LOSS) 6,534 2,025 563 (375)
BEGINNING RETAINED EARNINGS 10,491 20,786 22,811 23,373
PRIOR PERIOD ADJUSTMENT 3,761 0 0 0
ENDING RETAINED EARNINGS 20,786 22,811 23,373 22,999
RATE INCREASE/(DECREASE): Leases 0.31% -0.69% -2.40% 0.60% Materials Transfer 3.90% 57.30% 0.00% 0.00% ROJ 4.80% 0.00% 0.00% 0.00%
FTE 242.6 240.4 231.9 235.4
Expenditure Reconciliation to BBS Operating Expenses 34,286 35,773 Less amortization & depreciation (non-cash) (183) (223) Plus payments for debt service, equipment, and resource recovery closure 12,766 12,543 Less adjustment for inter-agency transfer in (335) (335) Total cash payments 46,534 47,758 BBS Amounts - Financing by Fund plus Change Item - Transfer Out Plant Management 46,534 47,758
Receipt Reconciliation to BBS Net Sales 61,295 61,700 Plus Other Revenue 1,354 1,432 Less adjustment for inter-agency transfer in (335) (335) Total cash receipts 62,314 62,797 BBS Amounts - Revenue Collected Plant Management 62,314 62,797
Note: The Non-operating revenues/expenses relate to building depreciation and bond interest which are transferred out. It also includes debt service, gain/loss on sale of capital assets, and resource recovery closure.

ADMINISTRATION DEPT
Program: GOVT AND CITIZEN SERVICES Activity: PLANT MANAGEMENT Narrative
State of Minnesota Page 57 2012-13 Biennial Budget Background 2/15/2011
Plant Management Internal Service Fund Fund Financial Statement
* FINANCIAL DATA * ACTUAL ESTIMATED FY 2010 FY 2011
ASSETS:
CURRENT ASSETS:
CASH 19,730 19,721 OTHER CURRENT ASSETS 745 1,000
TOTAL CURRENT ASSETS 20,475 20,721
NON-CURRENT ASSETS: 4,885 4,926
TOTAL ASSETS 25,360 25,646
LIABILITIES & FUND EQUITY:
LIABILITIES:
CURRENT LIABILITIES: DUE GENERAL FUND - CURRENT 0 0 MASTER LEASE - CURRENT 0 0 OTHER CURRENT LIABILITIES 2,480 1,375
TOTAL CURRENT LIABILITIES 2,480 1,375
NON-CURRENT LIABILITIES: DUE GENERAL FUND - NON-CURRENT 0 0 MASTER LEASE - NON-CURRENT 0 0 OTHER NON-CURRENT LIABILITIES 1,583 950
TOTAL NON-CURRENT LIABILITIES 1,583 950 TOTAL LIABILITIES 4,064 2,325
FUND EQUITY:
CONTRIBUTED CAPITAL-GENERAL FUND 511 511
RETAINED EARNINGS 20,786 22,811
TOTAL FUND EQUITY 21,296 23,322
TOTAL LIABILITIES & FUND EQUITY 25,360 25,646

ADMINISTRATION DEPT
Program: GOVT AND CITIZEN SERVICES Activity: PLANT MANAGEMENT Narrative
State of Minnesota Page 58 2012-13 Biennial Budget Background 2/15/2011
Minnesota’s Bookstore Internal Service Fund Fund Financial Statement (Dollars in thousands)
* OPERATIONS DATA * ACTUAL PROJECTED PROJECTED PROJECTED FY 2010 FY 2011 FY 2012 FY 2013
OPERATING REVENUES: NET SALES 1,117 1,383 1,409 1,436 LESS: COST OF SALES 258 337 338 345
GROSS PROFIT ON SALES 860 1,046 1,071 1,091 OTHER REVENUE 0 0 0 0
NET REVENUES 860 1,046 1,071 1,091
LESS: OPERATING EXPENSES: SALARIES 660 748 723 740 SUPPLIES & EXPENSES 243 239 248 252 INDIRECT COSTS 51 52 53 54 AMORTIZATION & DEPRECIATION 7 7 7 7
TOTAL OPERATING EXPENSES 960 1,046 1,031 1,053
OPERATING INCOME (LOSS) (101) (0) 40 38
NON-OPERATING REVENUES (EXPENSES)
0 0 0 0
NET INCOME (LOSS) (101) (0) 40 38
BEGINNING RETAINED EARNINGS 708 609 609 649
PRIOR PERIOD ADJUSTMENT 2 0 0 0
ENDING RETAINED EARNINGS 609 609 649 687 FOOTNOTES TO STATEMENTS: Statements include both the Bookstore and the State Register.
RATE INCREASE/(DECREASE): 0.00% 0.00% 0.00% 0.00%
FTE 10 11 10.7 10.7 Expenditure Reconciliation to BBS
Operating Expenses 1,031 1,053 Less amortization & depreciation (non cash)
(7) (7)
Plus purchase of items for resale (cost of goods sold)
338 345
Total cash payments 1,362 1,391 BBS Amounts - Financing by Fund Minnesota's Bookstore 1,362 1,391
Receipt Reconciliation to BBS Net Sales 1,409 1,436 BBS Amounts - Revenue Collected Minnesota's Bookstore 1,409 1,436

ADMINISTRATION DEPT
Program: GOVT AND CITIZEN SERVICES Activity: PLANT MANAGEMENT Narrative
State of Minnesota Page 59 2012-13 Biennial Budget Background 2/15/2011
Minnesota’s Bookstore Internal Service Fund Fund Financial Statement
* FINANCIAL DATA * ACTUAL ESTIMATED FY 2010 FY 2011
ASSETS:
CURRENT ASSETS:
CASH 545 548 OTHER CURRENT ASSETS 542 550
TOTAL CURRENT ASSETS 1,087 1,098
NON-CURRENT ASSETS: 39 32
TOTAL ASSETS 1,126 1,130
LIABILITIES & FUND EQUITY:
LIABILITIES:
CURRENT LIABILITIES: DUE GENERAL FUND - CURRENT 0 0 MASTER LEASE - CURRENT 0 0 OTHER CURRENT LIABILITIES 93 95
TOTAL CURRENT LIABILITIES 93 95
NON-CURRENT LIABILITIES: DUE GENERAL FUND - NON-CURRENT 0 0 MASTER LEASE - NON-CURRENT 0 0 OTHER NON-CURRENT LIABILITIES 131 133
TOTAL NON-CURRENT LIABILITIES 131 133 TOTAL LIABILITIES 224 228
FUND EQUITY:
CONTRIBUTED CAPITAL 293 293
RETAINED EARNINGS 609 609
TOTAL FUND EQUITY 902 902
TOTAL LIABILITIES & FUND EQUITY 1,126 1,130

ADMINISTRATION DEPT
Program: GOVT AND CITIZEN SERVICES Activity: PLANT MANAGEMENT Narrative
State of Minnesota Page 60 2012-13 Biennial Budget Background 2/15/2011
Central Mail Internal Service Fund Fund Financial Statement (Dollars in thousands)
* OPERATIONS DATA * ACTUAL ESTIMATED PROJECTED PROJECTED FY 2010 FY 2011 FY 2012 FY 2013
OPERATING REVENUES: NET SALES 8,808 8,806 9,114 9,411 LESS: COST OF SALES 0 0 0 0
GROSS PROFIT ON SALES 8,808 8,806 9,114 9,411 OTHER REVENUE
NET REVENUES 8,808 8,806 9,114 9,411
LESS: OPERATING EXPENSES: SALARIES 396 425 443 474 SUPPLIES & EXPENSES 8,255 8,411 8,628 8,893 INDIRECT COSTS 42 42 43 44 AMORTIZATION & DEPRECIATION 24 24 24 24
TOTAL OPERATING EXPENSES 8,715 8,902 9,138 9,435
OPERATING INCOME (LOSS) 92 (96) (24) (24)
NON-OPERATING REVENUES (EXPENSES) 0 0 0 0
NET INCOME (LOSS) 92 (96) (24) (24)
BEGINNING RETAINED EARNINGS 1,447 1,540 1,444 1,420
PRIOR PERIOD ADJUSTMENT 0 0 0 0
ENDING RETAINED EARNINGS 1,540 1,444 1,420 1,397
RATE INCREASE/(DECREASE): 0.00% 0.00% 7.95% 5.64%
FTE 6.9 7.3 7.5 7.8
Expenditure Reconciliation to BBS Operating Expenses 9,138 9,435 Less amortization & depreciation (non cash) (24) (24) Plus inventory Total cash payments 9,114 9,411
BBS Amounts - Financing by Fund Central Mail 9,114 9,411
Receipt Reconciliation to BBS Net Sales 9,114 9,411 Plus interest revenue from Non-operating revenue/expenses 0 0 Total cash receipts 9,114 9,411 BBS Amounts - Revenue Collected Central Mail 9,114 9,411

ADMINISTRATION DEPT
Program: GOVT AND CITIZEN SERVICES Activity: PLANT MANAGEMENT Narrative
State of Minnesota Page 61 2012-13 Biennial Budget Background 2/15/2011
Central Mail Internal Service Fund Fund Financial Statement
* FINANCIAL DATA * ACTUAL ESTIMATED FY 2010 FY 2011
ASSETS:
CURRENT ASSETS:
CASH 33 20 OTHER CURRENT ASSETS 1,620 1,600
TOTAL CURRENT ASSETS 1,653 1,620
NON-CURRENT ASSETS: 74 51
TOTAL ASSETS 1,727 1,671
LIABILITIES & FUND EQUITY:
LIABILITIES:
CURRENT LIABILITIES: DUE GENERAL FUND - CURRENT 0 0 MASTER LEASE - CURRENT 0 0 OTHER CURRENT LIABILITIES 63 106
TOTAL CURRENT LIABILITIES 63 106
NON-CURRENT LIABILITIES: DUE GENERAL FUND - NON-CURRENT 0 0 MASTER LEASE - NON-CURRENT 0 0 OTHER NON-CURRENT LIABILITIES 59 55
TOTAL NON-CURRENT LIABILITIES 59 55 TOTAL LIABILITIES 121 161
FUND EQUITY:
CONTRIBUTED CAPITAL 66 66
RETAINED EARNINGS 1,540 1,444
TOTAL FUND EQUITY 1,606 1,510
TOTAL LIABILITIES & FUND EQUITY 1,727 1,671
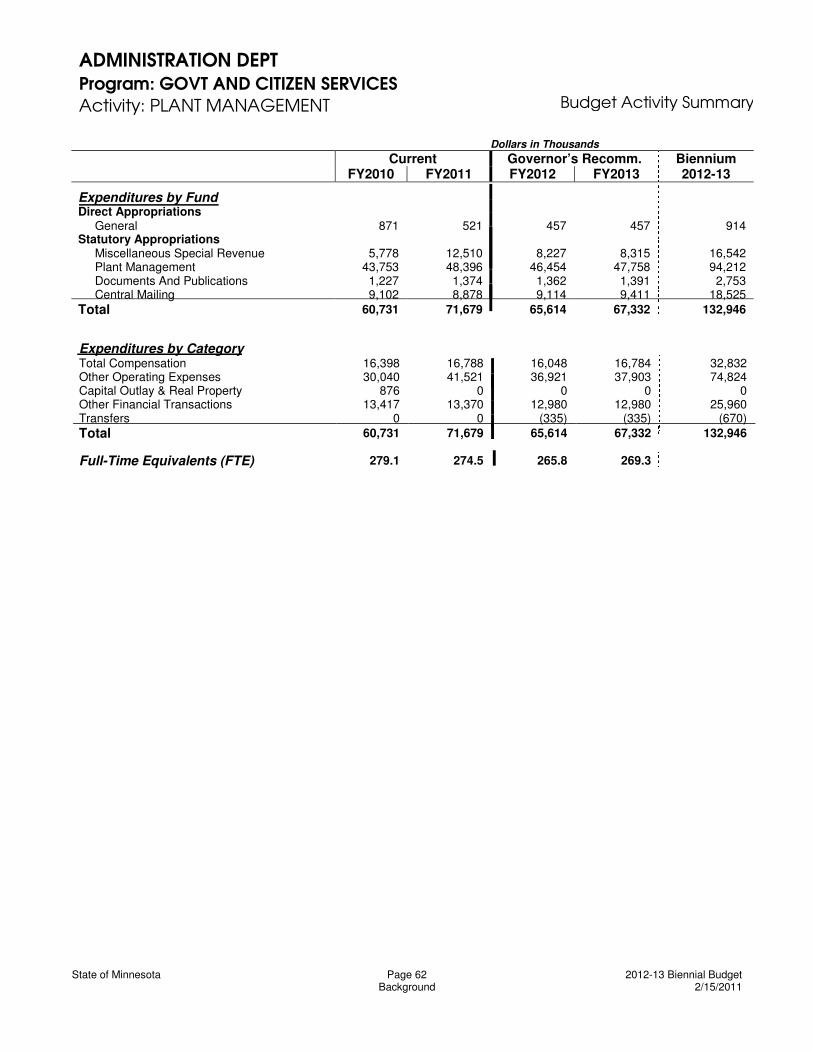
ADMINISTRATION DEPT Program: GOVT AND CITIZEN SERVICES Activity: PLANT MANAGEMENT Budget Activity Summary
Dollars in Thousands
Current Governor’s Recomm. Biennium FY2010 FY2011 FY2012 FY2013 2012-13
State of Minnesota Page 62 2012-13 Biennial Budget Background 2/15/2011
D irect A p p ro p ri at io n s b y F u n d
Expenditures by Fund
Direct Appropriations
General 871 521
457 457 914 Statutory Appropriations
Miscellaneous Special Revenue 5,778 12,510
8,227 8,315 16,542 Plant Management 43,753 48,396
46,454 47,758 94,212 Documents And Publications 1,227 1,374
1,362 1,391 2,753 Central Mailing 9,102 8,878 9,114 9,411 18,525 Total 60,731 71,679 65,614 67,332 132,946
Expenditures by Category
Total Compensation 16,398 16,788
16,048 16,784 32,832 Other Operating Expenses 30,040 41,521
36,921 37,903 74,824 Capital Outlay & Real Property 876 0
0 0 0 Other Financial Transactions 13,417 13,370
12,980 12,980 25,960 Transfers 0 0 (335) (335) (670) Total 60,731 71,679 65,614 67,332 132,946
Full-Time Equivalents (FTE) 279.1 274.5
265.8 269.3
ADMINISTRATION DEPT
Program: GOVT AND CITIZEN SERVICES Activity: REAL ESTATE AND CONSTR SERVICE Narrative
State of Minnesota Page 63 2012-13 Biennial Budget Background 2/15/2011
Activity Description This activity provides a broad range of real estate services and construction services to achieve facility solutions that help state agencies deliver efficient and effective services. The following are key Minnesota Statutes (M.S.) citations applicable to Real Estate and Construction Services (RECS): 16A.632, 16B.05, 16B.24, 16B.25, 16B.26, 16B.281, 16B.282, 16B.283, 16B.284, 16B.286, 16B.287, 16B.30, 16B.305, 16B.31, 16B.32, 16B.322, 16B.325, 16B.33, 16B.335, 16B.35, 16C.08, 16C.095, 16C.10, 16C.14, 16C.32, 16C.33, 16C.34, and 216B.241.
Population Served The activity provides services to state agencies with custodial control of state-owned buildings and to approximately 100 state agencies, divisions, boards, and councils located in leased facilities. Property types include office, storage, warehouse, workforce centers, residential facilities, treatment centers, correctional facilities, emergency services, training centers, environmental services, communication facilities, laboratories, driver vehicle services, licensing centers, and state veterans homes.
Services Provided The activity • Manages and oversees building planning, design and construction for new, remodeling, and asset
preservation building projects • Manages statewide capital asset preservation and replacement funds • Manages hazardous materials surveys and abatement projects • Manages the statewide predesign program, maintains the predesign manual, and reviews/approves
submittals • Provides oversight of the statewide facility condition audit • Provides staff support for, and is a member of, the State Designer Selection Board (SDSB) • Develops and maintains building design guidelines • Oversees Minnesota Sustainable Building Guidelines and Benchmarking Tool (B3) programs • Manages Public Buildings Enhanced Energy Efficiency Program (PBEEEP) • Administers the Enterprise Total Infrastructure Facility Management System (E-TIFM) • Participates in enterprise real property governance initiatives • Identifies state-owned and nonstate-owned real property that efficiently and functionally meets agencies’
space needs • Negotiates and drafts leases of state-owned and nonstate-owned real property to house state agencies in
quality spaces at the most economical rental rates • Provides space programming and monitoring of leasehold improvement construction • Manages leases to assure compliance with terms and conditions including resolving day-to-day issues • Provides relocation assistance including preparing funding requests, managing budgets, and coordination • Generates revenue by leasing state-owned real property temporarily not needed for state use • Assists agencies in site selection, oversees the due diligence process (appraisals, surveys, inspections,
environmental assessments, and geo-technical reports), and negotiates acquisition of real property • Manages the disposition of state surplus real property in manner that maximizes return to the state • Develops and issues easements and permits, and coordinates transfers custodial control of real property
between agencies • Maintains databases of leases, floor plans, space management inventories, and state-owned land inventories
for internal and external use
Activity at a Glance Real Estate and Construction Services • Manages 996 nonstate-owned and state-owned real
property leases • Leases 3.6 million useable square feet of nonstate-
owned space and other real property at an annual cost of $63.4 million
• Leases 2.1 million useable square feet of state-owned space under the custodial control of Administration (Admin)
• Manages over 430 remodeling/repair/new building projects
• Oversees over $166 million in capital appropriations

ADMINISTRATION DEPT
Program: GOVT AND CITIZEN SERVICES Activity: REAL ESTATE AND CONSTR SERVICE Narrative
State of Minnesota Page 64 2012-13 Biennial Budget Background 2/15/2011
Historical Perspective Minnesota state agencies have extensive and diverse real estate needs. The state owns 30 million square feet in more than 4,000 buildings and managed by 20 custodial agencies. In addition, Admin currently leases 3.6 million useable square feet of nonstate-owned space for over 100 state agencies, boards, and councils.
Real Estate Services (RES) and the State Architect’s Office (SAO) combined in FY 2008 to form RECS. Combining the two organizations created efficiencies in support functions and facilitated comprehensive end-to-end services to statewide customers. The Department of Administration previously provided more energy management services to state agencies. While these efforts have been scaled back in recent years, RECS continues to receive a small appropriation to support a limited number of energy related projects and initiatives.
Consolidation and co-location of agencies remains a priority. The result of these efforts has been to conserve resources by sharing space, equipment, and staff. Consolidation and co-location also offer the public the ability to obtain products and services and to conduct more than one transaction at a visible, accessible, easily identifiable location. Consolidation and co-location also facilitate transportation pools that lead to conserving resources, better accessibility, reducing pollution, and controlling parking development costs.
The Enterprise Total Infrastructure Facility Management (E-TIFM) system is providing the state with a web-enabled, shared repository to facilitate more efficient and effective oversight and stewardship of the state’s real estate assets.
Key Activity Goals & Measures Admin Goal – To reduce costs by working across government (http://www.admin.state.mn.us/admin.html) RECS Goal: Reduce rent costs by negotiating leases effectively. Measure: lease rates on average for nonstate-owned property will not increase more than 2% per year.
FY 2006 FY 2007 FY 2008 FY 2009 FY 2010 1.09% 2.0% 1.0% 2.0% 1.0%
Admin Goal – To provide our customers with valuable services, products, advice, and expertise (http://www.admin.state.mn.us/admin.html) RECS Goal: Improve energy conservation and efficiency in state buildings. Measure: Conduct energy audits in at least 5% of state-owned buildings each fiscal year.
Activity Funding This activity is primarily funded through general fund appropriations. In addition, some funding is received by charging direct project management services to projects. Funding for projects managed by RECS is from general obligation bonds, general funds, special revenue funds, federal funds, matching grants, and gift funds. RECS also assists agencies with repair and restoration projects that are funded through agency operating budgets.
Contact Director Phone: (651) 201-2548 http://www.admin.state.mn.us/recs

ADMINISTRATION DEPT Program: GOVT AND CITIZEN SERVICES Activity: REAL ESTATE AND CONSTR SERVICE Budget Activity Summary
Dollars in Thousands
Current Governor’s Recomm. Biennium FY2010 FY2011 FY2012 FY2013 2012-13
State of Minnesota Page 65 2012-13 Biennial Budget Background 2/15/2011
D irect A p p ro p ri at io n s b y F u n d
Expenditures by Fund
Carry Forward
General 279 540
10 0 10 Direct Appropriations
General 2,753 3,598
3,120 3,075 6,195 Miscellaneous Special Revenue 0 250
0 0 0 Statutory Appropriations
Miscellaneous Special Revenue 838 1,079
724 675 1,399 Federal 140 0
0 0 0 Federal Stimulus 85 2,500
4,237 0 4,237 Gift 51 0 0 0 0 Total 4,146 7,967 8,091 3,750 11,841
Expenditures by Category
Total Compensation 2,081 2,021 2,015 2,018 4,033 Other Operating Expenses 1,853 5,606 6,066 1,732 7,798 Capital Outlay & Real Property 212 340 10 0 10 Total 4,146 7,967 8,091 3,750 11,841
Full-Time Equivalents (FTE) 22.7 21.8 21.3 20.6

ADMINISTRATION DEPT
Program: GOVT AND CITIZEN SERVICES Activity: RISK MANAGEMENT Narrative
State of Minnesota Page 66 2012-13 Biennial Budget Background 2/15/2011
Activity Description The Risk Management Division (RMD), operating under legislative authority of M.S. 16B.85 and M.S. Chapter 176, provides two basic areas of service. • Multiple lines of property and casualty insurance coverage and
other insurance programs for state agencies at below-market cost through the Risk Management Fund (RMF)
• Workers’ compensation program for all state employees
Population Served The division’s property and casualty insurance program serves state agencies, boards, commissions, and political subdivisions.
The division’s workers’ compensation program serves state employees in the executive, legislative, and judicial branches and in quasi-state agencies such as the Minnesota Historical Society and the Minnesota State Fair.
Services Provided The RMF offers five major lines of insurance:
• auto liability • property • auto comprehensive and collision • boiler and machinery • general liability
The RMF also offers other miscellaneous lines that are customized to meet specific agency needs. When unique types of coverage are required, the division assists state agencies with purchasing appropriate insurance if self-insurance of the risk is not deemed appropriate for the RMF. Reinsurance is purchased to protect the RMF against catastrophic or annual aggregation of property and extra-territorial liability losses.
Under M.S. 16B.85, the division has other responsibilities such as evaluating risk exposures, coordinating statewide risk management, and identifying ways to eliminate redundant efforts in risk management and insurance programs.
The workers’ compensation program provides services through four distinct units: claims management, legal services, disability management, and safety and loss control. • The claims management unit works with injured employees, agencies, the Department of Labor and Industry
(DLI), rehabilitation and vocational specialists, medical providers, and others to determine compensability, administer the law, and resolve state employee workers’ compensation claims.
• The legal services unit represents state agencies in workers’ compensation court cases. • The disability management unit works with injured employees, agencies, rehabilitation and vocational
specialists, medical providers, and others to help state workers who have been hurt or disabled on the job to return to active employment as quickly and safely as possible.
• The safety and loss control unit works with the statewide safety committee and individual agency safety committees to address widely varied workplace safety and health issues. These include materials handling, air quality, hazardous materials, blood-borne pathogens, biological hazards, and office ergonomics.
Historical Perspective The legislature created two separate funds currently administered by the division. The following provides a historical summary of each fund. Risk Management Fund The state’s property and casualty programs are supported entirely by the RMF. The fund was created in 1986 largely due to the state’s difficulty obtaining auto liability insurance in the commercial market. The RMF allows the commissioner of Administration (Admin) to offer state agencies alternatives to purchasing conventional insurance. Historical development of the fund is as follows • First general liability insurance underwritten by the RMF in 1988. • Automobile comprehensive and collision insurance available soon after. • Full line of property and casualty insurance coverage added with the creation of Minnesota State Colleges
and Universities (MnSCU).
Activity at a Glance • More than $12 billion in property
values insured • 13,400 vehicles insured • Approximately 60,000 employees
served in the executive, legislative, and judicial branches of state government and in quasi-state agencies such as the Minnesota State Fair
• 2,691 workers’ compensation claims were filed in FY2009
• Co-sponsors an annual State Safety and Loss Control Conference for state agencies and MnSCU.
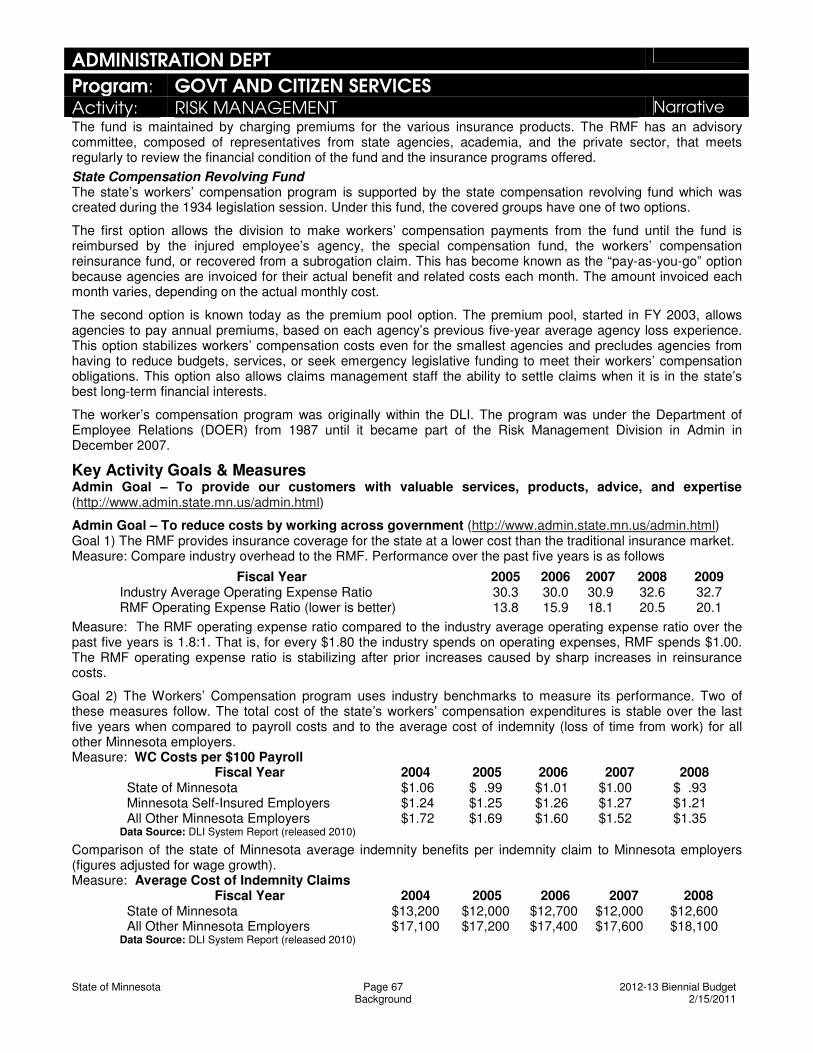
ADMINISTRATION DEPT
Program: GOVT AND CITIZEN SERVICES Activity: RISK MANAGEMENT Narrative
State of Minnesota Page 67 2012-13 Biennial Budget Background 2/15/2011
The fund is maintained by charging premiums for the various insurance products. The RMF has an advisory committee, composed of representatives from state agencies, academia, and the private sector, that meets regularly to review the financial condition of the fund and the insurance programs offered. State Compensation Revolving Fund The state’s workers’ compensation program is supported by the state compensation revolving fund which was created during the 1934 legislation session. Under this fund, the covered groups have one of two options.
The first option allows the division to make workers’ compensation payments from the fund until the fund is reimbursed by the injured employee’s agency, the special compensation fund, the workers’ compensation reinsurance fund, or recovered from a subrogation claim. This has become known as the “pay-as-you-go” option because agencies are invoiced for their actual benefit and related costs each month. The amount invoiced each month varies, depending on the actual monthly cost.
The second option is known today as the premium pool option. The premium pool, started in FY 2003, allows agencies to pay annual premiums, based on each agency’s previous five-year average agency loss experience. This option stabilizes workers’ compensation costs even for the smallest agencies and precludes agencies from having to reduce budgets, services, or seek emergency legislative funding to meet their workers’ compensation obligations. This option also allows claims management staff the ability to settle claims when it is in the state’s best long-term financial interests.
The worker’s compensation program was originally within the DLI. The program was under the Department of Employee Relations (DOER) from 1987 until it became part of the Risk Management Division in Admin in December 2007.
Key Activity Goals & Measures Admin Goal – To provide our customers with valuable services, products, advice, and expertise (http://www.admin.state.mn.us/admin.html)
Admin Goal – To reduce costs by working across government (http://www.admin.state.mn.us/admin.html) Goal 1) The RMF provides insurance coverage for the state at a lower cost than the traditional insurance market. Measure: Compare industry overhead to the RMF. Performance over the past five years is as follows
Measure: The RMF operating expense ratio compared to the industry average operating expense ratio over the past five years is 1.8:1. That is, for every $1.80 the industry spends on operating expenses, RMF spends $1.00. The RMF operating expense ratio is stabilizing after prior increases caused by sharp increases in reinsurance costs.
Goal 2) The Workers’ Compensation program uses industry benchmarks to measure its performance. Two of these measures follow. The total cost of the state’s workers’ compensation expenditures is stable over the last five years when compared to payroll costs and to the average cost of indemnity (loss of time from work) for all other Minnesota employers. Measure: WC Costs per $100 Payroll
Fiscal Year 2004 2005 2006 2007 2008 State of Minnesota $1.06 $ .99 $1.01 $1.00 $ .93 Minnesota Self-Insured Employers $1.24 $1.25 $1.26 $1.27 $1.21 All Other Minnesota Employers $1.72 $1.69 $1.60 $1.52 $1.35
Data Source: DLI System Report (released 2010)
Comparison of the state of Minnesota average indemnity benefits per indemnity claim to Minnesota employers (figures adjusted for wage growth). Measure: Average Cost of Indemnity Claims
Fiscal Year 2004 2005 2006 2007 2008 State of Minnesota $13,200 $12,000 $12,700 $12,000 $12,600 All Other Minnesota Employers $17,100 $17,200 $17,400 $17,600 $18,100
Data Source: DLI System Report (released 2010)
Fiscal Year 2005 2006 2007 2008 2009 Industry Average Operating Expense Ratio 30.3 30.0 30.9 32.6 32.7 RMF Operating Expense Ratio (lower is better) 13.8 15.9 18.1 20.5 20.1

ADMINISTRATION DEPT
Program: GOVT AND CITIZEN SERVICES Activity: RISK MANAGEMENT Narrative
State of Minnesota Page 68 2012-13 Biennial Budget Background 2/15/2011
Activity Funding The property and casualty program operates as an internal service fund, charging fees based on insurance options requested by customers. No money is appropriated for division operations from the general fund. The property and casualty program has 10 full-time employees on 7-1-10.
The workers’ compensation program operates as a special revenue fund. The cost to administer the program is allocated across all state agencies based on the number of employees, open claims, and transactions for each agency. This fee covers all of the administrative costs for claims management, administrative support, and safety and loss control services.
An open general fund appropriation pays for the state’s annual Workers’ Compensation Reinsurance (WCRA) premium.
Operating Losses/Increases in Retained Earnings: Retained earnings for the property and casualty program decreased by $1,607,666 in FY 2009. This decrease is due to large property claim losses and large dividend payments over the biennium. The FY 2009 policyholder surplus is $6.3 million.
Dividends represent the return of premium for superior loss and expense experience. Premiums collected are invested by the State Board of Investment (SBI). The difference between premium and investment, less deductions for losses incurred and administrative expenses, equals the amount of funds that are eligible for dividend declaration. In the event of unsatisfactory experience, it is possible that no dividend would be declared.
In FY 2010, the Advisory Committee approved a dividend payment of $605,233. The RMF has returned more than $16 million in dividends to policyholders over the past 22 years.
The workers’ compensation premium pool experienced a deficit of $119,268 in FY 2009. This amount will be added to the premiums paid by agencies participating in the pool in FY 2011.
History of Rate Changes: Fiscal Year 2006 2007 2008 2009 2010 2011
Rate Change (by line) Auto Liability 7.47% 8.24% 10.67% .00% 11.60% .00% Auto Physical Damage .00% 1.37% (2.81%) .00% (12.55%) .00% General Liability .00% .00% .00% .00% .00% .00% Property (21.05%) .00% .00% .00% 5.00% .00% Other 00% .00% .00% .00% .00% .00% Rate Change Average (13.80%) 2.37% 2.43% .00% 4.50% .00%
Factors contributing to changes in premium rates • loss experience variation • increased claim potential due to additional volume • increased risk management, safety and loss control • fluctuations of the reinsurance marketplace
The workers’ compensation program’s administrative fee has remained unchanged since FY 2004. Fiscal Year 2006 2007 2008 2009 2010 2011
Administrative Fee $2.5M $2.5M $2.5M $2.5M $2.5M $2.5M
Impact of Rate Changes: Assuming the same volume and mix of services as FY 2010, customers will pay the same amount in FY 2011.
Contact Director Phone: (651) 201-2585 Email: http://www.admin.state.mn.us/risk Annual reports online: http://www.admin.state.mn.us/risk/publications.html.

ADMINISTRATION DEPT
Program: GOVT AND CITIZEN SERVICES Activity: RISK MANAGEMENT Narrative
State of Minnesota Page 69 2012-13 Biennial Budget Background 2/15/2011
INTERNAL SERVICE FUND FINANCIAL STATEMENT (DOLLARS IN THOUSANDS) * OPERATIONS DATA *
ACTUAL PROJECTED PROJECTED PROJECTED FY 2010 FY 2011 FY 2012 FY 2013
OPERATING REVENUES: NET SALES 12,164 11,996 12,204 12,459 LESS: COST OF SALES
GROSS PROFIT ON SALES 12,164 11,996 12,204 12,459 OTHER REVENUE
NET REVENUES 12,164 11,996 12,204 12,459
LESS: OPERATING EXPENSES: CLAIMS 5,354 5,727 6,024 6,174 SALARIES 848 941 945 964 SUPPLIES & EXPENSES 5,087 5,099 5,114 5,134 INDIRECT COSTS 64 83 83 83 AMORTIZATION & DEPRECIATION 0 62 62 62
TOTAL OPERATING EXPENSES 11,352 11,912 12,228 12,417
OPERATING INCOME (LOSS) 811 84 (24) 42
NON-OPERATING REVENUES (EXPENSES)
(456) (307) (550) (650)
NET INCOME (LOSS) 355 (223) (574) (608)
BEGINNING RETAINED EARNINGS 6,299 6,654 6,431 5,857
PRIOR PERIOD ADJUSTMENT 0 0 0 0
ENDING RETAINED EARNINGS 6,654 6,431 5,857 5,249
RATE INCREASE/(DECREASE): 4.50% 0.00% 2.00% 2.00%
FTE 10.1 11.7 11.7 11.7
Expenditure Reconciliation to BBS Operating Expenses 12,228 12,417 Less amortization & depreciation (non-cash) 62 62 Plus dividend expense paid in same FY as declared 700 800 Total cash payments 12,866 13,155
BBS Amounts - Financing by Fund Risk Management 12,866 13,155
Receipt Reconciliation to BBS Net Revenues 12,204 12,459 Interest Income from Non-operating revenue/expenses 150 150 Total cash receipts 12,354 12,609
BBS Amounts - Revenue Collected Risk Management 12,354 12,609

ADMINISTRATION DEPT
Program: GOVT AND CITIZEN SERVICES Activity: RISK MANAGEMENT Narrative
State of Minnesota Page 70 2012-13 Biennial Budget Background 2/15/2011
INTERNAL SERVICE FUND FINANCIAL STATEMENT
* FINANCIAL DATA * ACTUAL ESTIMATED FY 2010 FY 2011
ASSETS:
CURRENT ASSETS:
CASH 18,151 17,575 OTHER CURRENT ASSETS 3,042 1,050
TOTAL CURRENT ASSETS 21,193 18,625
NON-CURRENT ASSETS: 594 634
TOTAL ASSETS 21,787 19,259
LIABILITIES & FUND EQUITY:
LIABILITIES:
CURRENT LIABILITIES: DUE GENERAL FUND - CURRENT 0 0 MASTER LEASE - CURRENT 0 0 OTHER CURRENT LIABILITIES 15,042 12,734
TOTAL CURRENT LIABILITIES 15,042 12,734
NON-CURRENT LIABILITIES: DUE GENERAL FUND - NON-CURRENT 0 0 MASTER LEASE - NON-CURRENT 0 0 OTHER NON-CURRENT LIABILITIES 91 95
TOTAL NON-CURRENT LIABILITIES 91 95 TOTAL LIABILITIES 15,133 12,829
FUND EQUITY:
CONTRIBUTED CAPITAL-GENERAL FUND 0 0
RETAINED EARNINGS 6,654 6,431
TOTAL FUND EQUITY 6,654 6,431
TOTAL LIABILITIES & FUND EQUITY 21,787 19,259

ADMINISTRATION DEPT Program: GOVT AND CITIZEN SERVICES Activity: RISK MANAGEMENT Budget Activity Summary
Dollars in Thousands
Current Governor’s Recomm. Biennium FY2010 FY2011 FY2012 FY2013 2012-13
State of Minnesota Page 71 2012-13 Biennial Budget Background 2/15/2011
Expenditures by Fund Open Appropriations General 842 2,468 1,942 1,990 3,932 Statutory Appropriations Miscellaneous Special Revenue 30,383 31,589 32,784 34,199 66,983 Risk Management 10,347 12,482 12,866 13,155 26,021 Total 41,572 46,539 47,592 49,344 96,936
Expenditures by Category Total Compensation 3,423 3,567 3,588 3,669 7,257 Other Operating Expenses 37,544 42,515 43,304 44,875 88,179 Other Financial Transactions 605 457 700 800 1,500 Total 41,572 46,539 47,592 49,344 96,936
Full-Time Equivalents (FTE) 40.9 44.5 44.5 44.5
ADMINISTRATION DEPT
Program: GOVT AND CITIZEN SERVICES Activity: SMART Narrative
State of Minnesota Page 72 2012-13 Biennial Budget Background 2/15/2011
Activity Description The Small Agency Resource Team (SmART) delivers consolidated and streamlined human resources and financial management services to small agencies, boards, and councils. SmART’s personnel strive to learn and understand the business needs of the groups they serve, enhancing opportunities for providing leadership and guidance. SmART provides sound policy advice, enabling effective informed decision-making by the small agencies, boards, and councils it serves.
Population Served Professional business support services are provided to small agencies, boards, and councils which enable them to focus on their core business functions.
Services Provided SmART business support services provided include
• position filling • classification determinations • bi-weekly payroll processing • advising on labor contract provisions • benefit administration • Family Medical Leave Act administration • labor relations
• purchasing • payment processing cash receipts • employee expense report processing • expenditure corrections/expense transfers • financial report distribution and review assistance • annual and biennial budget assistance • training
Historical Perspective SmART began receiving General Fund appropriations in FY 2007 to provide human resource and financial services to several agencies, boards, and councils. Consolidation of these services provides: • centralized service delivery to achieve economies of scale and skill; • efficient and cost effective business support functions; • common processes and a culture of continuous improvement; • service levels that support the needs of small agencies, boards, and councils; and • the opportunity for customers served to leverage SmART services to improve their operations and business
discipline.
Key Activity Goals & Measures Admin Goal – To provide our customers with valuable services, products, advice, and expertise (http://www.admin.state.mn.us/admin.html) Measure: Smart customers will rate the SmART Human Resources program at four or higher on a scale of one to five, with five as the highest value. SmART provides comprehensive human resource services to agencies that cannot afford their own human resource staff. As part of the SmART program, these agencies, boards, and councils will receive the same level of expertise as larger agencies and will have access to information to follow legal, contract, and Office of the Legislative Auditor guidelines. For FY 2010, SmART received an average score of 4.8. Measure: SmART customers will receive at least three training opportunities each year in order to remain current on human resource practices integral to their work. In the past year, customers have been invited to training sessions for the Department of Administration supervisors on interviewing, generational differences, Family and Medical Leave Act and Americans with Disabilities Act updates, and preventing sexual harassment. Measure: Purchase orders will be issued within two days of receipt of the purchase request from customers on no-bid purchases.
Fiscal Year 2008 2009 2010 2011 (est.) Days to Issue Purchase Order 1.7 1.8 2.2 1.5
Activity Funding This activity is funded through a general fund appropriation. This activity also receives funding through payments from agencies with collaborative agreements for SmART services. Contact Director Phone: (651) 201-2609 or (651) 201-2563 Website: http://www.admin.state.mn.us/fmr
Activity at a Glance • 13 small agencies, boards, and
councils receive human resource services
• 11 small agencies, boards, and councils receive financial management services

ADMINISTRATION DEPT Program: GOVT AND CITIZEN SERVICES Activity: SMART Budget Activity Summary
Dollars in Thousands
Current Governor’s Recomm. Biennium FY2010 FY2011 FY2012 FY2013 2012-13
State of Minnesota Page 73 2012-13 Biennial Budget Background 2/15/2011
D irect A p p ro p ri at io n s b y F u n d
Expenditures by Fund
Direct Appropriations
General 205 293
393 393 786 Statutory Appropriations
Miscellaneous Special Revenue 2 0 0 0 0 Total 207 293 393 393 786
Expenditures by Category
Total Compensation 180 199
332 332 664 Other Operating Expenses 27 94 61 61 122 Total 207 293 393 393 786
Full-Time Equivalents (FTE) 2.9 3.3
4.9 4.8

ADMINISTRATION DEPT
Program: GOVT AND CITIZEN SERVICES Activity: STAR Narrative
State of Minnesota Page 74 2012-13 Biennial Budget Background 2/15/2011
Activity Description The Minnesota System of Technology to Achieve Results (STAR) is federally funded by the Rehabilitation Services Administration in accordance with the Federal Assistive Technology Act of 1998, as amended (PL 108-364). The mission of the STAR program is to help all Minnesotans with disabilities gain access to and acquire the assistive technology (AT) they need to live, learn, work, and play. An AT device is any piece of equipment, or product system, whether acquired commercially off the shelf, modified or customized, that is used to increase, maintain, or improve the functional abilities of a person with a disability. The governor appoints the advisory council members; 71.4% of the members are individuals with disabilities or have a family member with a disability.
STAR works with consumers and providers to develop a statewide network of AT resources and provides Minnesotans access to AT for demonstration and loan prior to purchasing a device. STAR also provides AT training, technical assistance, public awareness, and statewide information and referral services.
Population Served According to 2004 Census estimates, nearly one in eight, or 12.2%, of Minnesota’s population has at least one form of disability. Approximately 566,000 Minnesotans between the ages of five and 64 had one or more disabilities and approximately 217,000 Minnesota adults 65 years old or older had one or more disabilities. These individuals often need assistance in performing daily activities or participating in community life. STAR conducts activities that promote the availability and benefits of assistive technology devices and services for these populations.
Services Provided STAR works to build collaborative relationships in the AT community and, along with its nonprofit partners, is working to provide statewide coverage of services. In addition, STAR works with state agencies and others in serving as a central clearinghouse for AT information. Device loan, device demonstration, device reuse • STAR’s five nonprofit partners loan AT devices to individuals with disabilities regardless of age or diagnosis.
Individuals with cerebral palsy, autism, cancer, or stroke survivors benefit from using the loan programs. Devices are loaned so individuals may try an AT device prior to purchase.
• STAR and five nonprofit partners provide AT demonstrations to individuals with disabilities, their families and the professionals who work with them. A demonstration compares features of similar AT devices in order to make a decision regarding the appropriateness of a specific AT device.
• When appropriate, STAR encourages the reutilization of AT and provides a website, www.mnstarte.org, where individuals may post AT for sale, donation, or exchange. STAR also contracted with five community organizations to refurbish gently used AT devices for reuse throughout Minnesota.
Collaboration, training, and technical assistance • STAR participates in collaborative efforts to increase awareness of and access to AT. Collaborative efforts
include working with the Department of Education’s Assistive Technology Leadership Team; the Department of Health’s Emergency Preparedness Committee; the Minnesota Disability Law Center Advisory Council; and the Minnesota Regions Assistive Technology Collaborative.
• STAR exhibits at community events, provides information to individuals and families, and conducts training sessions about using AT to live, learn, work, and play.
Public awareness and information and referral assistance • STAR provides information about AT to individuals who contact STAR either by phone or the web.
Activity at a Glance • 1,146 Assistive Technology (AT) devices were
loaned in 28 counties • 584 individuals received AT demonstrations • 381 Minnesotans saved $37,122 by
purchasing used rather than new AT • Four citizens saved $8,390 by purchasing
used AT from www.mnstarte.org • 2,418 citizens received AT information at 24
community events • 372 consumers, professionals, and family
members attended 22 training sessions • Over 2,330 Funding and Resources
Directories distributed • Technical assistance was provided to the
Technology Accessibility Advisory Committee (TAAC) for Web Accessibility and Accessible Information Technology Procurement
• 14 Minnesotans received Awards for Excellence for their work with or use of AT during an event at the capitol
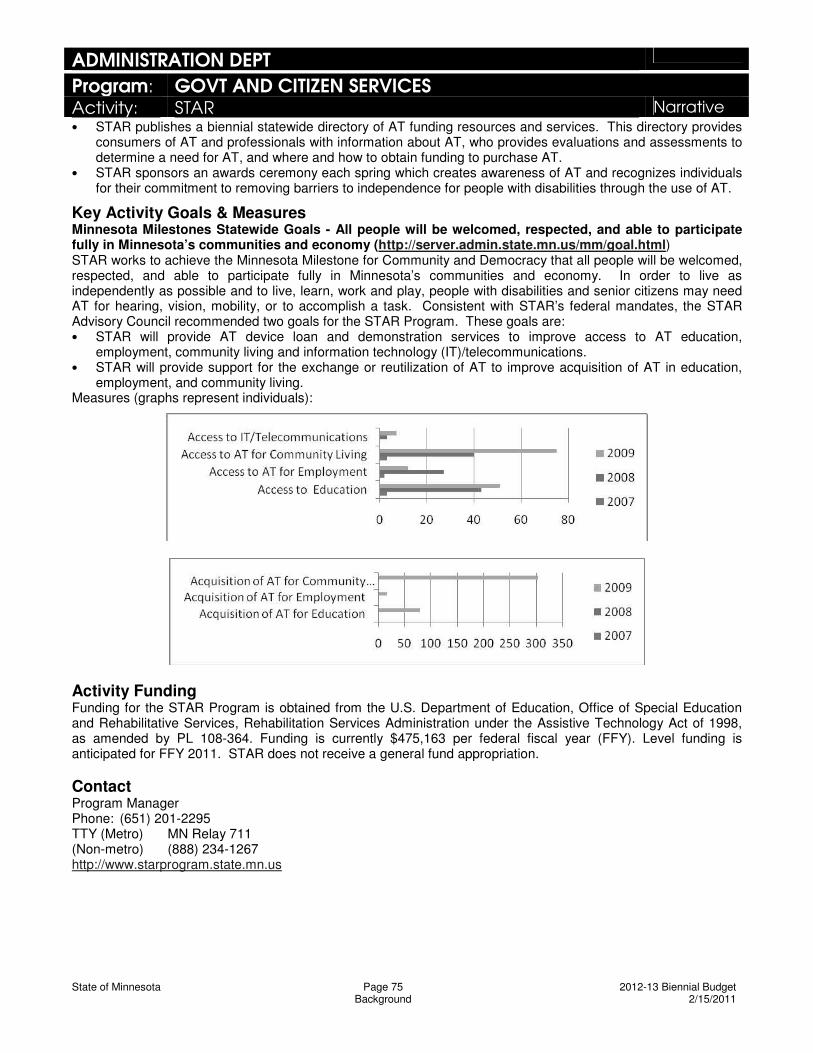
ADMINISTRATION DEPT
Program: GOVT AND CITIZEN SERVICES Activity: STAR Narrative
State of Minnesota Page 75 2012-13 Biennial Budget Background 2/15/2011
• STAR publishes a biennial statewide directory of AT funding resources and services. This directory provides consumers of AT and professionals with information about AT, who provides evaluations and assessments to determine a need for AT, and where and how to obtain funding to purchase AT.
• STAR sponsors an awards ceremony each spring which creates awareness of AT and recognizes individuals for their commitment to removing barriers to independence for people with disabilities through the use of AT.
Key Activity Goals & Measures Minnesota Milestones Statewide Goals - All people will be welcomed, respected, and able to participate fully in Minnesota’s communities and economy (http://server.admin.state.mn.us/mm/goal.html) STAR works to achieve the Minnesota Milestone for Community and Democracy that all people will be welcomed, respected, and able to participate fully in Minnesota’s communities and economy. In order to live as independently as possible and to live, learn, work and play, people with disabilities and senior citizens may need AT for hearing, vision, mobility, or to accomplish a task. Consistent with STAR’s federal mandates, the STAR Advisory Council recommended two goals for the STAR Program. These goals are: • STAR will provide AT device loan and demonstration services to improve access to AT education,
employment, community living and information technology (IT)/telecommunications. • STAR will provide support for the exchange or reutilization of AT to improve acquisition of AT in education,
employment, and community living. Measures (graphs represent individuals):
Activity Funding Funding for the STAR Program is obtained from the U.S. Department of Education, Office of Special Education and Rehabilitative Services, Rehabilitation Services Administration under the Assistive Technology Act of 1998, as amended by PL 108-364. Funding is currently $475,163 per federal fiscal year (FFY). Level funding is anticipated for FFY 2011. STAR does not receive a general fund appropriation.
Contact Program Manager Phone: (651) 201-2295 TTY (Metro) MN Relay 711 (Non-metro) (888) 234-1267 http://www.starprogram.state.mn.us

ADMINISTRATION DEPT Program: GOVT AND CITIZEN SERVICES Activity: STAR Budget Activity Summary
Dollars in Thousands
Current Governor’s Recomm. Biennium FY2010 FY2011 FY2012 FY2013 2012-13
State of Minnesota Page 76 2012-13 Biennial Budget Background 2/15/2011
Expenditures by Fund Statutory Appropriations Federal 501 484 482 482 964 Total 501 484 482 482 964
Expenditures by Category
Total Compensation 209 209 215 217 432 Other Operating Expenses 164 183 163 163 326 Local Assistance 128 90 104 102 206 Other Financial Transactions 0 2 0 0 0 Total 501 484 482 482 964
Full-Time Equivalents (FTE) 3.0 3.1 3.1 3.0

ADMINISTRATION DEPT
Program: GOVT AND CITIZEN SERVICES Activity: STATE DEMOGRAPHER Narrative
State of Minnesota Page 77 2012-13 Biennial Budget Background 2/15/2011
Activity Description The State Demographer’s Office provides demographic services as outlined in M.S. 4A.02 and below in “Services Provided.” This program is a unit within the Office of Geographic and Demographic Analysis.
Beginning in November 2010, the State Demographer will prepare annual long run projections of population and demographic characteristics and project the budget impact of major demographic changes.
The State Demographer’s Office also annually updates Minnesota Milestones indicators and prepares a biennial report on the state plan.
Population Served The state demographer serves state elected officials, state agencies, legislators, local governments, private citizens, and private sector organizations.
Services Provided Major service categories include • prepare annual population and household estimates of counties, cities, and townships • prepare or review other estimates, including for school districts and municipal boundary changes • periodically prepare population and related projections for the state and sub areas • analyze the impact of demographic change on state government budgets and programs • act as liaison with the U.S. Census Bureau • continuously monitor demographic data and trends and prepare reports • work with the U.S. Census Bureau and legislature on the data for 2010 redistricting • provide demographic and related information on request.
Historical Perspective The State Demographer’s Office was created in 1973 by statute. For over 37 years, the state demographer has provided early identification of critical trends and their implications on subjects such as aging, rural population decline, workforce supply issues, K-12 enrollment, higher education enrollment, infrastructure needs, changing diversity, state government workforce, housing, households, revenue collections, people with disabilities, and structural issues in the state budget.
Annual population and household estimates made by the state demographer are a major component in a number of state programs and funding formulas, including local government aid, transportation aid, levy limits, and community education levy. Population estimates and projections are also used to site and size major government infrastructure investments including roads, water treatment, schools, and other facilities.
Key Activity Goals & Measures Admin Goal – To provide our customers with valuable services, products, advice, and expertise (http://www.admin.state.mn.us/admin.html)
Measure: The state demographer provides official statistics and estimates that are used in funding formulas and other operational efforts necessary for efficient and effective government operations.
Activity at a Glance
• Prepares annual population and household estimates for counties, cities, and towns
• Plans for 2010 Census data for legislative and congressional redistricting
• Prepares 10 and 50 year population projections and budget impacts of trends
• Projects population by age and sex, births and deaths, labor force and household type by county, and high school graduates by region
• Prepares reports and articles on Minnesota’s population, education, housing, income, migration, foreign-born population, and aging.
• Updates Minnesota Milestones indicators • Prepares report on Minnesota state plan in
odd numbered fiscal years • Makes more than 100 presentations annually • Provides Minnesota input on technical matters
involving federal demographic programs
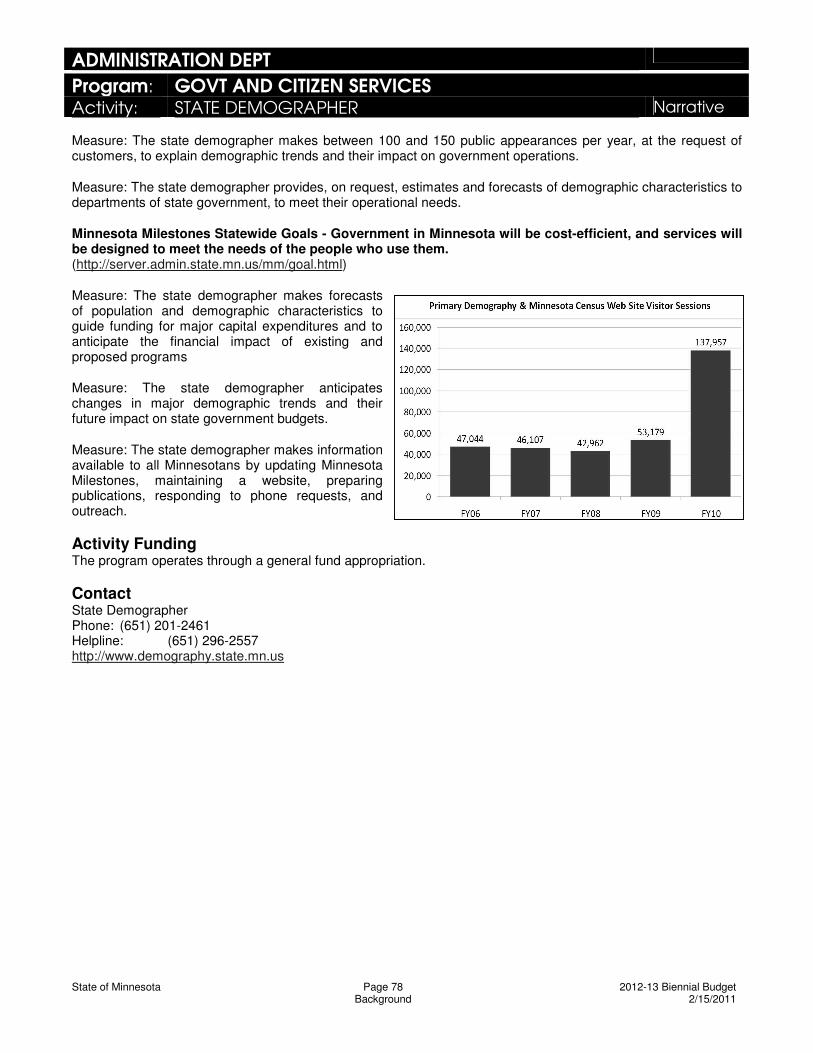
ADMINISTRATION DEPT
Program: GOVT AND CITIZEN SERVICES Activity: STATE DEMOGRAPHER Narrative
State of Minnesota Page 78 2012-13 Biennial Budget Background 2/15/2011
Measure: The state demographer makes between 100 and 150 public appearances per year, at the request of customers, to explain demographic trends and their impact on government operations.
Measure: The state demographer provides, on request, estimates and forecasts of demographic characteristics to departments of state government, to meet their operational needs.
Minnesota Milestones Statewide Goals - Government in Minnesota will be cost-efficient, and services will be designed to meet the needs of the people who use them. (http://server.admin.state.mn.us/mm/goal.html)
Measure: The state demographer makes forecasts of population and demographic characteristics to guide funding for major capital expenditures and to anticipate the financial impact of existing and proposed programs
Measure: The state demographer anticipates changes in major demographic trends and their future impact on state government budgets.
Measure: The state demographer makes information available to all Minnesotans by updating Minnesota Milestones, maintaining a website, preparing publications, responding to phone requests, and outreach.
Activity Funding The program operates through a general fund appropriation.
Contact State Demographer Phone: (651) 201-2461 Helpline: (651) 296-2557 http://www.demography.state.mn.us

ADMINISTRATION DEPT Program: GOVT AND CITIZEN SERVICES Activity: STATE DEMOGRAPHER Budget Activity Summary
Dollars in Thousands
Current Governor’s Recomm. Biennium FY2010 FY2011 FY2012 FY2013 2012-13
State of Minnesota Page 79 2012-13 Biennial Budget Background 2/15/2011
Direct Appropriations by Fund General Current Appropriation 250 170 170 170 340 Technical Adjustments Operating Budget Reduction (2) (2) (4) Subtotal - Forecast Base 250 170 168 168 336 Governor's Recommendations Operating Budget Reductions 0 0 (70) (70) Total 250 170 168 98 266
Expenditures by Fund Direct Appropriations General 653 615 593 523 1,116 Statutory Appropriations Miscellaneous Special Revenue 0 5 0 0 0 Federal 14 0 0 0 0 Total 667 620 593 523 1,116
Expenditures by Category
Total Compensation 481 479 458 410 868 Other Operating Expenses 186 141 135 113 248 Total 667 620 593 523 1,116
Full-Time Equivalents (FTE) 5.5 5.5 5.3 4.7

ADMINISTRATION DEPT Program: ADMINISTRATIVE MGMT SERVICES Narrative
State of Minnesota Page 80 2010-11 Biennial Budget Background 2/15/2011
Program Description Administrative Management Services provides internal leadership in the areas of financial management, human resources, communications, and legislative support. A driving strategy is ensuring statewide leadership that supports both the diverse activities in the agency as well as support of initiatives that promote delivering effective, efficient, and economical government.
Budget Activities This program includes the following budget activities
• Executive Support • Financial Management and Reporting • Human Resources
Further detail on each of these budget activities is included in subsequent pages of this budget document.

ADMINISTRATION DEPT Program: ADMINISTRATIVE MGMT SERVICES Program Summary
Dollars in Thousands
Current Governor Recomm. Biennium FY2010 FY2011 FY2012 FY2013 2012-13
State of Minnesota Page 81 2012-13 Biennial Budget Background 2/15/2011
Direct Appropriations by Fund General Current Appropriation 1,726 1,726 1,726 1,726 3,452 Technical Adjustments Operating Budget Reduction (8) (8) (16) Subtotal - Forecast Base 1,726 1,726 1,718 1,718 3,436 Total 1,726 1,726 1,718 1,718 3,436
Expenditures by Fund Direct Appropriations General 1,526 1,905 1,718 1,718 3,436 Total 1,526 1,905 1,718 1,718 3,436
Expenditures by Category
Total Compensation 1,337 1,353 1,345 1,352 2,697 Other Operating Expenses 189 552 373 366 739 Total 1,526 1,905 1,718 1,718 3,436
Expenditures by Activity Executive Support 431 495 467 467 934 Financial Mgmt And Reporting 736 920 827 827 1,654 Human Resources 359 490 424 424 848 Total 1,526 1,905 1,718 1,718 3,436
Full-Time Equivalents (FTE) 18.9 19.2 18.7 18.4

ADMINISTRATION DEPT
Program: ADMINISTRATIVE MGMT SERVICES Activity: EXECUTIVE SUPPORT Narrative
State of Minnesota Page 82 2012-13 Biennial Budget Background 2/15/2011
Activity Description Executive Support serves the numerous needs of the Department of Administration (Admin) in the execution of its responsibilities as the primary administrative/operations agency of the executive branch. These include agency and executive leadership and management and program support. Executive Support also coordinates the Department Results/Accountability Minnesota website (www.accountability.state.mn.us), which helps citizens follow the progress of 26 state agencies/offices toward specific goals in eight categories.
Population Served Executive Support serves numerous populations: the agency and employees; the governor’s office; all executive branch agencies, boards and commissions; media; the legislature; and citizens.
Services Provided • Executive management support • Intra-agency and inter-agency coordination • Internal and external communications • Data practices compliance • Legislative coordination
• Media relations • Website management • Executive branch agency performance reporting • Continuity of operations planning for emergency preparedness
Key Activity Goals & Measures Admin Goal – To provide our customers with valuable services, products, advice, and expertise Admin Goal – To be recognized for our innovation and efficiency (http://www.admin.state.mn.us/admin.html) Executive Support assists the agency in delivering on its mission of helping customers succeed by providing valuable services, products, advice, and expertise, and by recognizing innovation and efficiency through communications with customers and others. Measure: Publication of a semi-monthly online newsletter for customers across state government. In FY 2010, the department published five newsletters, one less than the goal of six per year.
Measure: Assisting agency programs with a variety of communications, including online and print newsletters, memoranda, policies, news releases, and other documents. In FY 2010, five divisions/units received assistance with all 38 issues of their respective newsletters.
Measure: Responding to data practices requests. The agency’s data practices compliance function strives to acknowledge requests for data within 24 business hours and to provide the requested data, if any is maintained, within 10 business days. In FY 2010, the department’s data practices compliance function received 88 requests for which the department maintained responsive data. The responsive data were made available to the requestor within 10 business days 88.2% of the time, slightly under the goal of 90 percent.
Minnesota Milestones Statewide Goals (http://server.admin.state.mn.us/mm/goal.html) More generally, Executive Support aids agency programs and activities that have an influence on five Minnesota Milestones statewide goals: Satisfaction with Government Services, Price of Government, Air Pollutants, Solid Waste Reduction and Recycling, and Urban Air Pollution.
Activity Funding This activity is primarily funded through a general fund appropriation.
Contact Director Phone: (651) 201-2563 Website: http://www.admin.state.mn.us Strategic Plan: http://www.admin.state.mn.us/admin_strategicplan.html Performance Goals, Measures and Results: http://www.accountability.state.mn.us/Departments/Administration/
Activity at a Glance • Project management for statewide efficiency
initiatives • Assisted with a variety of statewide efforts,
including alternative fuels, building energy efficiency, and government reform
• Addressed 135 media inquiries in FY 2010 • Addressed 88 data practices requests in FY 2010 • Maintained five websites • Published 18 newsletters focusing on government
efficiency and agency services • Reviewed 26 issues of division newsletters
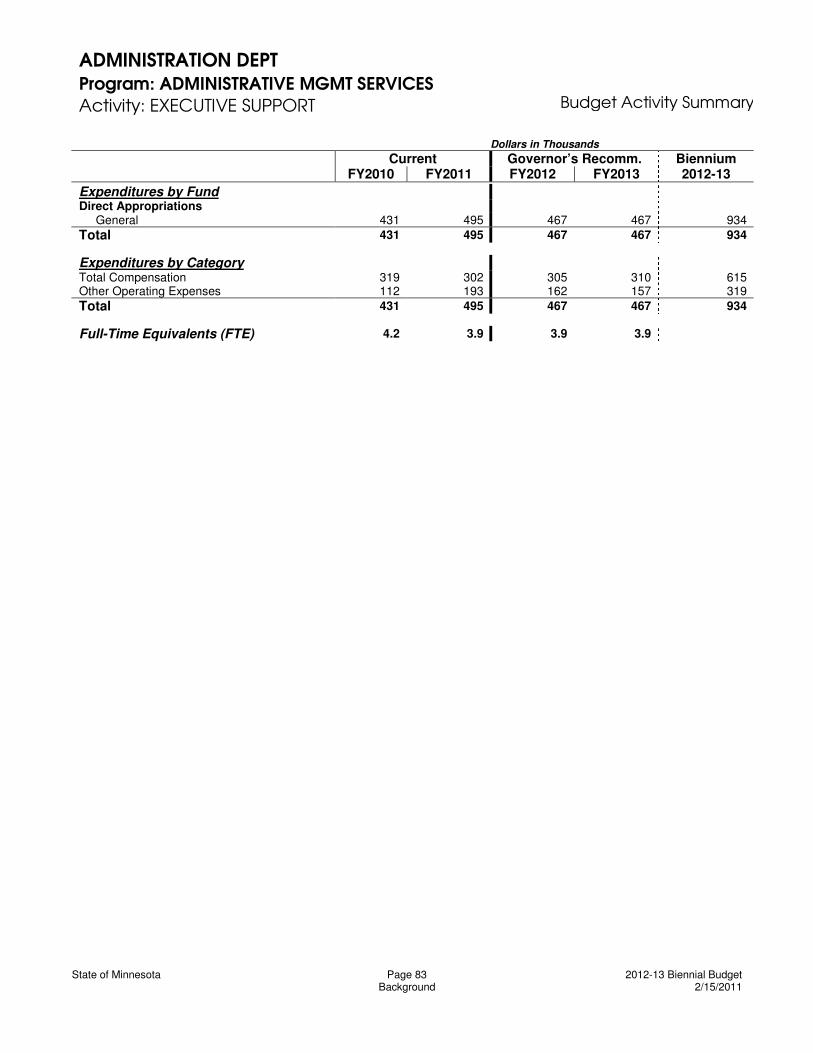
ADMINISTRATION DEPT Program: ADMINISTRATIVE MGMT SERVICES Activity: EXECUTIVE SUPPORT Budget Activity Summary
Dollars in Thousands
Current Governor’s Recomm. Biennium FY2010 FY2011 FY2012 FY2013 2012-13
State of Minnesota Page 83 2012-13 Biennial Budget Background 2/15/2011
Expenditures by Fund Direct Appropriations General 431 495 467 467 934 Total 431 495 467 467 934
Expenditures by Category
Total Compensation 319 302 305 310 615 Other Operating Expenses 112 193 162 157 319 Total 431 495 467 467 934
Full-Time Equivalents (FTE) 4.2 3.9 3.9 3.9
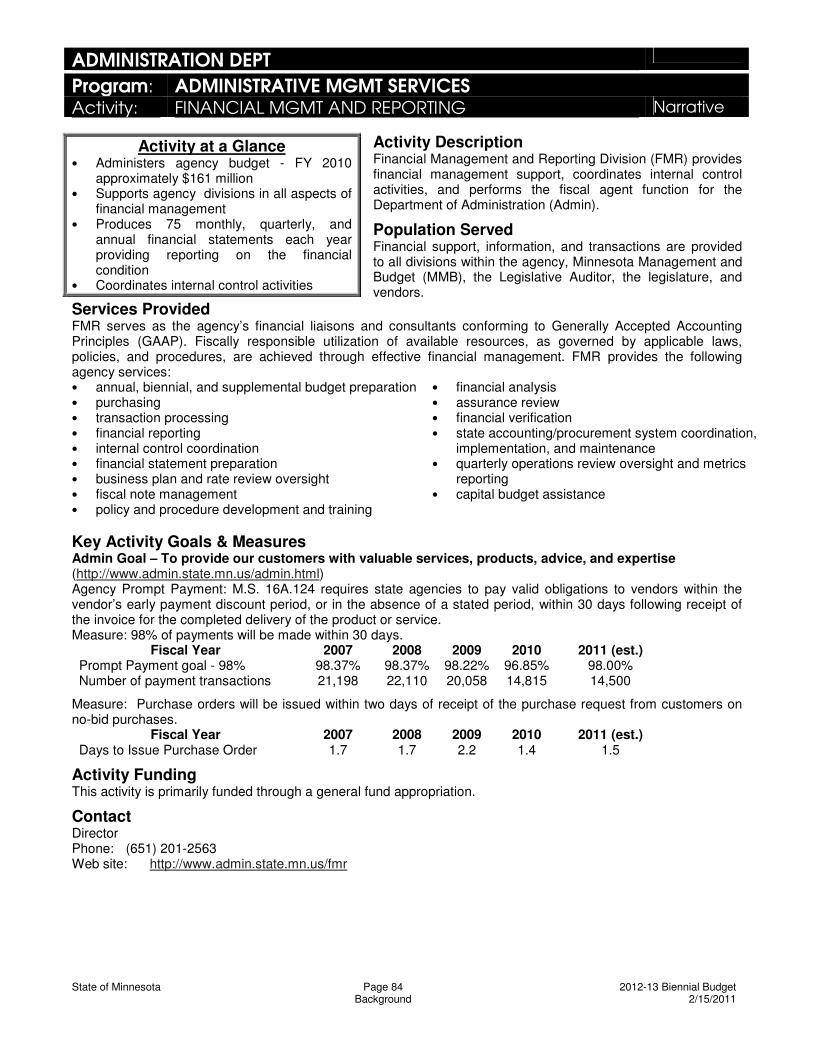
ADMINISTRATION DEPT
Program: ADMINISTRATIVE MGMT SERVICES Activity: FINANCIAL MGMT AND REPORTING Narrative
State of Minnesota Page 84 2012-13 Biennial Budget Background 2/15/2011
Activity Description Financial Management and Reporting Division (FMR) provides financial management support, coordinates internal control activities, and performs the fiscal agent function for the Department of Administration (Admin).
Population Served Financial support, information, and transactions are provided to all divisions within the agency, Minnesota Management and Budget (MMB), the Legislative Auditor, the legislature, and vendors.
Services Provided FMR serves as the agency’s financial liaisons and consultants conforming to Generally Accepted Accounting Principles (GAAP). Fiscally responsible utilization of available resources, as governed by applicable laws, policies, and procedures, are achieved through effective financial management. FMR provides the following agency services: • annual, biennial, and supplemental budget preparation • purchasing • transaction processing • financial reporting • internal control coordination • financial statement preparation • business plan and rate review oversight • fiscal note management • policy and procedure development and training
• financial analysis • assurance review • financial verification • state accounting/procurement system coordination,
implementation, and maintenance • quarterly operations review oversight and metrics
reporting • capital budget assistance
Key Activity Goals & Measures Admin Goal – To provide our customers with valuable services, products, advice, and expertise (http://www.admin.state.mn.us/admin.html) Agency Prompt Payment: M.S. 16A.124 requires state agencies to pay valid obligations to vendors within the vendor’s early payment discount period, or in the absence of a stated period, within 30 days following receipt of the invoice for the completed delivery of the product or service. Measure: 98% of payments will be made within 30 days.
Fiscal Year 2007 2008 2009 2010 2011 (est.) Prompt Payment goal - 98% 98.37% 98.37% 98.22% 96.85% 98.00% Number of payment transactions 21,198 22,110 20,058 14,815 14,500
Measure: Purchase orders will be issued within two days of receipt of the purchase request from customers on no-bid purchases.
Fiscal Year 2007 2008 2009 2010 2011 (est.) Days to Issue Purchase Order 1.7 1.7 2.2 1.4 1.5
Activity Funding This activity is primarily funded through a general fund appropriation.
Contact Director Phone: (651) 201-2563 Web site: http://www.admin.state.mn.us/fmr
Activity at a Glance • Administers agency budget - FY 2010
approximately $161 million • Supports agency divisions in all aspects of
financial management • Produces 75 monthly, quarterly, and
annual financial statements each year providing reporting on the financial condition
• Coordinates internal control activities

ADMINISTRATION DEPT Program: ADMINISTRATIVE MGMT SERVICES Activity: FINANCIAL MGMT AND REPORTING Budget Activity Summary
Dollars in Thousands
Current Governor’s Recomm. Biennium FY2010 FY2011 FY2012 FY2013 2012-13
State of Minnesota Page 85 2012-13 Biennial Budget Background 2/15/2011
Expenditures by Fund Direct Appropriations General 736 920 827 827 1,654 Total 736 920 827 827 1,654
Expenditures by Category
Total Compensation 762 779 750 747 1,497 Other Operating Expenses (26) 141 77 80 157 Total 736 920 827 827 1,654
Full-Time Equivalents (FTE) 10.8 11.2 10.4 10.1

ADMINISTRATION DEPT
Program: ADMINISTRATIVE MGMT SERVICES Activity: HUMAN RESOURCES Narrative
State of Minnesota Page 86 2012-13 Biennial Budget Background 2/15/2011
Activity Description The Human Resources Division provides human resources services to the employees, prospective employees, and management of the Department of Administration (Admin) and the Office of Enterprise Technology (OET) by actively recruiting, hiring, developing, and retaining a productive, diverse, and highly competent workforce. The division’s work is subject to compliance with federal and state law as well as internal policies and procedures.
Population Served The Human Resources Division serves both Admin and OET.
Services Provided The Human Resources Division provides the following services • recruitment and staffing • fringe benefits enrollment and administration • labor contract administration/employee relations • employee training and development • bi-weekly payroll processing • performance management and wage/compensation administration • Worker’s compensation administration, Occupational Safety and Health Administration (OSHA) compliance,
and general safety/wellness program administration • Affirmative Action, Americans with Disabilities Act (ADA), and Family and Medical Leave Act (FMLA)
oversight and administration • consultation on human resources management issues
Key Activity Goals & Measures Admin Goal – To provide our customers with valuable services, products, advice, and expertise (http://www.admin.state.mn.us/admin.html)
Measure: Managers and supervisors will receive a list of qualified applicants for positions within 48 hours of the closing of the announcement. It is critical that supervisors receive applications as soon as possible to diminish the length of time positions are vacant.
Measure: Average sick leave in the agency will be reduced to 30 hours per year or less. The agency is actively seeking to improve attendance so that its resources can be used most effectively. The number of sick leave hours does not include hours used under the Family and Medical Leave Act. In the past three years, the agency has averaged 42, 34, and 37 hours.
Measure: A collaborative effort between Admin and the Department of Transportation will reduce the time to train a new employee in the accounting series by 35%. Because of the complexity of the accounting system and its multiple demands, supervisors have been reluctant to hire candidates without state accounting experience. A training program being developed now will train new accounting staff across the state so that each accounting supervisor will have to spend less on-the-job training time.
Activity Funding This activity is primarily funded through a general fund appropriation.
Contact Director Phone: (651) 201-2609 http://www.admin.state.mn.us
Activity at a Glance
• 118 vacancies filled per calendar year • 98% of labor grievances per fiscal year are
resolved without arbitration • 60% of employees provided onsite or offsite
training per fiscal year • 898 individual payroll timesheets processed
bi-weekly
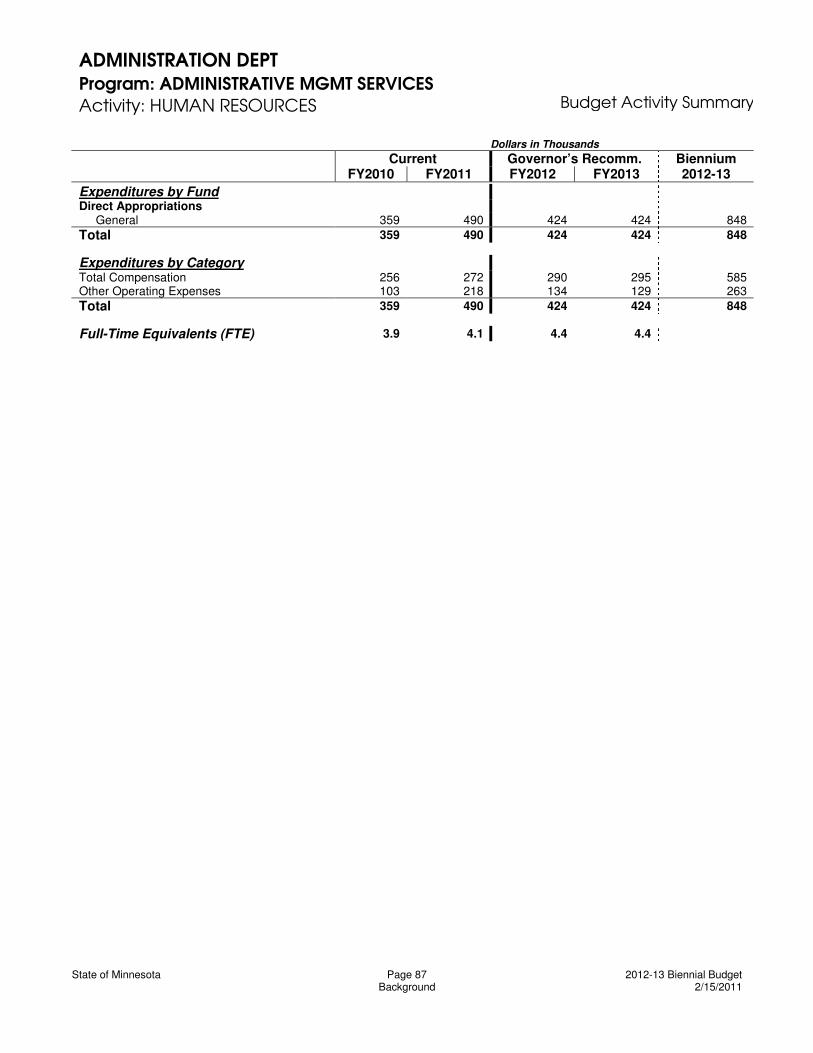
ADMINISTRATION DEPT Program: ADMINISTRATIVE MGMT SERVICES Activity: HUMAN RESOURCES Budget Activity Summary
Dollars in Thousands
Current Governor’s Recomm. Biennium FY2010 FY2011 FY2012 FY2013 2012-13
State of Minnesota Page 87 2012-13 Biennial Budget Background 2/15/2011
Expenditures by Fund Direct Appropriations General 359 490 424 424 848 Total 359 490 424 424 848
Expenditures by Category
Total Compensation 256 272 290 295 585 Other Operating Expenses 103 218 134 129 263 Total 359 490 424 424 848
Full-Time Equivalents (FTE) 3.9 4.1 4.4 4.4
ADMINISTRATION DEPT Program: FISCAL AGENT Narrative
State of Minnesota Page 88 2010-11 Biennial Budget Background 2/15/2011
Program Description The purpose of the Fiscal Agent is to meet the administrative needs of grant and other funding the Department of Administration (Admin) receives on behalf of multiple stakeholders. These funds are typically appropriated by the legislature for special projects. Admin distributes these funds to recipients, based on laws, statutes, policies, and procedures.
Budget Activities This program includes the following budget activities
• Public broadcasting • In lieu of rent • Miscellaneous grants/studies/other
Further detail on each of these budget activities is included in subsequent pages of this budget document.
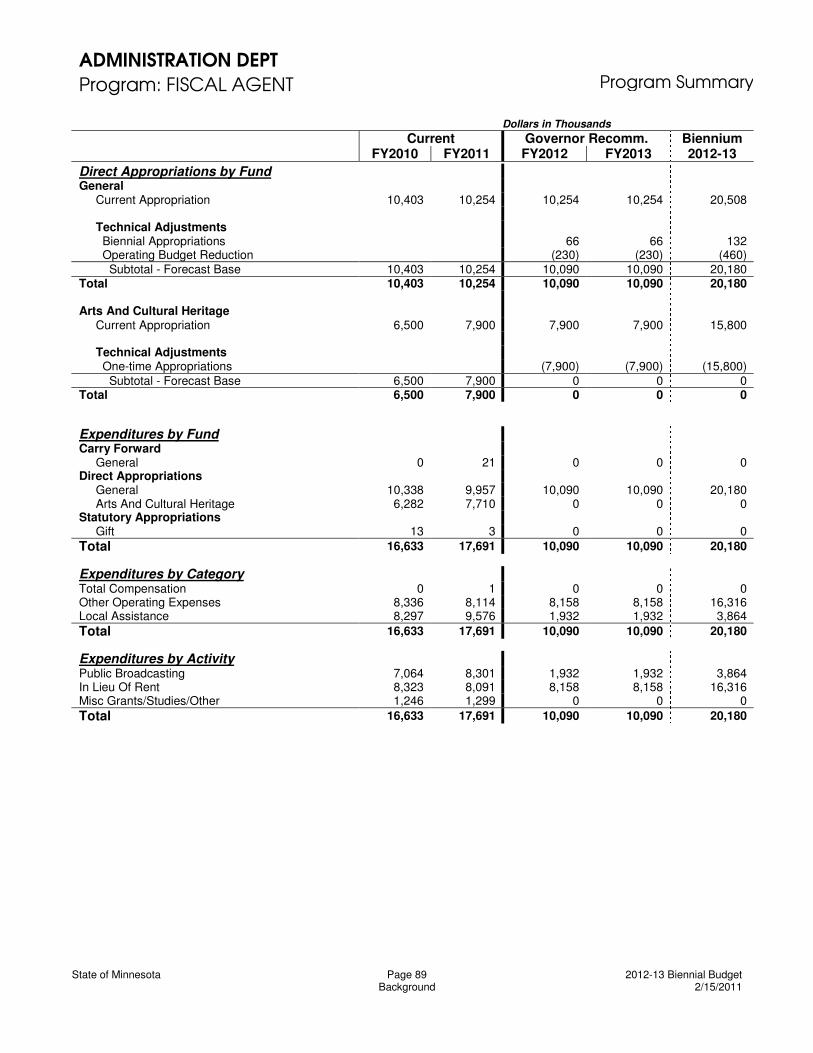
ADMINISTRATION DEPT Program: FISCAL AGENT Program Summary
Dollars in Thousands
Current Governor Recomm. Biennium FY2010 FY2011 FY2012 FY2013 2012-13
State of Minnesota Page 89 2012-13 Biennial Budget Background 2/15/2011
Direct Appropriations by Fund General Current Appropriation 10,403 10,254 10,254 10,254 20,508 Technical Adjustments Biennial Appropriations 66 66 132 Operating Budget Reduction (230) (230) (460) Subtotal - Forecast Base 10,403 10,254 10,090 10,090 20,180 Total 10,403 10,254 10,090 10,090 20,180 Arts And Cultural Heritage Current Appropriation 6,500 7,900 7,900 7,900 15,800 Technical Adjustments One-time Appropriations (7,900) (7,900) (15,800) Subtotal - Forecast Base 6,500 7,900 0 0 0 Total 6,500 7,900 0 0 0
Expenditures by Fund Carry Forward General 0 21 0 0 0 Direct Appropriations General 10,338 9,957 10,090 10,090 20,180 Arts And Cultural Heritage 6,282 7,710 0 0 0 Statutory Appropriations Gift 13 3 0 0 0 Total 16,633 17,691 10,090 10,090 20,180
Expenditures by Category
Total Compensation 0 1 0 0 0 Other Operating Expenses 8,336 8,114 8,158 8,158 16,316 Local Assistance 8,297 9,576 1,932 1,932 3,864 Total 16,633 17,691 10,090 10,090 20,180
Expenditures by Activity Public Broadcasting 7,064 8,301 1,932 1,932 3,864 In Lieu Of Rent 8,323 8,091 8,158 8,158 16,316 Misc Grants/Studies/Other 1,246 1,299 0 0 0 Total 16,633 17,691 10,090 10,090 20,180

ADMINISTRATION DEPT
Program: FISCAL AGENT Activity: PUBLIC BROADCASTING Narrative
State of Minnesota Page 90 2012-13 Biennial Budget Background 2/15/2011
Activity Description Public broadcasting is the grant administration program carried out for the legislature under specific appropriation language and M.S.129D.11-16. The program oversees this grant authority, disbursing funds in accordance with legislative appropriations and direction, and ensures compliance with statutory requirements.
Population Served Television viewers and radio listeners throughout Minnesota are served by this activity.
Services Provided Public Television State funds are used by six recipient stations to sustain their ability to serve as a major community resource providing educational, cultural, economic development, public affairs, and children’s programming to the public, governmental agencies, nonprofit organizations, business corporations, and educational facilities. Public television also provides statewide over-the-air broadcast coverage of the House and Senate floor sessions and major committee hearings. In addition to over-the-air broadcast, all stations provide a variety of web services and video streaming. State grants are made in a direct and matching basis, consistent with the criteria established in M.S. 129D.11-16. Public Television signals cover approximately 95% of the state. State grants provide between three and 21% of individual stations’ operating budgets.
The Clean Water, Land, and Legacy Amendment through the Laws of 2009, Chapter 172, Article 4, Sec. 2, Subd. 5, appropriated funding from the arts and cultural heritage fund to the Department of Administration (Admin) for public television grants related to production and acquisitions ($6,300,000). This funding enabled recipient stations to develop and broadcast numerous hours of arts, cultural, and history programming.
Association of Minnesota Public Educational Radio Stations (AMPERS) State funds are used to support radio stations operated by the 12 organizations belonging to the Association of Minnesota Public and Education Radio Stations (AMPERS). These organizations serve Minnesota residents through radio programming that is local, unique in their communities, broadly educational, reaching underserved audiences. One AMPERS station is the only local radio service in the community and assists in times of county emergencies or 911/Internet technology failures. The stations provide programming that is a diverse mix of community news, public affairs programming, and music designed to engage, inform, and interact with listeners. In addition to their 12 main stations, they operate ten translators/repeaters at other locations and one station broadcasts HD Digital radio.
The AMPERS stations cover approximately 95% of the population and 90% of the geography of the state serving 276,000 unique listeners per week. State grants provide between four and 60% of the individual stations’ total annual budget.
The Clean Water, Land, and Legacy Amendment through the Laws of 2009, Chapter 172, Article 4, Sec. 2, Subd. 5, appropriated funding from the arts and cultural heritage fund for grants to AMPERS for production and acquisitions ($2,650,000). This funding allowed AMPERS stations to collaborate and share programs to reach new audiences, develop and deploy a new website that gives the public free access to programming, and build a vast archival source of arts, cultural, and history programming spotlighting the stories of Minnesota’s rich heritage.
Minnesota Public Radio (MPR) Through its 41 stations and 39 translator stations, Minnesota Public Radio (MPR) provides a broadcast signal to more than 95% of the state’s population and most of its geography. Every week, 900,000 people tune into one of
Activity at a Glance • 1.2 million people per week view
programming of the Minnesota Public Television Association
• Approximately 276,000 people listen one or more times per week to the Association of Minnesota Public Educational Radio Stations (AMPERS) radio programming with signal coverage reaching 95% of the state of Minnesota
• Over 900,000 Minnesotans listen to MPR stations weekly. Programming produced and distributed by MPR reaches 16 million people nationally each week
• MPR provides the state with infrastructure and services for the Emergency Broadcast System, the Amber Alert System, and the blind and visually impaired
• MPR’s three program services are also available online at www.mpr.org
• Metro Cable Network reaches over 600,000 cabled households in the seven-county metro area

ADMINISTRATION DEPT
Program: FISCAL AGENT Activity: PUBLIC BROADCASTING Narrative
State of Minnesota Page 91 2012-13 Biennial Budget Background 2/15/2011
MPR’s three regional services (News, Classical Music, and The Current) for an average of six hours. Collectively, Minnesotans spend 5.7 million hours listening to MPR each week.
MPR’s general fund investments – MPR’s network is unique as a broadcast service because Minnesotans through the state can rely on MPR to provide vital security, safety, and public services including: • the backbone to the statewide Emergency Broadcast System providing emergency signals to all other radio,
television, and cable stations in Minnesota; • the backbone to the statewide AMBER Alert System (child abduction warning system); • the statewide broadcast infrastructure for The Radio Talking book – a reading service for blind and visually
impaired persons in the state – in cooperation with the Minnesota State Services for the Blind; • Hmong Language Services, serving the Hmong language population (on a subcarrier of KCMP in the Twin
Cities) – in cooperation with Hmong Minnesota Radio; • Hybrid Digital (HD) Services, including programming for children and young families (limited currently to Twin
Cities stations until distribution of HD to other stations is funded).
Support from the state provides less than 2% of MPR’s total capital and operating revenue during the FY 2010-2011 biennium. Over the past several years, state General Fund support has enabled MPR to build and maintain critical infrastructure in Greater Minnesota communities where population density is not amenable to other fundraising. Some of these communities include St. Peter, Roseau, Warroad, Granite Falls, Saint James, Windom, and several others.
The Clean Water, Land, and Legacy Amendment through the Laws of 2009, Chapter 172, Article 4, Sec. 2, Subd. 5, appropriated funding from the arts and cultural heritage fund to Admin for grants to MPR to create new programming and events, expand regional news service, amplify Minnesota culture, and document Minnesota’s history ($2,650,000). This funding enabled MPR to expand its arts and cultural programming in innovative ways. With these funds, MPR has brought Minnesota artists and performers to the attention of previously underserved communities across the state. Measured by audience, MPR is the state’s largest cultural nonprofit. Through its broadcast and web audiences, MPR is uniquely positioned to engage Minnesotans in art, arts education, and the preservation of Minnesota's history and cultural heritage. Since first receiving Clean Water, Land, and Legacy Amendment funds, MPR has developed 15 unique projects that focus on expanding Minnesotans’ access to art, arts education, Minnesota's history, and Minnesota’s cultural heritage.
Twin Cities Regional Cable Channel - State funds are used to provide grant-in-aid to Twin Cities Regional Cable Channel, Inc., a nonprofit organization operating the Metro Cable Network. These state funds provide for approximately 5% of the Metro Cable Network operating budget. The network appears on Channel 6 on all metropolitan area cable systems presenting a wide range of programs about issues and activities of regional interest and significance as mandated by state statutes and designated by the Minnesota Cable Communications Board in 1985.
Activity Funding This activity is funded through a General Fund appropriation and some of the entities receive funding, beginning in FY 2010, through the Clean Water, Land, and Legacy Amendment.
Contact Director Phone: (651) 201-2563 Website: http://www.admin.state.mn.us

ADMINISTRATION DEPT Program: FISCAL AGENT Activity: PUBLIC BROADCASTING Budget Activity Summary
Dollars in Thousands
Current Governor’s Recomm. Biennium FY2010 FY2011 FY2012 FY2013 2012-13
State of Minnesota Page 92 2012-13 Biennial Budget Background 2/15/2011
Direct Appropriations by Fund General Current Appropriation 2,015 1,866 1,866 1,866 3,732 Technical Adjustments Biennial Appropriations 66 66 132 Subtotal - Forecast Base 2,015 1,866 1,932 1,932 3,864 Total 2,015 1,866 1,932 1,932 3,864 Arts And Cultural Heritage Current Appropriation 5,100 6,500 6,500 6,500 13,000 Technical Adjustments One-time Appropriations (6,500) (6,500) (13,000) Subtotal - Forecast Base 5,100 6,500 0 0 0 Total 5,100 6,500 0 0 0
Expenditures by Fund Direct Appropriations General 2,015 1,866 1,932 1,932 3,864 Arts And Cultural Heritage 5,049 6,435 0 0 0 Total 7,064 8,301 1,932 1,932 3,864
Expenditures by Category
Local Assistance 7,064 8,301 1,932 1,932 3,864 Total 7,064 8,301 1,932 1,932 3,864
ADMINISTRATION DEPT
Program: FISCAL AGENT Activity: IN LIEU OF RENT Narrative
State of Minnesota Page 93 2012-13 Biennial Budget Background 2/15/2011
Activity Description This activity serves as a pass-through account for legislative general fund appropriations for entities that do not directly pay for space.
• Ceremonial Space –space in the capitol building such as the rotunda, the governor’s residence, ceremonial grounds and monuments/memorials in the Capitol area
• Services for the Blind – space occupied by blind vending operators in buildings (12 sites) under the Plant Management Division’s custodial control (MS 248.07, subd. 7)
• Rent Waived – space occupied in the Capitol, State Office Building, and Veterans Service Building by the house of representatives, senate, Revisor of Statutes, Legislative Reference Library, and congressionally chartered veterans’ organizations (MS 197.55 to 197.58)
Population Served Services and support are provided to the legislature and constituents, vending operators with Services for the Blind, congressionally chartered veterans’ organizations, and visitors.
Services Provided Services provided include janitorial, maintenance, repair, trades, engineering, grounds, and utilities for the buildings and grounds identified above. The following is the breakdown of space (371,562 total square feet) serviced under this activity • Ceremonial Space – 36,519 square feet • Services for the Blind – 5,308 square feet • Rent Waived – 329,735 square feet
Key Activity Goals & Measures Goal: Provide well-maintained facilities and grounds that support a quality environment for building tenants through building tours, facility condition audits, and computer-assisted facilities management program.
Activity Funding This activity is funded through a general fund appropriation.
Contact Director Phone: (651) 201-2350 Email: www.admin.state.mn.us/pmd
Activity at a Glance • 371,562 square feet of space maintained • 21 monuments and memorials maintained and • 28.3 acres of ceremonial grounds maintained

ADMINISTRATION DEPT Program: FISCAL AGENT Activity: IN LIEU OF RENT Budget Activity Summary
Dollars in Thousands
Current Governor’s Recomm. Biennium FY2010 FY2011 FY2012 FY2013 2012-13
State of Minnesota Page 94 2012-13 Biennial Budget Background 2/15/2011
Direct Appropriations by Fund General Current Appropriation 8,388 8,388 8,388 8,388 16,776 Technical Adjustments Operating Budget Reduction (230) (230) (460) Subtotal - Forecast Base 8,388 8,388 8,158 8,158 16,316 Total 8,388 8,388 8,158 8,158 16,316
Expenditures by Fund Direct Appropriations General 8,323 8,091 8,158 8,158 16,316 Total 8,323 8,091 8,158 8,158 16,316
Expenditures by Category
Other Operating Expenses 8,323 8,091 8,158 8,158 16,316 Total 8,323 8,091 8,158 8,158 16,316
ADMINISTRATION DEPT
Program: FISCAL AGENT Activity: MISC GRANTS/STUDIES/OTHER Narrative
State of Minnesota Page 95 2012-13 Biennial Budget Background 2/15/2011
Activity Description This activity has been established to administer certain grants and other monies the agency receives through legislative appropriations.
Population Served Various grant recipients are served based on specific legislative intent.
Services Provided Each of the activities is established and operated under specific state legislation. Emphasis is placed on fulfilling the intent of the specific legislation, which varies with each activity. Arts and Cultural Heritage Fund The Laws of 2009, Chapter 172, Article 4, Sec. 2, Subd. 5, appropriated funding from the arts and cultural heritage fund for grants to specified organizations for specified purposes. These include the following for FY 2010 and FY 2011: • Zoos - programmatic development of Minnesota’s zoos ($900,000) • Minnesota Children’s Museum - arts, arts education, and arts access and to preserve Minnesota’s history and
cultural heritage ($500,000) • Duluth Children’s Museum - arts, arts education, and arts access and to preserve Minnesota’s history and cultural
heritage ($500,000) • Science Museum of Minnesota - arts, arts education, and arts access and to preserve Minnesota’s history and
cultural heritage ($900,000) Construction Grants to Political Subdivisions The legislature appropriates state funding to the Department of Administration (Admin) for grants to local governments for a variety of capital projects. Funding may be approved through the state bonding bill or other state appropriation bills in the form of bond proceeds or general fund appropriations. Capital projects are subject to requirements of the Minnesota Constitution, state statutes, language contained in the appropriation bill, and state accounting policies. Current construction grants include: • Hennepin County Medical Center – Predesign/design outpatient clinic and health education facility ($820,000) • Minneapolis - All wars memorial ($100,000) • Richfield - All veterans memorial ($100,000) • Virginia - Veterans memorial ($100,000) • Ramsey County – design, construct, furnish, and equip capital improvements for Gillette Children’s Specialty Health
Care ($10,000,000) • Hennepin County - design, construct, furnish, and equip a hyperbaric oxygen facility for Hennepin County Medical
Center ($5,000,000) Governor’s Residence Council Gift Fund Based on M.S. 16B.27, the Governor’s Residence Council develops an overall restoration and maintenance plan for the governor’s residence and surrounding grounds and approves alterations in the existing structure. The council may solicit and accept donated money to maintain and improve the quality of furnishings for the public areas of the building. The Governor’s Residence Council was established in 1980. Legislative Commission on Minnesota Resources (LCMR) Project Grants Based on M.S. 4.071, oil overcharge money received by the state as a result of litigation or settlements of alleged violations of federal petroleum pricing regulations is used for projects recommended by the LCMR and appropriated by the legislature. Admin has been administering grants through this program since 1988. Currently, there are no projects in process.
Key Activity Goals & Measures Key goals for this activity are timely distribution of funding and effective grants management. Processes are established and maintained for handling financial transactions, tracking information, and reporting the information. Contracts and agreements with recipients of the funding are an integral function of this activity.
Activity Funding This activity distributes a mix of funding from the arts and cultural heritage funds, gifts, bond proceeds, and other funds.
Contact Director Phone: (651) 201-2563 http://www.admin.state.mn.us
Activity at a Glance • $14,400,000 in Arts and Cultural Heritage grants • Six construction grants currently in process
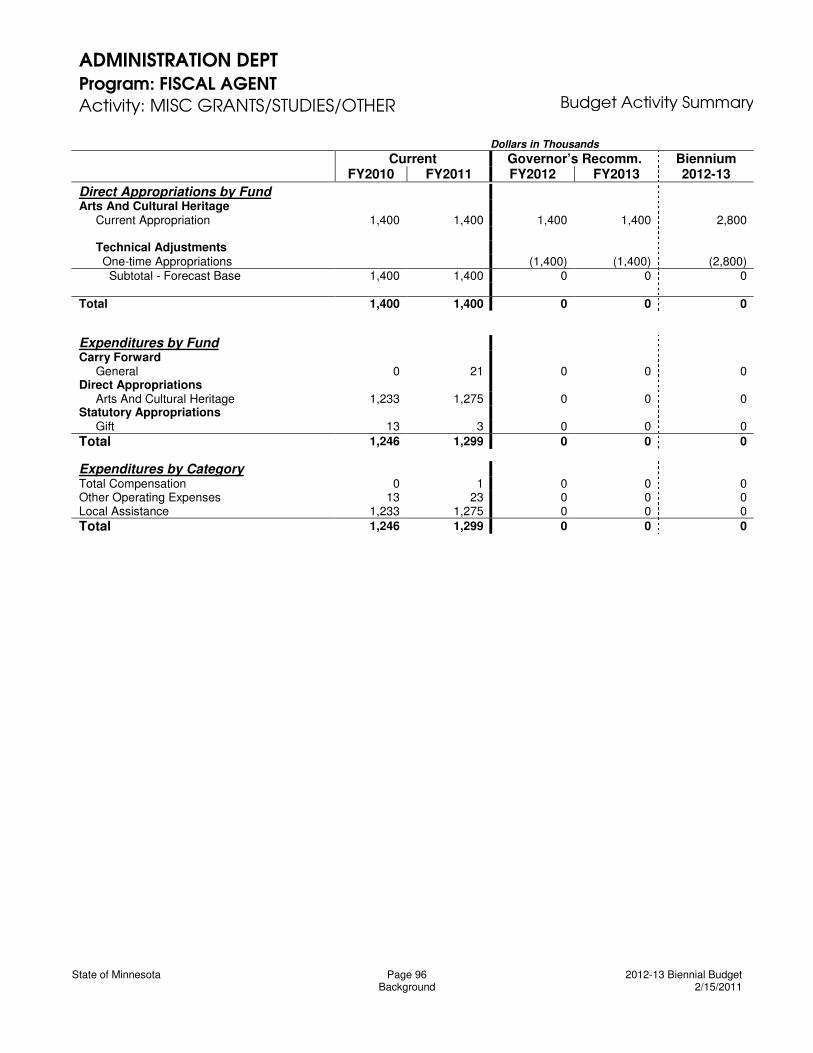
ADMINISTRATION DEPT Program: FISCAL AGENT Activity: MISC GRANTS/STUDIES/OTHER Budget Activity Summary
Dollars in Thousands
Current Governor’s Recomm. Biennium FY2010 FY2011 FY2012 FY2013 2012-13
State of Minnesota Page 96 2012-13 Biennial Budget Background 2/15/2011
Direct Appropriations by Fund Arts And Cultural Heritage Current Appropriation 1,400 1,400 1,400 1,400 2,800 Technical Adjustments One-time Appropriations (1,400) (1,400) (2,800) Subtotal - Forecast Base 1,400 1,400 0 0 0 Total 1,400 1,400 0 0 0
Expenditures by Fund Carry Forward General 0 21 0 0 0 Direct Appropriations Arts And Cultural Heritage 1,233 1,275 0 0 0 Statutory Appropriations Gift 13 3 0 0 0 Total 1,246 1,299 0 0 0
Expenditures by Category
Total Compensation 0 1 0 0 0 Other Operating Expenses 13 23 0 0 0 Local Assistance 1,233 1,275 0 0 0 Total 1,246 1,299 0 0 0

ADMINISTRATION DEPT Federal Funds Summary
State of Minnesota Page 97 2012-13 Biennial Budget Appendix 2/15/2011
Narrative This Federal Funds Summary lists anticipated receipts for incoming federal grants listed in the same sequence as program budget activity order in the biennial budget. Admin receives federal funding and American Recovery and Reinvestment Act (ARRA) funding.
Federal funds are important because they enable Admin to carry out activities as described in the graph below. The agency receives ongoing funding for the following activities: • Developmental Disabilities Council (DD Council) receives a basic grant allocation from the Administration on
Developmental Disabilities (ADD), US Department of Health and Human Services, authorized by the Developmental Disabilities Assistance and Bill of Rights Act (DD Act), (P.L. 106-402). At least 70% of each year’s basic grant allocation must be re-granted to programs and activities that will result in the increased independence, productivity, self-determination, integration and inclusion of people with developmental disabilities and their families in the community. The majority of the DD Council’s match is met through in-kind contributions of grant recipients. The annual state appropriation of $74,000 must be maintained according to the federal law. Level funding is projected through FY 2013; no significant changes are anticipated in the DD Act. In addition, ARRA funding was received for an autism project.
• The Minnesota System of Technology to Achieve Results (STAR) is federally funded by the Rehabilitation Services Administration in accordance with the Assistive Technology Act of 1998, as amended (P.L. 108-364). The funding is used to help all Minnesotans with disabilities gain access to and acquire the assistive technology (AT) needed to live, learn, work, and play. STAR assures that Minnesotans have access to AT for demonstration and loan prior to selecting the most appropriate device for purchase. STAR also provides AT training, technical assistance, public awareness, and statewide information and referral services. There is no required maintenance level of support or matching funds related to the Assistive Technology Act of 1998, as amended (AT Act). Level funding is projected through FY 2013.
The following budget activities also received federal funding: • Materials Management Division received ARRA funding to implement information technology accessibility. • The Minnesota Geospatial Information Office (MnGeo) supplements its general fund appropriation, whenever
possible, with grants and cooperative agreements with federal agencies that promote the efficient and standardized development, management, and distribution of geospatial data for Minnesota. During FY 2011, MnGeo expects to receive funding from grants and agreements with the US Geological Survey (USGS) and the US Environmental Protection Agency (EPA). Each of these will support work devoted to improved efficiencies and standardization of state operations and have value for both the state and its federal partners. None carry with them an obligation for ongoing maintenance beyond the scope of the funded project.
These projects will result in the development of strategically important data assets for the state. MnGeo plans to host the data and tools that are developed as a result of these projects as an essential function of its core mission. Viewed by the USGS and EPA as successful partners that help support their program goals, there is a high probability that federal funding will be available to continue these partnerships in the future. Such partnerships represent opportunities to achieve state objectives that would otherwise be difficult to achieve with only state funding.
• Real Estate and Construction Services (RECS) received ARRA funding for energy efficiency improvements at state facilities. The stimulus funds are made available to Admin for this purpose through an interagency agreement with the Minnesota Department of Commerce.
• The State Demographer serves as Minnesota’s liaison with the U.S. Census Bureau. The Census Bureau, in an effort to improve the quality of the 2010 Census, offered states the option of reviewing counts of housing units to receive a 2010 Census form in February 2010 and review counts of group facilities, such as college dormitories, nursing homes, prisons, and other group facilities during August 2010. The Census Bureau agreed to reimburse expenses for these reviews, including data development and travel expenses and salary for a State Demographic Center employee to review the counts in Washington DC. This is a one-time program during calendar year 2010 related specifically to operations of the 2010 Census count. The specific amounts invoiced are shown in the table. This program is completed.
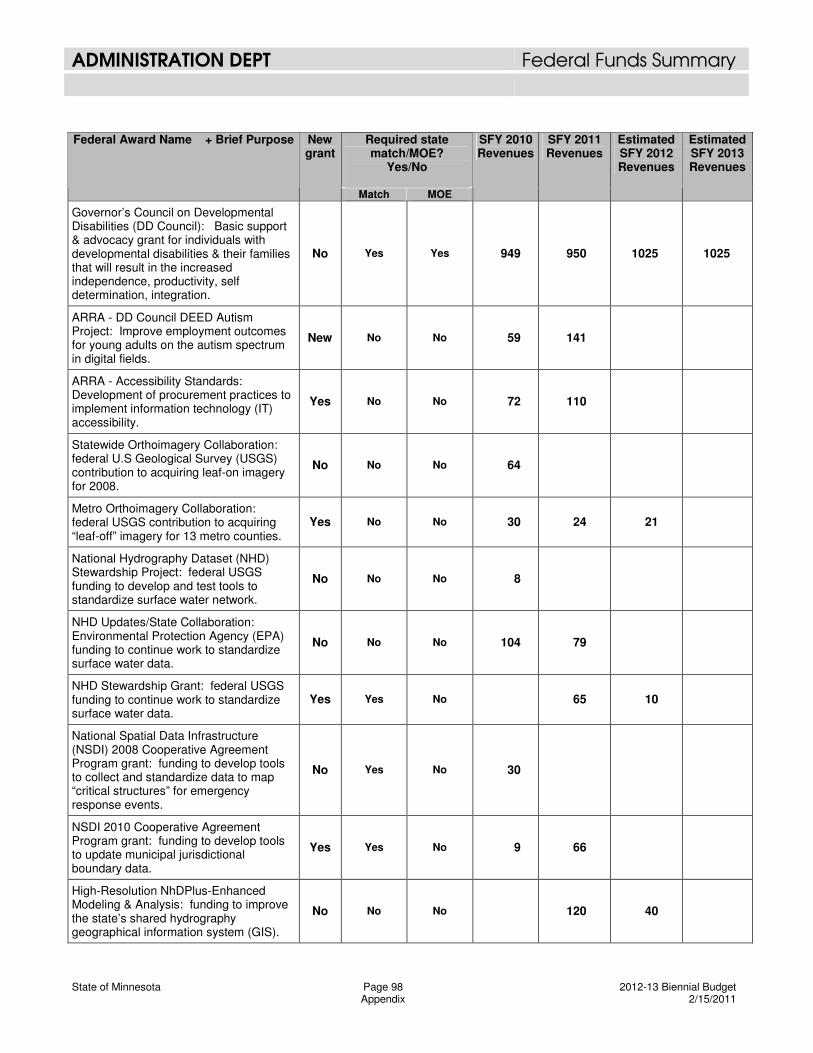
ADMINISTRATION DEPT Federal Funds Summary
State of Minnesota Page 98 2012-13 Biennial Budget Appendix 2/15/2011
Required state match/MOE?
Yes/No
Federal Award Name + Brief Purpose New grant
Match MOE
SFY 2010 Revenues
SFY 2011 Revenues
Estimated SFY 2012 Revenues
Estimated SFY 2013 Revenues
Governor’s Council on Developmental Disabilities (DD Council): Basic support & advocacy grant for individuals with developmental disabilities & their families that will result in the increased independence, productivity, self determination, integration.
No Yes Yes 949 950 1025 1025
ARRA - DD Council DEED Autism Project: Improve employment outcomes for young adults on the autism spectrum in digital fields.
New No No 59 141
ARRA - Accessibility Standards: Development of procurement practices to implement information technology (IT) accessibility.
Yes No No 72 110
Statewide Orthoimagery Collaboration: federal U.S Geological Survey (USGS) contribution to acquiring leaf-on imagery for 2008.
No No No 64
Metro Orthoimagery Collaboration: federal USGS contribution to acquiring “leaf-off” imagery for 13 metro counties.
Yes No No 30 24 21
National Hydrography Dataset (NHD) Stewardship Project: federal USGS funding to develop and test tools to standardize surface water network.
No No No 8
NHD Updates/State Collaboration: Environmental Protection Agency (EPA) funding to continue work to standardize surface water data.
No No No 104 79
NHD Stewardship Grant: federal USGS funding to continue work to standardize surface water data.
Yes Yes No 65 10
National Spatial Data Infrastructure (NSDI) 2008 Cooperative Agreement Program grant: funding to develop tools to collect and standardize data to map “critical structures” for emergency response events.
No Yes No 30
NSDI 2010 Cooperative Agreement Program grant: funding to develop tools to update municipal jurisdictional boundary data.
Yes Yes No 9 66
High-Resolution NhDPlus-Enhanced Modeling & Analysis: funding to improve the state’s shared hydrography geographical information system (GIS).
No No No 120 40

ADMINISTRATION DEPT Federal Funds Summary
State of Minnesota Page 99 2012-13 Biennial Budget Appendix 2/15/2011
Required state match/MOE?
Yes/No
Minnesota Structures Enhancement Project: funding will provide improvements of adding structure data, updating the map library of structures-focuses U.S. National Grid maps, and enhancing the web-based data entry and updating tools.
Yes Yes No 22 3
ARRA Commerce Stimulus Funds: These funds are to make improvements to state facilities to enhance energy efficiency by Admin, in cooperation with Commerce. In accordance with MS16B.322, this program identifies and implements energy-related improvements in state-owned buildings.
Yes No Yes 85 2,500 4,237
System of Technology to Achieve Results (STAR): This funding must be expended specifically for AT device demonstration, AT devise reuse, training, transition services, public awareness and technical assistance related to AT.
No No No 503 482 482 482
2010 Census Group Quarters Count Review: Funding received for reviewing counts of housing units to receive a 2010 Census form in February 2010 and review counts of group facilities, such as college dorms, nursing homes, prisons and other group facilities during August 2010.
Yes No No 14
Total 1,927 4,559 5,818 1,507
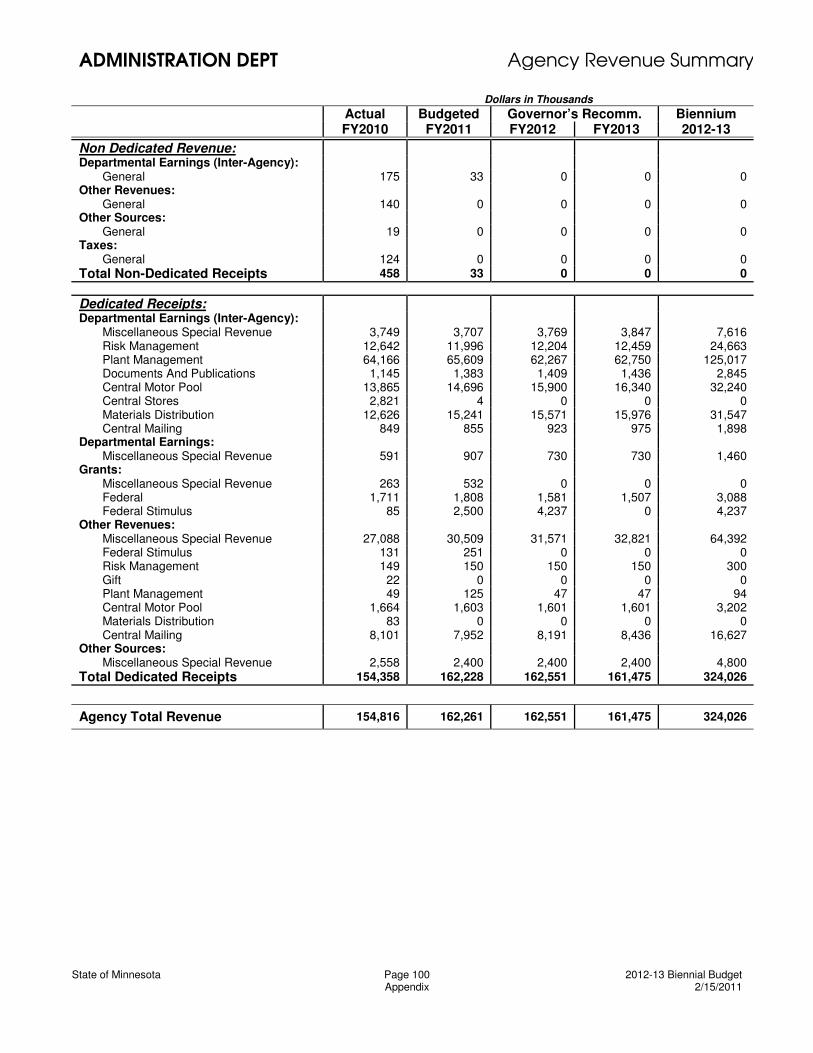
ADMINISTRATION DEPT Agency Revenue Summary
Dollars in Thousands Actual Budgeted Governor’s Recomm. Biennium FY2010 FY2011 FY2012 FY2013 2012-13
State of Minnesota Page 100 2012-13 Biennial Budget Appendix 2/15/2011
Non Dedicated Revenue: Departmental Earnings (Inter-Agency): General 175 33 0 0 0 Other Revenues: General 140 0 0 0 0 Other Sources: General 19 0 0 0 0 Taxes: General 124 0 0 0 0 Total Non-Dedicated Receipts 458 33 0 0 0
Dedicated Receipts: Departmental Earnings (Inter-Agency): Miscellaneous Special Revenue 3,749 3,707 3,769 3,847 7,616 Risk Management 12,642 11,996 12,204 12,459 24,663 Plant Management 64,166 65,609 62,267 62,750 125,017 Documents And Publications 1,145 1,383 1,409 1,436 2,845 Central Motor Pool 13,865 14,696 15,900 16,340 32,240 Central Stores 2,821 4 0 0 0 Materials Distribution 12,626 15,241 15,571 15,976 31,547 Central Mailing 849 855 923 975 1,898 Departmental Earnings: Miscellaneous Special Revenue 591 907 730 730 1,460 Grants: Miscellaneous Special Revenue 263 532 0 0 0 Federal 1,711 1,808 1,581 1,507 3,088 Federal Stimulus 85 2,500 4,237 0 4,237 Other Revenues: Miscellaneous Special Revenue 27,088 30,509 31,571 32,821 64,392 Federal Stimulus 131 251 0 0 0 Risk Management 149 150 150 150 300 Gift 22 0 0 0 0 Plant Management 49 125 47 47 94 Central Motor Pool 1,664 1,603 1,601 1,601 3,202 Materials Distribution 83 0 0 0 0 Central Mailing 8,101 7,952 8,191 8,436 16,627 Other Sources: Miscellaneous Special Revenue 2,558 2,400 2,400 2,400 4,800 Total Dedicated Receipts 154,358 162,228 162,551 161,475 324,026
Agency Total Revenue 154,816 162,261 162,551 161,475 324,026