adjusted esip final 2016-2019
TRANSCRIPT

1
Chapter 1
VISION, MISSION, AND CORE VALUES
Vision, mission and core values statements serve as the guide of Tinago National High School. It help communicate the goals of the plan to employees and to all stakeholders. Vision statements help define the purpose of the department and gives direction for employees and helps provide inspiration. In like manner, mission statement clarifies the purpose and the SMART objectives of the Department of Education. Core values support the vision, shape the culture and reflects values of the school and the department as a whole.
The Vision
We dream of Filipinos, who passionately love their country and whose values and competencies enable them to realize their full potential and contribute meaningfully to building the nation. As a learner-centered public institution the Department of Education continuously improves itself to better serve its stakeholders. The Mission
To protect and promote the right of every Filipino to quality, equitable, culture-based, and complete basic education where:
Students learn in a child-friendly, gender-sensitive, safe, and motivating environment;
Teachers facilitate learning and constantly nurture every learner; Administrators and staff, as stewards of the institution, ensure and enabling
and supportive environment for effective learning to happen; and Family, community, and other stakeholders are actively engaged and share
responsibility for developing life-long learners.
The Core Values
Makadiyos,
Makatao,
Makakalikasan,
Makabansa
2
Chapter 2
SCHOOLS CURRENT SITUATION This chapter includes the school background and the school profile based on the SRC classified into access, quality, and governance.
School Background Tinago National High School is one of the barangay nationalized high schools of Inopacan, Leyte bearing the school ID number 303439. It was established on June 1, 1971. It is located at San Roque St. of Barangay Tinago which is along the national highway adjacent to Tinago Elementary School. It is 200 meters away from the Poblacion and 500 meters away from the nearest public secondary school which is the Inopacan NHS. It is 200 meters away from the nearest private school and district office. Most of the students from this school used to ride tricycle in going to school and in going back to their respective home. The school is also situated near the coastal area wherein majority of the students are from families of fishermen, laborers, and vendors. Majority belongs to families whose income is at poverty level. Moreover, most of the students are recipient of the Conditional Cash Transfer or Pantawid Pamilyang Pinoy Program or 4Ps.1
Tinago National High School is also one of the schools under DepEd Leyte Division which office is accessible by van for three hours as it is 120.55 kilometer away from the school location.2 For the past three years, the school had experienced instances of students’ misconduct and untoward actions against school property such as theft and even attempted arson as human induced hazards. Likewise, the school also encountered natural hazards such as earthquake and typhoons that leave minor damages and destructions in some school’s buildings and properties. The school is located near the coastal area but it is situated at the top of the hill of about 15 meters above sea level. Thus, the municipality has been using the school as one of the evacuation centers especially during typhoons. The school is headed by Mr. Alejandro P. Renomeron, Principal II and Mr. Jaime G. Dianon, Head Teacher III, a Department Head who act as Officer in Charge if the principal is not around. The school has twenty five teachers; twenty-two are in Junior High School and three are in Senior High School handling full load.
3
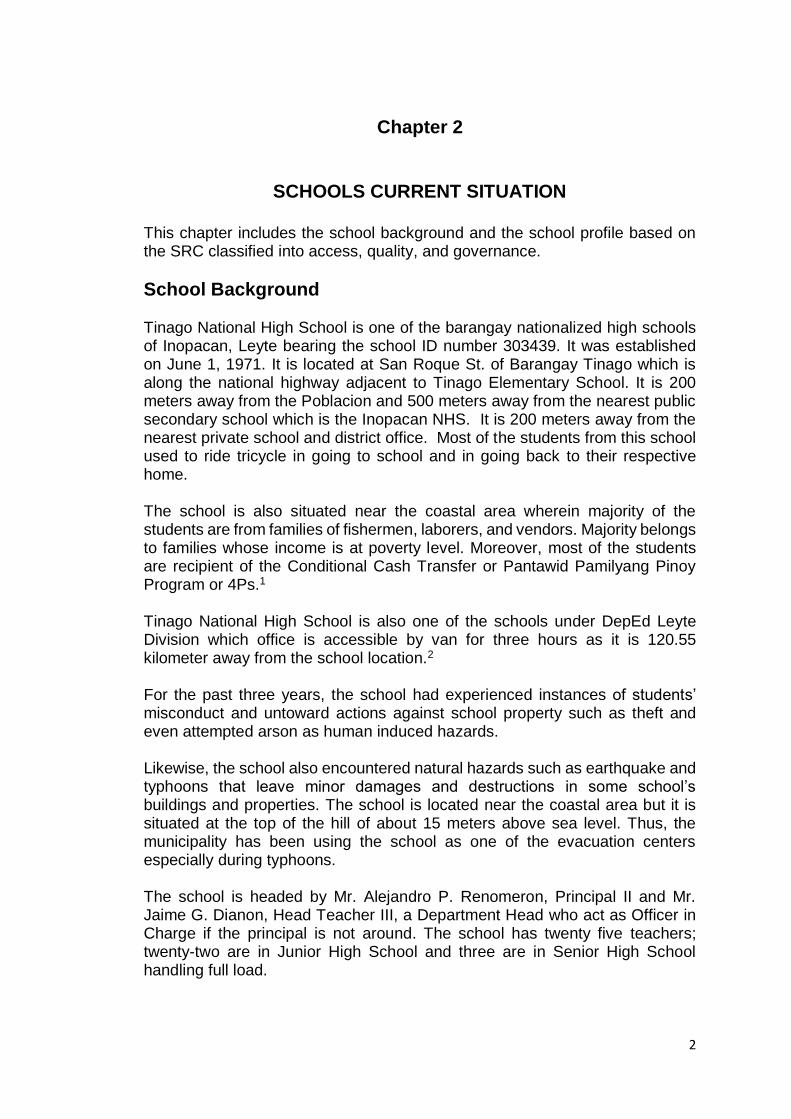
The School Profile ACESS 1. Number of Rate of Dropouts by Cause
Data shows a fluctuating trend for males, and decreasing trend for females. The total dropout rate of the school is fluctuating. The number one cause of dropout of students lies on the influence of students to different vices.
Figure 1: Number of Dropouts by Cause
Figure 2: Dropout Rate by Sex
3.94
1.79
2.86
0.97 1.06 1.01
2.6
0.67
3
0
0.5
1
1.5
2
2.5
3
3.5
4
4.5
Male Female Total
Dropout Rate by Sex for the Last Three Years
2013-14 2014-15 2015-16
4
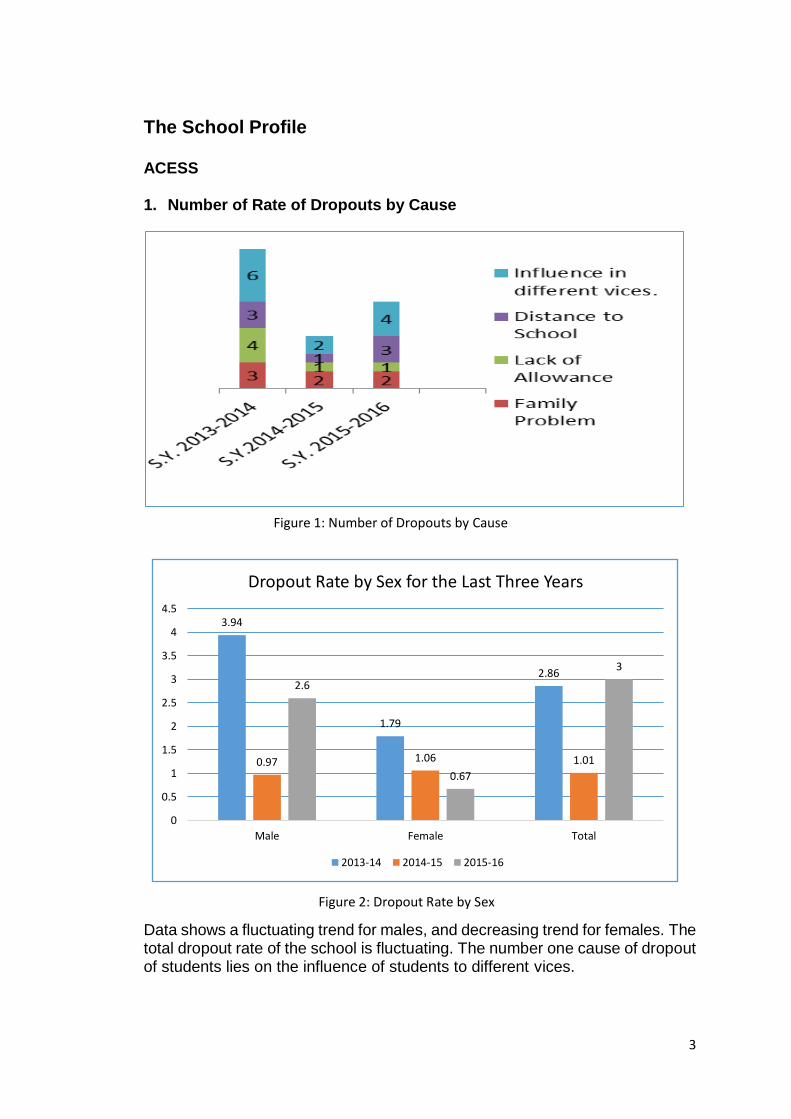
2. Attendance
Data shows that there is an increasing trend of students’ percentage of attendance for the last three years. It further shows that the increasing trend is directly proportional to the increasing trend of the Conditional Cash Transfer Program or 4Ps (Pantawid Pamilyang Pilipino Program) students which help them cater their daily needs in school, that the program require them to comply at least 90% attendance. Moreover, only few students cannot comply the 85% attendance yet their attendance still fall within 85 to 89% as reflected in the Quarterly School Monitoring, Evaluation and Adjustment (SMEA) report.
490
559
87.66
547591
92.55
565606
93.23
0
100
200
300
400
500
600
700
Total Enrolment %age Attendance
Number of Students Attending Classes with at Least 90% Attendance
SY: 2013-2014 SY: 2014-2015 SY: 2015-2016
120132
194
0
50
100
150
200
250
4Ps beneficiaries
TINAGO NHS 4Ps BENEFICIARIES
2013-14 2014-15 2015-16
Figure 3: Students Attending Classes with at Least 90% Attendance
Figure 4: Number of 4Ps BENEFICIARIES
5
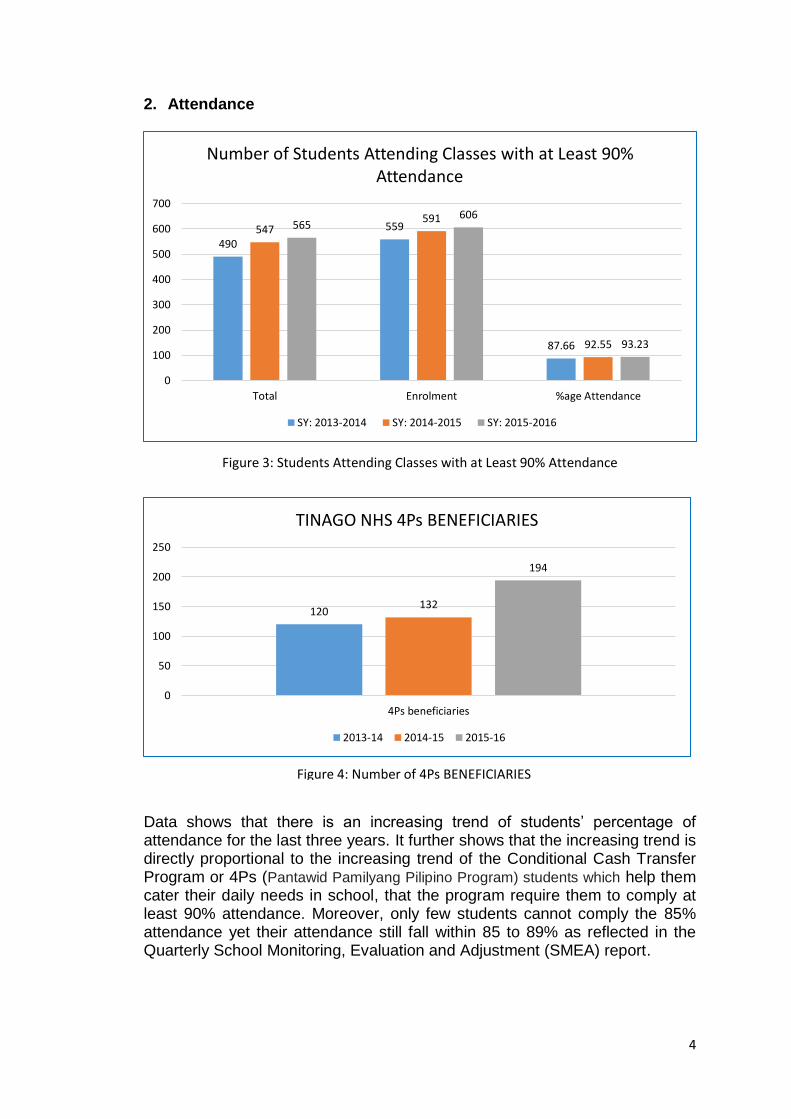
3. Tardiness
Figure 5 shows decreasing trend of tardy students in the last three years. This
is due to the disciplinary actions implemented by the school controlling the
tardiness of the students.
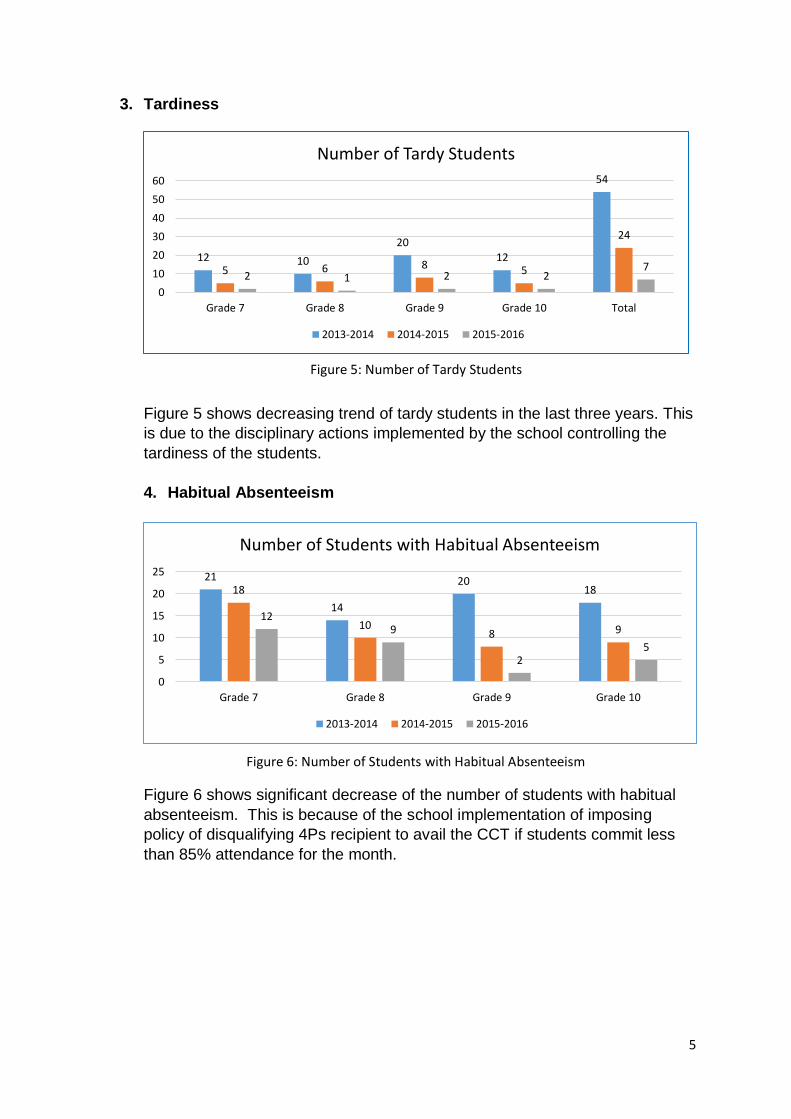
4. Habitual Absenteeism
Figure 6 shows significant decrease of the number of students with habitual
absenteeism. This is because of the school implementation of imposing
policy of disqualifying 4Ps recipient to avail the CCT if students commit less
than 85% attendance for the month.
12 10
2012
54
5 6 8 5
24
2 1 2 27
0
10
20
30
40
50
60
Grade 7 Grade 8 Grade 9 Grade 10 Total
Number of Tardy Students
2013-2014 2014-2015 2015-2016
21
14
201818
108 9
129
25
0
5
10
15
20
25
Grade 7 Grade 8 Grade 9 Grade 10
Number of Students with Habitual Absenteeism
2013-2014 2014-2015 2015-2016
Figure 5: Number of Tardy Students
Figure 6: Number of Students with Habitual Absenteeism
6
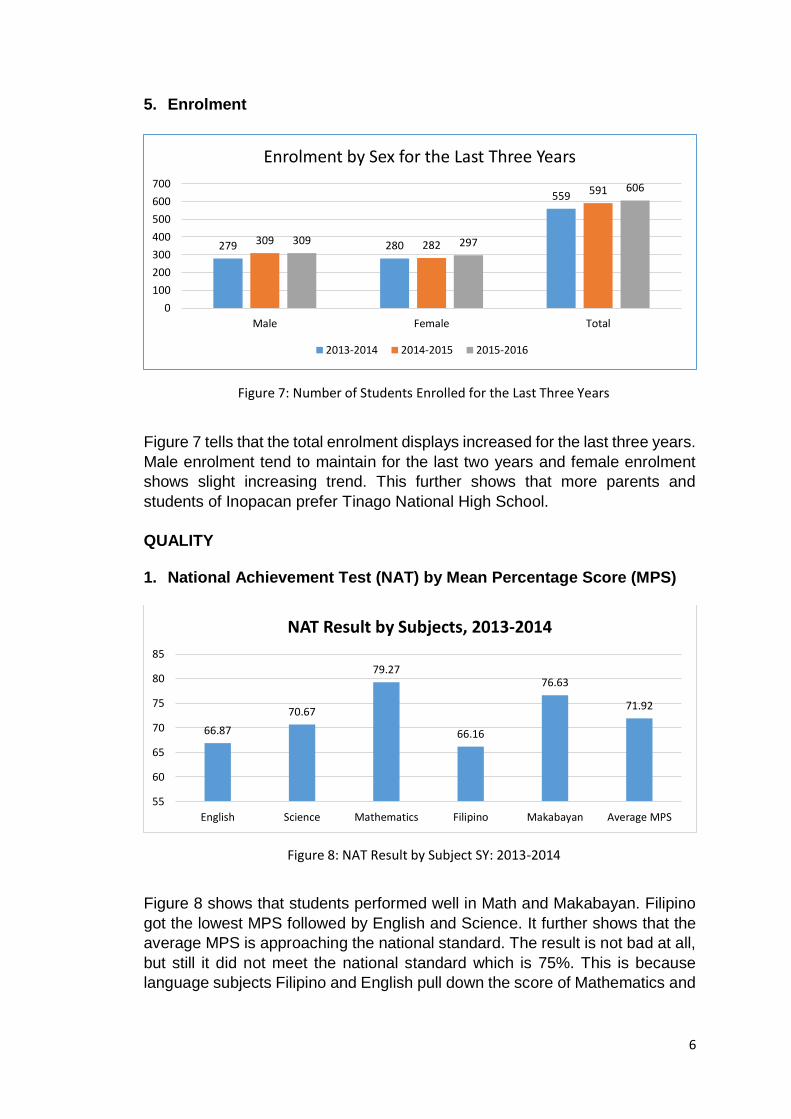
5. Enrolment
Figure 7 tells that the total enrolment displays increased for the last three years.
Male enrolment tend to maintain for the last two years and female enrolment
shows slight increasing trend. This further shows that more parents and
students of Inopacan prefer Tinago National High School.
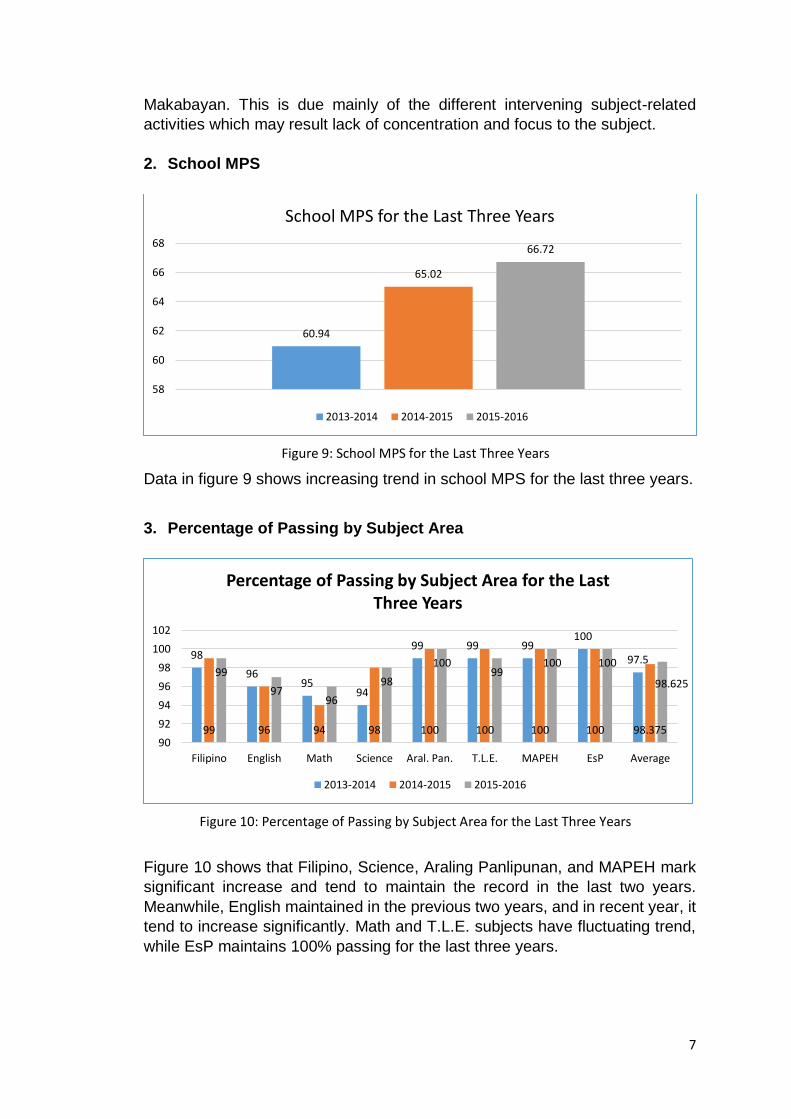
QUALITY 1. National Achievement Test (NAT) by Mean Percentage Score (MPS)
Figure 8 shows that students performed well in Math and Makabayan. Filipino
got the lowest MPS followed by English and Science. It further shows that the
average MPS is approaching the national standard. The result is not bad at all,
but still it did not meet the national standard which is 75%. This is because
language subjects Filipino and English pull down the score of Mathematics and
279 280
559
309 282
591
309 297
606
0
100
200
300
400
500
600
700
Male Female Total
Enrolment by Sex for the Last Three Years
2013-2014 2014-2015 2015-2016
66.87
70.67
79.27
66.16
76.63
71.92
55
60
65
70
75
80
85
English Science Mathematics Filipino Makabayan Average MPS
NAT Result by Subjects, 2013-2014
Figure 7: Number of Students Enrolled for the Last Three Years
Figure 8: NAT Result by Subject SY: 2013-2014
7
Makabayan. This is due mainly of the different intervening subject-related
activities which may result lack of concentration and focus to the subject.
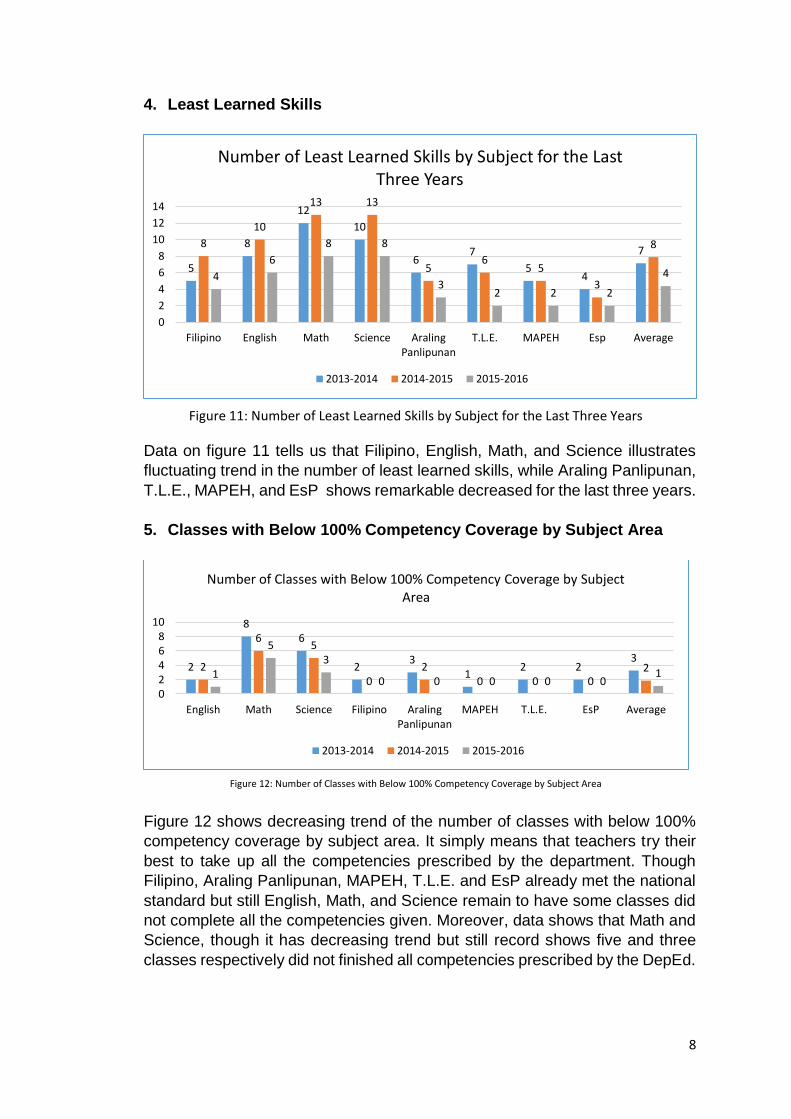
2. School MPS
Data in figure 9 shows increasing trend in school MPS for the last three years.
3. Percentage of Passing by Subject Area
Figure 10 shows that Filipino, Science, Araling Panlipunan, and MAPEH mark
significant increase and tend to maintain the record in the last two years.
Meanwhile, English maintained in the previous two years, and in recent year, it
tend to increase significantly. Math and T.L.E. subjects have fluctuating trend,
while EsP maintains 100% passing for the last three years.
60.94
65.02
66.72
58
60
62
64
66
68
School MPS for the Last Three Years
2013-2014 2014-2015 2015-2016
98
9695
94
99 99 99100
97.5
99 96 94 98 100 100 100 100 98.375
99
9796
98
10099
100 100
98.625
90
92
94
96
98
100
102
Filipino English Math Science Aral. Pan. T.L.E. MAPEH EsP Average
Percentage of Passing by Subject Area for the Last Three Years
2013-2014 2014-2015 2015-2016
Figure 9: School MPS for the Last Three Years
Figure 10: Percentage of Passing by Subject Area for the Last Three Years
8
4. Least Learned Skills
Data on figure 11 tells us that Filipino, English, Math, and Science illustrates
fluctuating trend in the number of least learned skills, while Araling Panlipunan,
T.L.E., MAPEH, and EsP shows remarkable decreased for the last three years.
5. Classes with Below 100% Competency Coverage by Subject Area
Figure 12 shows decreasing trend of the number of classes with below 100%
competency coverage by subject area. It simply means that teachers try their
best to take up all the competencies prescribed by the department. Though
Filipino, Araling Panlipunan, MAPEH, T.L.E. and EsP already met the national
standard but still English, Math, and Science remain to have some classes did
not complete all the competencies given. Moreover, data shows that Math and
Science, though it has decreasing trend but still record shows five and three
classes respectively did not finished all competencies prescribed by the DepEd.
5
8
12
10
67
54
78
10
13 13
56
5
3
8
4
6
8 8
32 2 2
4
0
2
4
6
8
10
12
14
Filipino English Math Science AralingPanlipunan
T.L.E. MAPEH Esp Average
Number of Least Learned Skills by Subject for the Last Three Years
2013-2014 2014-2015 2015-2016
2
86
23
12 2
32
65
02
0 0 02
1
53
0 0 0 0 01
02468
10
English Math Science Filipino AralingPanlipunan
MAPEH T.L.E. EsP Average
Number of Classes with Below 100% Competency Coverage by Subject Area
2013-2014 2014-2015 2015-2016
Figure 11: Number of Least Learned Skills by Subject for the Last Three Years
Figure 12: Number of Classes with Below 100% Competency Coverage by Subject Area
9
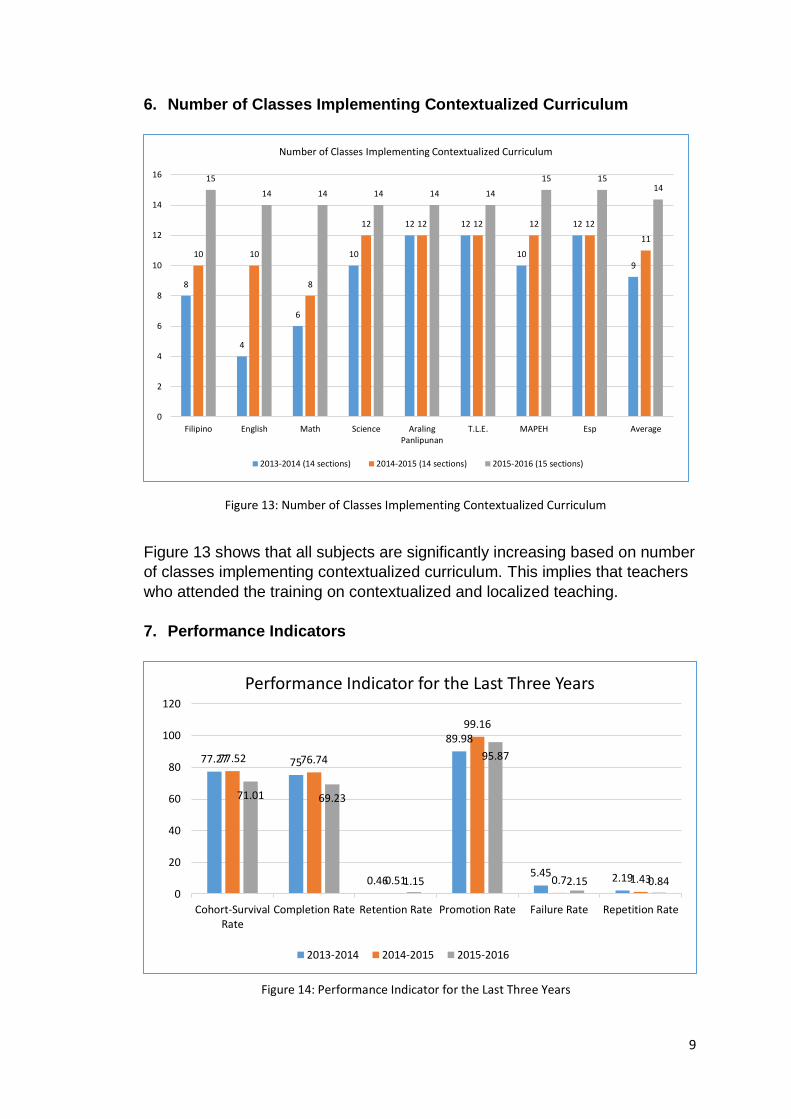
6. Number of Classes Implementing Contextualized Curriculum
Figure 13 shows that all subjects are significantly increasing based on number
of classes implementing contextualized curriculum. This implies that teachers
who attended the training on contextualized and localized teaching.
7. Performance Indicators
8
4
6
10
12 12
10
12
910 10
8
12 12 12 12 12
11
15
14 14 14 14 14
15 1514
0
2
4
6
8
10
12
14
16
Filipino English Math Science AralingPanlipunan
T.L.E. MAPEH Esp Average
Number of Classes Implementing Contextualized Curriculum
2013-2014 (14 sections) 2014-2015 (14 sections) 2015-2016 (15 sections)
77.27 75
0.46
89.98
5.45 2.19
77.52 76.74
0.51
99.16
0.7 1.43
71.01 69.23
1.15
95.87
2.15 0.840
20
40
60
80
100
120
Cohort-SurvivalRate
Completion Rate Retention Rate Promotion Rate Failure Rate Repetition Rate
Performance Indicator for the Last Three Years
2013-2014 2014-2015 2015-2016
Figure 13: Number of Classes Implementing Contextualized Curriculum
Figure 14: Performance Indicator for the Last Three Years
10
Figure 14 shows the performance rating of the school for the last three years.
Cohort-Survival Rate is fluctuating, as it slightly increase in SY 2014-2015 but
it decreased significantly in the succeeding school year. The same is true with
the Completion Rate, it slightly increase in SY 2014-2015 but significantly
decreased in the succeeding school year. Retention Rate are increasing
slightly in SY 2013-2014 to 2014-2015, but significant increased shown in the
succeeding school year. Promotion Rate shows fluctuating trend, with
significant increased from SY 2013-2014 to 2014-2015 but slight decreased in
SY 2015-2016. Failure Rate of the school is also fluctuating, it significantly
decreased with a difference of 4.75% in SY 2014-2015 which reached 0.7%
and in the succeeding SY it significantly increased from 0.7% to 2.15%.
Repetition Rate is constantly decreasing for the last three years. The root
causes of this performance rating is anchored to the students who always
commit habitual absences, tardiness, and failure of complying the
requirements of the subjects, due mainly to their untoward attitudes due to
influence in different vices, lack of parents support in terms of moral and
financial matters, inadequate knowledge in fundamentals of Mathematics
subject, and inability to comprehend what they read.
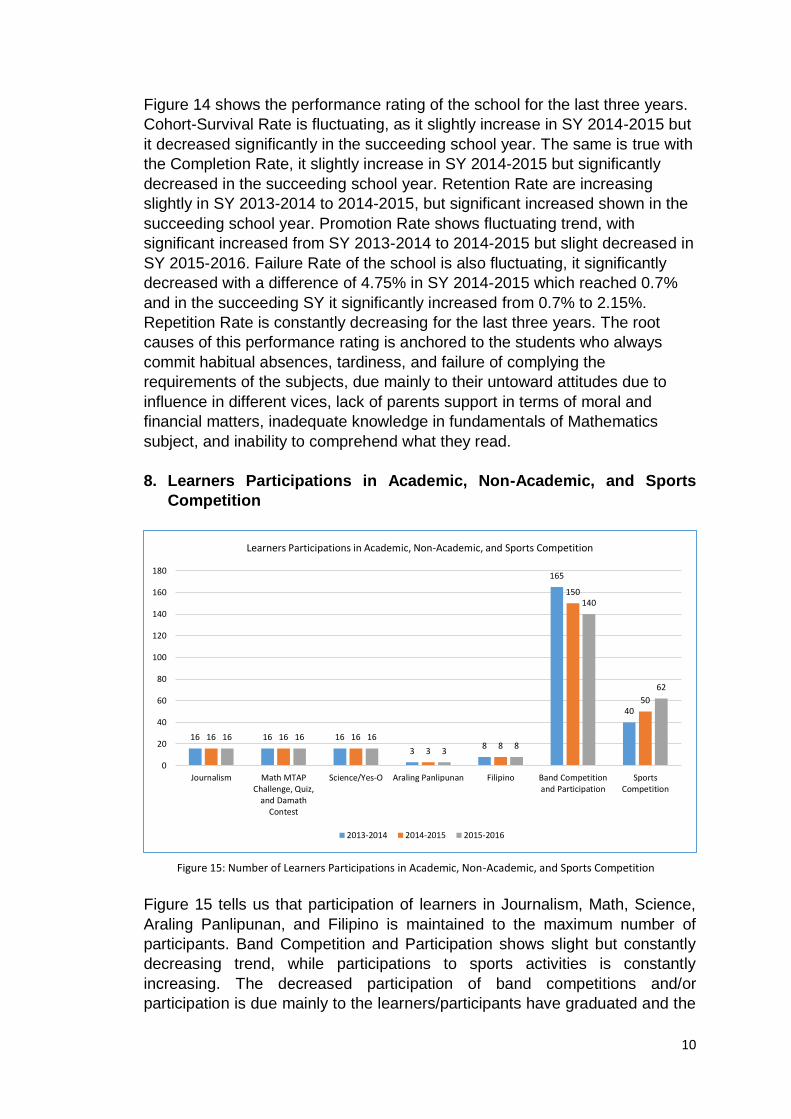
8. Learners Participations in Academic, Non-Academic, and Sports
Competition
Figure 15 tells us that participation of learners in Journalism, Math, Science,
Araling Panlipunan, and Filipino is maintained to the maximum number of
participants. Band Competition and Participation shows slight but constantly
decreasing trend, while participations to sports activities is constantly
increasing. The decreased participation of band competitions and/or
participation is due mainly to the learners/participants have graduated and the
16 16 16
38
165
40
16 16 16
38
150
50
16 16 16
38
140
62
0
20
40
60
80
100
120
140
160
180
Journalism Math MTAPChallenge, Quiz,
and DamathContest
Science/Yes-O Araling Panlipunan Filipino Band Competitionand Participation
SportsCompetition
Learners Participations in Academic, Non-Academic, and Sports Competition
2013-2014 2014-2015 2015-2016
Figure 15: Number of Learners Participations in Academic, Non-Academic, and Sports Competition
11
adviser did not recruit additional participants for the said activities since
members of school band is still at maximum. Sports participation increases
because of additional numbers of athletes were motivated by their coach.
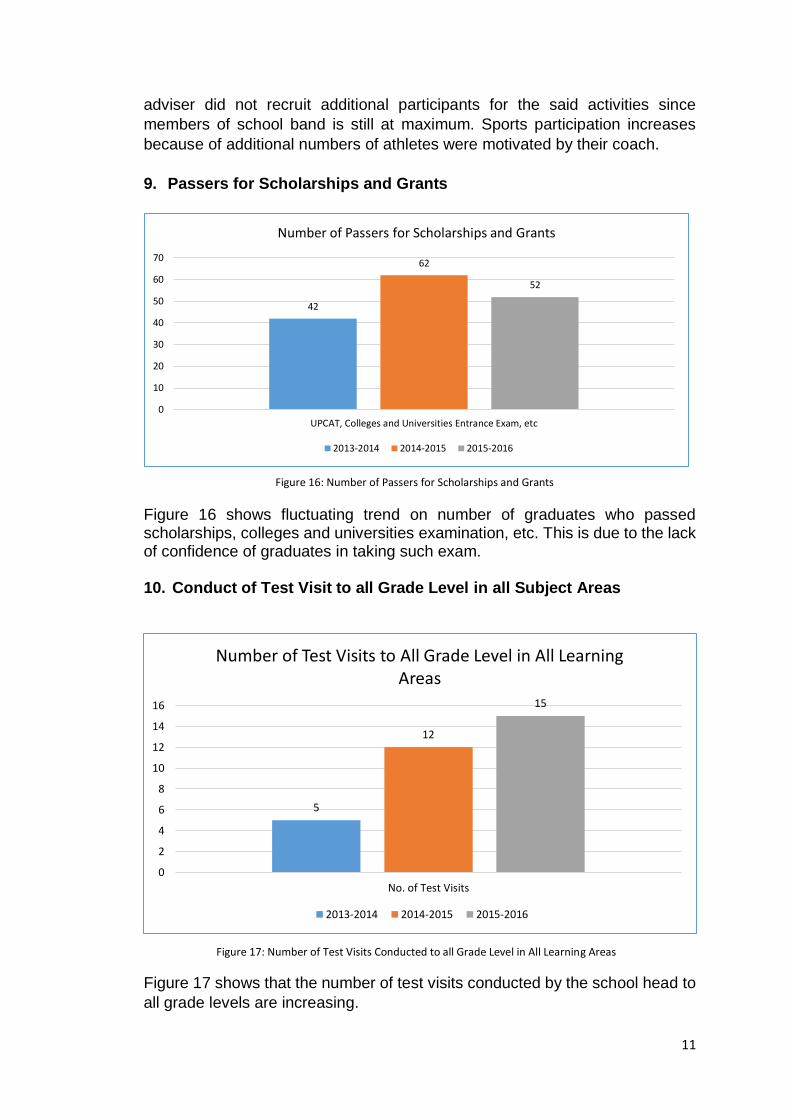
9. Passers for Scholarships and Grants
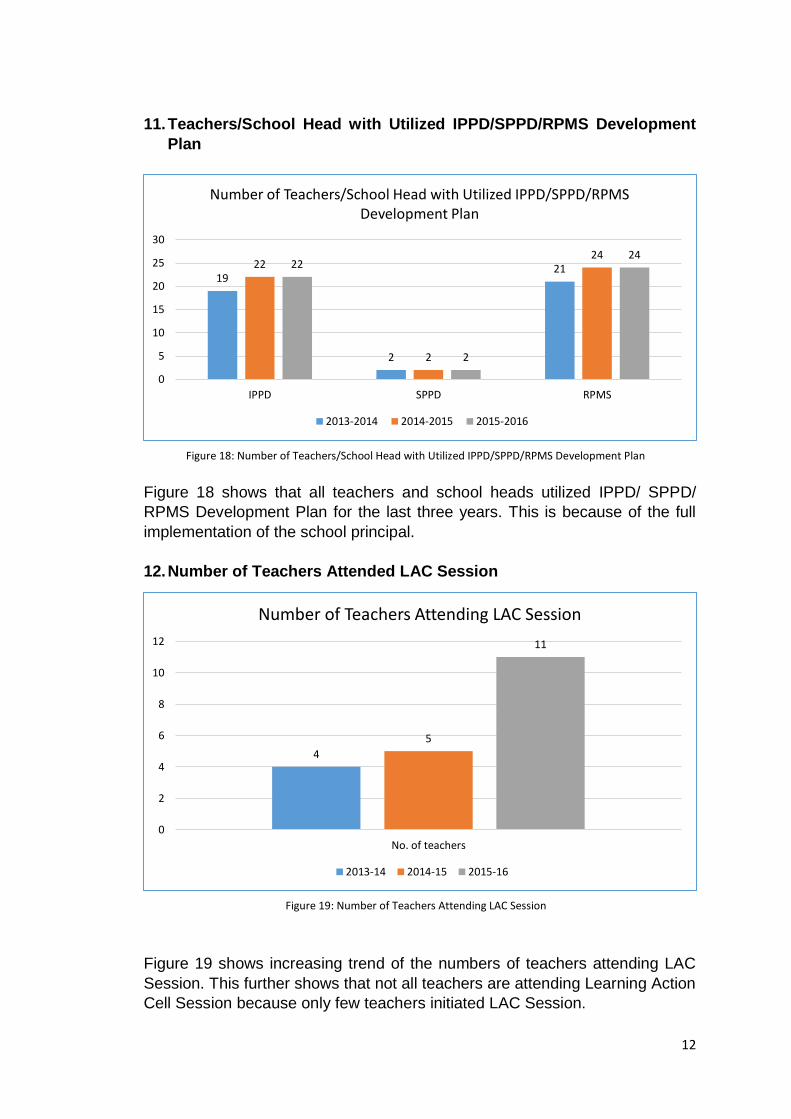
Figure 16 shows fluctuating trend on number of graduates who passed scholarships, colleges and universities examination, etc. This is due to the lack of confidence of graduates in taking such exam. 10. Conduct of Test Visit to all Grade Level in all Subject Areas
Figure 17 shows that the number of test visits conducted by the school head to
all grade levels are increasing.
5
12
15
0
2
4
6
8
10
12
14
16
No. of Test Visits
Number of Test Visits to All Grade Level in All Learning Areas
2013-2014 2014-2015 2015-2016
42
62
52
0
10
20
30
40
50
60
70
UPCAT, Colleges and Universities Entrance Exam, etc
Number of Passers for Scholarships and Grants
2013-2014 2014-2015 2015-2016
Figure 16: Number of Passers for Scholarships and Grants
Figure 17: Number of Test Visits Conducted to all Grade Level in All Learning Areas
12
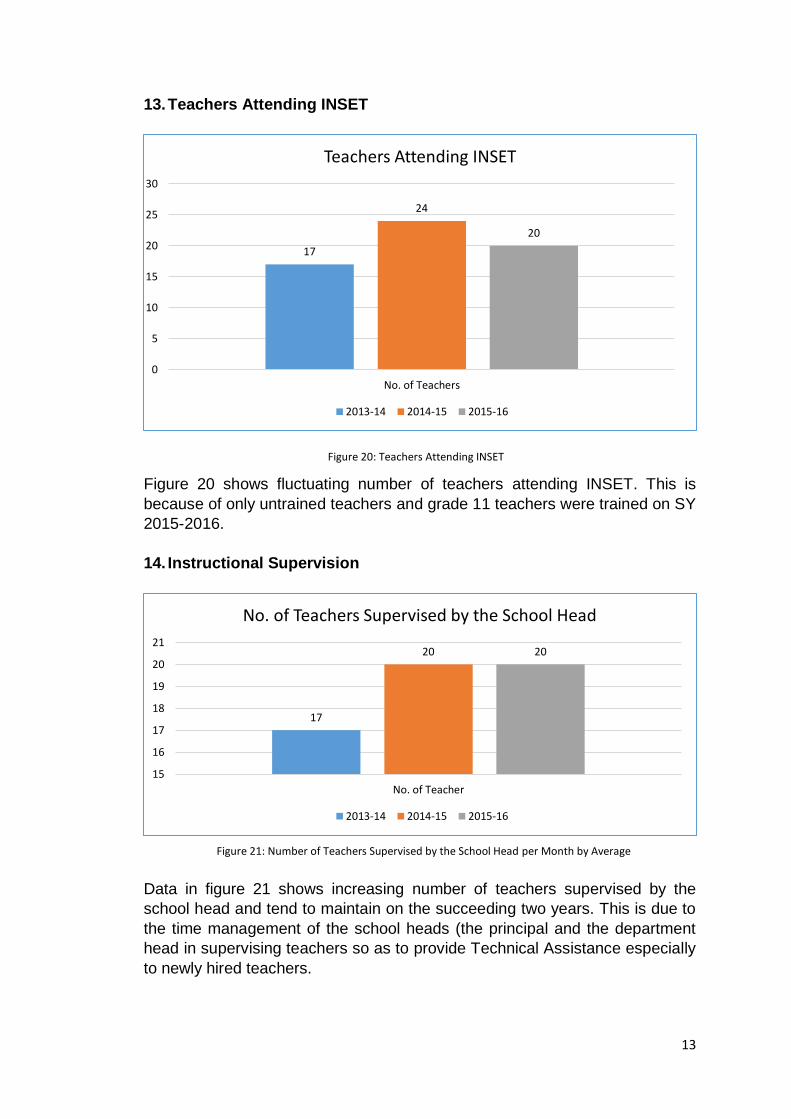
11. Teachers/School Head with Utilized IPPD/SPPD/RPMS Development
Plan
Figure 18 shows that all teachers and school heads utilized IPPD/ SPPD/
RPMS Development Plan for the last three years. This is because of the full
implementation of the school principal.
12. Number of Teachers Attended LAC Session
Figure 19 shows increasing trend of the numbers of teachers attending LAC
Session. This further shows that not all teachers are attending Learning Action
Cell Session because only few teachers initiated LAC Session.
19
2
2122
2
2422
2
24
0
5
10
15
20
25
30
IPPD SPPD RPMS
Number of Teachers/School Head with Utilized IPPD/SPPD/RPMS Development Plan
2013-2014 2014-2015 2015-2016
4
5
11
0
2
4
6
8
10
12
No. of teachers
Number of Teachers Attending LAC Session
2013-14 2014-15 2015-16
Figure 18: Number of Teachers/School Head with Utilized IPPD/SPPD/RPMS Development Plan
Figure 19: Number of Teachers Attending LAC Session
13
13. Teachers Attending INSET
Figure 20 shows fluctuating number of teachers attending INSET. This is
because of only untrained teachers and grade 11 teachers were trained on SY
2015-2016.
14. Instructional Supervision
Data in figure 21 shows increasing number of teachers supervised by the
school head and tend to maintain on the succeeding two years. This is due to
the time management of the school heads (the principal and the department
head in supervising teachers so as to provide Technical Assistance especially
to newly hired teachers.
17
24
20
0
5
10
15
20
25
30
No. of Teachers
Teachers Attending INSET
2013-14 2014-15 2015-16
17
20 20
15
16
17
18
19
20
21
No. of Teacher
No. of Teachers Supervised by the School Head
2013-14 2014-15 2015-16
Figure 20: Teachers Attending INSET
Figure 21: Number of Teachers Supervised by the School Head per Month by Average
14
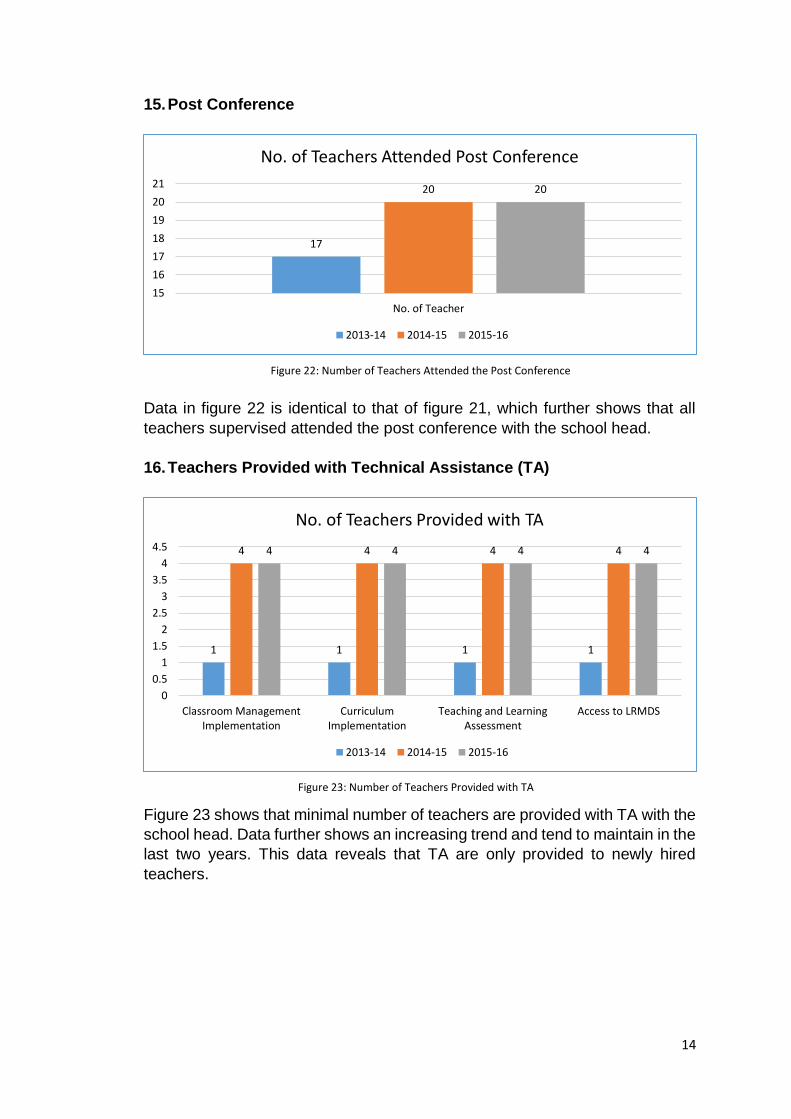
15. Post Conference
Data in figure 22 is identical to that of figure 21, which further shows that all
teachers supervised attended the post conference with the school head.
16. Teachers Provided with Technical Assistance (TA)
Figure 23 shows that minimal number of teachers are provided with TA with the
school head. Data further shows an increasing trend and tend to maintain in the
last two years. This data reveals that TA are only provided to newly hired
teachers.
17
20 20
15
16
17
18
19
20
21
No. of Teacher
No. of Teachers Attended Post Conference
2013-14 2014-15 2015-16
1 1 1 1
4 4 4 44 4 4 4
0
0.5
1
1.5
2
2.5
3
3.5
4
4.5
Classroom ManagementImplementation
CurriculumImplementation
Teaching and LearningAssessment
Access to LRMDS
No. of Teachers Provided with TA
2013-14 2014-15 2015-16
Figure 22: Number of Teachers Attended the Post Conference
Figure 23: Number of Teachers Provided with TA
15
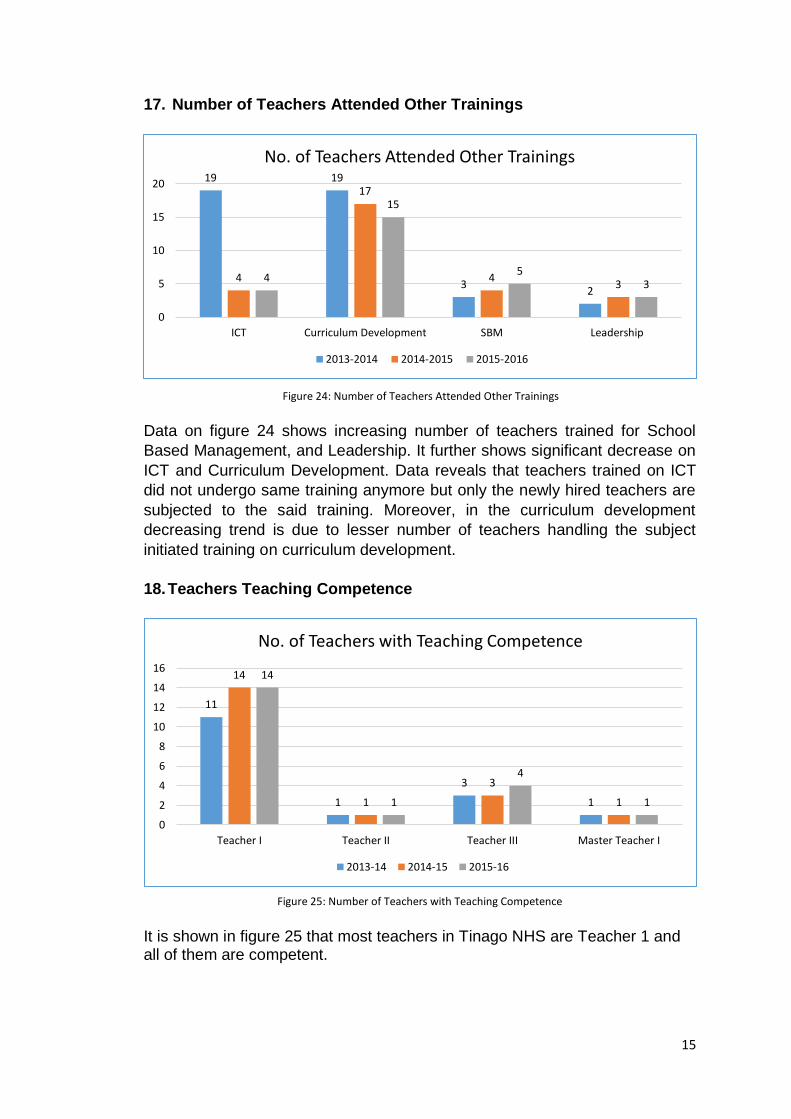
17. Number of Teachers Attended Other Trainings
Data on figure 24 shows increasing number of teachers trained for School
Based Management, and Leadership. It further shows significant decrease on
ICT and Curriculum Development. Data reveals that teachers trained on ICT
did not undergo same training anymore but only the newly hired teachers are
subjected to the said training. Moreover, in the curriculum development
decreasing trend is due to lesser number of teachers handling the subject
initiated training on curriculum development.
18. Teachers Teaching Competence
It is shown in figure 25 that most teachers in Tinago NHS are Teacher 1 and all of them are competent.
19 19
32
4
17
43
4
15
53
0
5
10
15
20
ICT Curriculum Development SBM Leadership
No. of Teachers Attended Other Trainings
2013-2014 2014-2015 2015-2016
Figure 24: Number of Teachers Attended Other Trainings
Figure 25: Number of Teachers with Teaching Competence
11
1
3
1
14
1
3
1
14
1
4
1
0
2
4
6
8
10
12
14
16
Teacher I Teacher II Teacher III Master Teacher I
No. of Teachers with Teaching Competence
2013-14 2014-15 2015-16
Figure 25: Number of Teachers with Teaching Competence
16
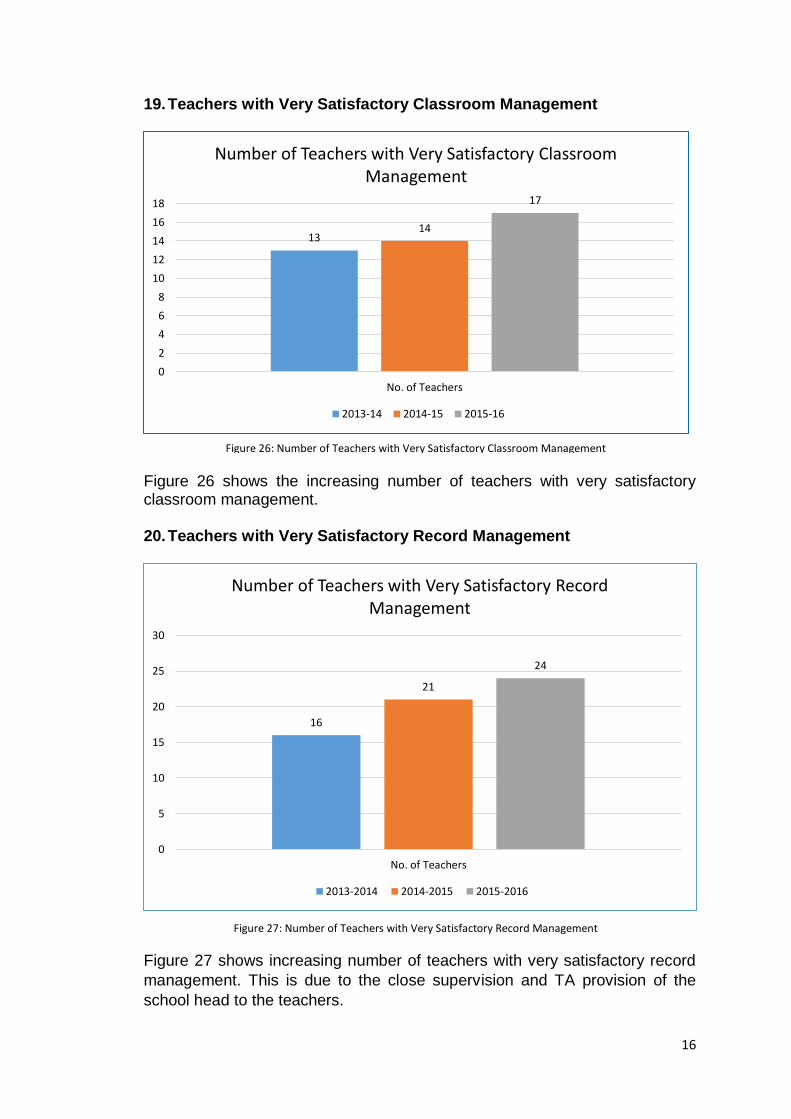
19. Teachers with Very Satisfactory Classroom Management
Figure 26 shows the increasing number of teachers with very satisfactory classroom management. 20. Teachers with Very Satisfactory Record Management
Figure 27 shows increasing number of teachers with very satisfactory record
management. This is due to the close supervision and TA provision of the
school head to the teachers.
1314
17
0
2
4
6
8
10
12
14
16
18
No. of Teachers
Number of Teachers with Very Satisfactory Classroom Management
2013-14 2014-15 2015-16
16
21
24
0
5
10
15
20
25
30
No. of Teachers
Number of Teachers with Very Satisfactory Record Management
2013-2014 2014-2015 2015-2016
Figure 26: Number of Teachers with Very Satisfactory Classroom Management
Figure 27: Number of Teachers with Very Satisfactory Record Management
17
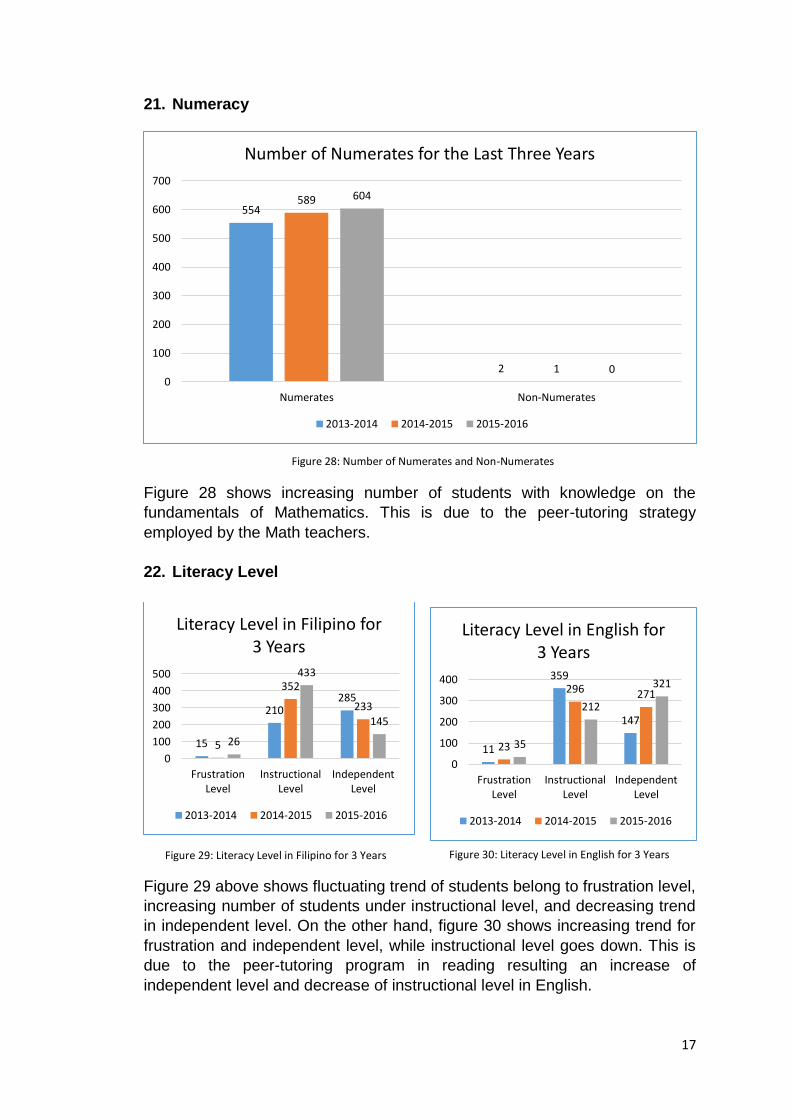
21. Numeracy
Figure 28 shows increasing number of students with knowledge on the
fundamentals of Mathematics. This is due to the peer-tutoring strategy
employed by the Math teachers.
22. Literacy Level
Figure 29 above shows fluctuating trend of students belong to frustration level,
increasing number of students under instructional level, and decreasing trend
in independent level. On the other hand, figure 30 shows increasing trend for
frustration and independent level, while instructional level goes down. This is
due to the peer-tutoring program in reading resulting an increase of
independent level and decrease of instructional level in English.
554
2
589
1
604
00
100
200
300
400
500
600
700
Numerates Non-Numerates
Number of Numerates for the Last Three Years
2013-2014 2014-2015 2015-2016
15
210285
5
352
233
26
433
145
0
100
200
300
400
500
FrustrationLevel
InstructionalLevel
IndependentLevel
Literacy Level in Filipino for 3 Years
2013-2014 2014-2015 2015-2016
Figure 28: Number of Numerates and Non-Numerates
11
359
147
23
296 271
35
212
321
0
100
200
300
400
FrustrationLevel
InstructionalLevel
IndependentLevel
Literacy Level in English for 3 Years
2013-2014 2014-2015 2015-2016
Figure 29: Literacy Level in Filipino for 3 Years Figure 30: Literacy Level in English for 3 Years
18
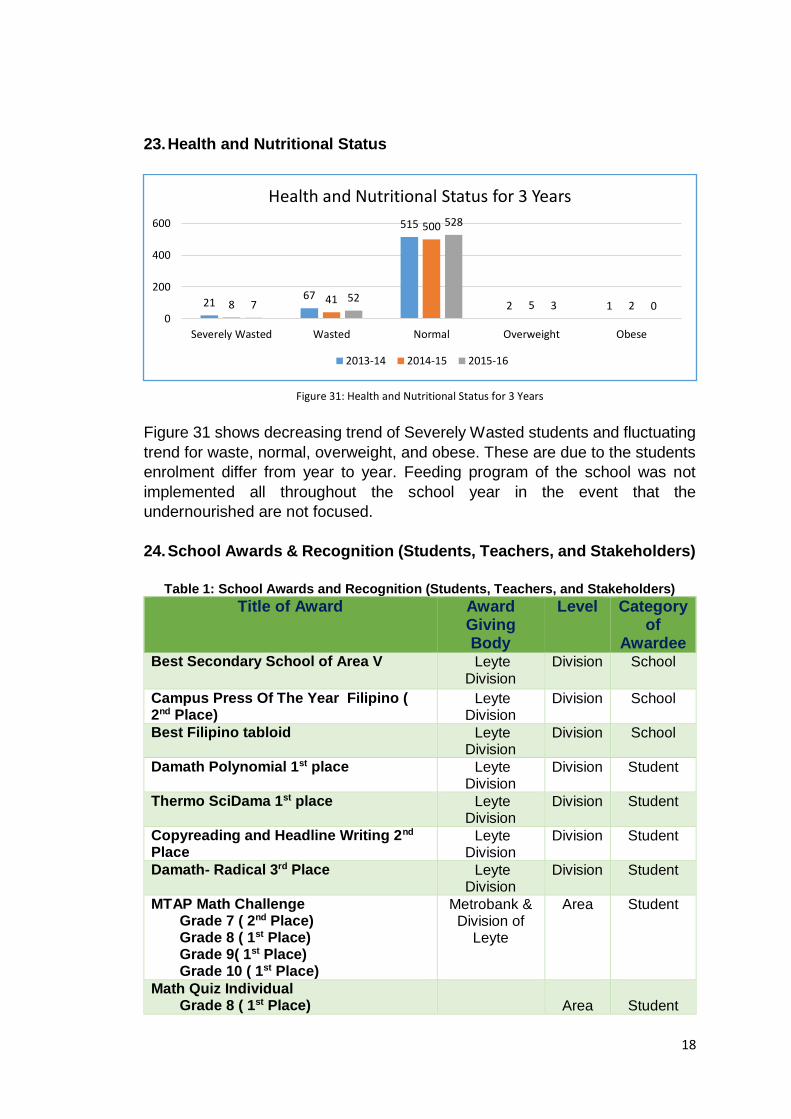
23. Health and Nutritional Status
Figure 31 shows decreasing trend of Severely Wasted students and fluctuating
trend for waste, normal, overweight, and obese. These are due to the students
enrolment differ from year to year. Feeding program of the school was not
implemented all throughout the school year in the event that the
undernourished are not focused.
24. School Awards & Recognition (Students, Teachers, and Stakeholders)
Table 1: School Awards and Recognition (Students, Teachers, and Stakeholders)
Title of Award Award Giving Body
Level Category of
Awardee Best Secondary School of Area V Leyte
Division Division School
Campus Press Of The Year Filipino ( 2nd Place)
Leyte Division
Division School
Best Filipino tabloid Leyte Division
Division School
Damath Polynomial 1st place Leyte Division
Division Student
Thermo SciDama 1st place Leyte Division
Division Student
Copyreading and Headline Writing 2nd Place
Leyte Division
Division Student
Damath- Radical 3rd Place Leyte Division
Division Student
MTAP Math Challenge Grade 7 ( 2nd Place) Grade 8 ( 1st Place) Grade 9( 1st Place) Grade 10 ( 1st Place)
Metrobank & Division of
Leyte
Area Student
Math Quiz Individual Grade 8 ( 1st Place)
Area
Student
2167
515
2 18 41
500
5 2752
528
3 00
200
400
600
Severely Wasted Wasted Normal Overweight Obese
Health and Nutritional Status for 3 Years
2013-14 2014-15 2015-16
Figure 31: Health and Nutritional Status for 3 Years
19
Grade 9 (1st & 2nd place) Grade 10 ( 2nd place)
Division of Leyte
Damath Integers Grade 7-Integers (2nd Place) Grade 8 - Sign Fraction (2nd Place) Grade 9- Radical (1st Place) Grade 10-Polynomial (1st Place)
DepEd Leyte Division
Area
Student
Press Conference News Writing English (1st Place)
Copyreading & Headline Writing English (1st Place)
Editorial Cartooning English (3rd Place) Pagsusulat ng Editoryal (2nd Place) Science Feature Writing English (3rd
Place) Pagsusulat ng Lathalain
Pang-agham ( 2nd place) Pagsusulat ng Lathalain (2nd Place) Pagwawasto at Pagsasaulo ng
Balita ( 3rd Place)
DepEd Leyte Division
Area
Student
Table 1 shows that Tinago NHS also excel in many field. The school was
chosen as Best Secondary School of Area V last 2009 through “Pasidungog”.
It was also chosen as 2nd place as Campus Press of the Year for Filipino
Category Division Level last 2014 and one of the Best Filipino Tabloid for the
year 2015 Regional Level that represents the Region in the National Level.
Students from this school also top consistently on different contests such as
Math Quiz, Metrobank-DepEd Math Challenge, DaMath, SciDama, and press
conference writing contests both in area and division level. Thus, modesty aside
teachers and students in this school are competent.
GOVERNANCE
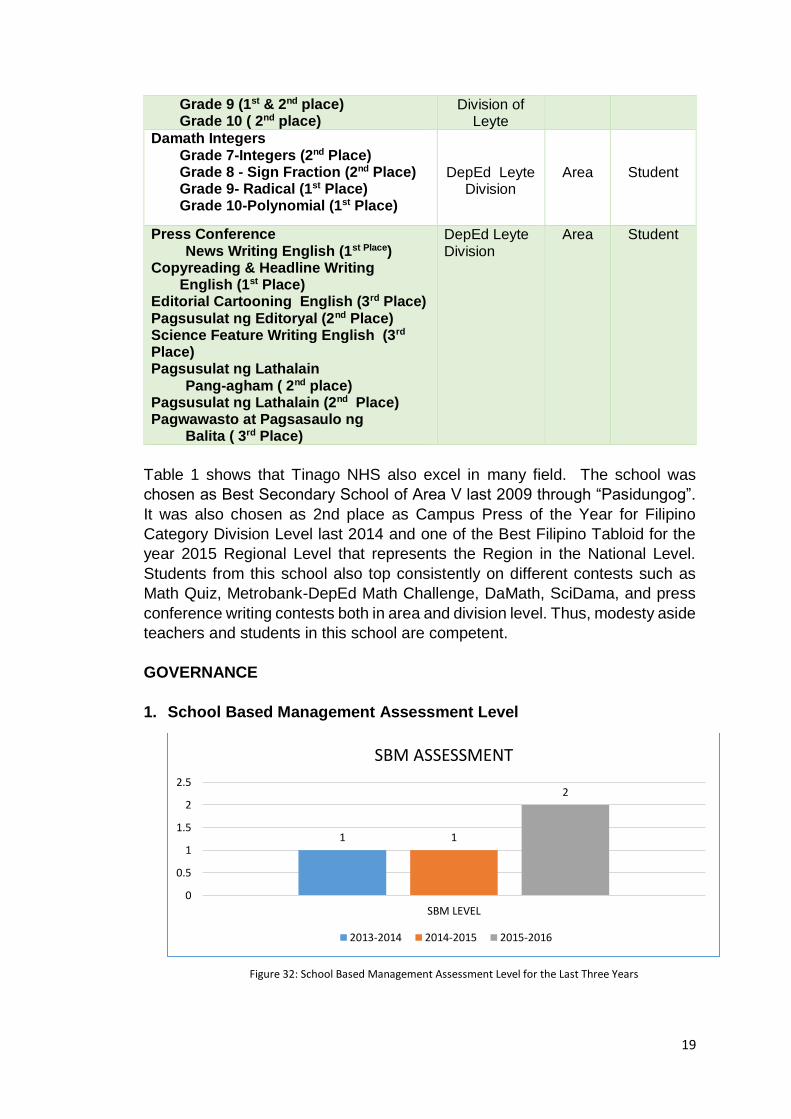
1. School Based Management Assessment Level
1 1
2
0
0.5
1
1.5
2
2.5
SBM LEVEL
SBM ASSESSMENT
2013-2014 2014-2015 2015-2016
Figure 32: School Based Management Assessment Level for the Last Three Years
20
Figure 32 shows that SBM level increases on the last year. This is because of
the joint effort of all teaching forces of the school headed by the school principal.
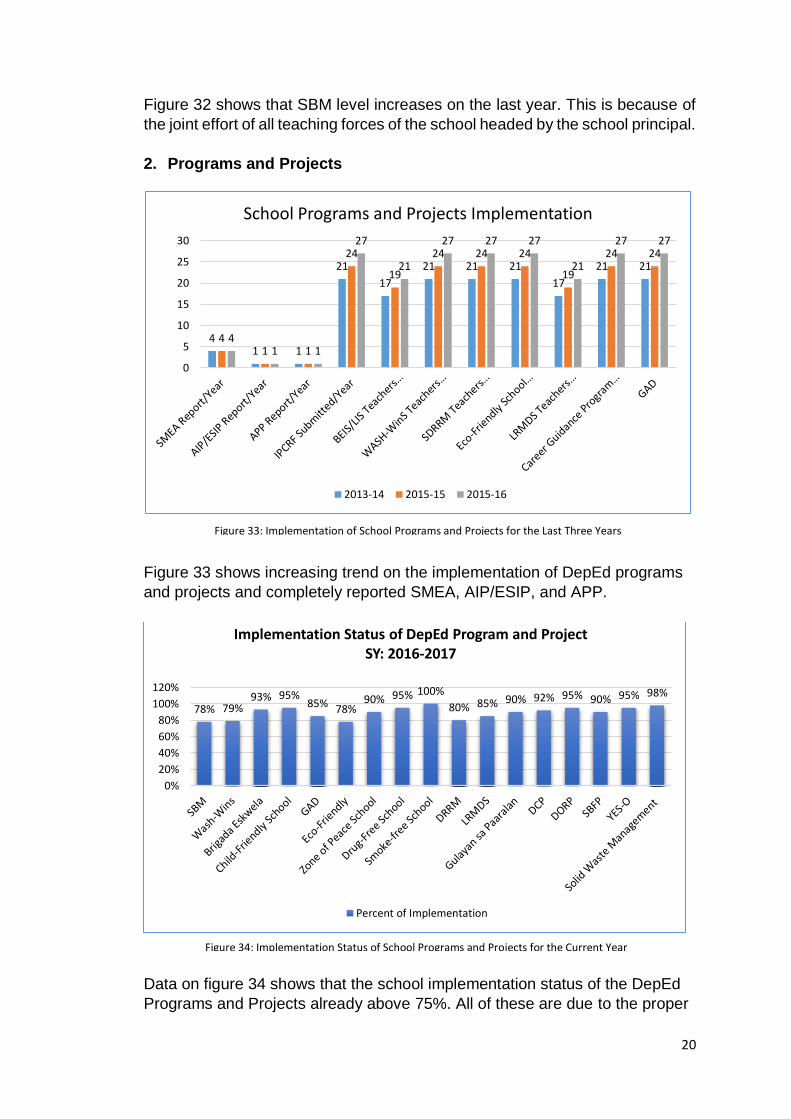
2. Programs and Projects
Figure 33 shows increasing trend on the implementation of DepEd programs
and projects and completely reported SMEA, AIP/ESIP, and APP.
Data on figure 34 shows that the school implementation status of the DepEd
Programs and Projects already above 75%. All of these are due to the proper
78% 79%93% 95%
85% 78%90% 95% 100%
80% 85% 90% 92% 95% 90% 95% 98%
0%
20%
40%
60%
80%
100%
120%
Implementation Status of DepEd Program and Project SY: 2016-2017
Percent of Implementation
Figure 33: Implementation of School Programs and Projects for the Last Three Years
41 1
21
17
21 21 21
17
21 21
41 1
24
19
24 24 24
19
24 24
41 1
27
21
27 27 27
21
27 27
0
5
10
15
20
25
30
School Programs and Projects Implementation
2013-14 2015-15 2015-16
Figure 34: Implementation Status of School Programs and Projects for the Current Year
21
delegation of the school principal to committees and implementing body with
teamwork, it ensure full implementation of the programs and projects.
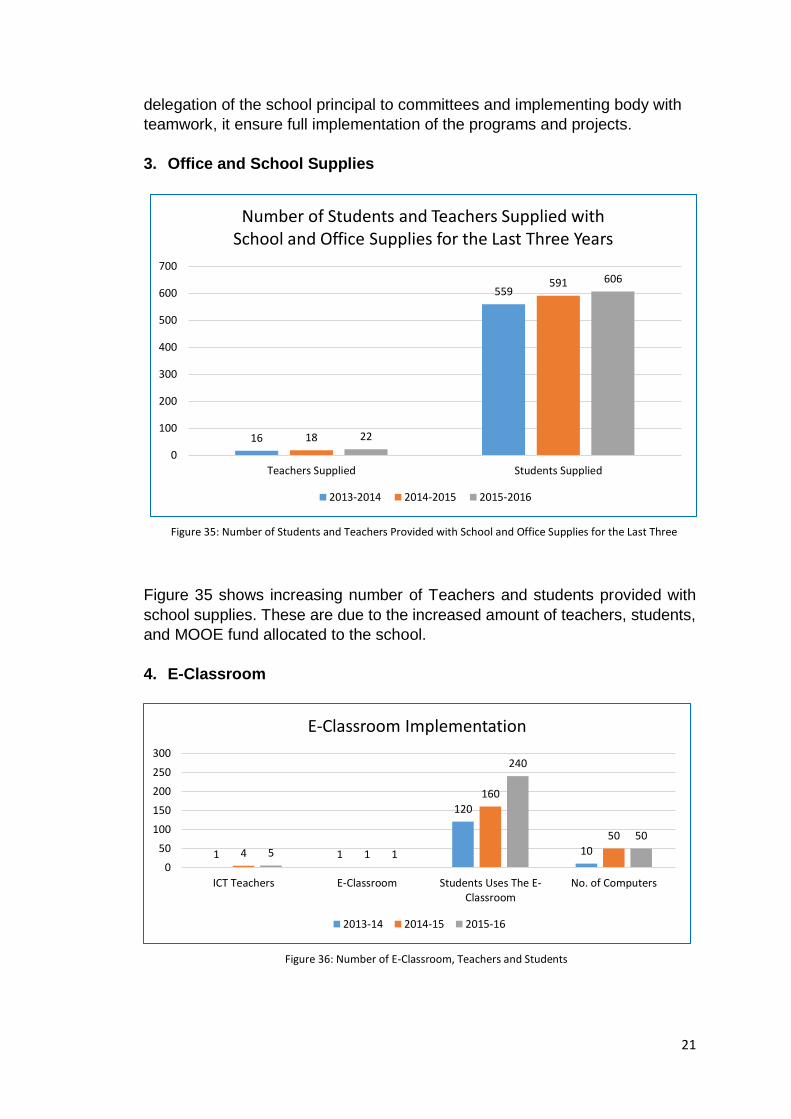
3. Office and School Supplies
Figure 35 shows increasing number of Teachers and students provided with
school supplies. These are due to the increased amount of teachers, students,
and MOOE fund allocated to the school.
4. E-Classroom
Figure 35: Number of Students and Teachers Provided with School and Office Supplies for the Last Three
Years
Figure 36: Number of E-Classroom, Teachers and Students
16
559
18
591
22
606
0
100
200
300
400
500
600
700
Teachers Supplied Students Supplied
Number of Students and Teachers Supplied with School and Office Supplies for the Last Three Years
2013-2014 2014-2015 2015-2016
1 1
120
104 1
160
50
5 1
240
50
0
50
100
150
200
250
300
ICT Teachers E-Classroom Students Uses The E-Classroom
No. of Computers
E-Classroom Implementation
2013-14 2014-15 2015-16
22
Figure 36 shows increasing number of teachers uses the E-Classroom as well
as the number of students uses it. This is due to the availability of computers in
the E-classroom as shown in the last two years.
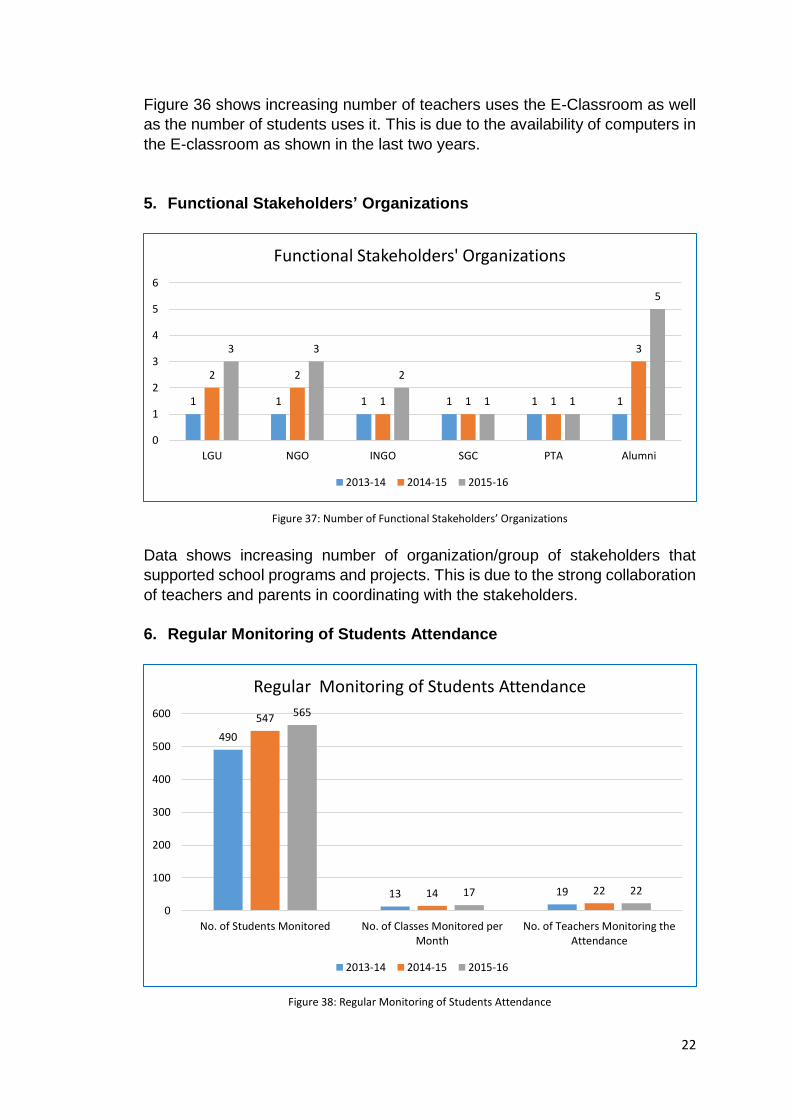
5. Functional Stakeholders’ Organizations
Data shows increasing number of organization/group of stakeholders that
supported school programs and projects. This is due to the strong collaboration
of teachers and parents in coordinating with the stakeholders.
6. Regular Monitoring of Students Attendance
1 1 1 1 1 1
2 2
1 1 1
33 3
2
1 1
5
0
1
2
3
4
5
6
LGU NGO INGO SGC PTA Alumni
Functional Stakeholders' Organizations
2013-14 2014-15 2015-16
490
13 19
547
14 22
565
17 22
0
100
200
300
400
500
600
No. of Students Monitored No. of Classes Monitored perMonth
No. of Teachers Monitoring theAttendance
Regular Monitoring of Students Attendance
2013-14 2014-15 2015-16
Figure 37: Number of Functional Stakeholders’ Organizations
Figure 38: Regular Monitoring of Students Attendance
23
Data of Figure 38 shows that the increase number of students’ attendance
monitored is directly proportional to that of the number of classes monitored
per month.
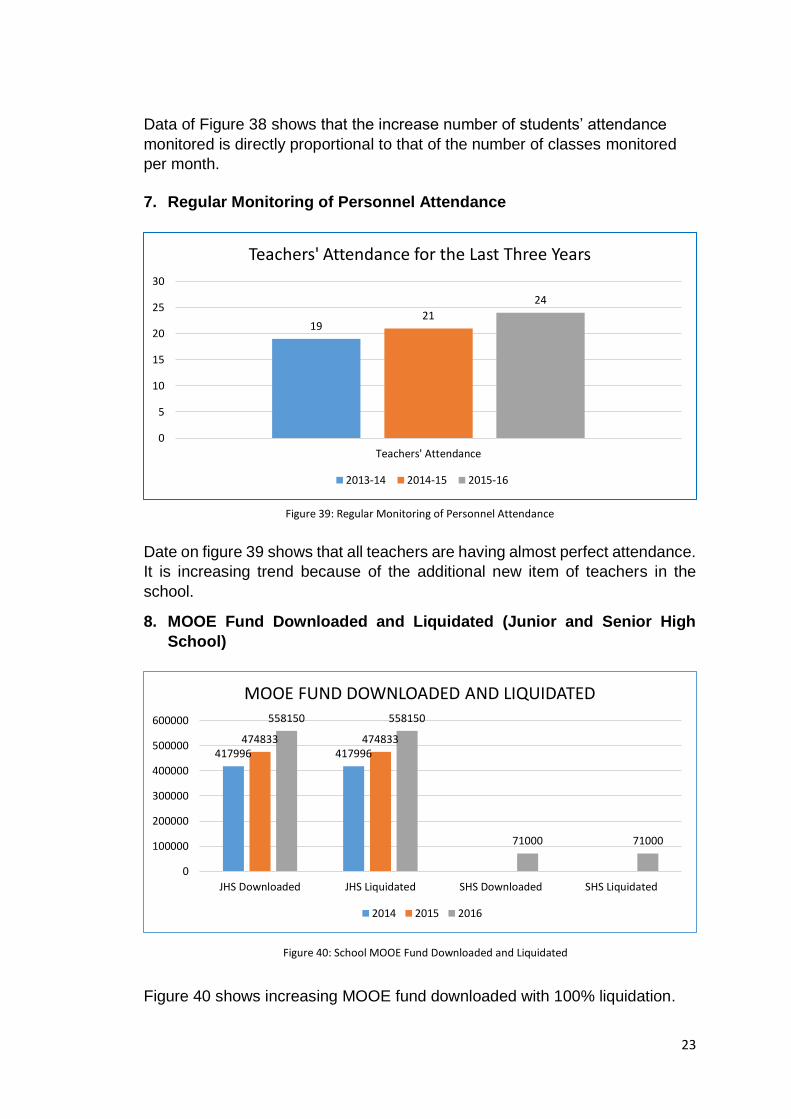
7. Regular Monitoring of Personnel Attendance
Date on figure 39 shows that all teachers are having almost perfect attendance.
It is increasing trend because of the additional new item of teachers in the
school.
8. MOOE Fund Downloaded and Liquidated (Junior and Senior High
School)
Figure 40 shows increasing MOOE fund downloaded with 100% liquidation.
1921
24
0
5
10
15
20
25
30
Teachers' Attendance
Teachers' Attendance for the Last Three Years
2013-14 2014-15 2015-16
Figure 39: Regular Monitoring of Personnel Attendance
Figure 40: School MOOE Fund Downloaded and Liquidated
417996 417996474833 474833
558150 558150
71000 71000
0
100000
200000
300000
400000
500000
600000
JHS Downloaded JHS Liquidated SHS Downloaded SHS Liquidated
MOOE FUND DOWNLOADED AND LIQUIDATED
2014 2015 2016
24
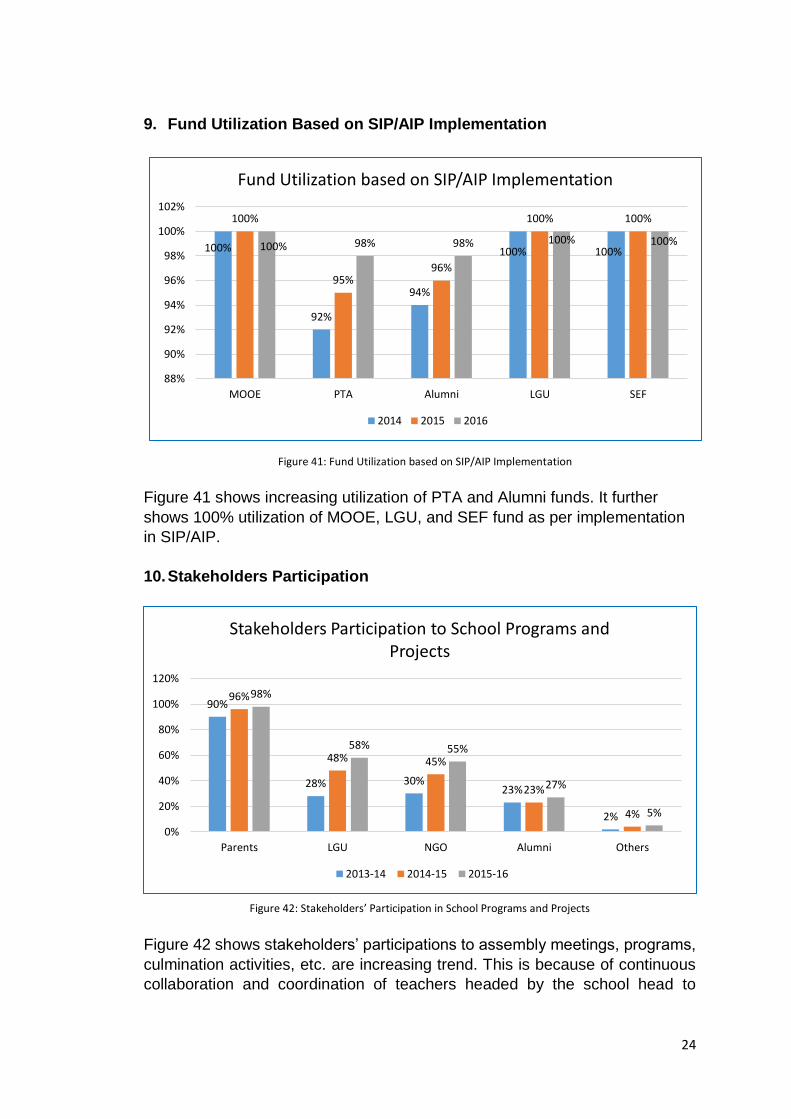
9. Fund Utilization Based on SIP/AIP Implementation
Figure 41 shows increasing utilization of PTA and Alumni funds. It further
shows 100% utilization of MOOE, LGU, and SEF fund as per implementation
in SIP/AIP.
10. Stakeholders Participation
Figure 42 shows stakeholders’ participations to assembly meetings, programs,
culmination activities, etc. are increasing trend. This is because of continuous
collaboration and coordination of teachers headed by the school head to
90%
28% 30%23%
2%
96%
48% 45%
23%
4%
98%
58% 55%
27%
5%
0%
20%
40%
60%
80%
100%
120%
Parents LGU NGO Alumni Others
Stakeholders Participation to School Programs and Projects
2013-14 2014-15 2015-16
100%
92%
94%
100% 100%
100%
95%96%
100% 100%
100% 98% 98% 100% 100%
88%
90%
92%
94%
96%
98%
100%
102%
MOOE PTA Alumni LGU SEF
Fund Utilization based on SIP/AIP Implementation
2014 2015 2016
Figure 41: Fund Utilization based on SIP/AIP Implementation
Figure 42: Stakeholders’ Participation in School Programs and Projects
25
various stakeholders and with strong linkages with them they were inspired to
support the programs and projects.
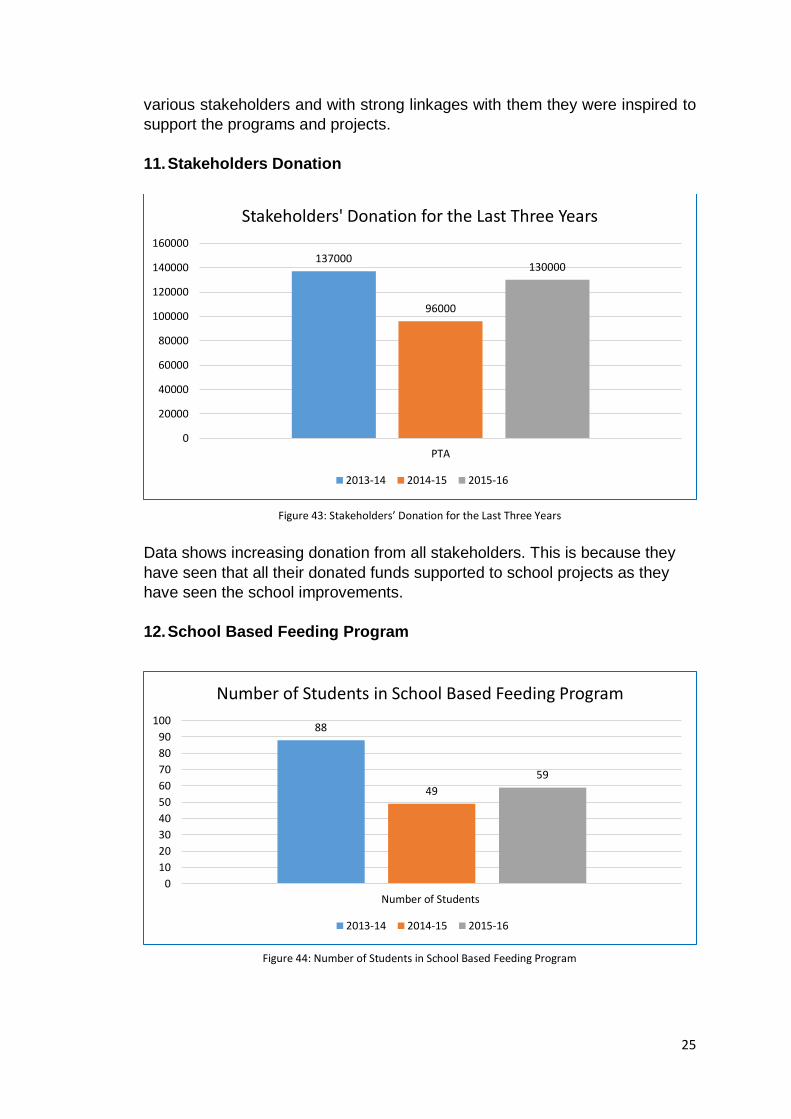
11. Stakeholders Donation
Data shows increasing donation from all stakeholders. This is because they
have seen that all their donated funds supported to school projects as they
have seen the school improvements.
12. School Based Feeding Program
137000
96000
130000
0
20000
40000
60000
80000
100000
120000
140000
160000
PTA
Stakeholders' Donation for the Last Three Years
2013-14 2014-15 2015-16
Figure 43: Stakeholders’ Donation for the Last Three Years
88
49
59
0
10
20
30
40
50
60
70
80
90
100
Number of Students
Number of Students in School Based Feeding Program
2013-14 2014-15 2015-16
Figure 44: Number of Students in School Based Feeding Program
26
Figure 44 show fluctuating number of students involve in the school based
feeding program because these are the number of students who were wasted
and severely wasted in their nutritional status.
13. School Research Program/Action Research
The school had no research program for the last three years.
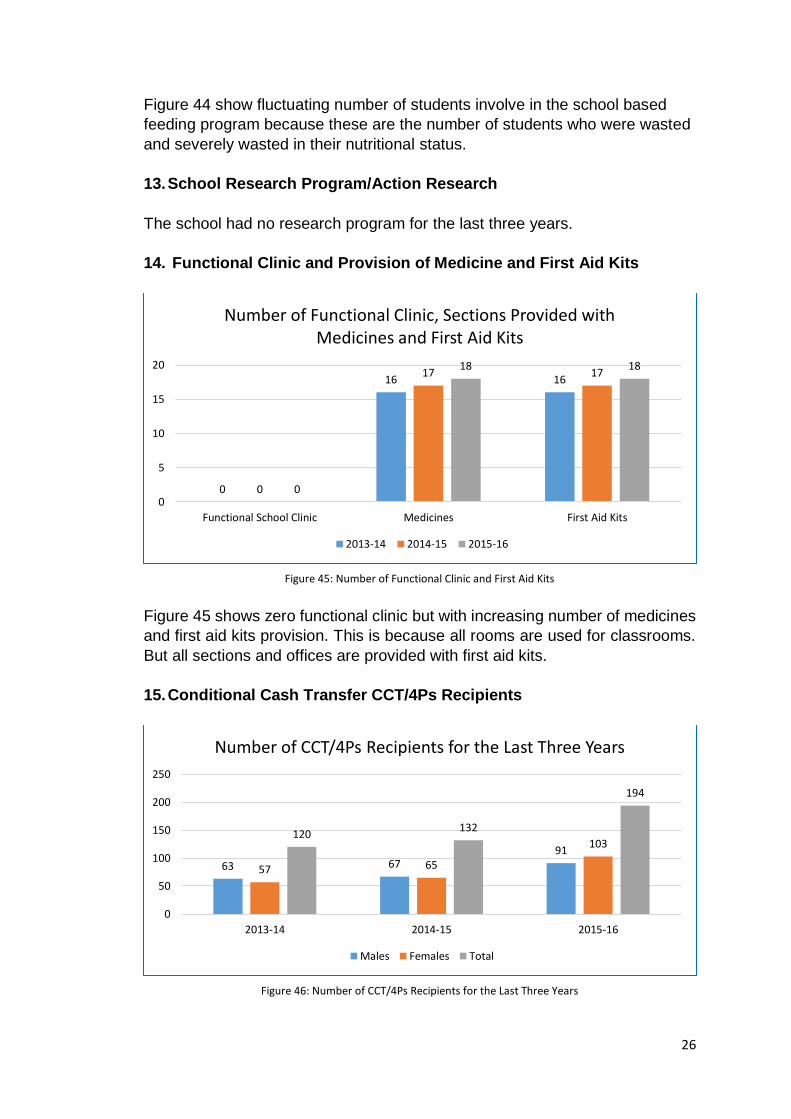
14. Functional Clinic and Provision of Medicine and First Aid Kits
Figure 45 shows zero functional clinic but with increasing number of medicines
and first aid kits provision. This is because all rooms are used for classrooms.
But all sections and offices are provided with first aid kits.
15. Conditional Cash Transfer CCT/4Ps Recipients
0
16 16
0
17 17
0
18 18
0
5
10
15
20
Functional School Clinic Medicines First Aid Kits
Number of Functional Clinic, Sections Provided with Medicines and First Aid Kits
2013-14 2014-15 2015-16
63 6791
57 65
103120
132
194
0
50
100
150
200
250
2013-14 2014-15 2015-16
Number of CCT/4Ps Recipients for the Last Three Years
Males Females Total
Figure 45: Number of Functional Clinic and First Aid Kits
Figure 46: Number of CCT/4Ps Recipients for the Last Three Years
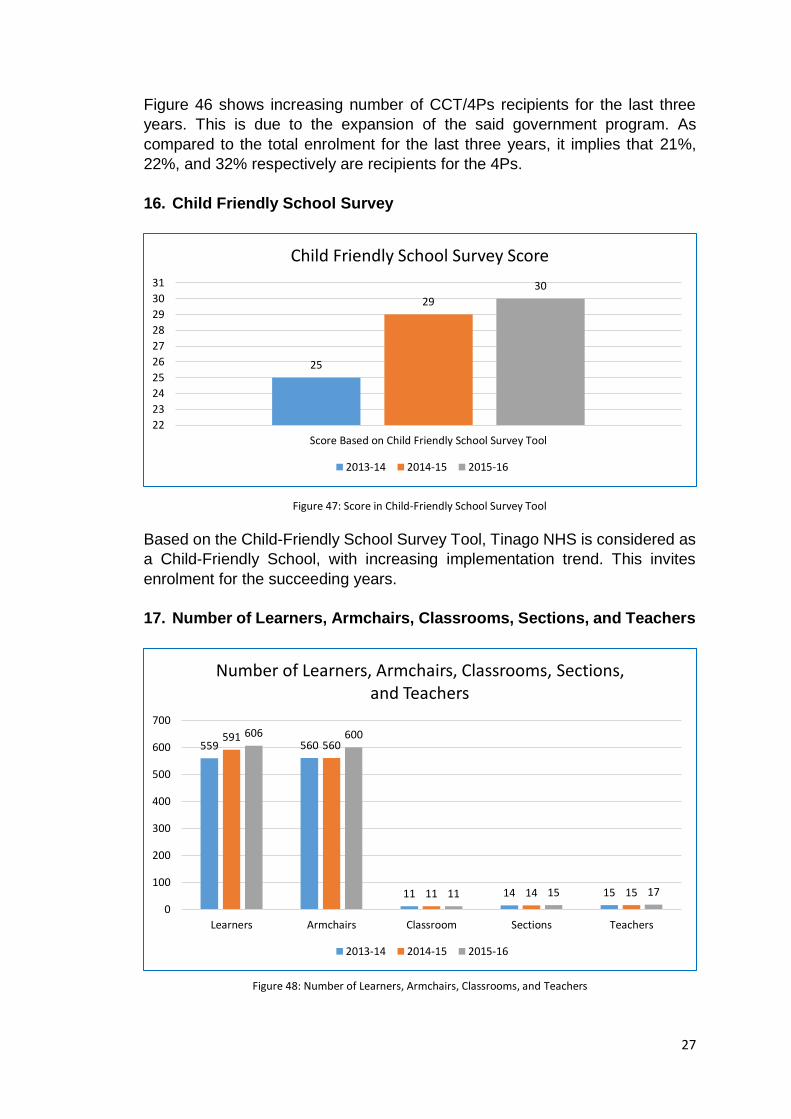
27
Figure 46 shows increasing number of CCT/4Ps recipients for the last three
years. This is due to the expansion of the said government program. As
compared to the total enrolment for the last three years, it implies that 21%,
22%, and 32% respectively are recipients for the 4Ps.
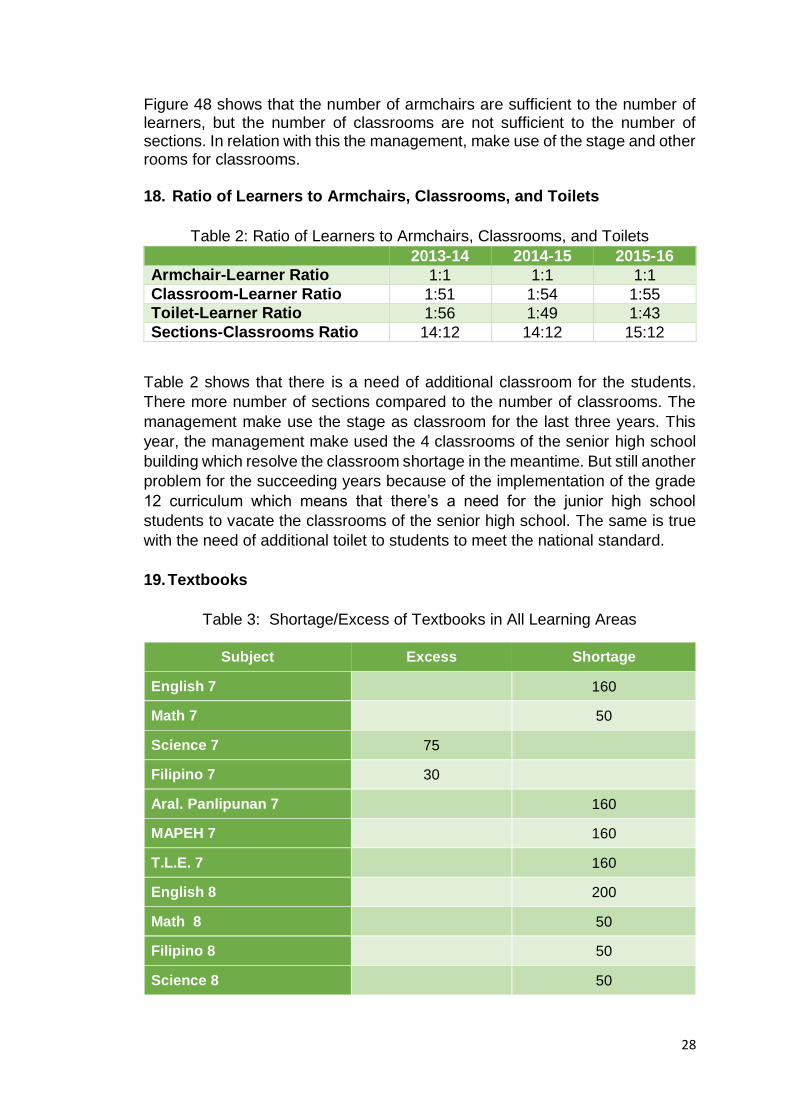
16. Child Friendly School Survey
Based on the Child-Friendly School Survey Tool, Tinago NHS is considered as
a Child-Friendly School, with increasing implementation trend. This invites
enrolment for the succeeding years.
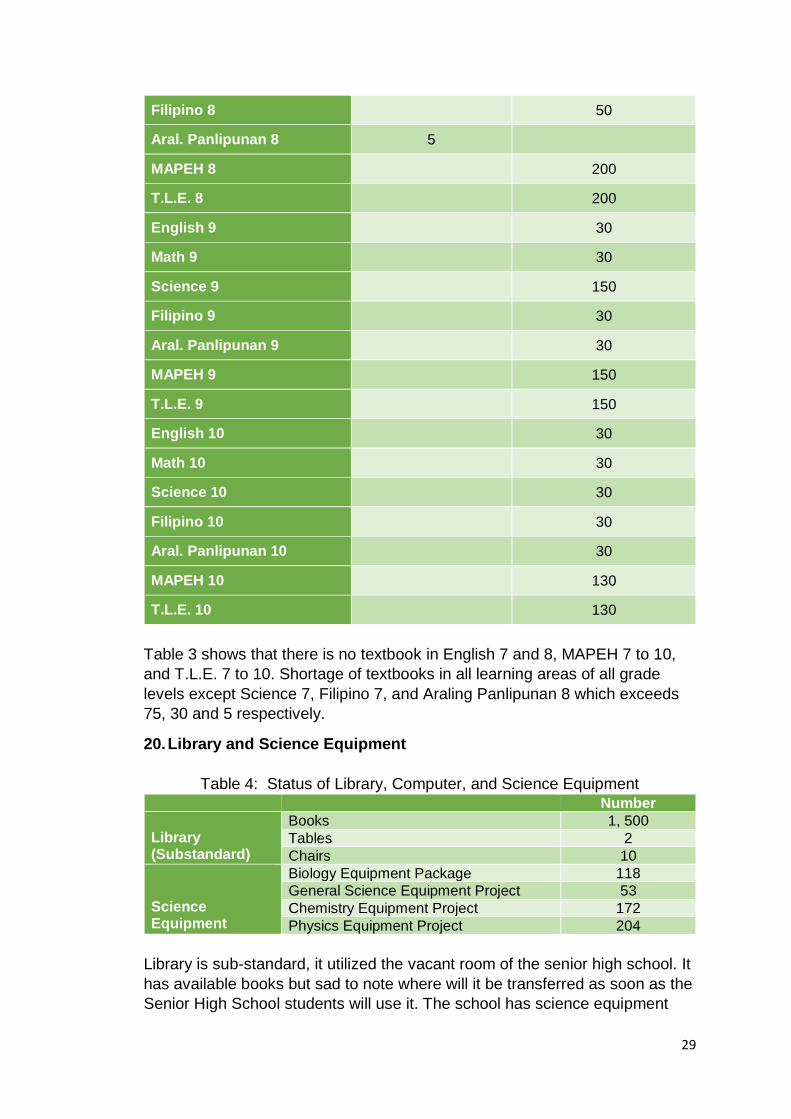
17. Number of Learners, Armchairs, Classrooms, Sections, and Teachers
25
29
30
22
23
24
25
26
27
28
29
30
31
Score Based on Child Friendly School Survey Tool
Child Friendly School Survey Score
2013-14 2014-15 2015-16
559 560
11 14 15
591560
11 14 15
606 600
11 15 17
0
100
200
300
400
500
600
700
Learners Armchairs Classroom Sections Teachers
Number of Learners, Armchairs, Classrooms, Sections, and Teachers
2013-14 2014-15 2015-16
Figure 47: Score in Child-Friendly School Survey Tool
Figure 48: Number of Learners, Armchairs, Classrooms, and Teachers
28
Figure 48 shows that the number of armchairs are sufficient to the number of learners, but the number of classrooms are not sufficient to the number of sections. In relation with this the management, make use of the stage and other rooms for classrooms. 18. Ratio of Learners to Armchairs, Classrooms, and Toilets
Table 2: Ratio of Learners to Armchairs, Classrooms, and Toilets
2013-14 2014-15 2015-16
Armchair-Learner Ratio 1:1 1:1 1:1
Classroom-Learner Ratio 1:51 1:54 1:55 Toilet-Learner Ratio 1:56 1:49 1:43
Sections-Classrooms Ratio 14:12 14:12 15:12
Table 2 shows that there is a need of additional classroom for the students.
There more number of sections compared to the number of classrooms. The
management make use the stage as classroom for the last three years. This
year, the management make used the 4 classrooms of the senior high school
building which resolve the classroom shortage in the meantime. But still another
problem for the succeeding years because of the implementation of the grade
12 curriculum which means that there’s a need for the junior high school
students to vacate the classrooms of the senior high school. The same is true
with the need of additional toilet to students to meet the national standard.
19. Textbooks
Table 3: Shortage/Excess of Textbooks in All Learning Areas
Subject Excess Shortage
English 7 160
Math 7 50
Science 7 75
Filipino 7 30
Aral. Panlipunan 7 160
MAPEH 7 160
T.L.E. 7 160
English 8 200
Math 8 50
Filipino 8 50
Science 8 50
29
Table 3 shows that there is no textbook in English 7 and 8, MAPEH 7 to 10,
and T.L.E. 7 to 10. Shortage of textbooks in all learning areas of all grade
levels except Science 7, Filipino 7, and Araling Panlipunan 8 which exceeds
75, 30 and 5 respectively.
20. Library and Science Equipment
Table 4: Status of Library, Computer, and Science Equipment
Number
Library (Substandard)
Books 1, 500
Tables 2
Chairs 10
Science Equipment
Biology Equipment Package 118
General Science Equipment Project 53
Chemistry Equipment Project 172
Physics Equipment Project 204
Library is sub-standard, it utilized the vacant room of the senior high school. It
has available books but sad to note where will it be transferred as soon as the
Senior High School students will use it. The school has science equipment
Filipino 8 50
Aral. Panlipunan 8 5
MAPEH 8 200
T.L.E. 8 200
English 9 30
Math 9 30
Science 9 150
Filipino 9 30
Aral. Panlipunan 9 30
MAPEH 9 150
T.L.E. 9 150
English 10 30
Math 10 30
Science 10 30
Filipino 10 30
Aral. Panlipunan 10 30
MAPEH 10 130
T.L.E. 10 130
30
enough for the students, but there is no science laboratory because the
science building is utilized as classroom.
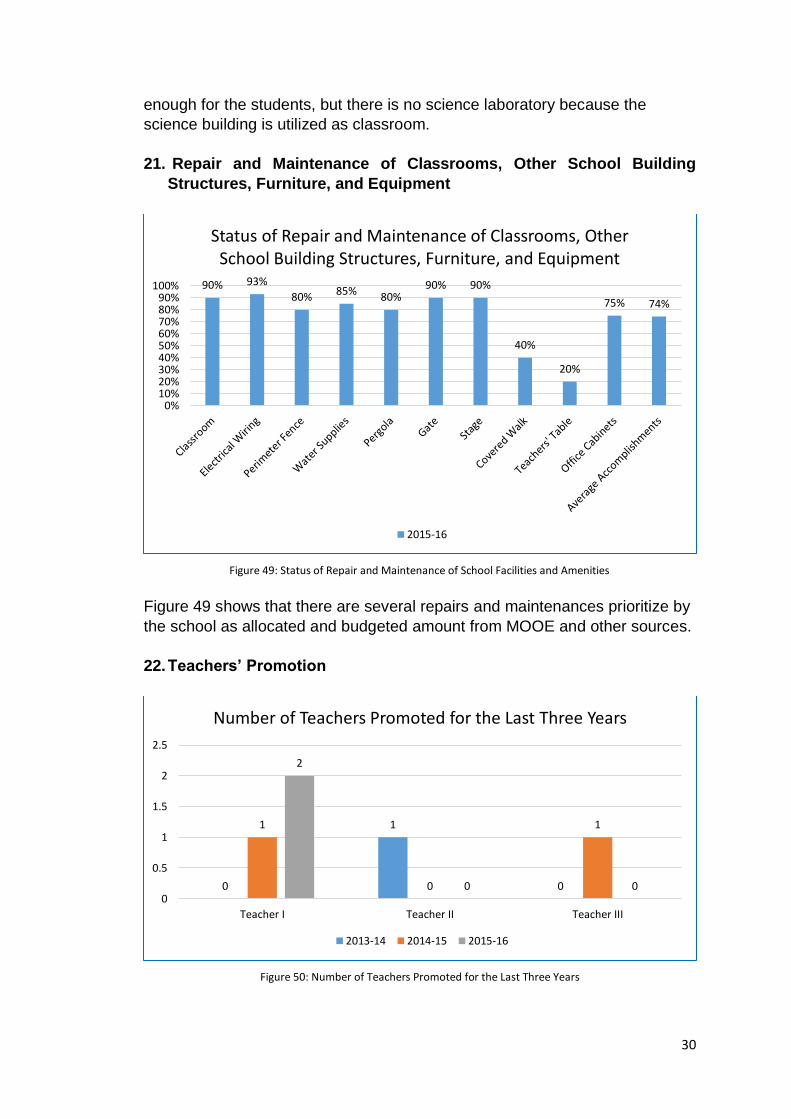
21. Repair and Maintenance of Classrooms, Other School Building
Structures, Furniture, and Equipment
Figure 49 shows that there are several repairs and maintenances prioritize by
the school as allocated and budgeted amount from MOOE and other sources.
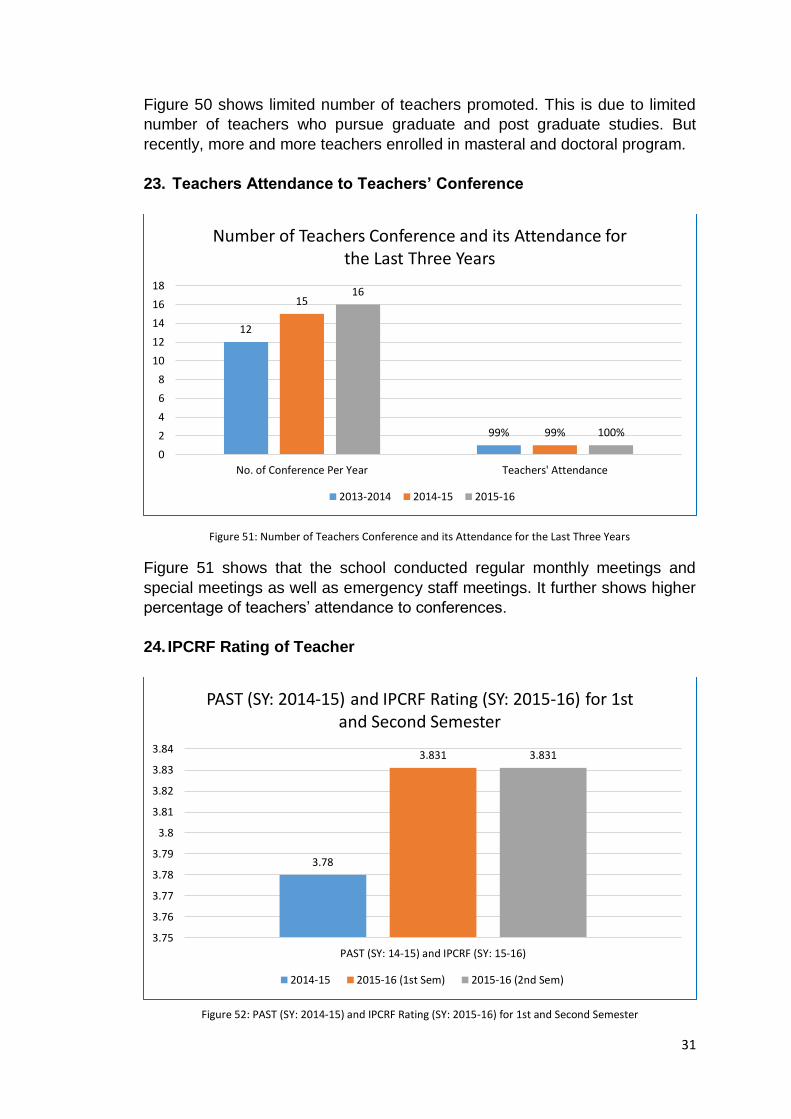
22. Teachers’ Promotion
90% 93%
80% 85% 80%90% 90%
40%
20%
75% 74%
0%10%20%30%40%50%60%70%80%90%
100%
Status of Repair and Maintenance of Classrooms, Other School Building Structures, Furniture, and Equipment
2015-16
0
1
0
1
0
1
2
0 00
0.5
1
1.5
2
2.5
Teacher I Teacher II Teacher III
Number of Teachers Promoted for the Last Three Years
2013-14 2014-15 2015-16
Figure 49: Status of Repair and Maintenance of School Facilities and Amenities
Figure 50: Number of Teachers Promoted for the Last Three Years
31
Figure 50 shows limited number of teachers promoted. This is due to limited
number of teachers who pursue graduate and post graduate studies. But
recently, more and more teachers enrolled in masteral and doctoral program.
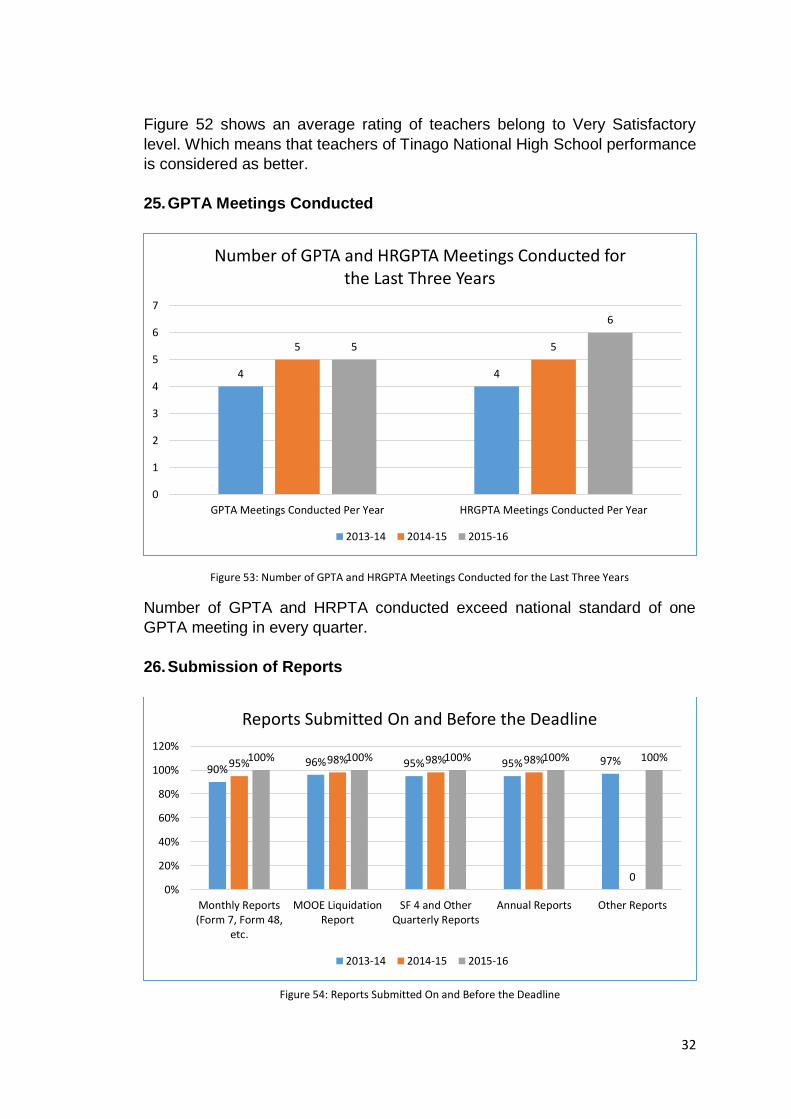
23. Teachers Attendance to Teachers’ Conference
Figure 51 shows that the school conducted regular monthly meetings and
special meetings as well as emergency staff meetings. It further shows higher
percentage of teachers’ attendance to conferences.
24. IPCRF Rating of Teacher
12
99%
15
99%
16
100%
0
2
4
6
8
10
12
14
16
18
No. of Conference Per Year Teachers' Attendance
Number of Teachers Conference and its Attendance for the Last Three Years
2013-2014 2014-15 2015-16
3.78
3.831 3.831
3.75
3.76
3.77
3.78
3.79
3.8
3.81
3.82
3.83
3.84
PAST (SY: 14-15) and IPCRF (SY: 15-16)
PAST (SY: 2014-15) and IPCRF Rating (SY: 2015-16) for 1st and Second Semester
2014-15 2015-16 (1st Sem) 2015-16 (2nd Sem)
Figure 51: Number of Teachers Conference and its Attendance for the Last Three Years
Figure 52: PAST (SY: 2014-15) and IPCRF Rating (SY: 2015-16) for 1st and Second Semester
32
Figure 52 shows an average rating of teachers belong to Very Satisfactory
level. Which means that teachers of Tinago National High School performance
is considered as better.
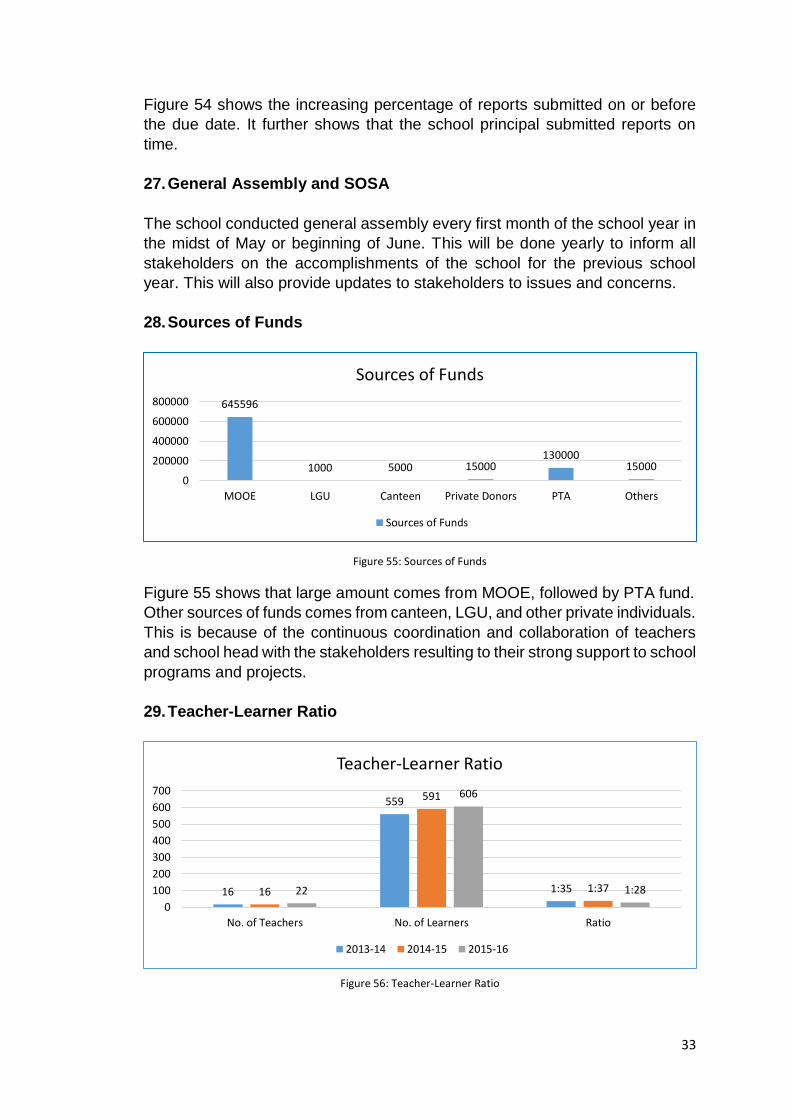
25. GPTA Meetings Conducted
Number of GPTA and HRPTA conducted exceed national standard of one
GPTA meeting in every quarter.
26. Submission of Reports
4 4
5 55
6
0
1
2
3
4
5
6
7
GPTA Meetings Conducted Per Year HRGPTA Meetings Conducted Per Year
Number of GPTA and HRGPTA Meetings Conducted for the Last Three Years
2013-14 2014-15 2015-16
90%96% 95% 95% 97%95% 98% 98% 98%
0
100% 100% 100% 100% 100%
0%
20%
40%
60%
80%
100%
120%
Monthly Reports(Form 7, Form 48,
etc.
MOOE LiquidationReport
SF 4 and OtherQuarterly Reports
Annual Reports Other Reports
Reports Submitted On and Before the Deadline
2013-14 2014-15 2015-16
Figure 53: Number of GPTA and HRGPTA Meetings Conducted for the Last Three Years
Figure 54: Reports Submitted On and Before the Deadline
33
Figure 54 shows the increasing percentage of reports submitted on or before
the due date. It further shows that the school principal submitted reports on
time.
27. General Assembly and SOSA
The school conducted general assembly every first month of the school year in
the midst of May or beginning of June. This will be done yearly to inform all
stakeholders on the accomplishments of the school for the previous school
year. This will also provide updates to stakeholders to issues and concerns.
28. Sources of Funds
Figure 55 shows that large amount comes from MOOE, followed by PTA fund.
Other sources of funds comes from canteen, LGU, and other private individuals.
This is because of the continuous coordination and collaboration of teachers
and school head with the stakeholders resulting to their strong support to school
programs and projects.
29. Teacher-Learner Ratio
645596
1000 5000 15000130000
150000
200000
400000
600000
800000
MOOE LGU Canteen Private Donors PTA Others
Sources of Funds
Sources of Funds
16
559
1:3516
591
1:3722
606
1:28
0
100
200
300
400
500
600
700
No. of Teachers No. of Learners Ratio
Teacher-Learner Ratio
2013-14 2014-15 2015-16
Figure 55: Sources of Funds
Figure 56: Teacher-Learner Ratio
34
Teacher-learner ratio is fluctuating as shown in figure 56. It reaches at its
highest at 1 is to 37 and tend to decrease at SY 2015-2016 which reaches up
to 1 is to 28 which is more or less near to the national standard. This is because
of the five new items in the Plantilla.
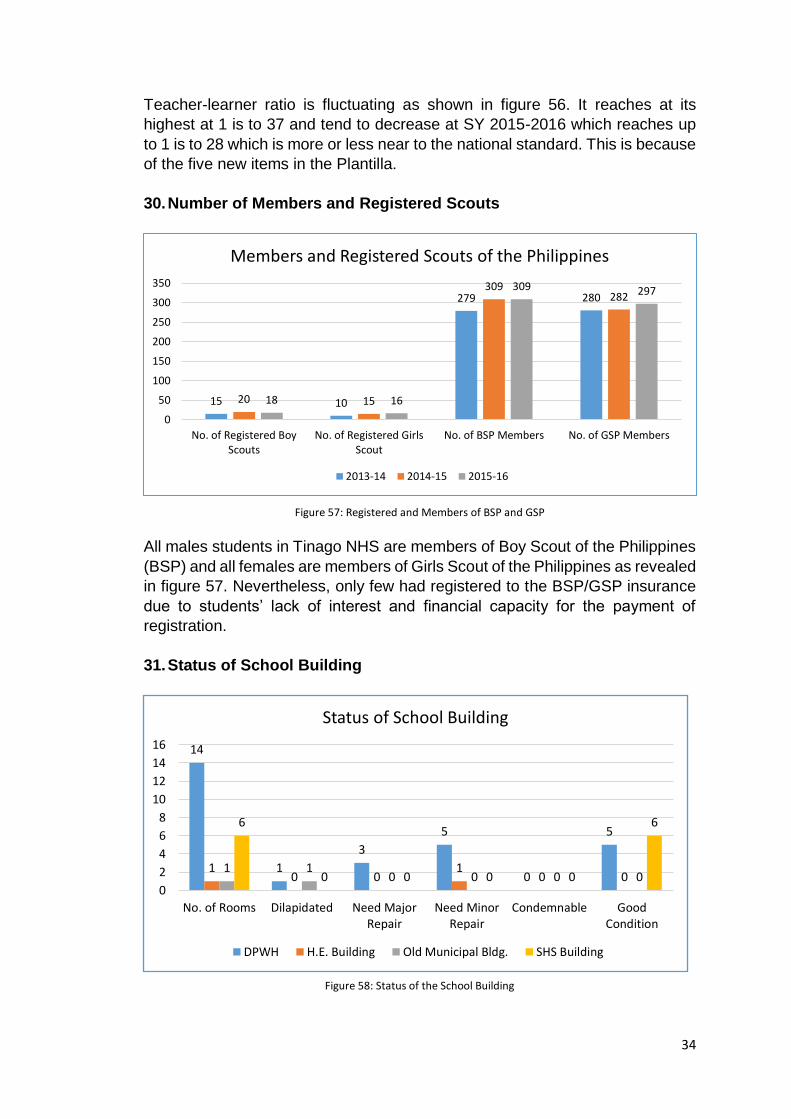
30. Number of Members and Registered Scouts
All males students in Tinago NHS are members of Boy Scout of the Philippines
(BSP) and all females are members of Girls Scout of the Philippines as revealed
in figure 57. Nevertheless, only few had registered to the BSP/GSP insurance
due to students’ lack of interest and financial capacity for the payment of
registration.
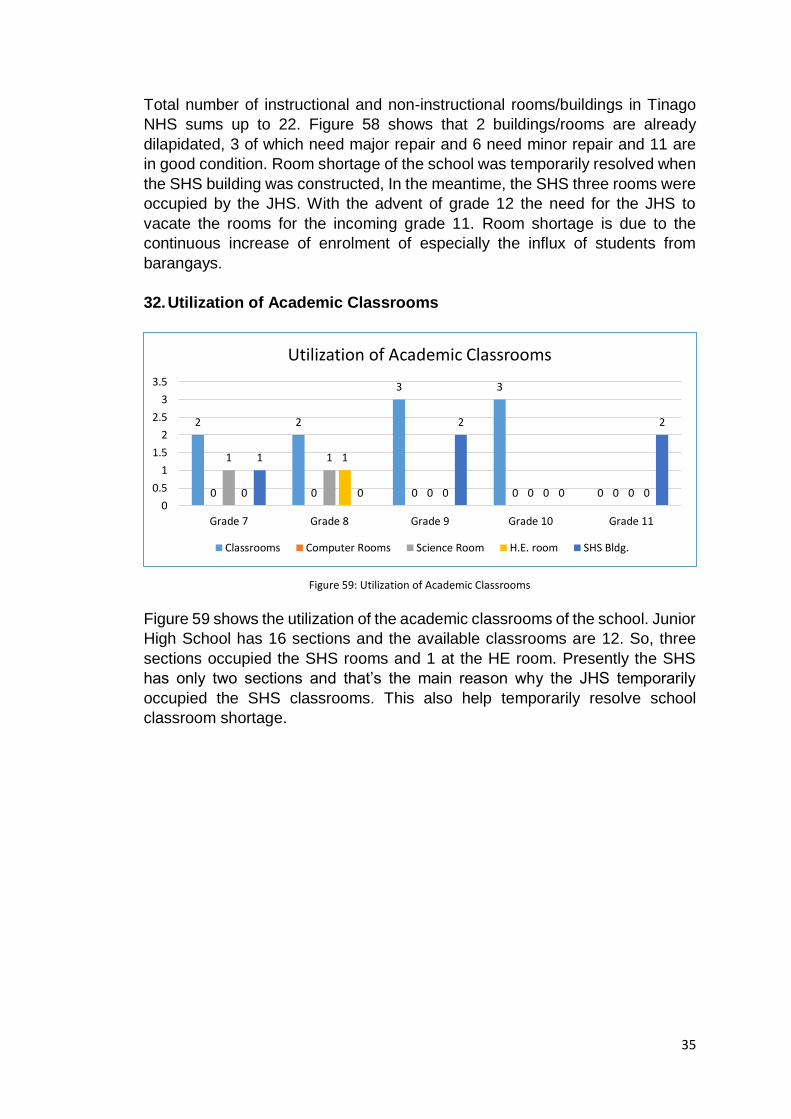
31. Status of School Building
14
1
3
5
0
5
10 0
10 0
1 10 0 0 0
6
0 0 0 0
6
0
2
4
6
8
10
12
14
16
No. of Rooms Dilapidated Need MajorRepair
Need MinorRepair
Condemnable GoodCondition
Status of School Building
DPWH H.E. Building Old Municipal Bldg. SHS Building
Figure 57: Registered and Members of BSP and GSP
15 10
279 280
20 15
309282
18 16
309 297
0
50
100
150
200
250
300
350
No. of Registered BoyScouts
No. of Registered GirlsScout
No. of BSP Members No. of GSP Members
Members and Registered Scouts of the Philippines
2013-14 2014-15 2015-16
Figure 58: Status of the School Building
35
Total number of instructional and non-instructional rooms/buildings in Tinago
NHS sums up to 22. Figure 58 shows that 2 buildings/rooms are already
dilapidated, 3 of which need major repair and 6 need minor repair and 11 are
in good condition. Room shortage of the school was temporarily resolved when
the SHS building was constructed, In the meantime, the SHS three rooms were
occupied by the JHS. With the advent of grade 12 the need for the JHS to
vacate the rooms for the incoming grade 11. Room shortage is due to the
continuous increase of enrolment of especially the influx of students from
barangays.
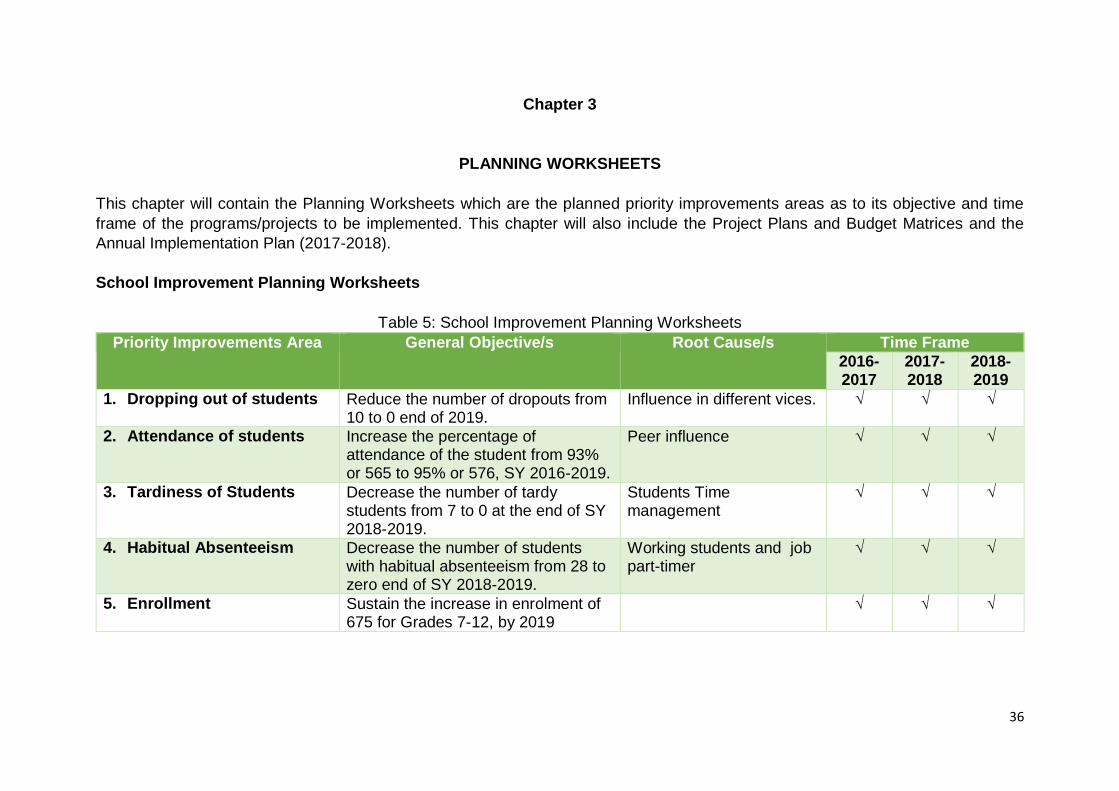
32. Utilization of Academic Classrooms
Figure 59 shows the utilization of the academic classrooms of the school. Junior
High School has 16 sections and the available classrooms are 12. So, three
sections occupied the SHS rooms and 1 at the HE room. Presently the SHS
has only two sections and that’s the main reason why the JHS temporarily
occupied the SHS classrooms. This also help temporarily resolve school
classroom shortage.
2 2
3 3
00 0 0 0 0
1 1
0 0 00
1
0 0 0
1
0
2
0
2
0
0.5
1
1.5
2
2.5
3
3.5
Grade 7 Grade 8 Grade 9 Grade 10 Grade 11
Utilization of Academic Classrooms
Classrooms Computer Rooms Science Room H.E. room SHS Bldg.
Figure 59: Utilization of Academic Classrooms
36
Chapter 3
PLANNING WORKSHEETS
This chapter will contain the Planning Worksheets which are the planned priority improvements areas as to its objective and time
frame of the programs/projects to be implemented. This chapter will also include the Project Plans and Budget Matrices and the
Annual Implementation Plan (2017-2018).
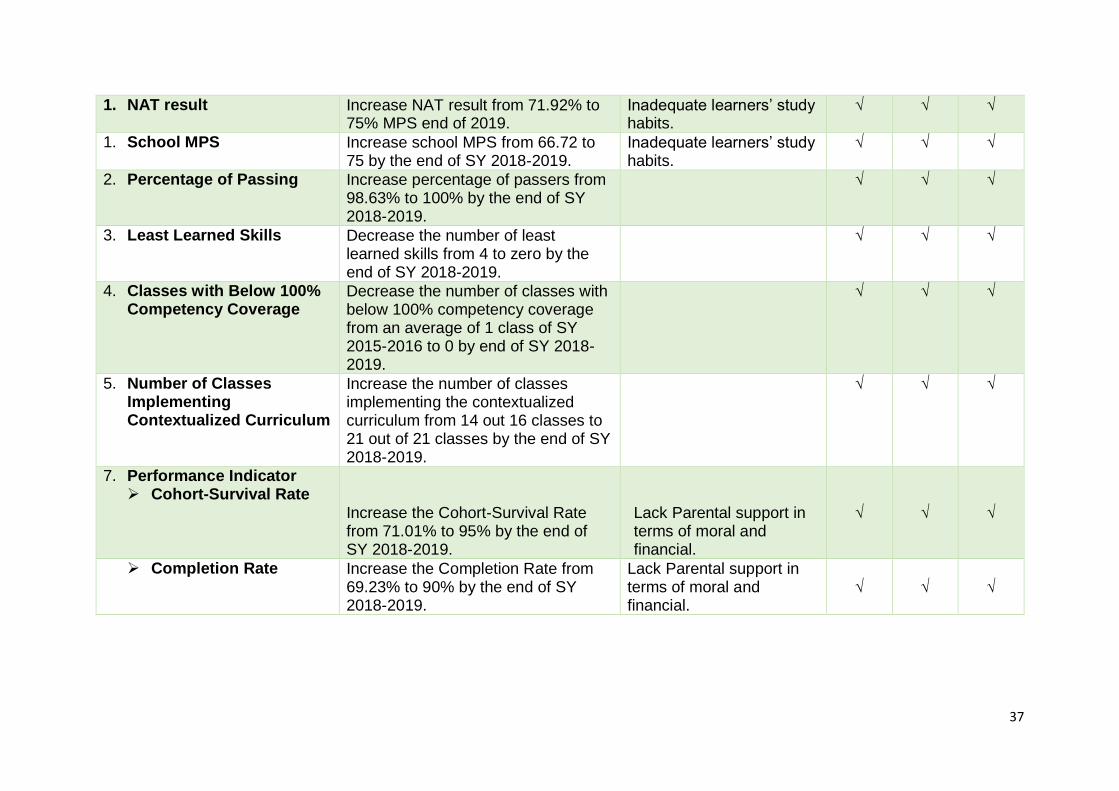
School Improvement Planning Worksheets
Table 5: School Improvement Planning Worksheets
Priority Improvements Area General Objective/s Root Cause/s Time Frame
2016-2017
2017-2018
2018-2019
1. Dropping out of students Reduce the number of dropouts from 10 to 0 end of 2019.
Influence in different vices. √ √ √
2. Attendance of students
Increase the percentage of attendance of the student from 93% or 565 to 95% or 576, SY 2016-2019.
Peer influence √ √ √
3. Tardiness of Students Decrease the number of tardy students from 7 to 0 at the end of SY 2018-2019.
Students Time management
√ √ √
4. Habitual Absenteeism Decrease the number of students with habitual absenteeism from 28 to zero end of SY 2018-2019.
Working students and job part-timer
√ √ √
5. Enrollment Sustain the increase in enrolment of 675 for Grades 7-12, by 2019
√ √ √
37
1. NAT result Increase NAT result from 71.92% to 75% MPS end of 2019.
Inadequate learners’ study habits.
√ √ √
1. School MPS Increase school MPS from 66.72 to 75 by the end of SY 2018-2019.
Inadequate learners’ study habits.
√ √ √
2. Percentage of Passing Increase percentage of passers from 98.63% to 100% by the end of SY 2018-2019.
√ √ √
3. Least Learned Skills Decrease the number of least learned skills from 4 to zero by the end of SY 2018-2019.
√ √ √
4. Classes with Below 100% Competency Coverage
Decrease the number of classes with below 100% competency coverage from an average of 1 class of SY 2015-2016 to 0 by end of SY 2018-2019.
√ √ √
5. Number of Classes Implementing Contextualized Curriculum
Increase the number of classes implementing the contextualized curriculum from 14 out 16 classes to 21 out of 21 classes by the end of SY 2018-2019.
√ √ √
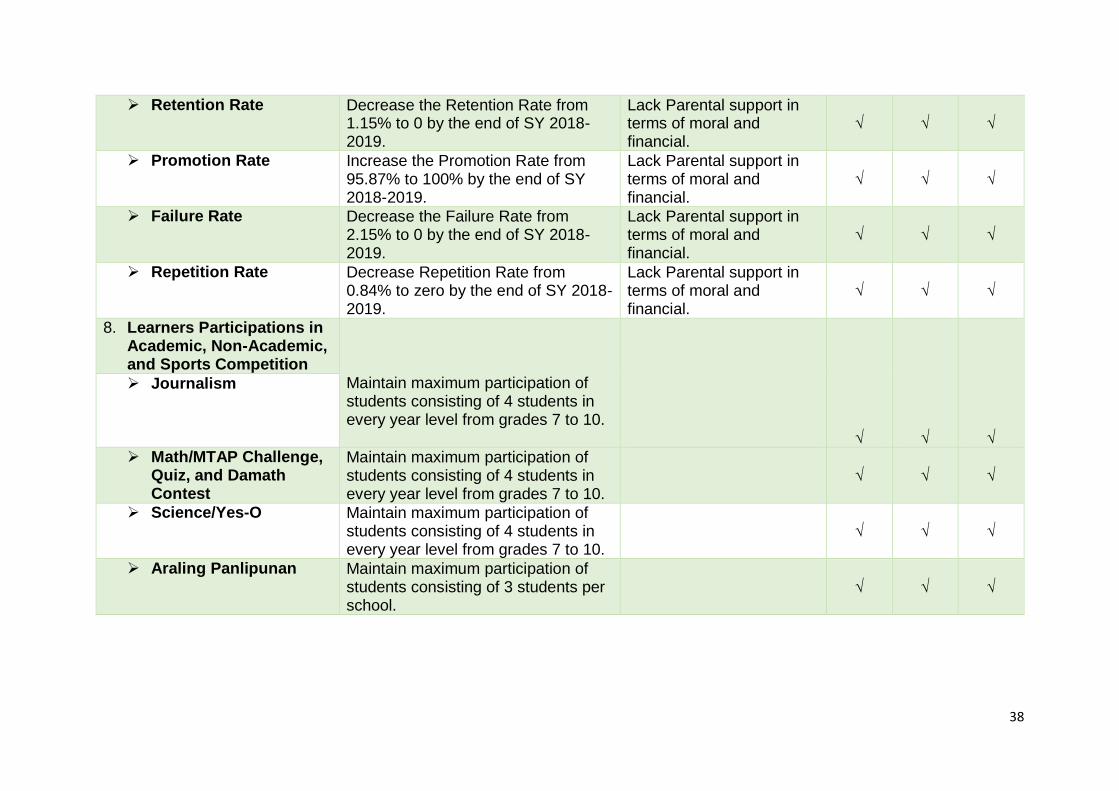
7. Performance Indicator Cohort-Survival Rate
Increase the Cohort-Survival Rate from 71.01% to 95% by the end of SY 2018-2019.
Lack Parental support in terms of moral and financial.
√ √ √
Completion Rate
Increase the Completion Rate from 69.23% to 90% by the end of SY 2018-2019.
Lack Parental support in terms of moral and financial.
√ √ √
38
Retention Rate
Decrease the Retention Rate from 1.15% to 0 by the end of SY 2018-2019.
Lack Parental support in terms of moral and financial.
√ √ √
Promotion Rate
Increase the Promotion Rate from 95.87% to 100% by the end of SY 2018-2019.
Lack Parental support in terms of moral and financial.
√ √ √
Failure Rate
Decrease the Failure Rate from 2.15% to 0 by the end of SY 2018-2019.
Lack Parental support in terms of moral and financial.
√ √ √
Repetition Rate Decrease Repetition Rate from 0.84% to zero by the end of SY 2018-2019.
Lack Parental support in terms of moral and financial.
√ √ √
8. Learners Participations in Academic, Non-Academic, and Sports Competition
Maintain maximum participation of students consisting of 4 students in every year level from grades 7 to 10.
√
√
√
Journalism
Math/MTAP Challenge, Quiz, and Damath Contest
Maintain maximum participation of students consisting of 4 students in every year level from grades 7 to 10.
√ √ √
Science/Yes-O Maintain maximum participation of students consisting of 4 students in every year level from grades 7 to 10.
√ √ √
Araling Panlipunan Maintain maximum participation of students consisting of 3 students per school.
√ √ √
39
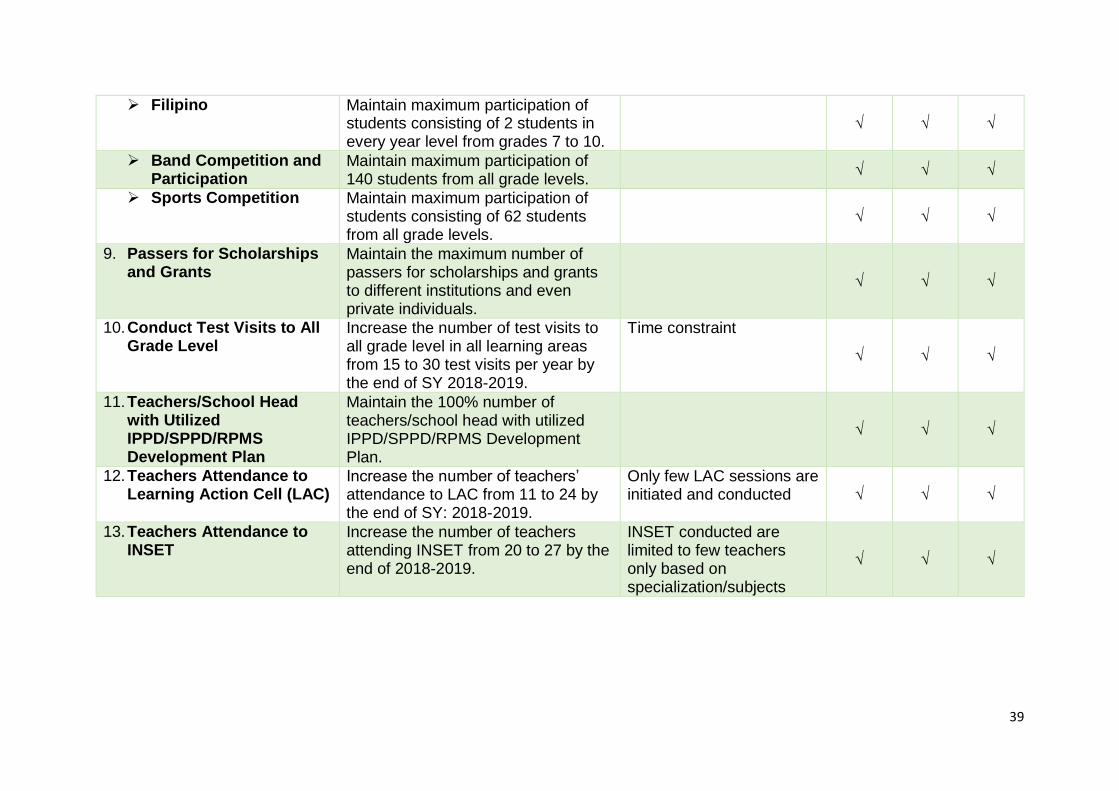
Filipino Maintain maximum participation of students consisting of 2 students in every year level from grades 7 to 10.
√ √ √
Band Competition and Participation
Maintain maximum participation of 140 students from all grade levels.
√ √ √
Sports Competition Maintain maximum participation of students consisting of 62 students from all grade levels.
√ √ √
9. Passers for Scholarships and Grants
Maintain the maximum number of passers for scholarships and grants to different institutions and even private individuals.
√ √ √
10. Conduct Test Visits to All Grade Level
Increase the number of test visits to all grade level in all learning areas from 15 to 30 test visits per year by the end of SY 2018-2019.
Time constraint
√ √ √
11. Teachers/School Head with Utilized IPPD/SPPD/RPMS Development Plan
Maintain the 100% number of teachers/school head with utilized IPPD/SPPD/RPMS Development Plan.
√ √ √
12. Teachers Attendance to Learning Action Cell (LAC)
Increase the number of teachers’ attendance to LAC from 11 to 24 by the end of SY: 2018-2019.
Only few LAC sessions are initiated and conducted √ √ √
13. Teachers Attendance to INSET
Increase the number of teachers attending INSET from 20 to 27 by the end of 2018-2019.
INSET conducted are limited to few teachers only based on specialization/subjects
√ √ √
40
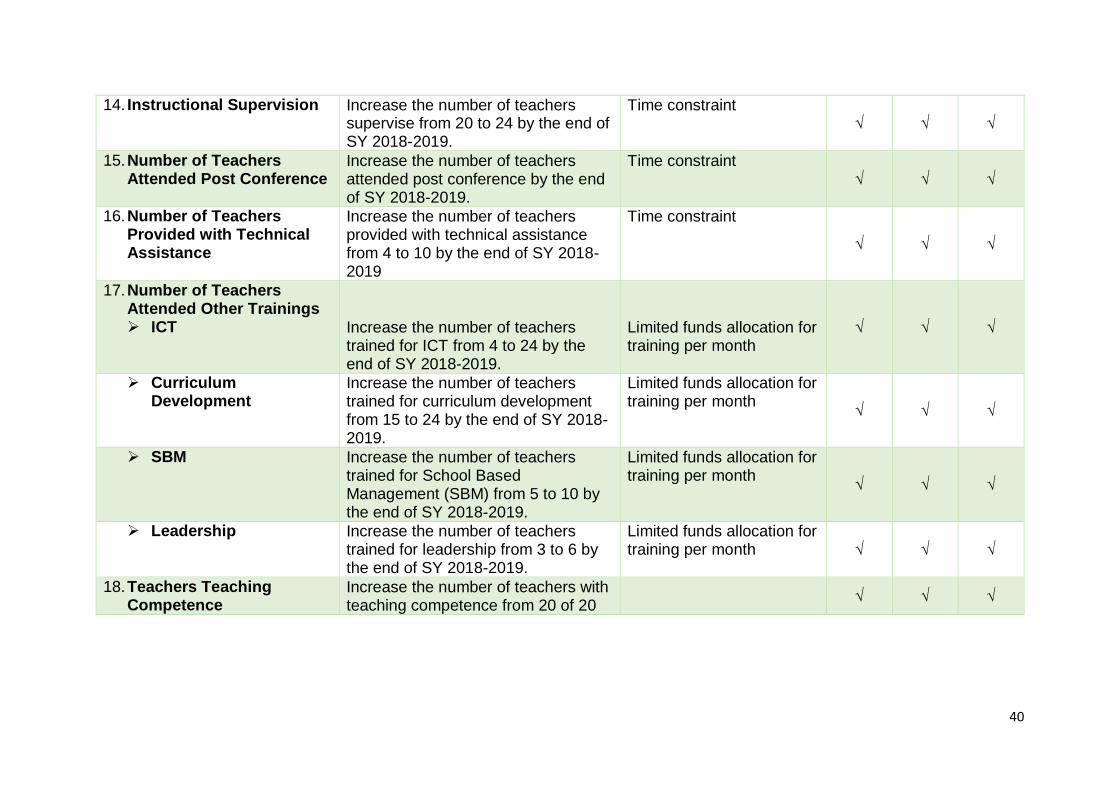
14. Instructional Supervision Increase the number of teachers supervise from 20 to 24 by the end of SY 2018-2019.
Time constraint √ √ √
15. Number of Teachers Attended Post Conference
Increase the number of teachers attended post conference by the end of SY 2018-2019.
Time constraint √ √ √
16. Number of Teachers Provided with Technical Assistance
Increase the number of teachers provided with technical assistance from 4 to 10 by the end of SY 2018-2019
Time constraint
√ √ √
17. Number of Teachers Attended Other Trainings ICT
Increase the number of teachers trained for ICT from 4 to 24 by the end of SY 2018-2019.
Limited funds allocation for training per month
√ √ √
Curriculum Development
Increase the number of teachers trained for curriculum development from 15 to 24 by the end of SY 2018-2019.
Limited funds allocation for training per month
√ √ √
SBM Increase the number of teachers trained for School Based Management (SBM) from 5 to 10 by the end of SY 2018-2019.
Limited funds allocation for training per month
√ √ √
Leadership Increase the number of teachers trained for leadership from 3 to 6 by the end of SY 2018-2019.
Limited funds allocation for training per month √ √ √
18. Teachers Teaching Competence
Increase the number of teachers with teaching competence from 20 of 20
√ √ √
41
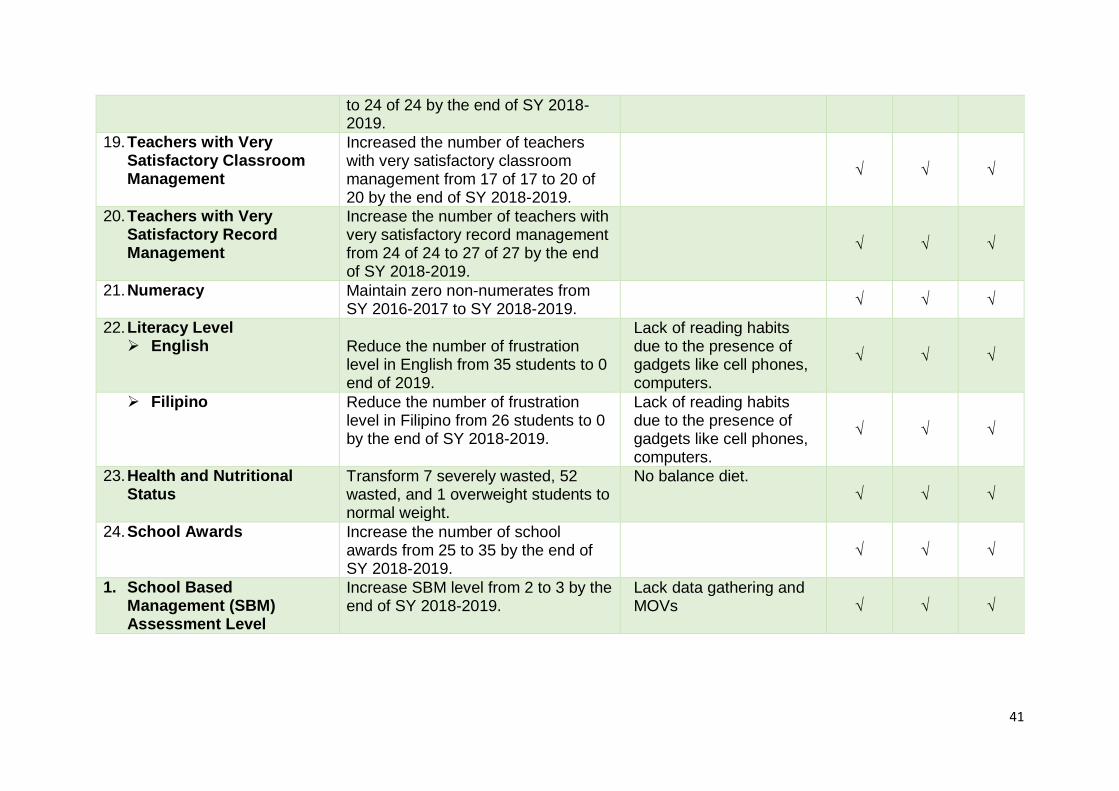
to 24 of 24 by the end of SY 2018-2019.
19. Teachers with Very Satisfactory Classroom Management
Increased the number of teachers with very satisfactory classroom management from 17 of 17 to 20 of 20 by the end of SY 2018-2019.
√ √ √
20. Teachers with Very Satisfactory Record Management
Increase the number of teachers with very satisfactory record management from 24 of 24 to 27 of 27 by the end of SY 2018-2019.
√ √ √
21. Numeracy Maintain zero non-numerates from SY 2016-2017 to SY 2018-2019.
√ √ √
22. Literacy Level English
Reduce the number of frustration level in English from 35 students to 0 end of 2019.
Lack of reading habits due to the presence of gadgets like cell phones, computers.
√ √ √
Filipino Reduce the number of frustration level in Filipino from 26 students to 0 by the end of SY 2018-2019.
Lack of reading habits due to the presence of gadgets like cell phones, computers.
√ √ √
23. Health and Nutritional Status
Transform 7 severely wasted, 52 wasted, and 1 overweight students to normal weight.
No balance diet. √ √ √
24. School Awards Increase the number of school awards from 25 to 35 by the end of SY 2018-2019.
√ √ √
1. School Based Management (SBM) Assessment Level
Increase SBM level from 2 to 3 by the end of SY 2018-2019.
Lack data gathering and MOVs √ √ √
42
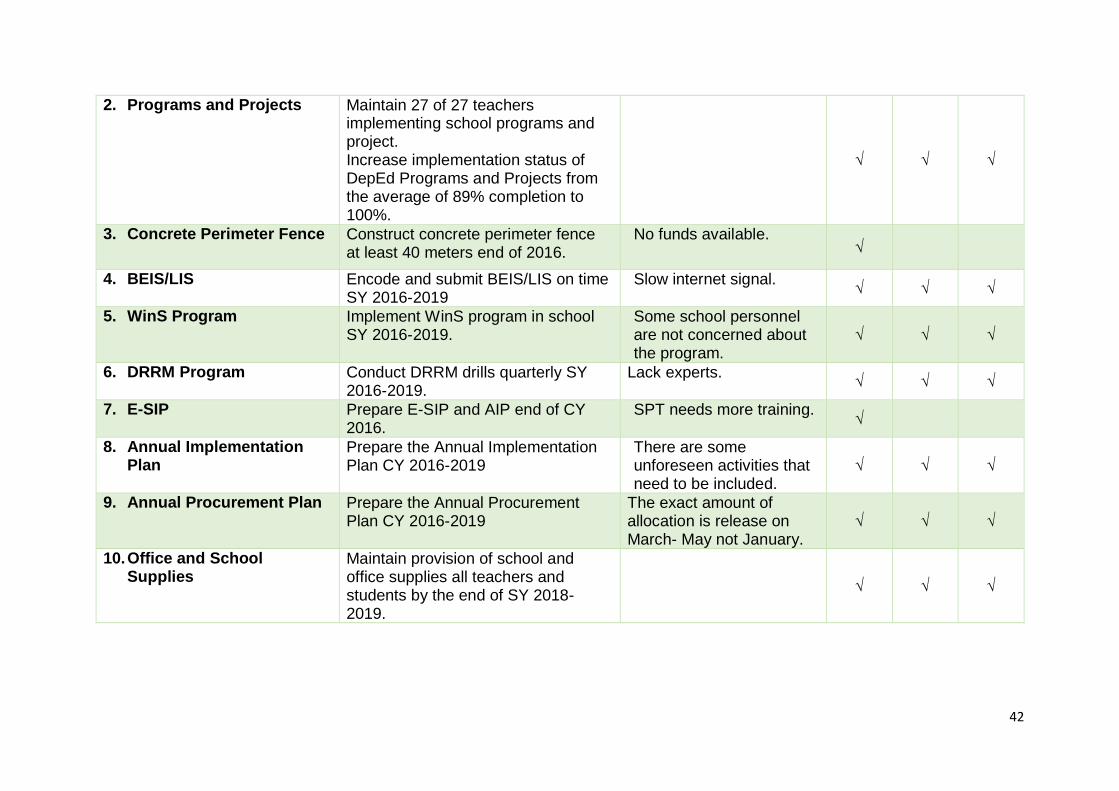
2. Programs and Projects Maintain 27 of 27 teachers implementing school programs and project. Increase implementation status of DepEd Programs and Projects from the average of 89% completion to 100%.
√ √ √
3. Concrete Perimeter Fence Construct concrete perimeter fence at least 40 meters end of 2016.
No funds available. √
4. BEIS/LIS Encode and submit BEIS/LIS on time SY 2016-2019
Slow internet signal. √ √ √
5. WinS Program Implement WinS program in school SY 2016-2019.
Some school personnel are not concerned about the program.
√ √ √
6. DRRM Program Conduct DRRM drills quarterly SY 2016-2019.
Lack experts. √ √ √
7. E-SIP Prepare E-SIP and AIP end of CY 2016.
SPT needs more training. √
8. Annual Implementation Plan
Prepare the Annual Implementation Plan CY 2016-2019
There are some unforeseen activities that need to be included.
√ √ √
9. Annual Procurement Plan Prepare the Annual Procurement Plan CY 2016-2019
The exact amount of allocation is release on March- May not January.
√ √ √
10. Office and School Supplies
Maintain provision of school and office supplies all teachers and students by the end of SY 2018-2019.
√ √ √
43
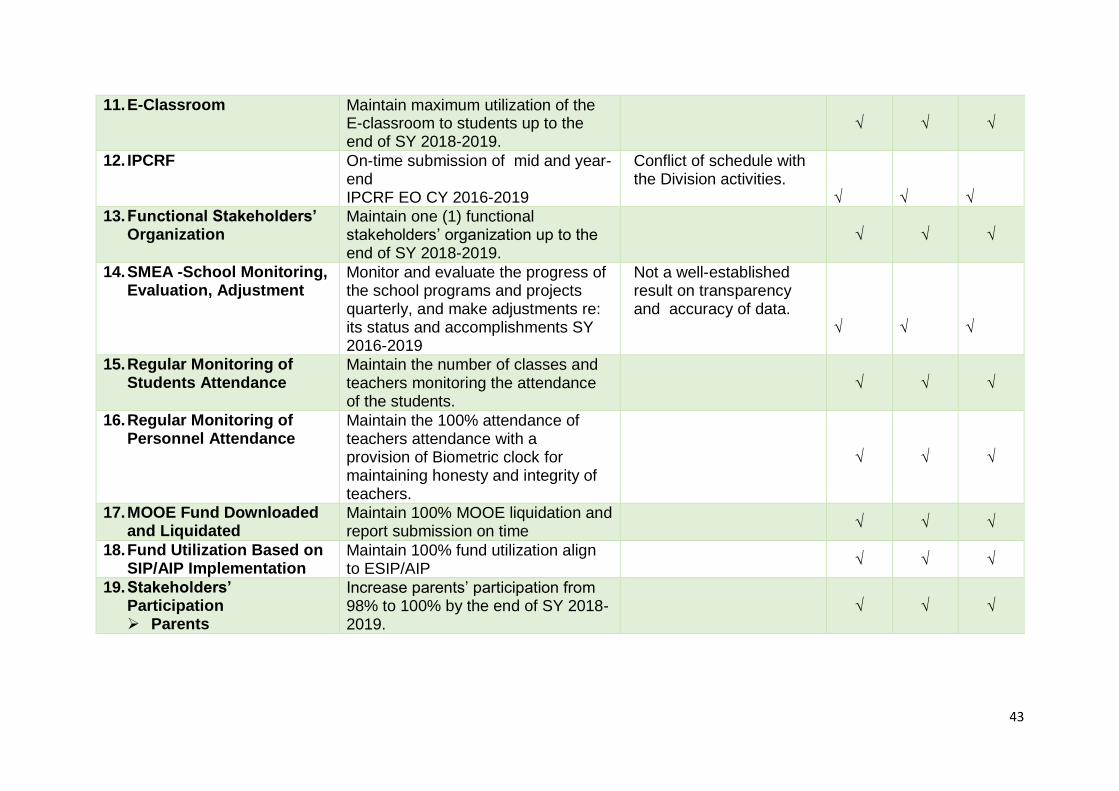
11. E-Classroom Maintain maximum utilization of the E-classroom to students up to the end of SY 2018-2019.
√ √ √
12. IPCRF On-time submission of mid and year-end IPCRF EO CY 2016-2019
Conflict of schedule with the Division activities.
√
√
√
13. Functional Stakeholders’ Organization
Maintain one (1) functional stakeholders’ organization up to the end of SY 2018-2019.
√ √ √
14. SMEA -School Monitoring, Evaluation, Adjustment
Monitor and evaluate the progress of the school programs and projects quarterly, and make adjustments re: its status and accomplishments SY 2016-2019
Not a well-established result on transparency and accuracy of data.
√
√
√
15. Regular Monitoring of Students Attendance
Maintain the number of classes and teachers monitoring the attendance of the students.
√ √ √
16. Regular Monitoring of Personnel Attendance
Maintain the 100% attendance of teachers attendance with a provision of Biometric clock for maintaining honesty and integrity of teachers.
√ √ √
17. MOOE Fund Downloaded and Liquidated
Maintain 100% MOOE liquidation and report submission on time
√ √ √
18. Fund Utilization Based on SIP/AIP Implementation
Maintain 100% fund utilization align to ESIP/AIP
√ √ √
19. Stakeholders’ Participation Parents
Increase parents’ participation from 98% to 100% by the end of SY 2018-2019.
√ √ √
44
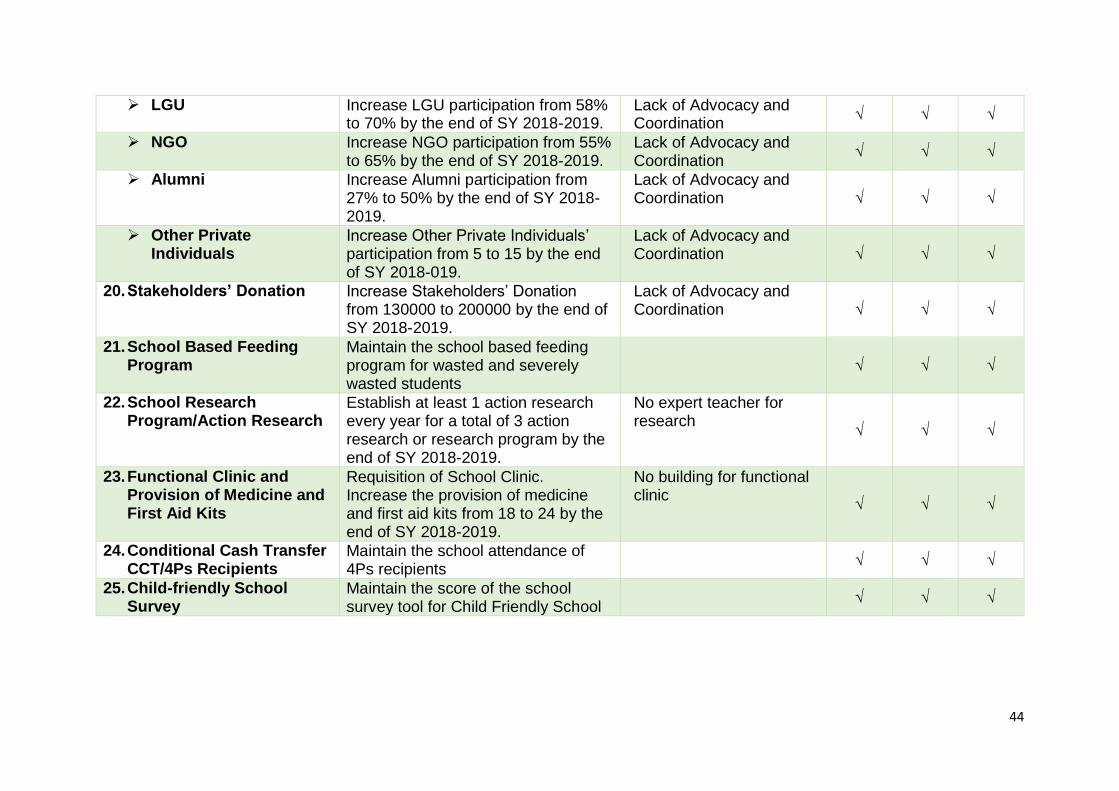
LGU Increase LGU participation from 58% to 70% by the end of SY 2018-2019.
Lack of Advocacy and Coordination
√ √ √
NGO Increase NGO participation from 55% to 65% by the end of SY 2018-2019.
Lack of Advocacy and Coordination
√ √ √
Alumni Increase Alumni participation from 27% to 50% by the end of SY 2018-2019.
Lack of Advocacy and Coordination √ √ √
Other Private Individuals
Increase Other Private Individuals’ participation from 5 to 15 by the end of SY 2018-019.
Lack of Advocacy and Coordination √ √ √
20. Stakeholders’ Donation Increase Stakeholders’ Donation from 130000 to 200000 by the end of SY 2018-2019.
Lack of Advocacy and Coordination √ √ √
21. School Based Feeding Program
Maintain the school based feeding program for wasted and severely wasted students
√ √ √
22. School Research Program/Action Research
Establish at least 1 action research every year for a total of 3 action research or research program by the end of SY 2018-2019.
No expert teacher for research
√ √ √
23. Functional Clinic and Provision of Medicine and First Aid Kits
Requisition of School Clinic. Increase the provision of medicine and first aid kits from 18 to 24 by the end of SY 2018-2019.
No building for functional clinic
√ √ √
24. Conditional Cash Transfer CCT/4Ps Recipients
Maintain the school attendance of 4Ps recipients
√ √ √
25. Child-friendly School Survey
Maintain the score of the school survey tool for Child Friendly School
√ √ √
45
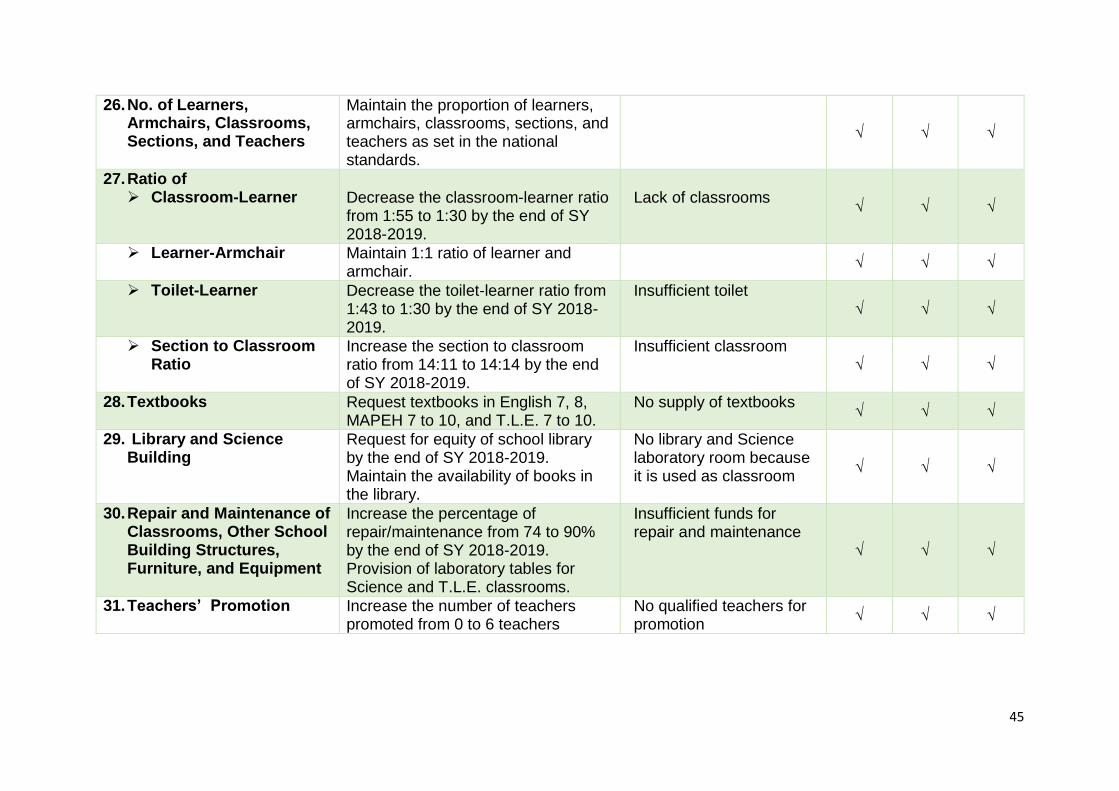
26. No. of Learners, Armchairs, Classrooms, Sections, and Teachers
Maintain the proportion of learners, armchairs, classrooms, sections, and teachers as set in the national standards.
√ √ √
27. Ratio of Classroom-Learner
Decrease the classroom-learner ratio from 1:55 to 1:30 by the end of SY 2018-2019.
Lack of classrooms
√ √ √
Learner-Armchair Maintain 1:1 ratio of learner and armchair.
√ √ √
Toilet-Learner Decrease the toilet-learner ratio from 1:43 to 1:30 by the end of SY 2018-2019.
Insufficient toilet √ √ √
Section to Classroom Ratio
Increase the section to classroom ratio from 14:11 to 14:14 by the end of SY 2018-2019.
Insufficient classroom √ √ √
28. Textbooks Request textbooks in English 7, 8, MAPEH 7 to 10, and T.L.E. 7 to 10.
No supply of textbooks √ √ √
29. Library and Science Building
Request for equity of school library by the end of SY 2018-2019. Maintain the availability of books in the library.
No library and Science laboratory room because it is used as classroom
√ √ √
30. Repair and Maintenance of Classrooms, Other School Building Structures, Furniture, and Equipment
Increase the percentage of repair/maintenance from 74 to 90% by the end of SY 2018-2019. Provision of laboratory tables for Science and T.L.E. classrooms.
Insufficient funds for repair and maintenance
√ √ √
31. Teachers’ Promotion Increase the number of teachers promoted from 0 to 6 teachers
No qualified teachers for promotion
√ √ √
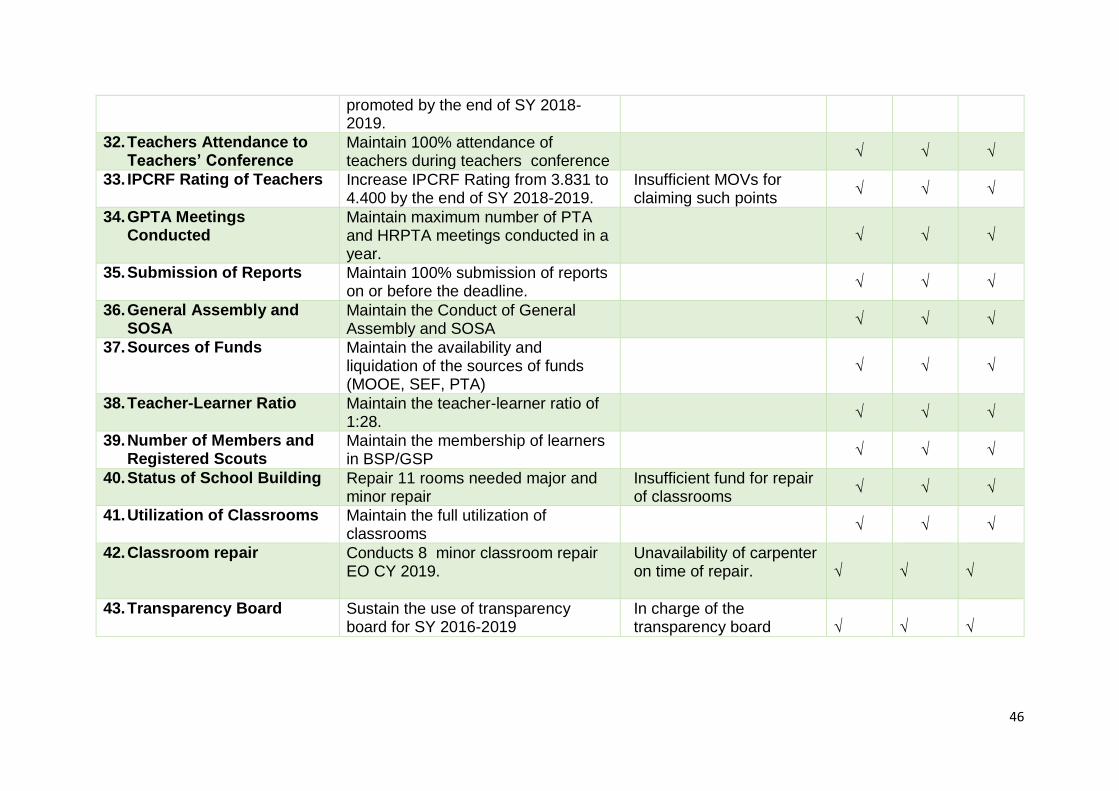
46
promoted by the end of SY 2018-2019.
32. Teachers Attendance to Teachers’ Conference
Maintain 100% attendance of teachers during teachers conference
√ √ √
33. IPCRF Rating of Teachers Increase IPCRF Rating from 3.831 to 4.400 by the end of SY 2018-2019.
Insufficient MOVs for claiming such points
√ √ √
34. GPTA Meetings Conducted
Maintain maximum number of PTA and HRPTA meetings conducted in a year.
√ √ √
35. Submission of Reports Maintain 100% submission of reports on or before the deadline.
√ √ √
36. General Assembly and SOSA
Maintain the Conduct of General Assembly and SOSA
√ √ √
37. Sources of Funds Maintain the availability and liquidation of the sources of funds (MOOE, SEF, PTA)
√ √ √
38. Teacher-Learner Ratio Maintain the teacher-learner ratio of 1:28.
√ √ √
39. Number of Members and Registered Scouts
Maintain the membership of learners in BSP/GSP
√ √ √
40. Status of School Building Repair 11 rooms needed major and minor repair
Insufficient fund for repair of classrooms
√ √ √
41. Utilization of Classrooms Maintain the full utilization of classrooms
√ √ √
42. Classroom repair Conducts 8 minor classroom repair EO CY 2019.
Unavailability of carpenter on time of repair.
√
√
√
43. Transparency Board Sustain the use of transparency board for SY 2016-2019
In charge of the transparency board
√
√
√
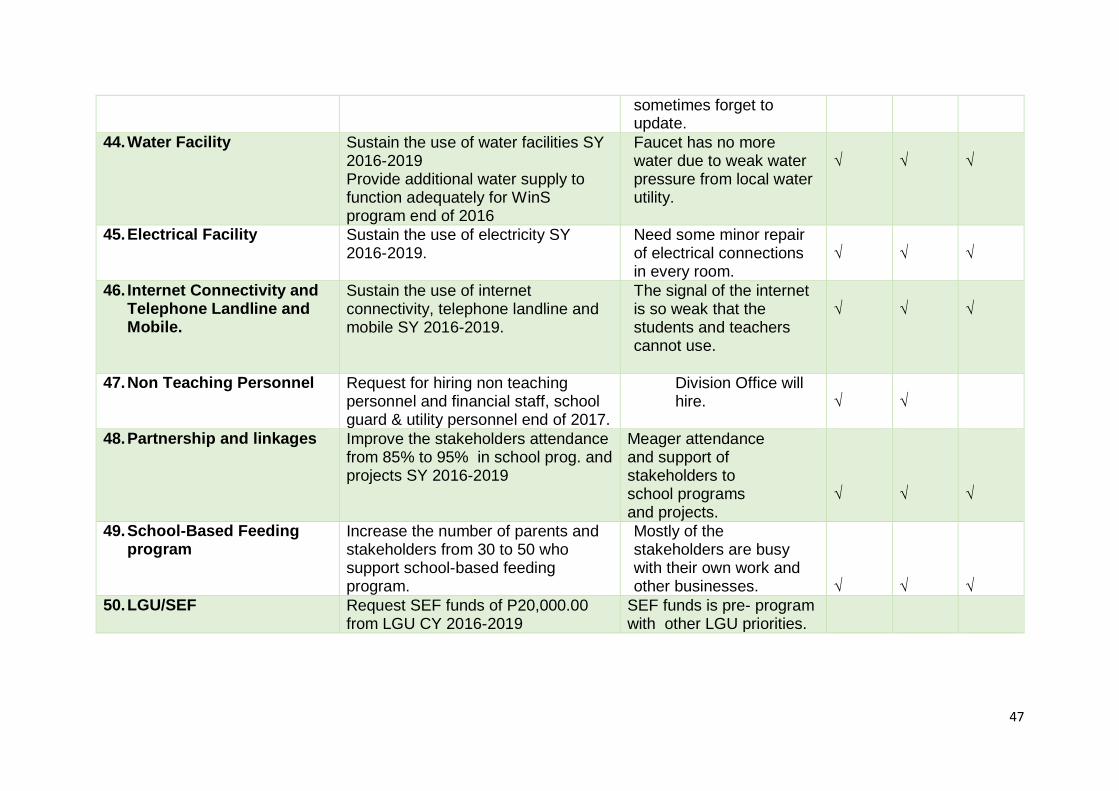
47
sometimes forget to update.
44. Water Facility Sustain the use of water facilities SY 2016-2019 Provide additional water supply to function adequately for WinS program end of 2016
Faucet has no more water due to weak water pressure from local water utility.
√
√
√
45. Electrical Facility Sustain the use of electricity SY 2016-2019.
Need some minor repair of electrical connections in every room.
√
√
√
46. Internet Connectivity and Telephone Landline and Mobile.
Sustain the use of internet connectivity, telephone landline and mobile SY 2016-2019.
The signal of the internet is so weak that the students and teachers cannot use.
√
√
√
47. Non Teaching Personnel Request for hiring non teaching personnel and financial staff, school guard & utility personnel end of 2017.
Division Office will hire.
√
√
48. Partnership and linkages Improve the stakeholders attendance from 85% to 95% in school prog. and projects SY 2016-2019
Meager attendance and support of stakeholders to school programs and projects.
√
√
√
49. School-Based Feeding program
Increase the number of parents and stakeholders from 30 to 50 who support school-based feeding program.
Mostly of the stakeholders are busy with their own work and other businesses.
√
√
√
50. LGU/SEF Request SEF funds of P20,000.00 from LGU CY 2016-2019
SEF funds is pre- program with other LGU priorities.
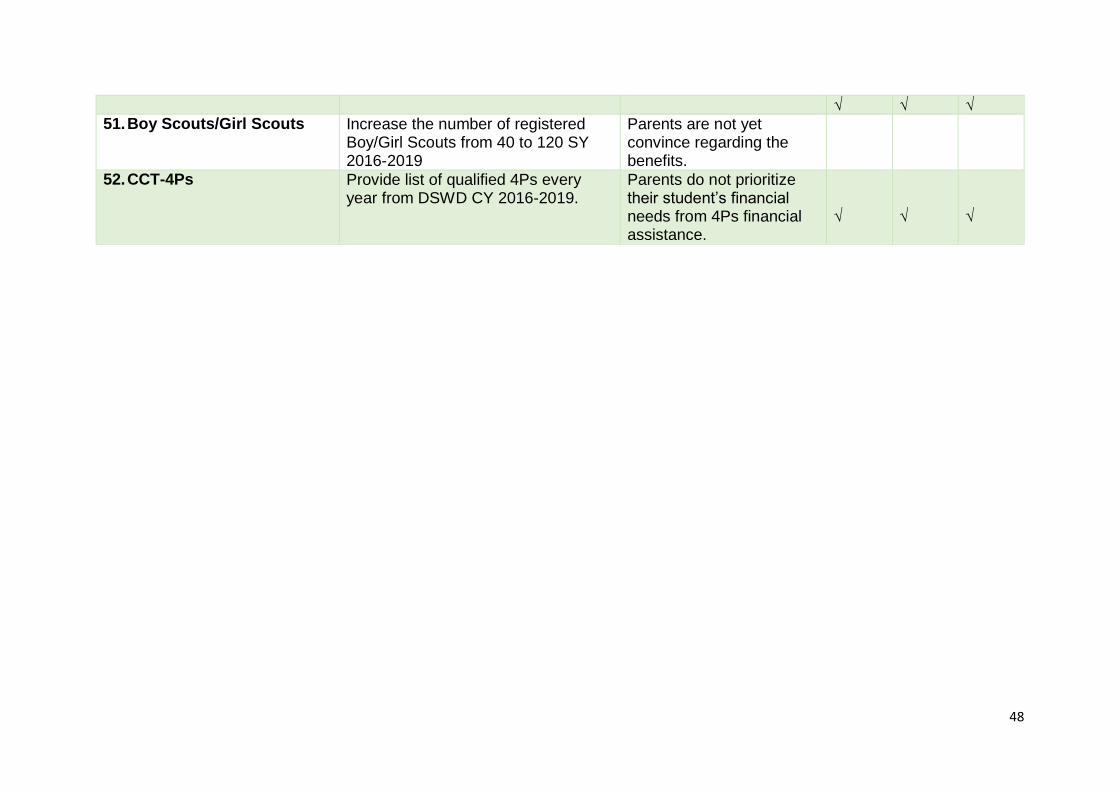
48
√ √ √ 51. Boy Scouts/Girl Scouts Increase the number of registered
Boy/Girl Scouts from 40 to 120 SY 2016-2019
Parents are not yet convince regarding the benefits.
52. CCT-4Ps Provide list of qualified 4Ps every year from DSWD CY 2016-2019.
Parents do not prioritize their student’s financial needs from 4Ps financial assistance.
√
√
√
49
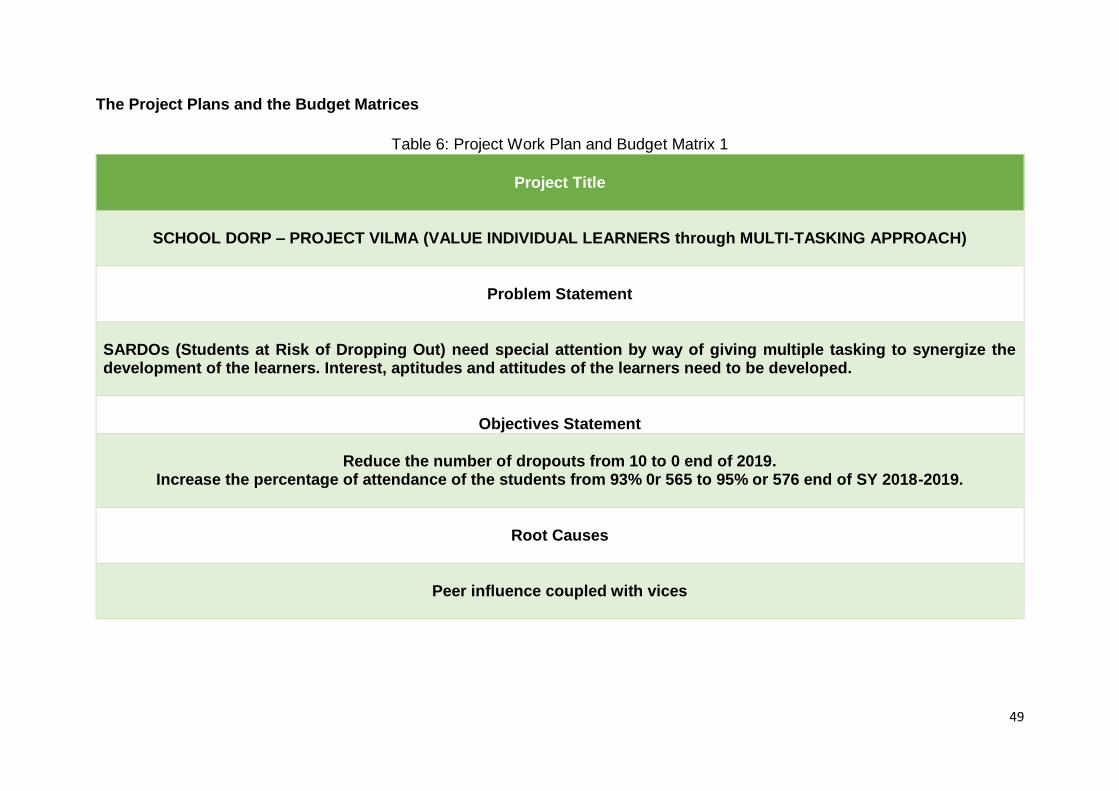
The Project Plans and the Budget Matrices
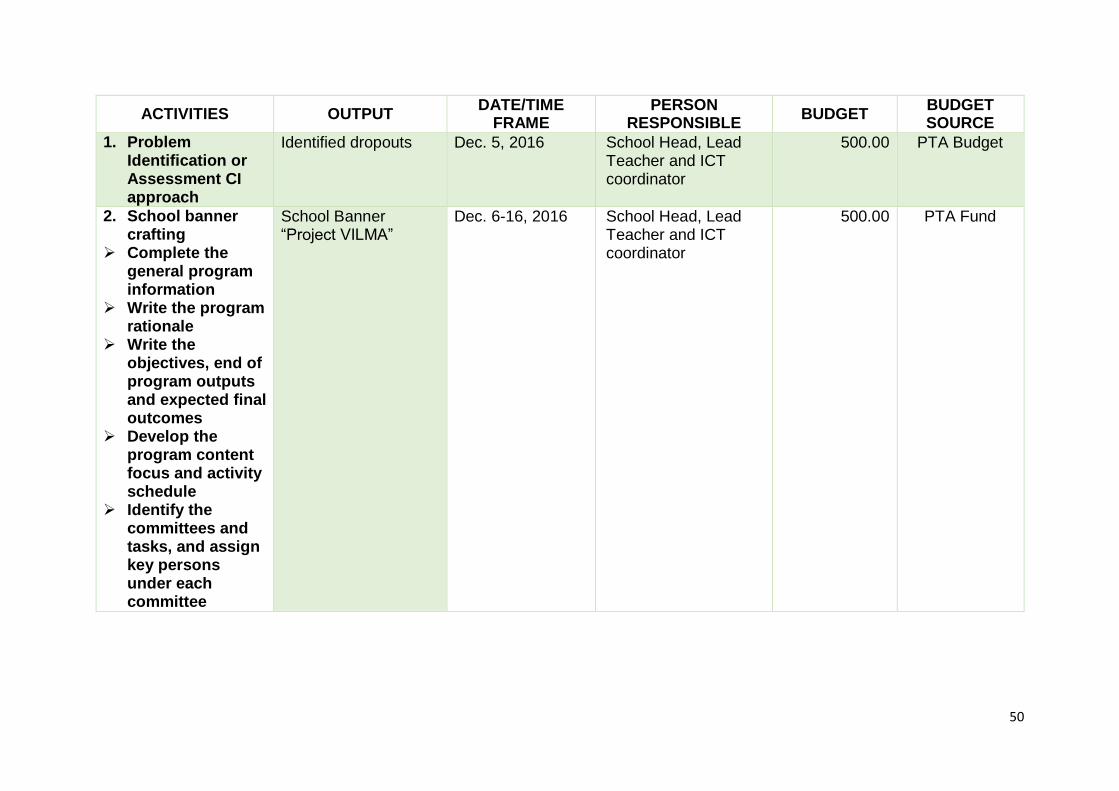
Table 6: Project Work Plan and Budget Matrix 1
Project Title
SCHOOL DORP – PROJECT VILMA (VALUE INDIVIDUAL LEARNERS through MULTI-TASKING APPROACH)
Problem Statement
SARDOs (Students at Risk of Dropping Out) need special attention by way of giving multiple tasking to synergize the development of the learners. Interest, aptitudes and attitudes of the learners need to be developed.
Objectives Statement
Reduce the number of dropouts from 10 to 0 end of 2019.
Increase the percentage of attendance of the students from 93% 0r 565 to 95% or 576 end of SY 2018-2019.
Root Causes
Peer influence coupled with vices
50
ACTIVITIES OUTPUT DATE/TIME
FRAME PERSON
RESPONSIBLE BUDGET
BUDGET SOURCE
1. Problem Identification or Assessment CI approach
Identified dropouts
Dec. 5, 2016 School Head, Lead Teacher and ICT coordinator
500.00 PTA Budget
2. School banner crafting
Complete the general program information
Write the program rationale
Write the objectives, end of program outputs and expected final outcomes
Develop the program content focus and activity schedule
Identify the committees and tasks, and assign key persons under each committee
School Banner “Project VILMA”
Dec. 6-16, 2016 School Head, Lead Teacher and ICT coordinator
500.00 PTA Fund
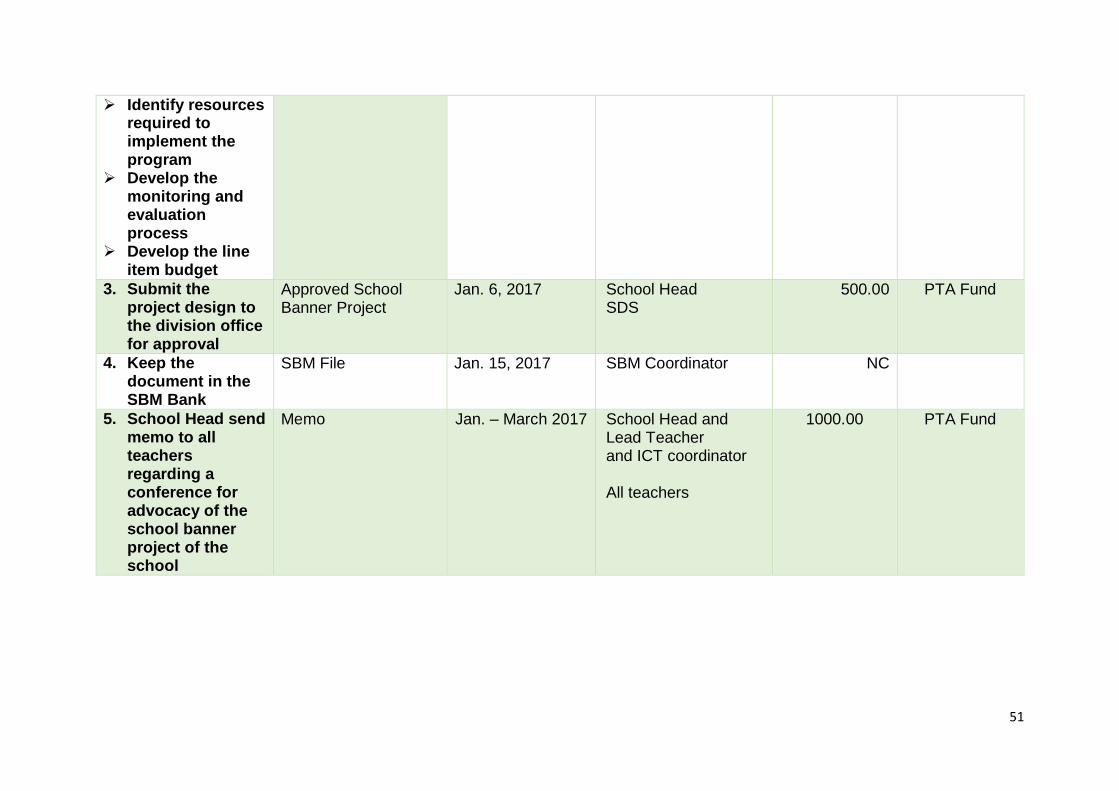
51
Identify resources required to implement the program
Develop the monitoring and evaluation process
Develop the line item budget
3. Submit the project design to the division office for approval
Approved School Banner Project
Jan. 6, 2017 School Head SDS
500.00 PTA Fund
4. Keep the document in the SBM Bank
SBM File Jan. 15, 2017 SBM Coordinator NC
5. School Head send memo to all teachers regarding a conference for advocacy of the school banner project of the school
Memo Jan. – March 2017 School Head and Lead Teacher and ICT coordinator All teachers
1000.00 PTA Fund
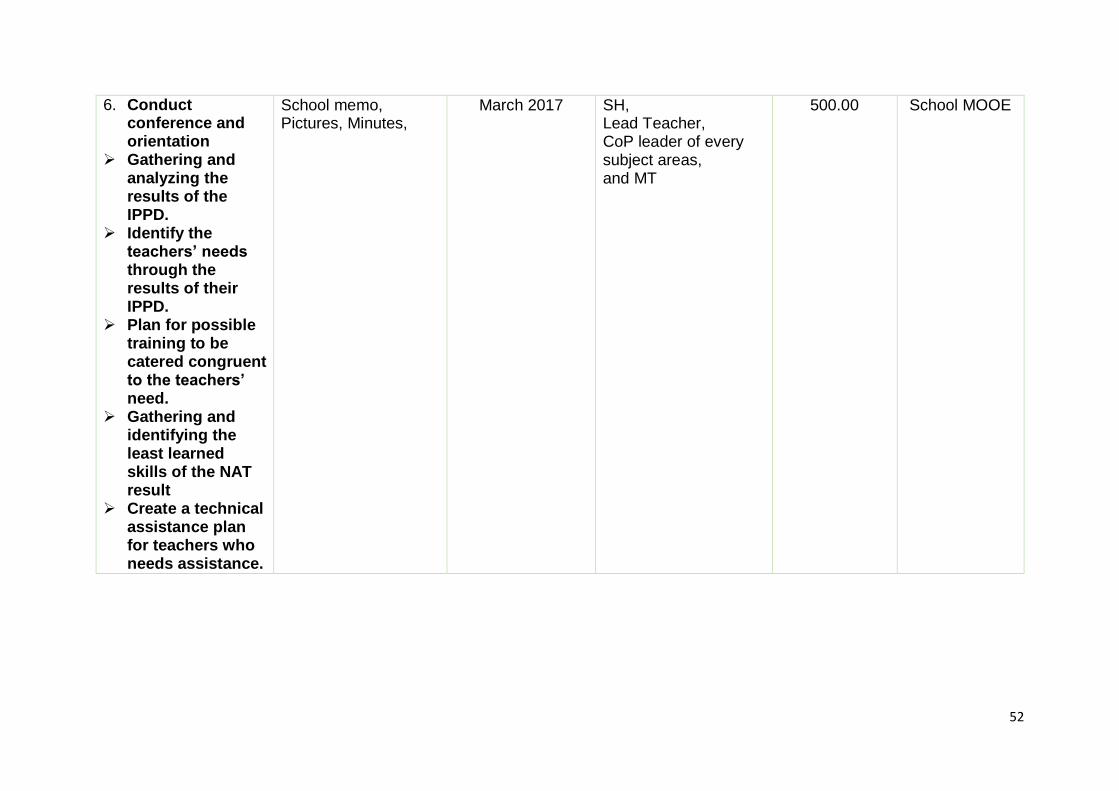
52
6. Conduct conference and orientation
Gathering and analyzing the results of the IPPD.
Identify the teachers’ needs through the results of their IPPD.
Plan for possible training to be catered congruent to the teachers’ need.
Gathering and identifying the least learned skills of the NAT result
Create a technical assistance plan for teachers who needs assistance.
School memo, Pictures, Minutes,
March 2017
SH, Lead Teacher, CoP leader of every subject areas, and MT
500.00 School MOOE
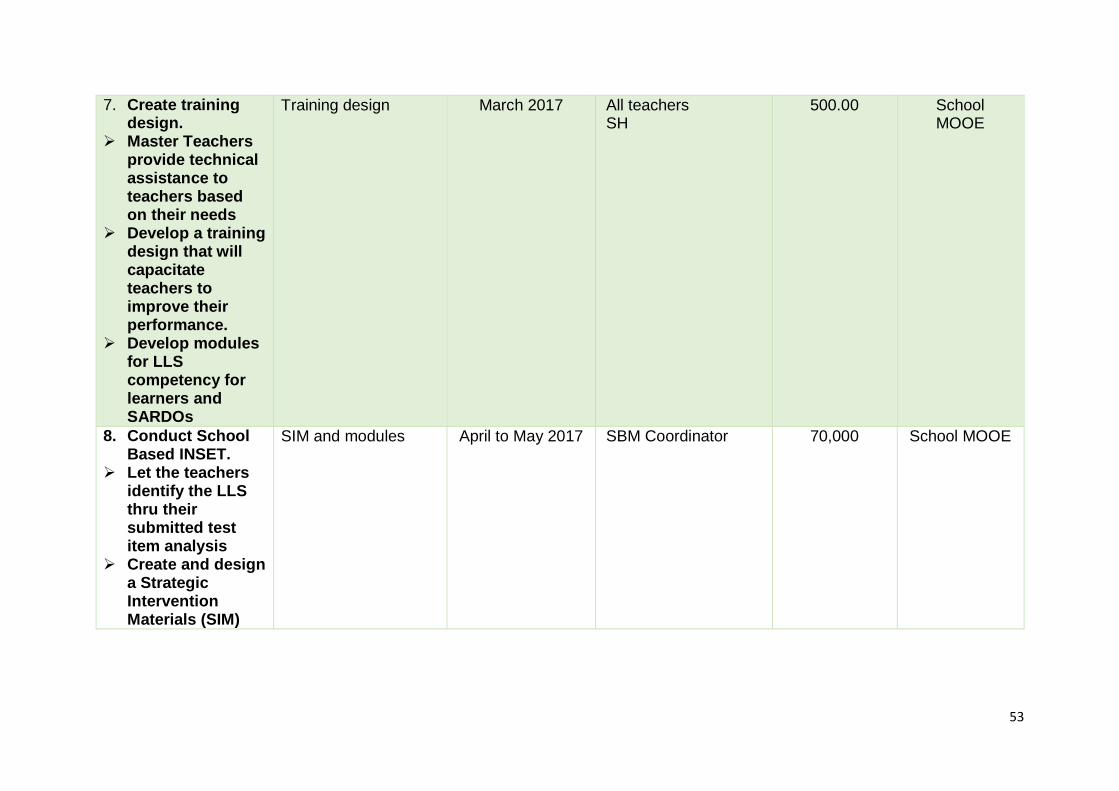
53
7. Create training design.
Master Teachers provide technical assistance to teachers based on their needs
Develop a training design that will capacitate teachers to improve their performance.
Develop modules for LLS competency for learners and SARDOs
Training design March 2017 All teachers SH
500.00
School MOOE
8. Conduct School Based INSET.
Let the teachers identify the LLS thru their submitted test item analysis
Create and design a Strategic Intervention Materials (SIM)
SIM and modules
April to May 2017 SBM Coordinator 70,000
School MOOE
54
Submit to the SH for approval
Reproduce for the learners
Use the modules for the identified students and SARDOs
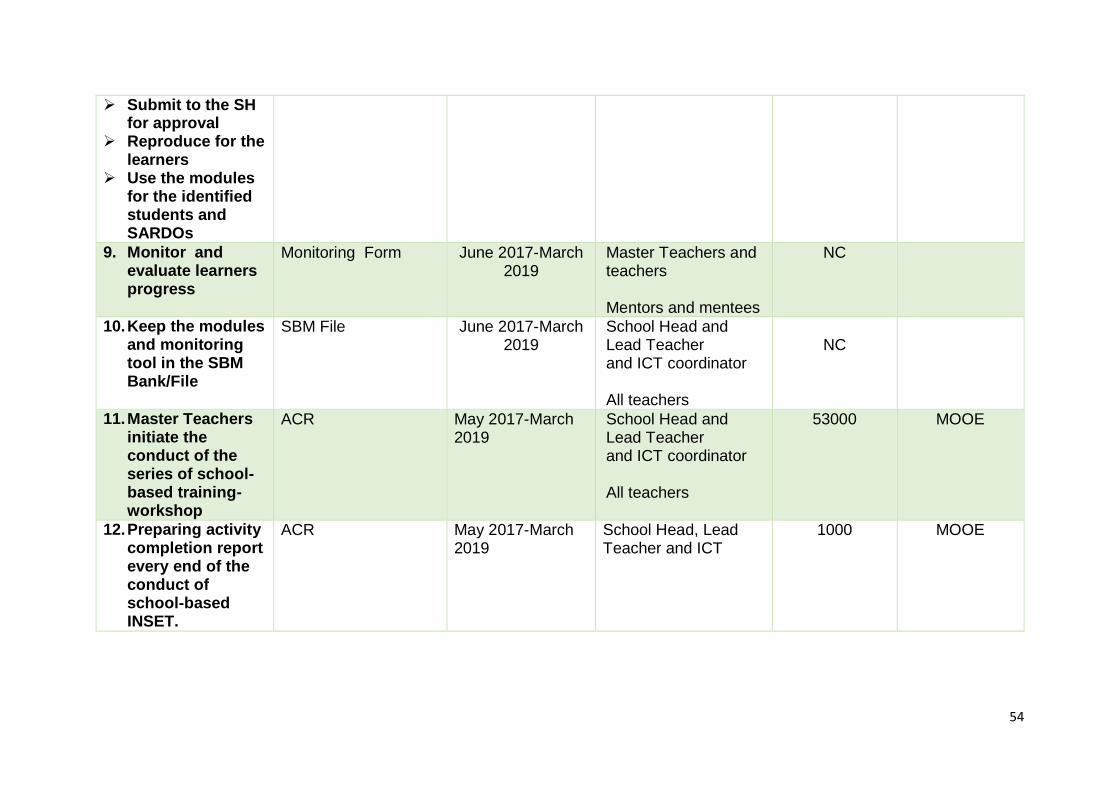
9. Monitor and evaluate learners progress
Monitoring Form June 2017-March 2019
Master Teachers and teachers Mentors and mentees
NC
10. Keep the modules and monitoring tool in the SBM Bank/File
SBM File June 2017-March 2019
School Head and Lead Teacher and ICT coordinator All teachers
NC
11. Master Teachers initiate the conduct of the series of school-based training-workshop
ACR May 2017-March 2019
School Head and Lead Teacher and ICT coordinator All teachers
53000 MOOE
12. Preparing activity completion report every end of the conduct of school-based INSET.
ACR May 2017-March 2019
School Head, Lead Teacher and ICT
1000 MOOE
55
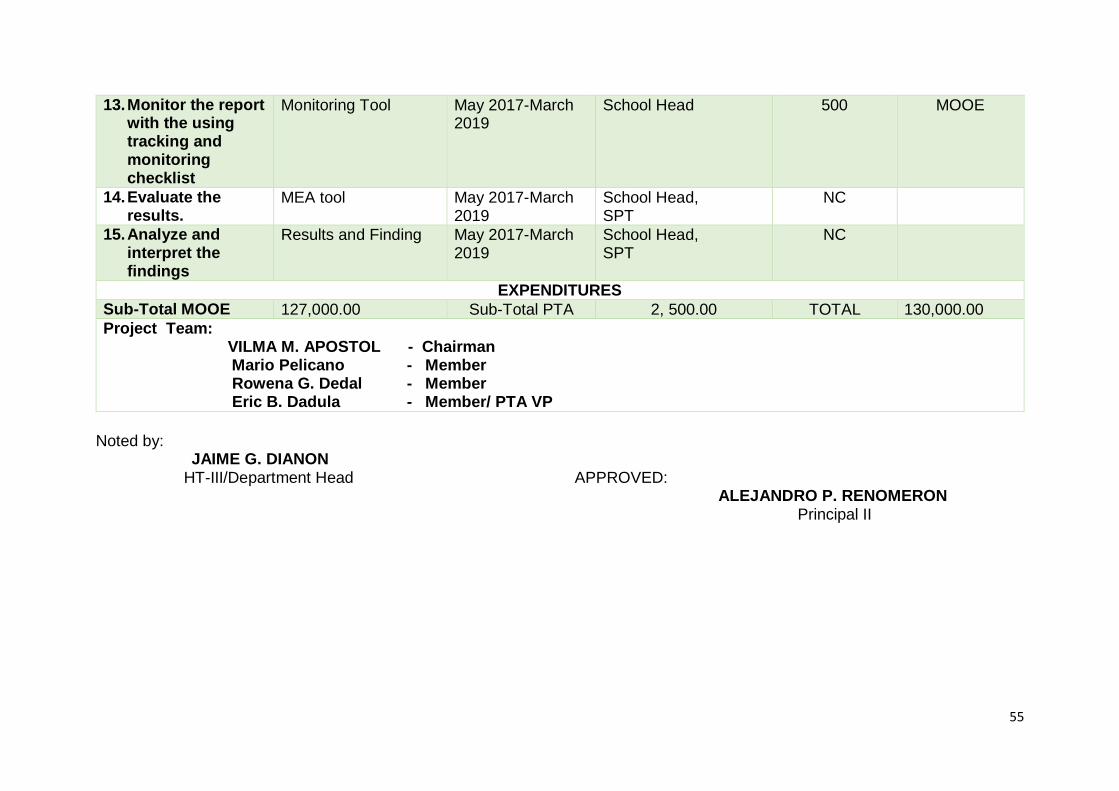
13. Monitor the report with the using tracking and monitoring checklist
Monitoring Tool May 2017-March 2019
School Head 500 MOOE
14. Evaluate the results.
MEA tool May 2017-March 2019
School Head, SPT
NC
15. Analyze and interpret the findings
Results and Finding May 2017-March 2019
School Head, SPT
NC
EXPENDITURES
Sub-Total MOOE 127,000.00 Sub-Total PTA 2, 500.00 TOTAL 130,000.00
Project Team: VILMA M. APOSTOL - Chairman Mario Pelicano - Member Rowena G. Dedal - Member Eric B. Dadula - Member/ PTA VP
Noted by: JAIME G. DIANON
HT-III/Department Head APPROVED: ALEJANDRO P. RENOMERON Principal II
56
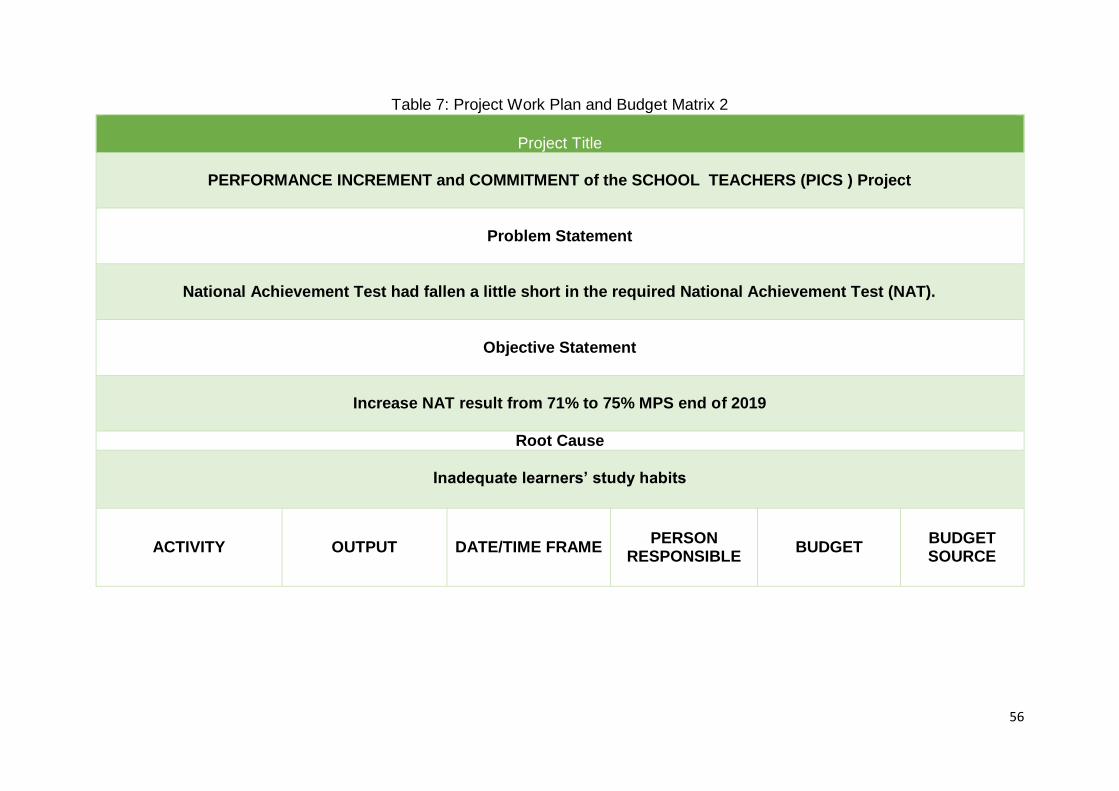
Table 7: Project Work Plan and Budget Matrix 2
Project Title
PERFORMANCE INCREMENT and COMMITMENT of the SCHOOL TEACHERS (PICS ) Project
Problem Statement
National Achievement Test had fallen a little short in the required National Achievement Test (NAT).
Objective Statement
Increase NAT result from 71% to 75% MPS end of 2019
Root Cause
Inadequate learners’ study habits
ACTIVITY OUTPUT DATE/TIME FRAME PERSON
RESPONSIBLE BUDGET
BUDGET SOURCE
57
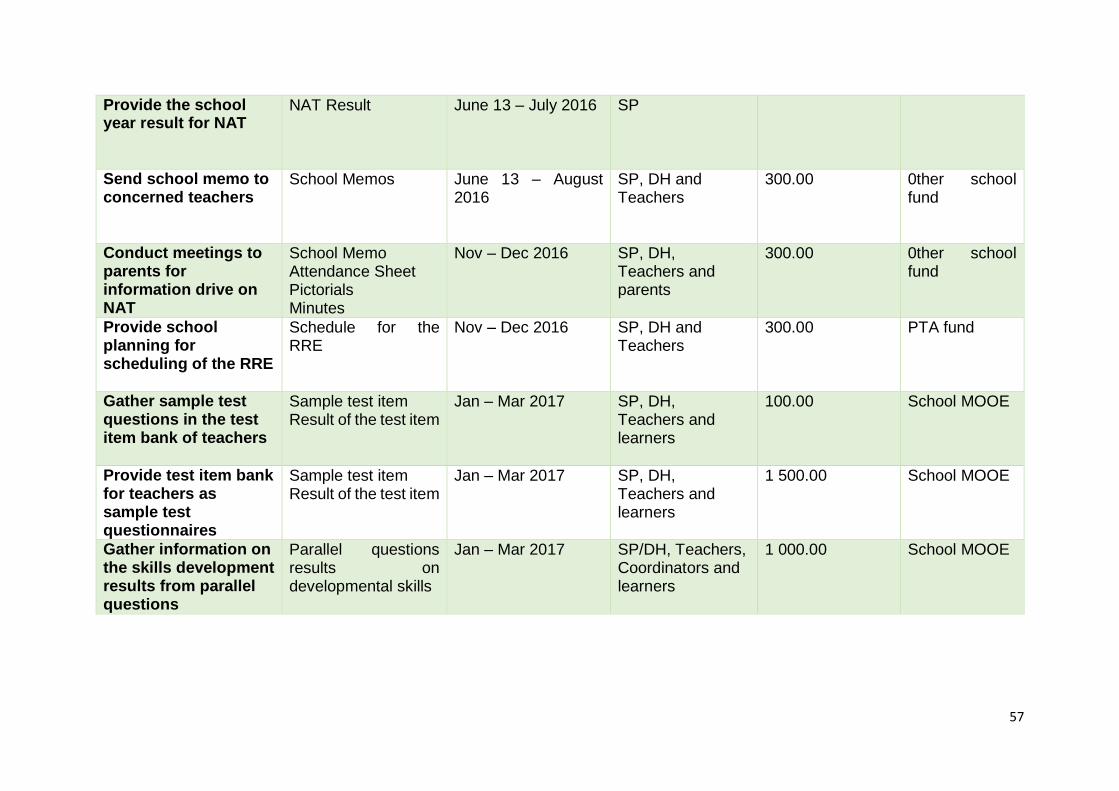
Provide the school year result for NAT
NAT Result June 13 – July 2016 SP
Send school memo to concerned teachers
School Memos June 13 – August 2016
SP, DH and Teachers
300.00 0ther school fund
Conduct meetings to parents for information drive on NAT
School Memo Attendance Sheet Pictorials Minutes
Nov – Dec 2016 SP, DH, Teachers and parents
300.00 0ther school fund
Provide school planning for scheduling of the RRE
Schedule for the RRE
Nov – Dec 2016 SP, DH and Teachers
300.00 PTA fund
Gather sample test questions in the test item bank of teachers
Sample test item Result of the test item
Jan – Mar 2017 SP, DH, Teachers and learners
100.00 School MOOE
Provide test item bank for teachers as sample test questionnaires
Sample test item Result of the test item
Jan – Mar 2017 SP, DH, Teachers and learners
1 500.00 School MOOE
Gather information on the skills development results from parallel questions
Parallel questions results on developmental skills
Jan – Mar 2017 SP/DH, Teachers, Coordinators and learners
1 000.00 School MOOE
58
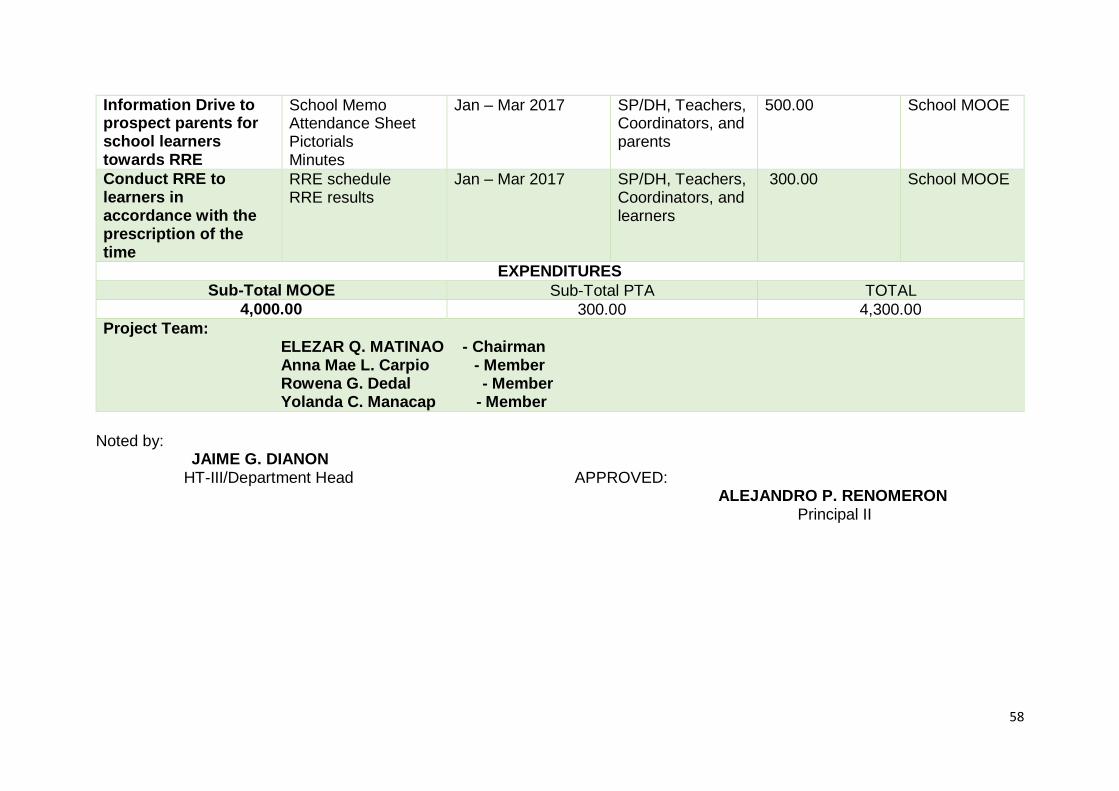
Information Drive to prospect parents for school learners towards RRE
School Memo Attendance Sheet Pictorials Minutes
Jan – Mar 2017 SP/DH, Teachers, Coordinators, and parents
500.00 School MOOE
Conduct RRE to learners in accordance with the prescription of the time
RRE schedule RRE results
Jan – Mar 2017 SP/DH, Teachers, Coordinators, and learners
300.00 School MOOE
EXPENDITURES
Sub-Total MOOE Sub-Total PTA TOTAL 4,000.00 300.00 4,300.00
Project Team: ELEZAR Q. MATINAO - Chairman Anna Mae L. Carpio - Member Rowena G. Dedal - Member Yolanda C. Manacap - Member
Noted by: JAIME G. DIANON
HT-III/Department Head APPROVED: ALEJANDRO P. RENOMERON Principal II
59
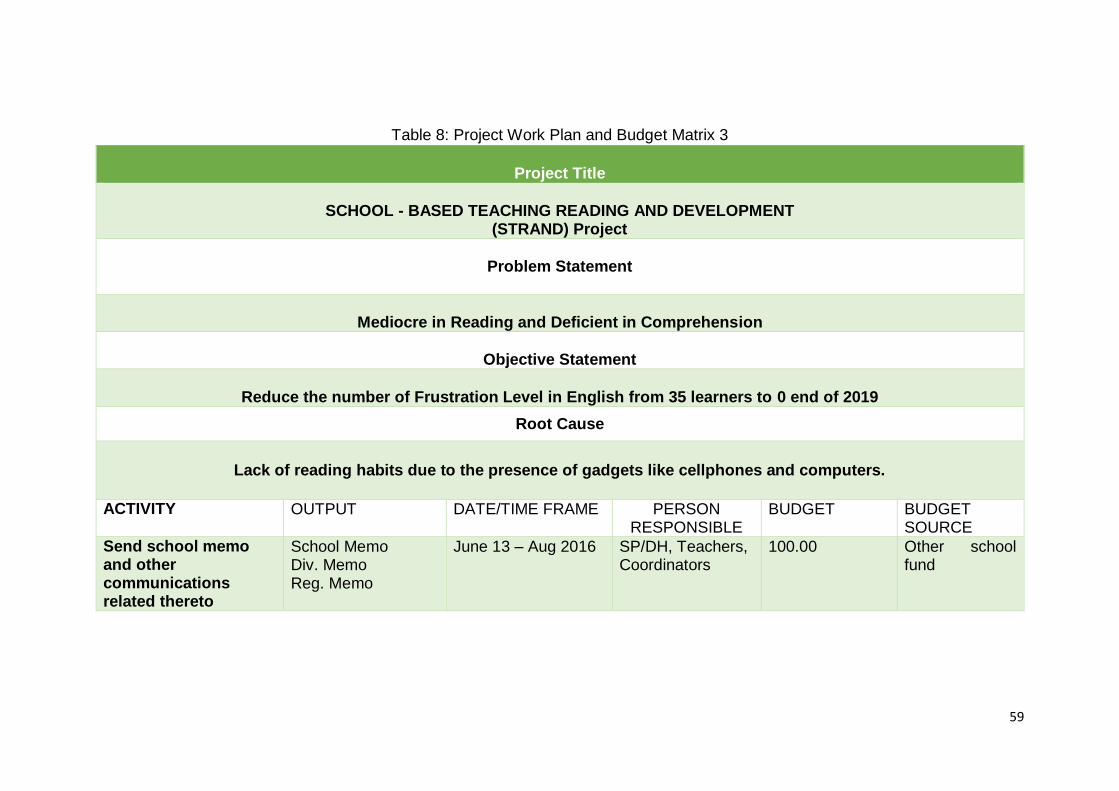
Table 8: Project Work Plan and Budget Matrix 3
Project Title
SCHOOL - BASED TEACHING READING AND DEVELOPMENT
(STRAND) Project
Problem Statement
Mediocre in Reading and Deficient in Comprehension
Objective Statement
Reduce the number of Frustration Level in English from 35 learners to 0 end of 2019
Root Cause
Lack of reading habits due to the presence of gadgets like cellphones and computers.
ACTIVITY OUTPUT DATE/TIME FRAME PERSON RESPONSIBLE
BUDGET BUDGET SOURCE
Send school memo and other communications related thereto
School Memo Div. Memo Reg. Memo
June 13 – Aug 2016 SP/DH, Teachers, Coordinators
100.00 Other school fund
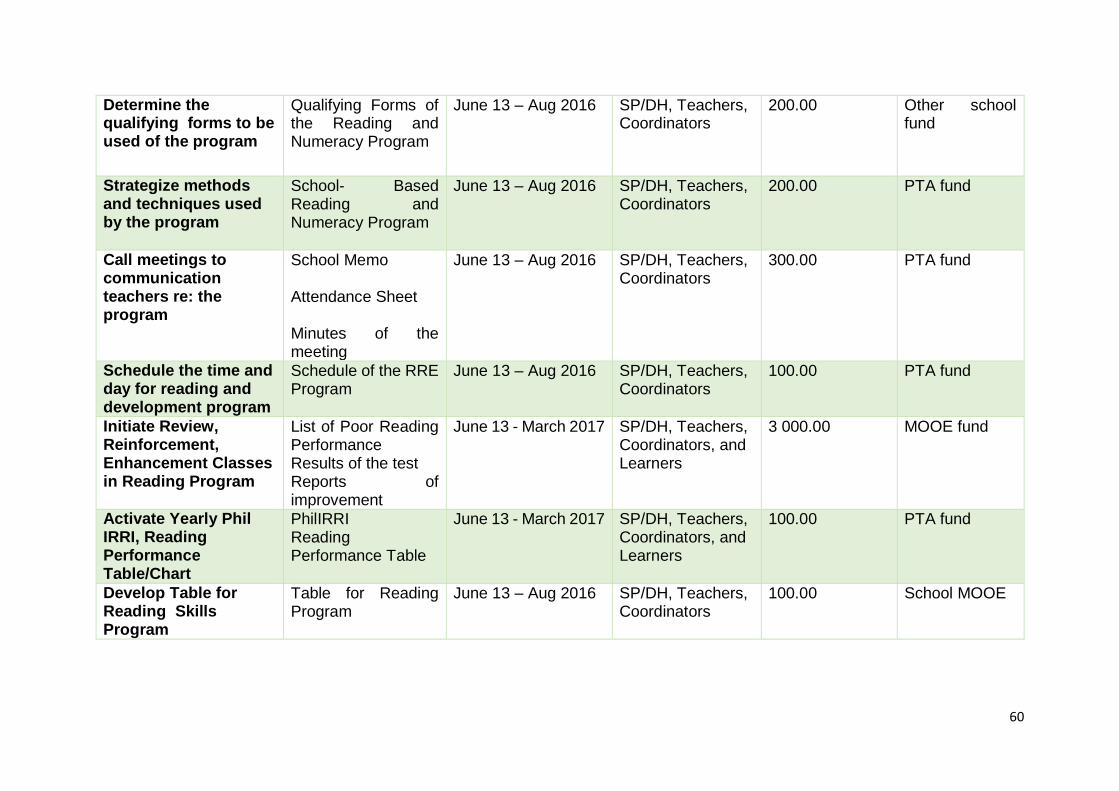
60
Determine the qualifying forms to be used of the program
Qualifying Forms of the Reading and Numeracy Program
June 13 – Aug 2016 SP/DH, Teachers, Coordinators
200.00 Other school fund
Strategize methods and techniques used by the program
School- Based Reading and Numeracy Program
June 13 – Aug 2016 SP/DH, Teachers, Coordinators
200.00 PTA fund
Call meetings to communication teachers re: the program
School Memo Attendance Sheet Minutes of the meeting
June 13 – Aug 2016 SP/DH, Teachers, Coordinators
300.00 PTA fund
Schedule the time and day for reading and development program
Schedule of the RRE Program
June 13 – Aug 2016 SP/DH, Teachers, Coordinators
100.00 PTA fund
Initiate Review, Reinforcement, Enhancement Classes in Reading Program
List of Poor Reading Performance Results of the test Reports of improvement
June 13 - March 2017 SP/DH, Teachers, Coordinators, and Learners
3 000.00 MOOE fund
Activate Yearly Phil IRRI, Reading Performance Table/Chart
PhilIRRI Reading Performance Table
June 13 - March 2017 SP/DH, Teachers, Coordinators, and Learners
100.00 PTA fund
Develop Table for Reading Skills Program
Table for Reading Program
June 13 – Aug 2016 SP/DH, Teachers, Coordinators
100.00 School MOOE
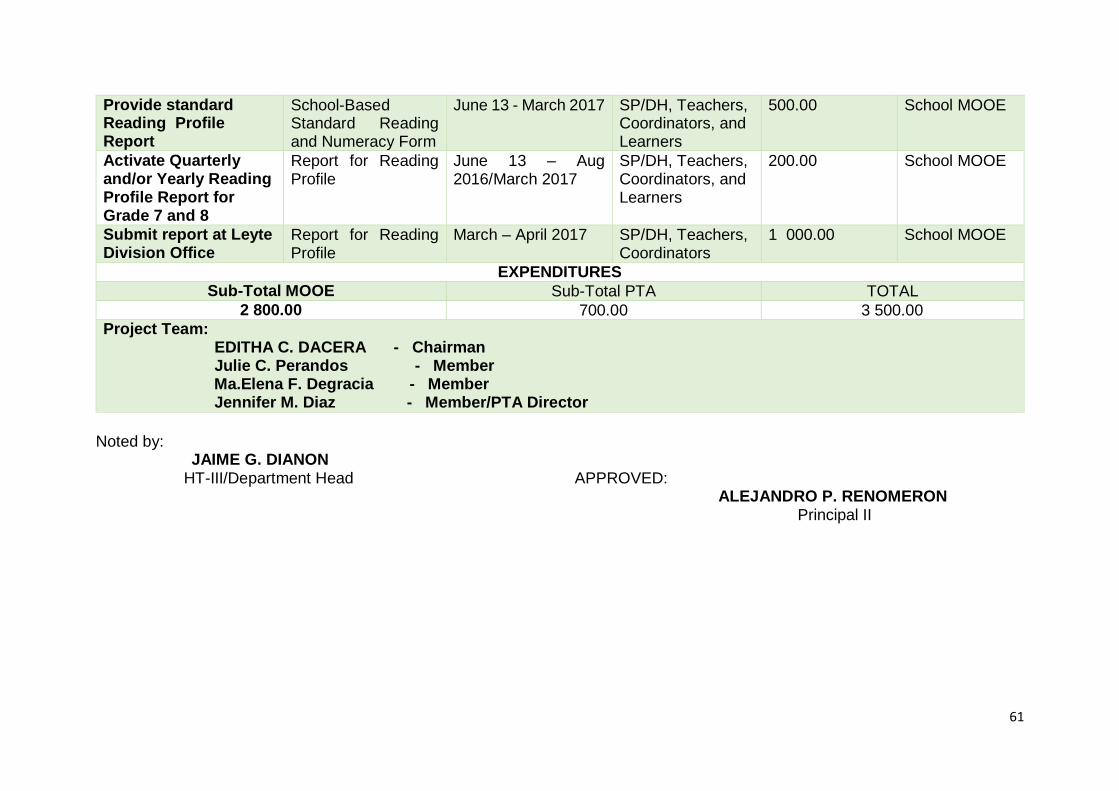
61
Provide standard Reading Profile Report
School-Based Standard Reading and Numeracy Form
June 13 - March 2017 SP/DH, Teachers, Coordinators, and Learners
500.00 School MOOE
Activate Quarterly and/or Yearly Reading Profile Report for Grade 7 and 8
Report for Reading Profile
June 13 – Aug 2016/March 2017
SP/DH, Teachers, Coordinators, and Learners
200.00 School MOOE
Submit report at Leyte Division Office
Report for Reading Profile
March – April 2017 SP/DH, Teachers, Coordinators
1 000.00 School MOOE
EXPENDITURES
Sub-Total MOOE Sub-Total PTA TOTAL
2 800.00 700.00 3 500.00 Project Team: EDITHA C. DACERA - Chairman Julie C. Perandos - Member Ma.Elena F. Degracia - Member Jennifer M. Diaz - Member/PTA Director
Noted by: JAIME G. DIANON
HT-III/Department Head APPROVED: ALEJANDRO P. RENOMERON Principal II
62
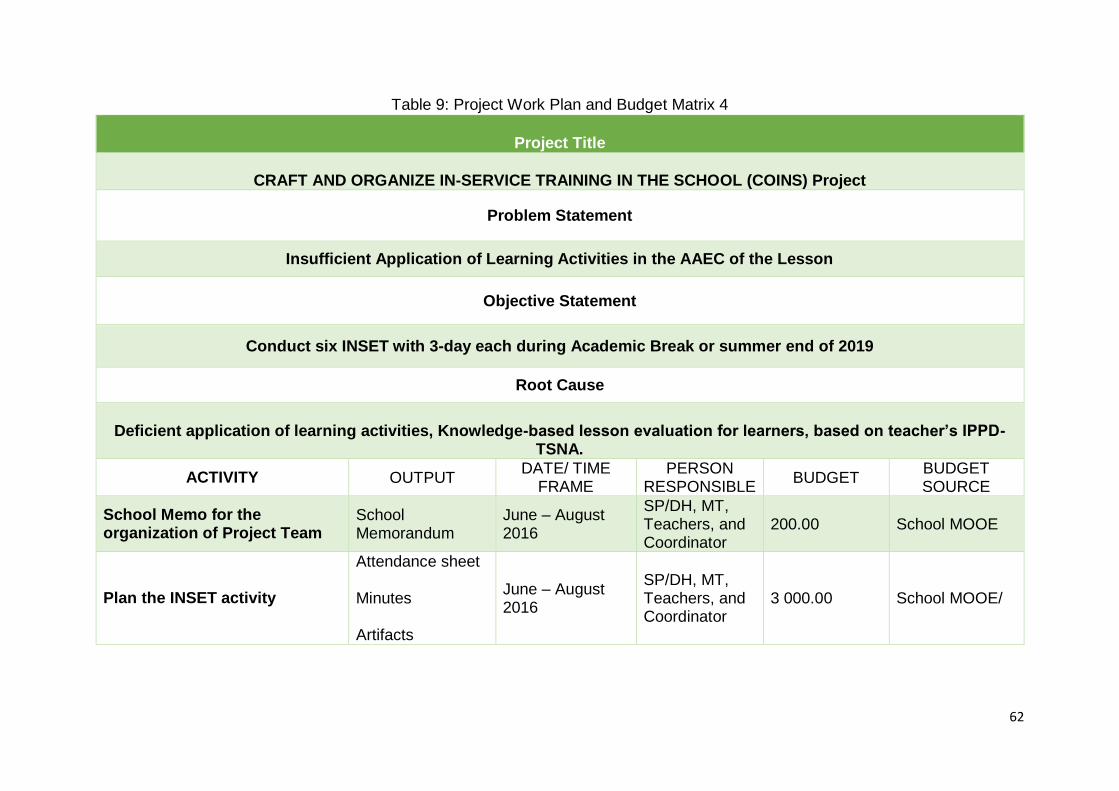
Table 9: Project Work Plan and Budget Matrix 4
Project Title
CRAFT AND ORGANIZE IN-SERVICE TRAINING IN THE SCHOOL (COINS) Project
Problem Statement
Insufficient Application of Learning Activities in the AAEC of the Lesson
Objective Statement
Conduct six INSET with 3-day each during Academic Break or summer end of 2019
Root Cause
Deficient application of learning activities, Knowledge-based lesson evaluation for learners, based on teacher’s IPPD-
TSNA.
ACTIVITY OUTPUT DATE/ TIME
FRAME PERSON
RESPONSIBLE BUDGET
BUDGET SOURCE
School Memo for the organization of Project Team
School Memorandum
June – August 2016
SP/DH, MT, Teachers, and Coordinator
200.00 School MOOE
Plan the INSET activity
Attendance sheet Minutes Artifacts
June – August 2016
SP/DH, MT, Teachers, and Coordinator
3 000.00 School MOOE/
63
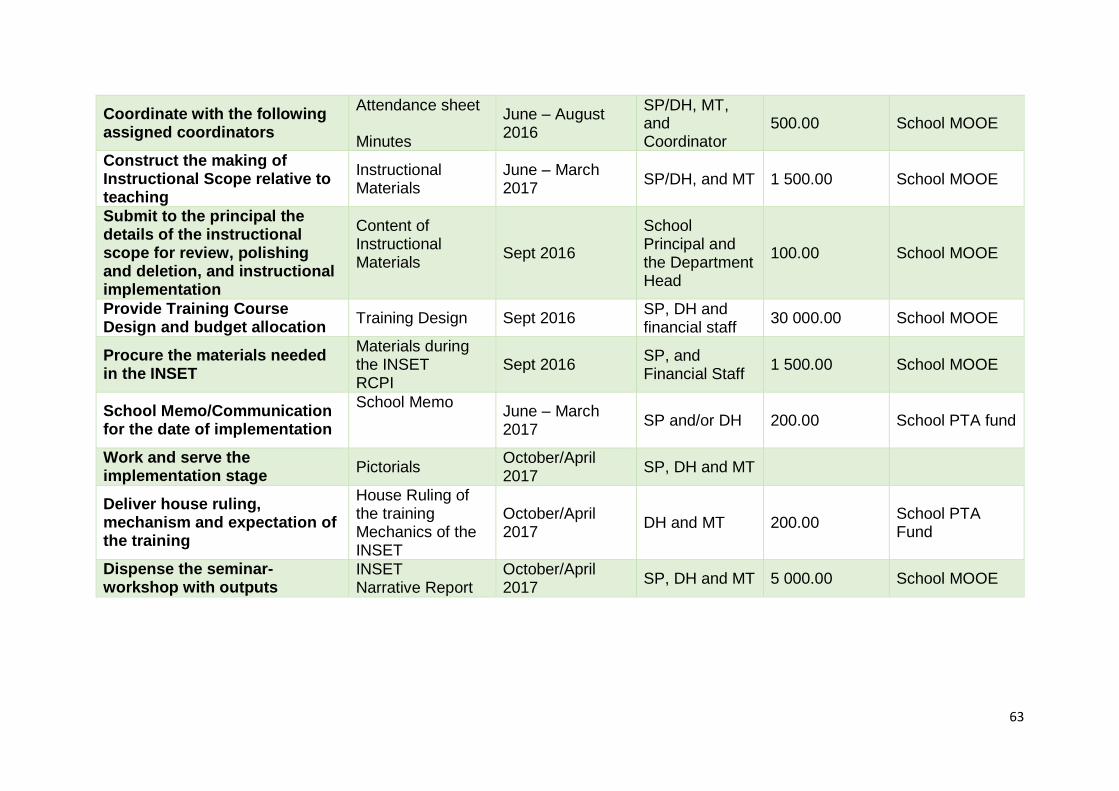
Coordinate with the following assigned coordinators
Attendance sheet Minutes
June – August 2016
SP/DH, MT, and Coordinator
500.00 School MOOE
Construct the making of Instructional Scope relative to teaching
Instructional Materials
June – March 2017
SP/DH, and MT 1 500.00 School MOOE
Submit to the principal the details of the instructional scope for review, polishing and deletion, and instructional implementation
Content of Instructional Materials
Sept 2016
School Principal and the Department Head
100.00 School MOOE
Provide Training Course Design and budget allocation
Training Design Sept 2016 SP, DH and financial staff
30 000.00 School MOOE
Procure the materials needed in the INSET
Materials during the INSET RCPI
Sept 2016 SP, and Financial Staff
1 500.00 School MOOE
School Memo/Communication for the date of implementation
School Memo
June – March 2017
SP and/or DH 200.00 School PTA fund
Work and serve the implementation stage
Pictorials October/April 2017
SP, DH and MT
Deliver house ruling, mechanism and expectation of the training
House Ruling of the training Mechanics of the INSET
October/April 2017
DH and MT 200.00 School PTA Fund
Dispense the seminar-workshop with outputs
INSET Narrative Report
October/April 2017
SP, DH and MT 5 000.00 School MOOE
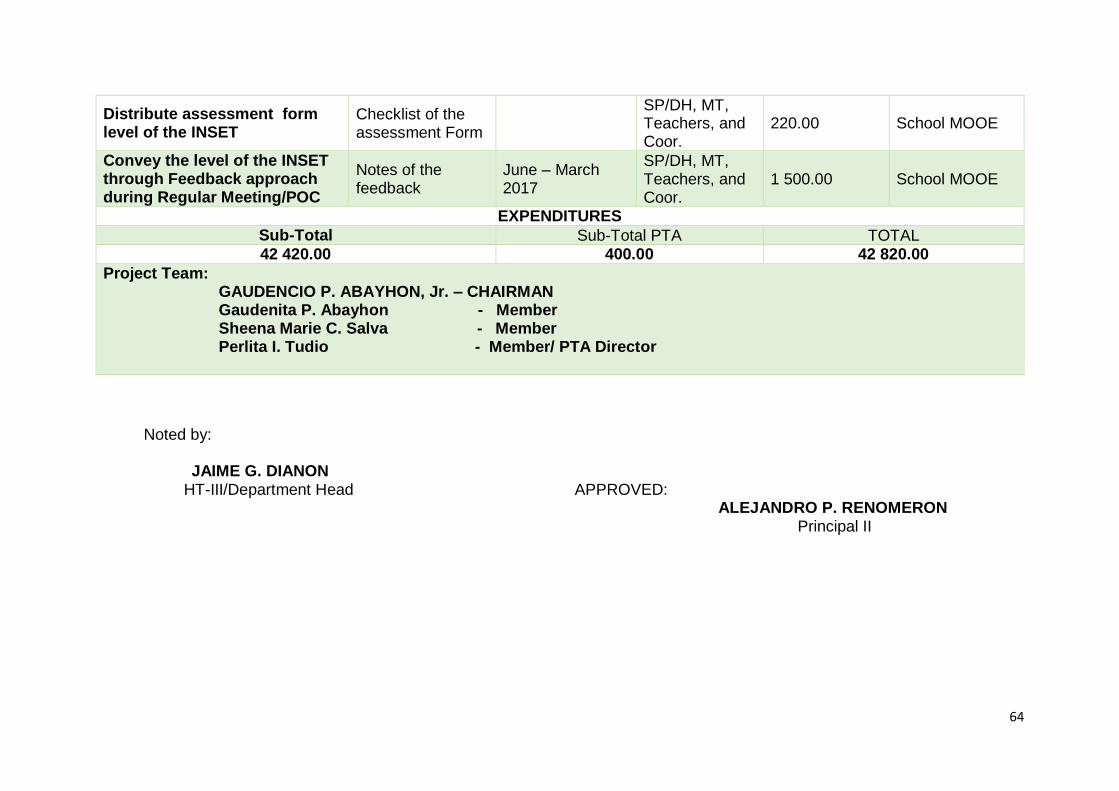
64
Noted by: JAIME G. DIANON
HT-III/Department Head APPROVED: ALEJANDRO P. RENOMERON Principal II
Distribute assessment form level of the INSET
Checklist of the assessment Form
SP/DH, MT, Teachers, and Coor.
220.00 School MOOE
Convey the level of the INSET through Feedback approach during Regular Meeting/POC
Notes of the feedback
June – March 2017
SP/DH, MT, Teachers, and Coor.
1 500.00 School MOOE
EXPENDITURES
Sub-Total Sub-Total PTA TOTAL 42 420.00 400.00 42 820.00
Project Team: GAUDENCIO P. ABAYHON, Jr. – CHAIRMAN Gaudenita P. Abayhon - Member Sheena Marie C. Salva - Member Perlita I. Tudio - Member/ PTA Director
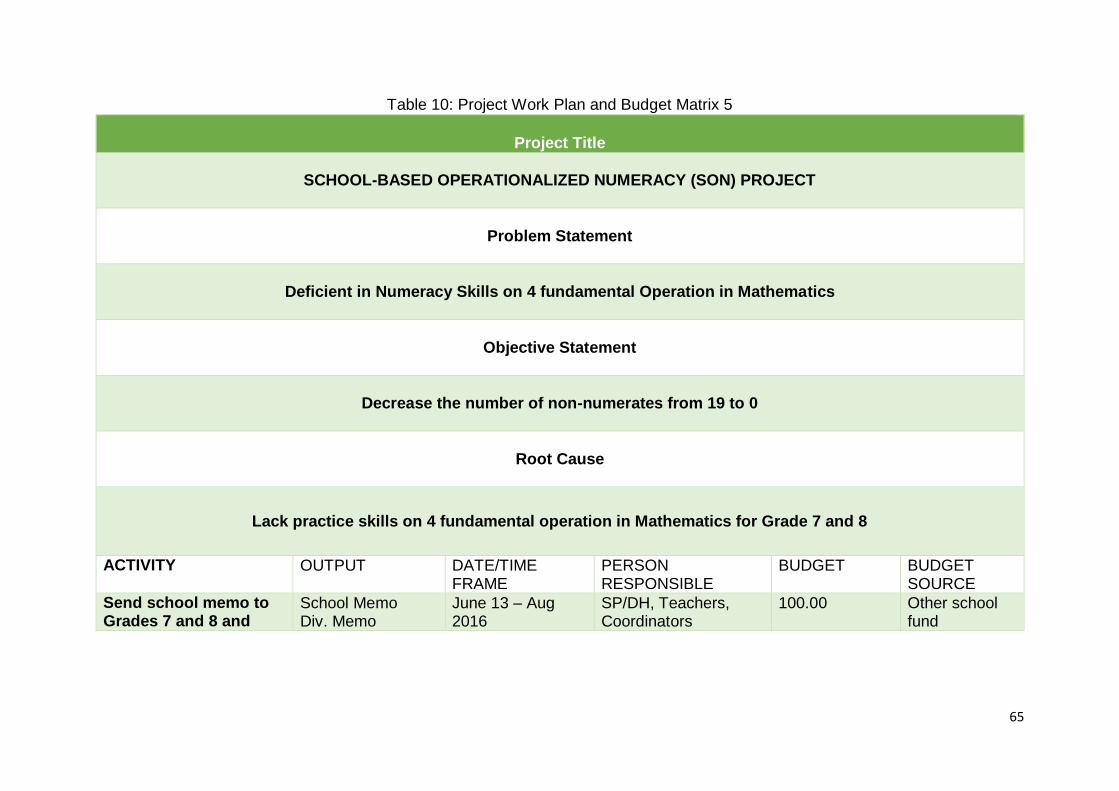
65
Table 10: Project Work Plan and Budget Matrix 5
Project Title
SCHOOL-BASED OPERATIONALIZED NUMERACY (SON) PROJECT
Problem Statement
Deficient in Numeracy Skills on 4 fundamental Operation in Mathematics
Objective Statement
Decrease the number of non-numerates from 19 to 0
Root Cause
Lack practice skills on 4 fundamental operation in Mathematics for Grade 7 and 8
ACTIVITY OUTPUT DATE/TIME FRAME
PERSON RESPONSIBLE
BUDGET BUDGET SOURCE
Send school memo to Grades 7 and 8 and
School Memo Div. Memo
June 13 – Aug 2016
SP/DH, Teachers, Coordinators
100.00 Other school fund
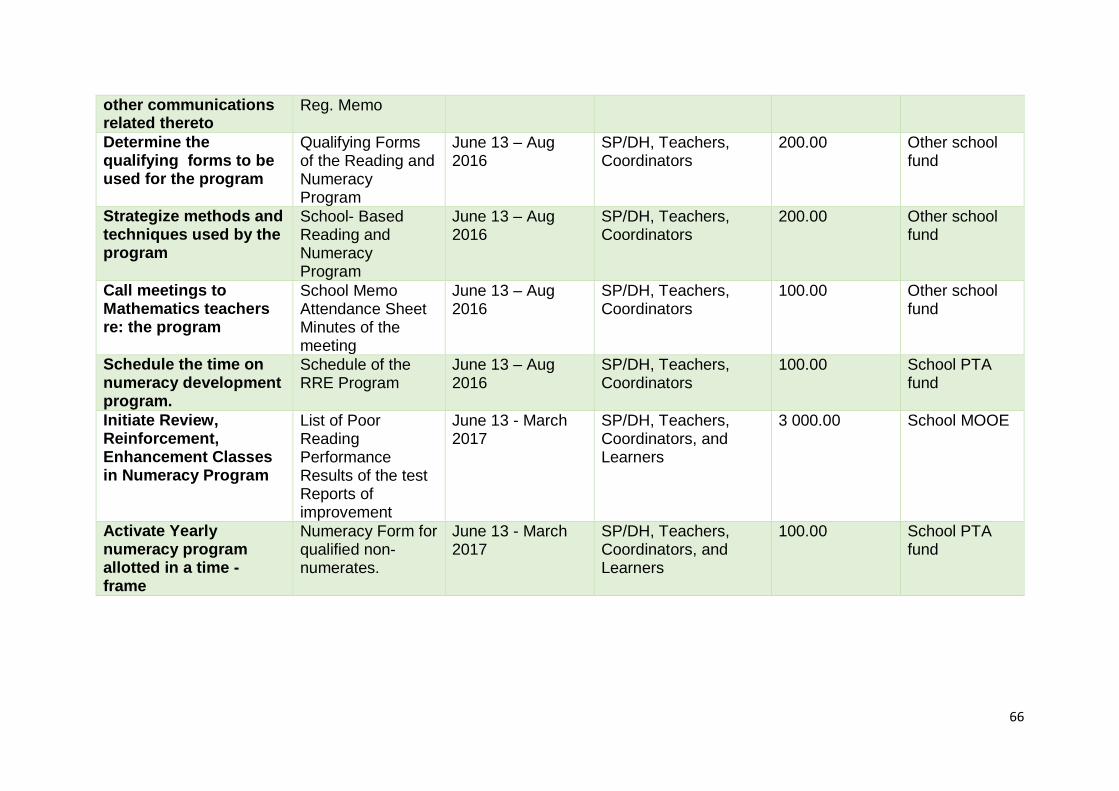
66
other communications related thereto
Reg. Memo
Determine the qualifying forms to be used for the program
Qualifying Forms of the Reading and Numeracy Program
June 13 – Aug 2016
SP/DH, Teachers, Coordinators
200.00 Other school fund
Strategize methods and techniques used by the program
School- Based Reading and Numeracy Program
June 13 – Aug 2016
SP/DH, Teachers, Coordinators
200.00 Other school fund
Call meetings to Mathematics teachers re: the program
School Memo Attendance Sheet Minutes of the meeting
June 13 – Aug 2016
SP/DH, Teachers, Coordinators
100.00 Other school fund
Schedule the time on numeracy development program.
Schedule of the RRE Program
June 13 – Aug 2016
SP/DH, Teachers, Coordinators
100.00 School PTA fund
Initiate Review, Reinforcement, Enhancement Classes in Numeracy Program
List of Poor Reading Performance Results of the test Reports of improvement
June 13 - March 2017
SP/DH, Teachers, Coordinators, and Learners
3 000.00 School MOOE
Activate Yearly numeracy program allotted in a time - frame
Numeracy Form for qualified non-numerates.
June 13 - March 2017
SP/DH, Teachers, Coordinators, and Learners
100.00 School PTA fund
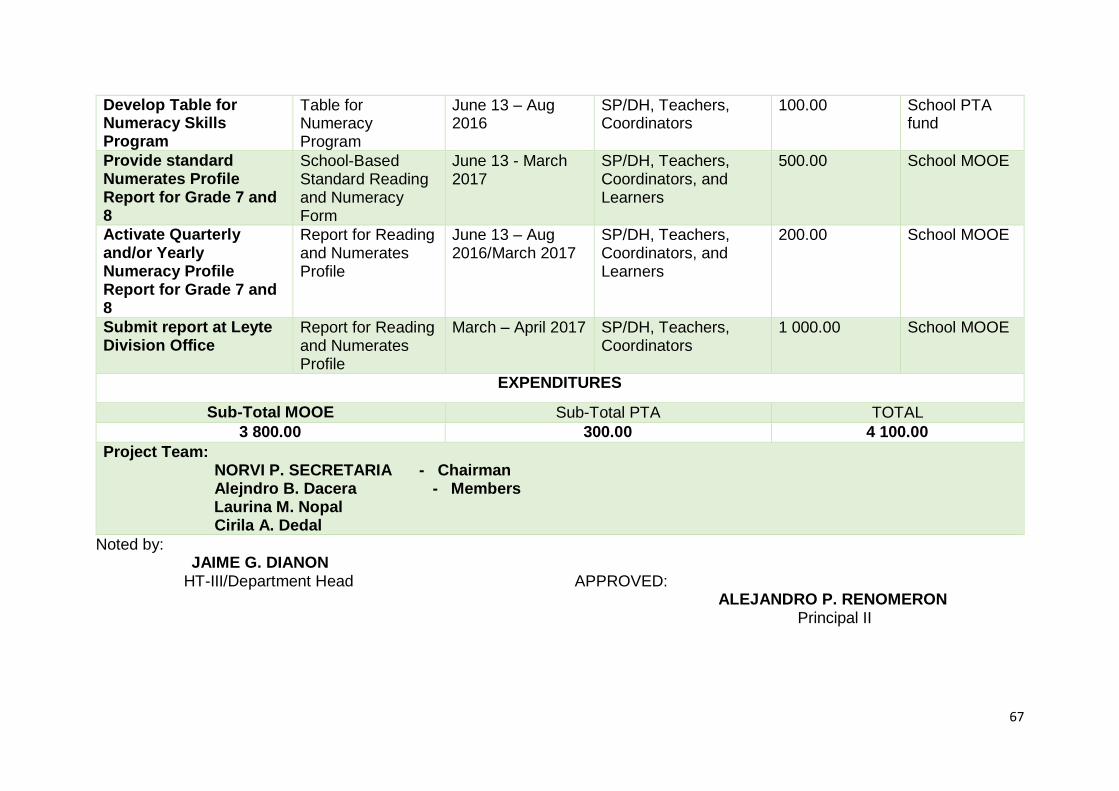
67
Develop Table for Numeracy Skills Program
Table for Numeracy Program
June 13 – Aug 2016
SP/DH, Teachers, Coordinators
100.00 School PTA fund
Provide standard Numerates Profile Report for Grade 7 and 8
School-Based Standard Reading and Numeracy Form
June 13 - March 2017
SP/DH, Teachers, Coordinators, and Learners
500.00 School MOOE
Activate Quarterly and/or Yearly Numeracy Profile Report for Grade 7 and 8
Report for Reading and Numerates Profile
June 13 – Aug 2016/March 2017
SP/DH, Teachers, Coordinators, and Learners
200.00 School MOOE
Submit report at Leyte Division Office
Report for Reading and Numerates Profile
March – April 2017 SP/DH, Teachers, Coordinators
1 000.00 School MOOE
EXPENDITURES
Sub-Total MOOE Sub-Total PTA TOTAL
3 800.00 300.00 4 100.00
Project Team: NORVI P. SECRETARIA - Chairman Alejndro B. Dacera - Members Laurina M. Nopal Cirila A. Dedal
Noted by: JAIME G. DIANON
HT-III/Department Head APPROVED: ALEJANDRO P. RENOMERON Principal II
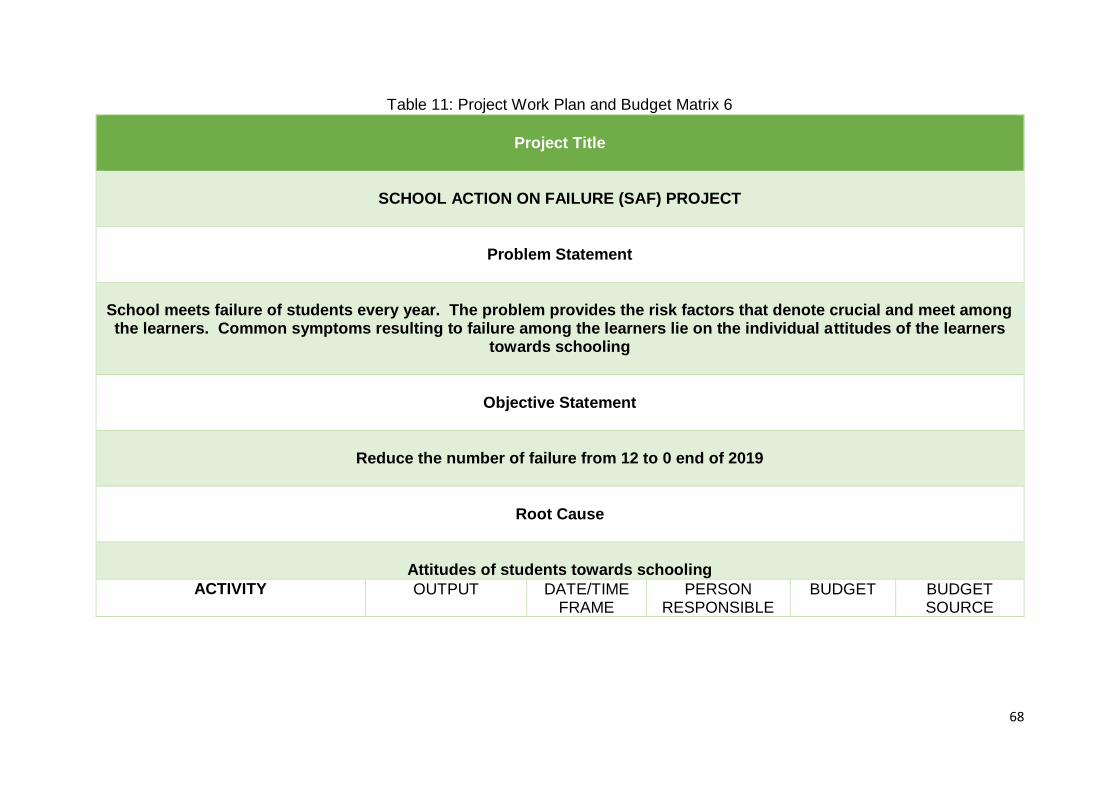
68
Table 11: Project Work Plan and Budget Matrix 6
Project Title
SCHOOL ACTION ON FAILURE (SAF) PROJECT
Problem Statement
School meets failure of students every year. The problem provides the risk factors that denote crucial and meet among the learners. Common symptoms resulting to failure among the learners lie on the individual attitudes of the learners
towards schooling
Objective Statement
Reduce the number of failure from 12 to 0 end of 2019
Root Cause
Attitudes of students towards schooling
ACTIVITY OUTPUT DATE/TIME FRAME
PERSON RESPONSIBLE
BUDGET BUDGET SOURCE
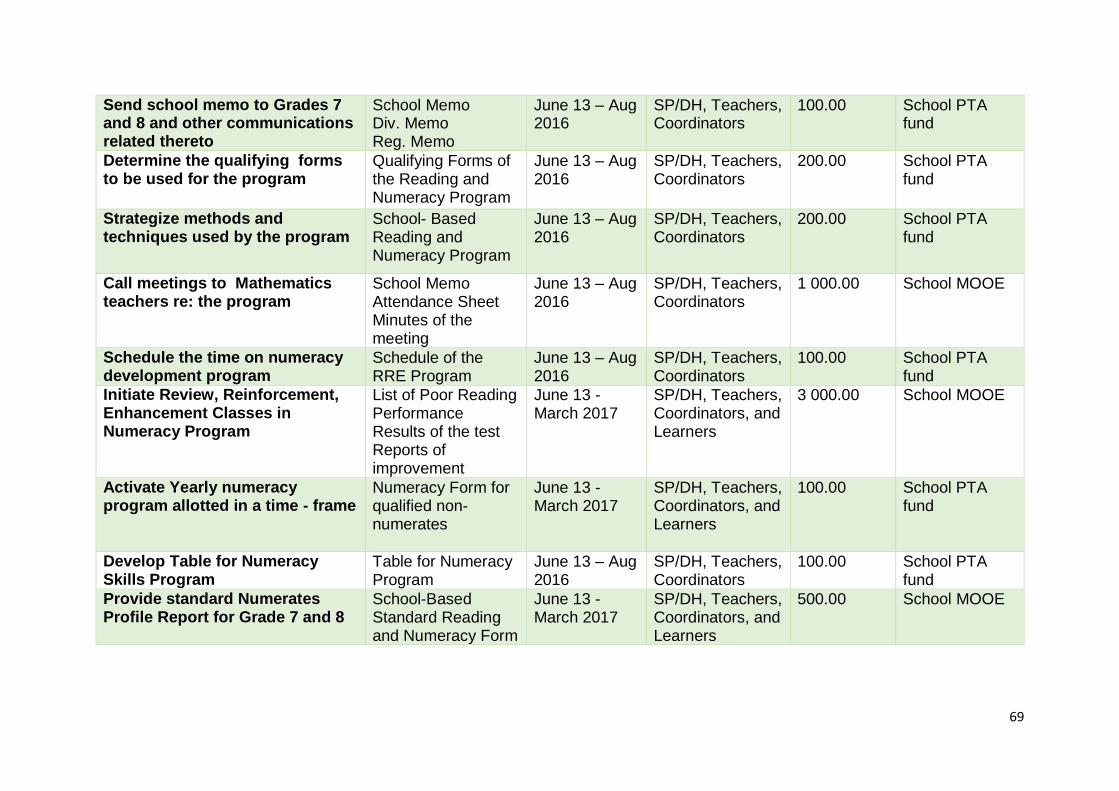
69
Send school memo to Grades 7 and 8 and other communications related thereto
School Memo Div. Memo Reg. Memo
June 13 – Aug 2016
SP/DH, Teachers, Coordinators
100.00 School PTA fund
Determine the qualifying forms to be used for the program
Qualifying Forms of the Reading and Numeracy Program
June 13 – Aug 2016
SP/DH, Teachers, Coordinators
200.00 School PTA fund
Strategize methods and techniques used by the program
School- Based Reading and Numeracy Program
June 13 – Aug 2016
SP/DH, Teachers, Coordinators
200.00 School PTA fund
Call meetings to Mathematics teachers re: the program
School Memo Attendance Sheet Minutes of the meeting
June 13 – Aug 2016
SP/DH, Teachers, Coordinators
1 000.00 School MOOE
Schedule the time on numeracy development program
Schedule of the RRE Program
June 13 – Aug 2016
SP/DH, Teachers, Coordinators
100.00 School PTA fund
Initiate Review, Reinforcement, Enhancement Classes in Numeracy Program
List of Poor Reading Performance Results of the test Reports of improvement
June 13 - March 2017
SP/DH, Teachers, Coordinators, and Learners
3 000.00 School MOOE
Activate Yearly numeracy program allotted in a time - frame
Numeracy Form for qualified non-numerates
June 13 - March 2017
SP/DH, Teachers, Coordinators, and Learners
100.00 School PTA fund
Develop Table for Numeracy Skills Program
Table for Numeracy Program
June 13 – Aug 2016
SP/DH, Teachers, Coordinators
100.00 School PTA fund
Provide standard Numerates Profile Report for Grade 7 and 8
School-Based Standard Reading and Numeracy Form
June 13 - March 2017
SP/DH, Teachers, Coordinators, and Learners
500.00 School MOOE
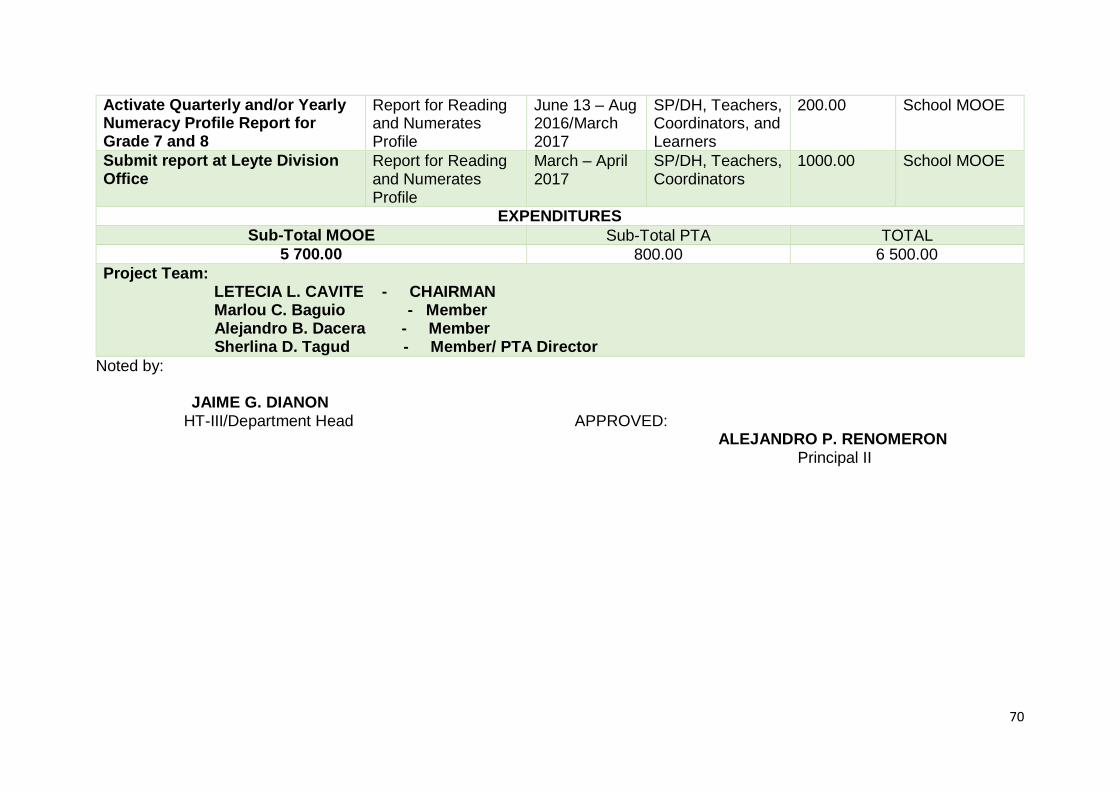
70
Activate Quarterly and/or Yearly Numeracy Profile Report for Grade 7 and 8
Report for Reading and Numerates Profile
June 13 – Aug 2016/March 2017
SP/DH, Teachers, Coordinators, and Learners
200.00 School MOOE
Submit report at Leyte Division Office
Report for Reading and Numerates Profile
March – April 2017
SP/DH, Teachers, Coordinators
1000.00 School MOOE
EXPENDITURES
Sub-Total MOOE Sub-Total PTA TOTAL 5 700.00 800.00 6 500.00
Project Team: LETECIA L. CAVITE - CHAIRMAN Marlou C. Baguio - Member Alejandro B. Dacera - Member Sherlina D. Tagud - Member/ PTA Director
Noted by: JAIME G. DIANON
HT-III/Department Head APPROVED: ALEJANDRO P. RENOMERON Principal II
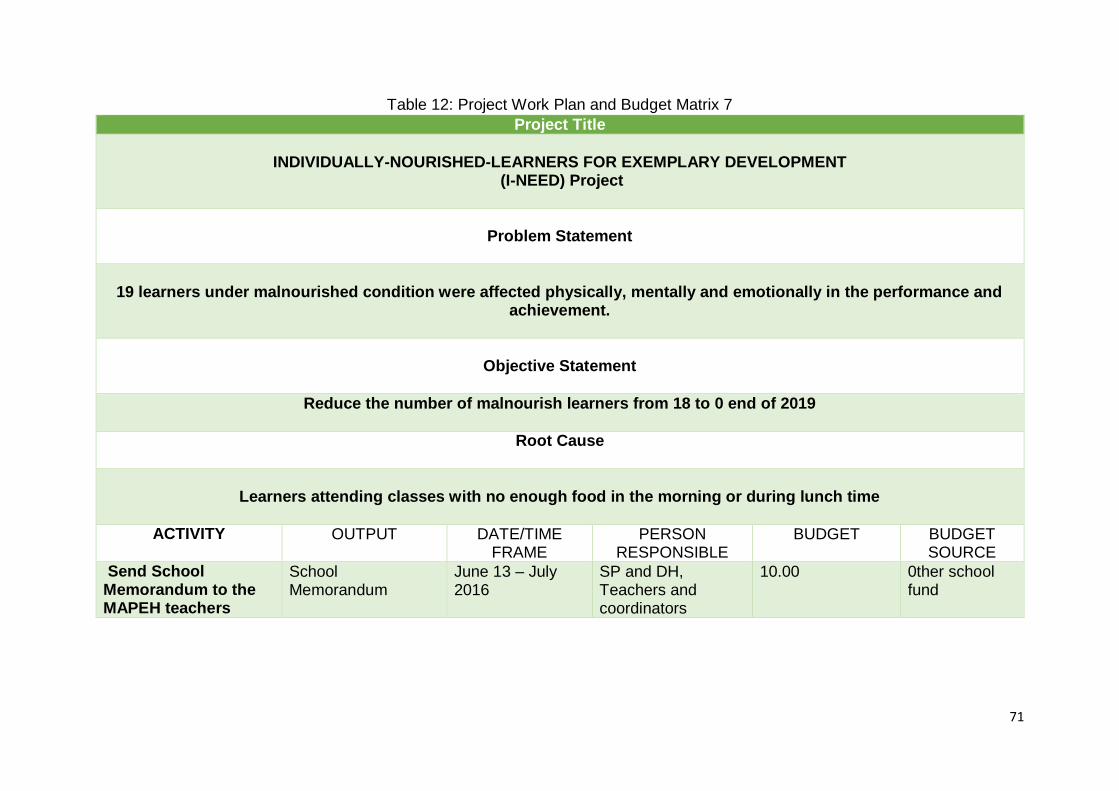
71
Table 12: Project Work Plan and Budget Matrix 7
Project Title
INDIVIDUALLY-NOURISHED-LEARNERS FOR EXEMPLARY DEVELOPMENT
(I-NEED) Project
Problem Statement
19 learners under malnourished condition were affected physically, mentally and emotionally in the performance and
achievement.
Objective Statement
Reduce the number of malnourish learners from 18 to 0 end of 2019
Root Cause
Learners attending classes with no enough food in the morning or during lunch time
ACTIVITY OUTPUT DATE/TIME FRAME
PERSON RESPONSIBLE
BUDGET BUDGET SOURCE
Send School Memorandum to the MAPEH teachers
School Memorandum
June 13 – July 2016
SP and DH, Teachers and coordinators
10.00 0ther school fund
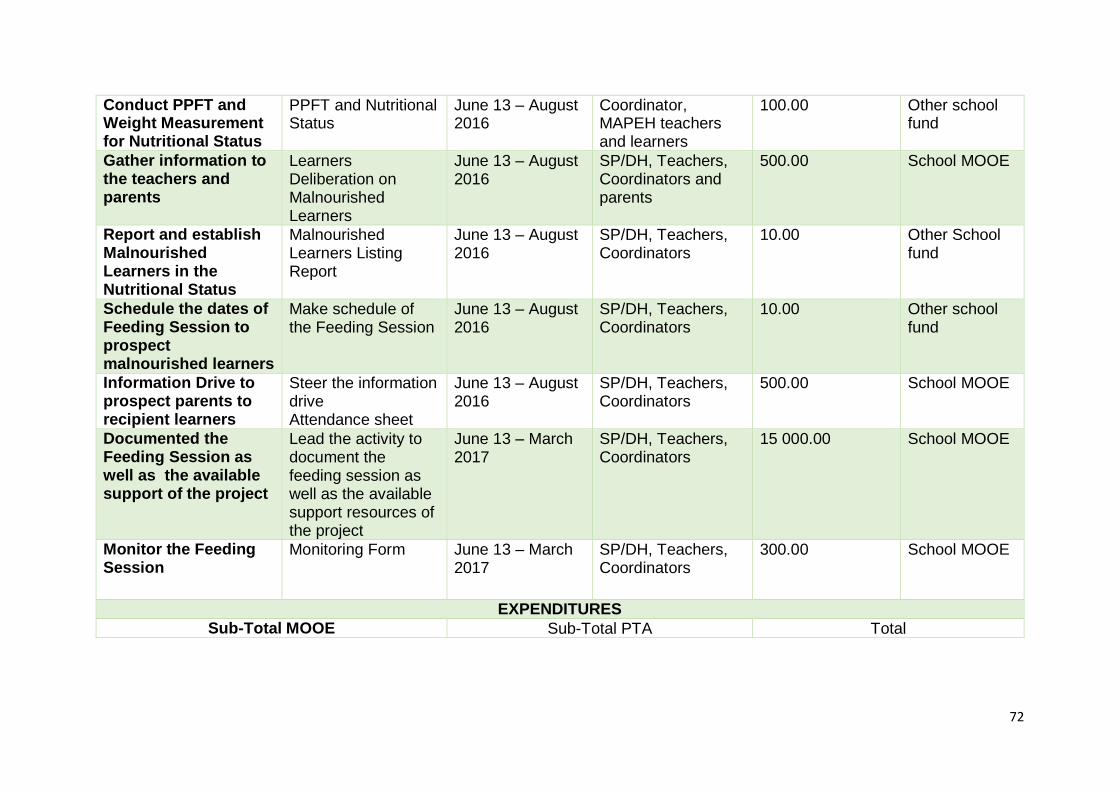
72
Conduct PPFT and Weight Measurement for Nutritional Status
PPFT and Nutritional Status
June 13 – August 2016
Coordinator, MAPEH teachers and learners
100.00 Other school fund
Gather information to the teachers and parents
Learners Deliberation on Malnourished Learners
June 13 – August 2016
SP/DH, Teachers, Coordinators and parents
500.00 School MOOE
Report and establish Malnourished Learners in the Nutritional Status
Malnourished Learners Listing Report
June 13 – August 2016
SP/DH, Teachers, Coordinators
10.00 Other School fund
Schedule the dates of Feeding Session to prospect malnourished learners
Make schedule of the Feeding Session
June 13 – August 2016
SP/DH, Teachers, Coordinators
10.00 Other school fund
Information Drive to prospect parents to recipient learners
Steer the information drive Attendance sheet
June 13 – August 2016
SP/DH, Teachers, Coordinators
500.00 School MOOE
Documented the Feeding Session as well as the available support of the project
Lead the activity to document the feeding session as well as the available support resources of the project
June 13 – March 2017
SP/DH, Teachers, Coordinators
15 000.00 School MOOE
Monitor the Feeding Session
Monitoring Form June 13 – March 2017
SP/DH, Teachers, Coordinators
300.00 School MOOE
EXPENDITURES
Sub-Total MOOE Sub-Total PTA Total
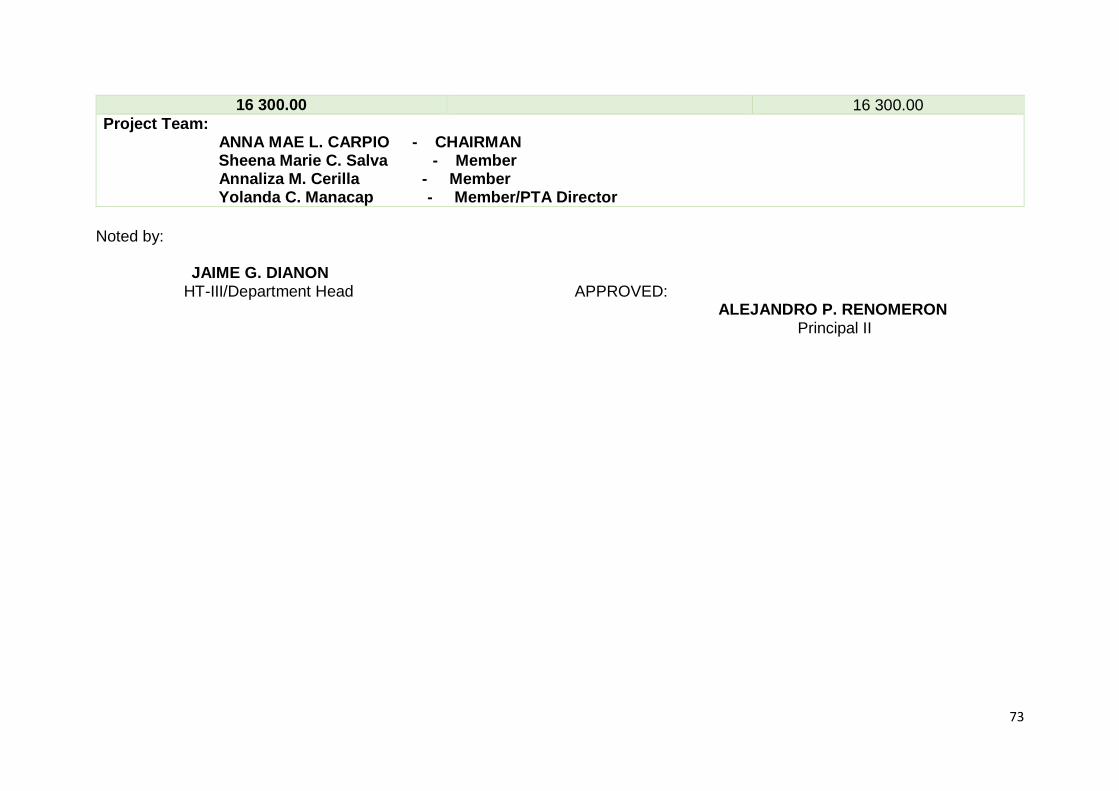
73
Noted by: JAIME G. DIANON
HT-III/Department Head APPROVED: ALEJANDRO P. RENOMERON Principal II
16 300.00 16 300.00 Project Team: ANNA MAE L. CARPIO - CHAIRMAN Sheena Marie C. Salva - Member Annaliza M. Cerilla - Member Yolanda C. Manacap - Member/PTA Director
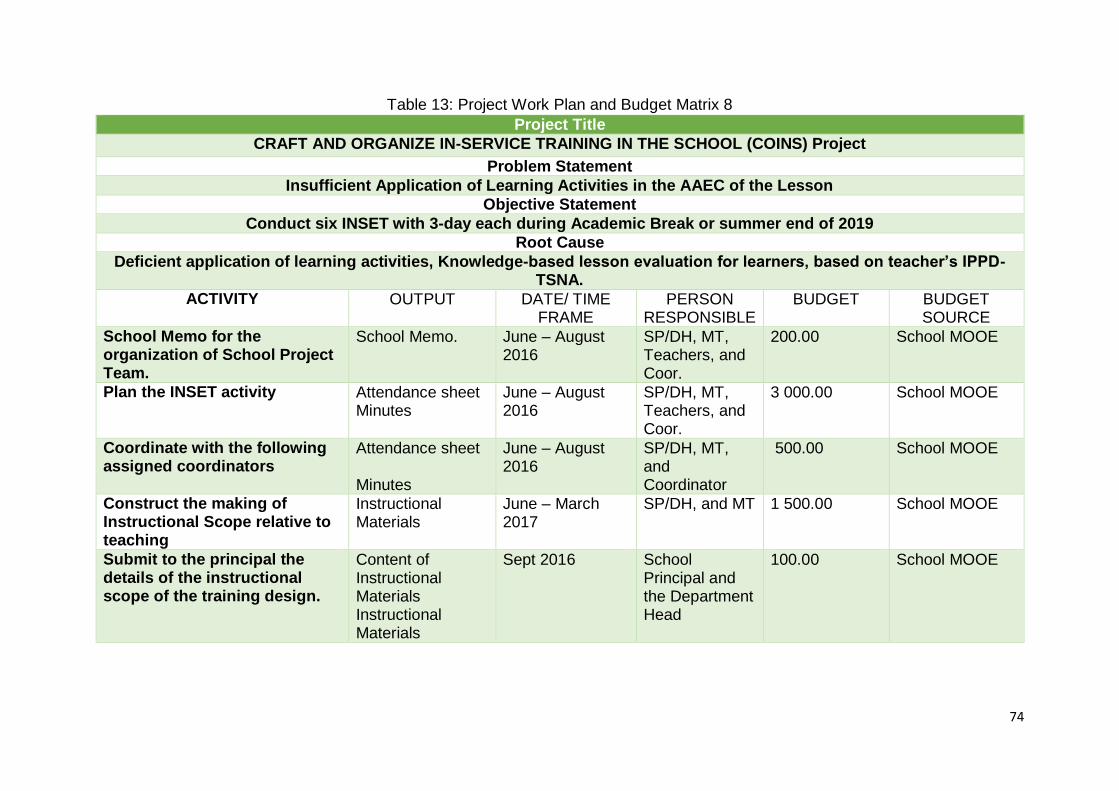
74
Table 13: Project Work Plan and Budget Matrix 8
Project Title
CRAFT AND ORGANIZE IN-SERVICE TRAINING IN THE SCHOOL (COINS) Project
Problem Statement
Insufficient Application of Learning Activities in the AAEC of the Lesson
Objective Statement
Conduct six INSET with 3-day each during Academic Break or summer end of 2019
Root Cause
Deficient application of learning activities, Knowledge-based lesson evaluation for learners, based on teacher’s IPPD-TSNA.
ACTIVITY OUTPUT DATE/ TIME FRAME
PERSON RESPONSIBLE
BUDGET BUDGET SOURCE
School Memo for the organization of School Project Team.
School Memo. June – August 2016
SP/DH, MT, Teachers, and Coor.
200.00 School MOOE
Plan the INSET activity Attendance sheet Minutes
June – August 2016
SP/DH, MT, Teachers, and Coor.
3 000.00 School MOOE
Coordinate with the following assigned coordinators
Attendance sheet Minutes
June – August 2016
SP/DH, MT, and Coordinator
500.00 School MOOE
Construct the making of Instructional Scope relative to teaching
Instructional Materials
June – March 2017
SP/DH, and MT 1 500.00 School MOOE
Submit to the principal the details of the instructional scope of the training design.
Content of Instructional Materials Instructional Materials
Sept 2016 School Principal and the Department Head
100.00 School MOOE
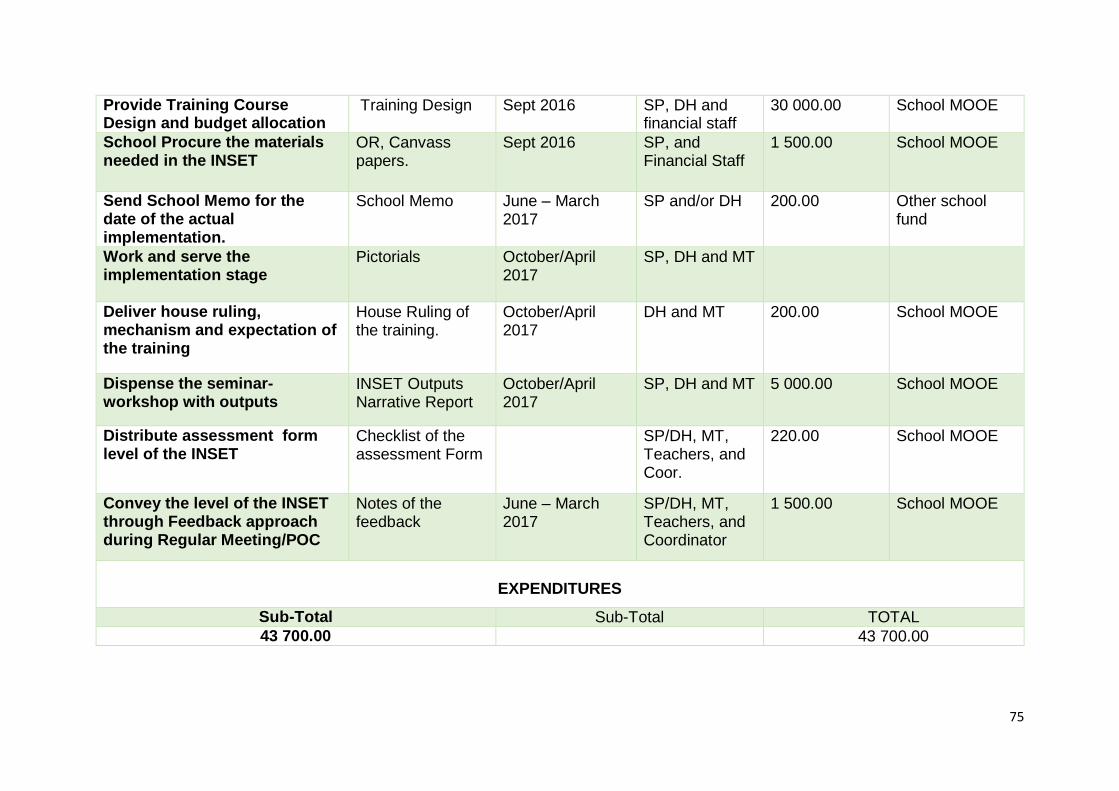
75
Provide Training Course Design and budget allocation
Training Design Sept 2016 SP, DH and financial staff
30 000.00 School MOOE
School Procure the materials needed in the INSET
OR, Canvass papers.
Sept 2016 SP, and Financial Staff
1 500.00 School MOOE
Send School Memo for the date of the actual implementation.
School Memo
June – March 2017
SP and/or DH 200.00 Other school fund
Work and serve the implementation stage
Pictorials October/April 2017
SP, DH and MT
Deliver house ruling, mechanism and expectation of the training
House Ruling of the training.
October/April 2017
DH and MT 200.00 School MOOE
Dispense the seminar-workshop with outputs
INSET Outputs Narrative Report
October/April 2017
SP, DH and MT 5 000.00 School MOOE
Distribute assessment form level of the INSET
Checklist of the assessment Form
SP/DH, MT, Teachers, and Coor.
220.00 School MOOE
Convey the level of the INSET through Feedback approach during Regular Meeting/POC
Notes of the feedback
June – March 2017
SP/DH, MT, Teachers, and Coordinator
1 500.00 School MOOE
EXPENDITURES
Sub-Total Sub-Total TOTAL
43 700.00 43 700.00
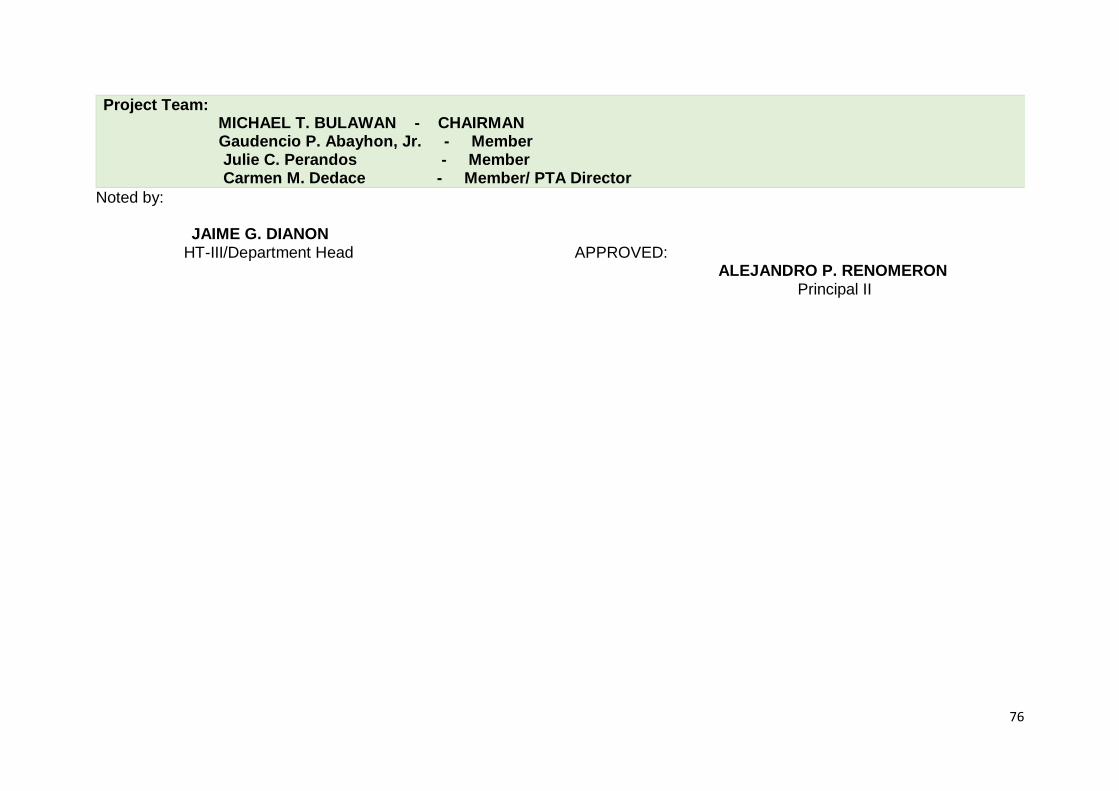
76
Noted by: JAIME G. DIANON
HT-III/Department Head APPROVED: ALEJANDRO P. RENOMERON Principal II
Project Team: MICHAEL T. BULAWAN - CHAIRMAN Gaudencio P. Abayhon, Jr. - Member Julie C. Perandos - Member Carmen M. Dedace - Member/ PTA Director
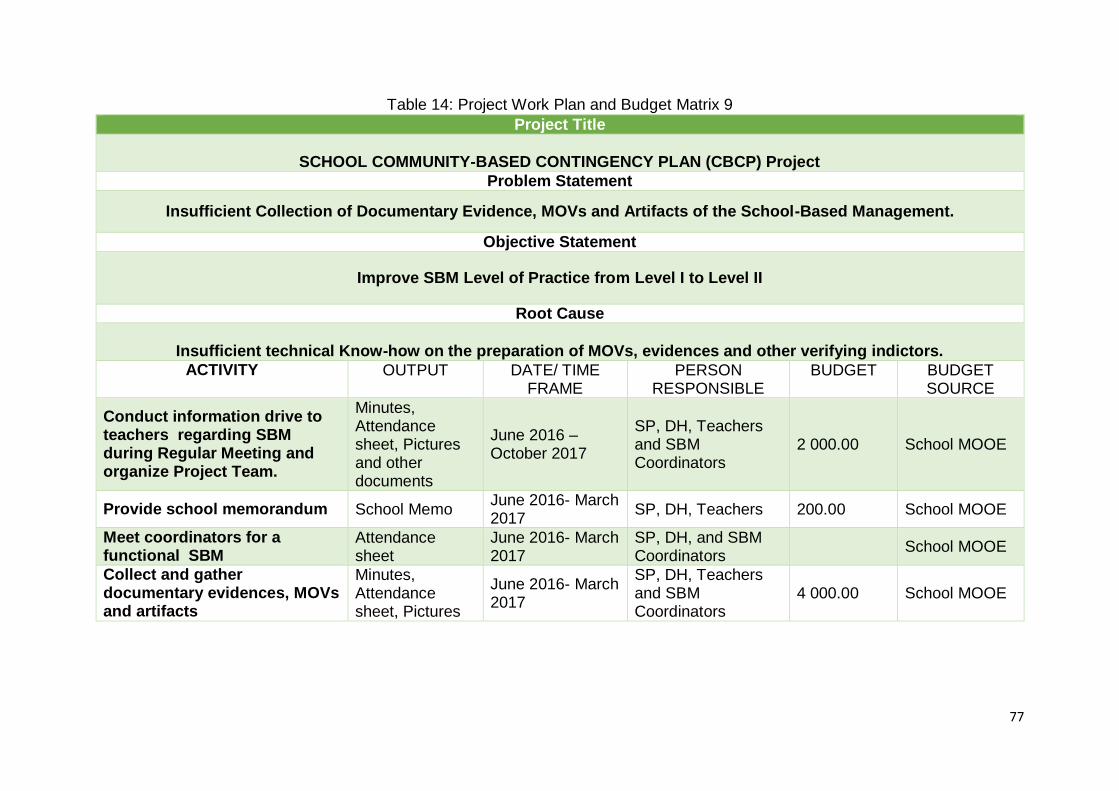
77
Table 14: Project Work Plan and Budget Matrix 9
Project Title
SCHOOL COMMUNITY-BASED CONTINGENCY PLAN (CBCP) Project
Problem Statement
Insufficient Collection of Documentary Evidence, MOVs and Artifacts of the School-Based Management.
Objective Statement
Improve SBM Level of Practice from Level I to Level II
Root Cause
Insufficient technical Know-how on the preparation of MOVs, evidences and other verifying indictors.
ACTIVITY OUTPUT DATE/ TIME FRAME
PERSON RESPONSIBLE
BUDGET BUDGET SOURCE
Conduct information drive to teachers regarding SBM during Regular Meeting and organize Project Team.
Minutes, Attendance sheet, Pictures and other documents
June 2016 – October 2017
SP, DH, Teachers and SBM Coordinators
2 000.00 School MOOE
Provide school memorandum School Memo June 2016- March 2017
SP, DH, Teachers 200.00 School MOOE
Meet coordinators for a functional SBM
Attendance sheet
June 2016- March 2017
SP, DH, and SBM Coordinators
School MOOE
Collect and gather documentary evidences, MOVs and artifacts
Minutes, Attendance sheet, Pictures
June 2016- March 2017
SP, DH, Teachers and SBM Coordinators
4 000.00 School MOOE
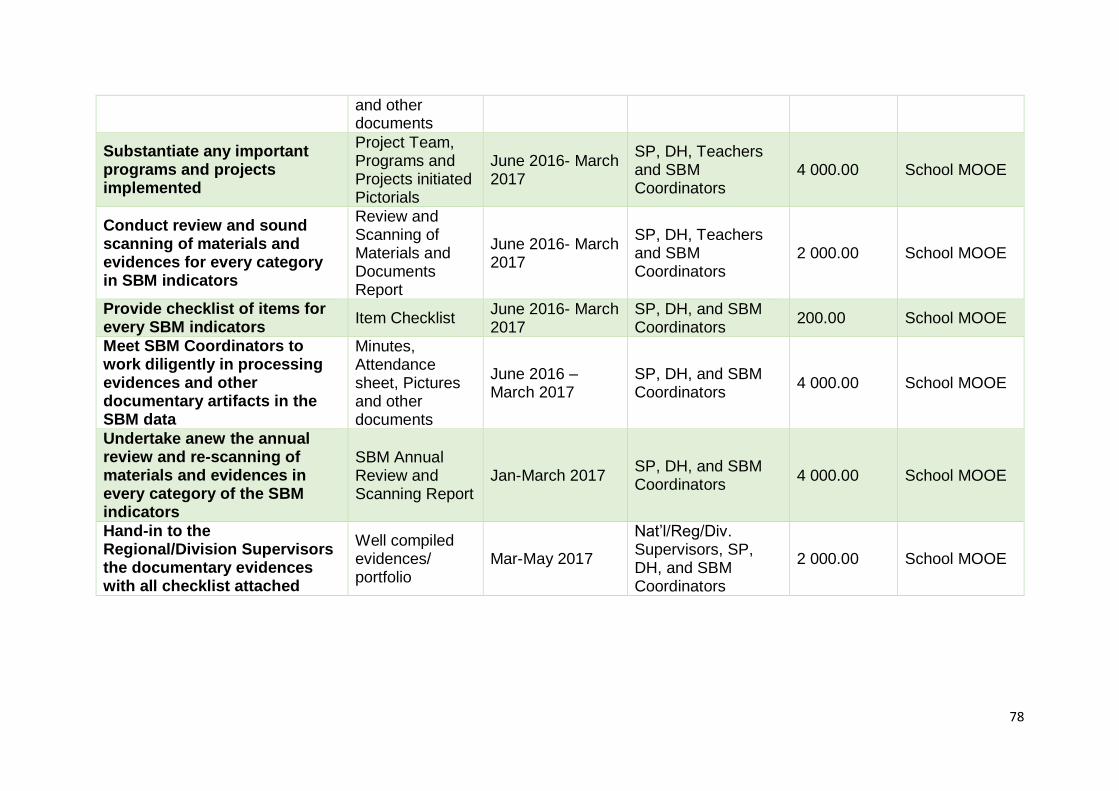
78
and other documents
Substantiate any important programs and projects implemented
Project Team, Programs and Projects initiated Pictorials
June 2016- March 2017
SP, DH, Teachers and SBM Coordinators
4 000.00 School MOOE
Conduct review and sound scanning of materials and evidences for every category in SBM indicators
Review and Scanning of Materials and Documents Report
June 2016- March 2017
SP, DH, Teachers and SBM Coordinators
2 000.00 School MOOE
Provide checklist of items for every SBM indicators
Item Checklist June 2016- March 2017
SP, DH, and SBM Coordinators
200.00 School MOOE
Meet SBM Coordinators to work diligently in processing evidences and other documentary artifacts in the SBM data
Minutes, Attendance sheet, Pictures and other documents
June 2016 – March 2017
SP, DH, and SBM Coordinators
4 000.00 School MOOE
Undertake anew the annual review and re-scanning of materials and evidences in every category of the SBM indicators
SBM Annual Review and Scanning Report
Jan-March 2017 SP, DH, and SBM Coordinators
4 000.00 School MOOE
Hand-in to the Regional/Division Supervisors the documentary evidences with all checklist attached
Well compiled evidences/ portfolio
Mar-May 2017
Nat’l/Reg/Div. Supervisors, SP, DH, and SBM Coordinators
2 000.00 School MOOE
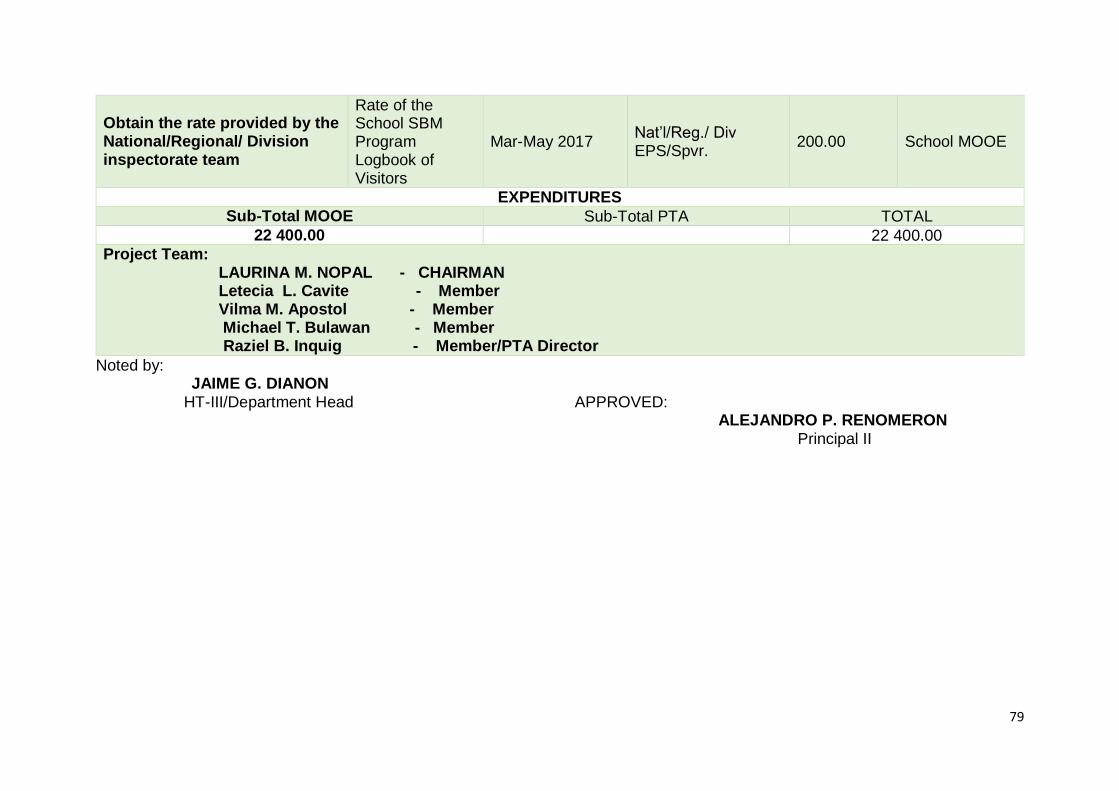
79
Obtain the rate provided by the National/Regional/ Division inspectorate team
Rate of the School SBM Program Logbook of Visitors
Mar-May 2017 Nat’l/Reg./ Div EPS/Spvr.
200.00 School MOOE
EXPENDITURES
Sub-Total MOOE Sub-Total PTA TOTAL
22 400.00 22 400.00 Project Team: LAURINA M. NOPAL - CHAIRMAN Letecia L. Cavite - Member Vilma M. Apostol - Member Michael T. Bulawan - Member Raziel B. Inquig - Member/PTA Director
Noted by: JAIME G. DIANON
HT-III/Department Head APPROVED: ALEJANDRO P. RENOMERON Principal II
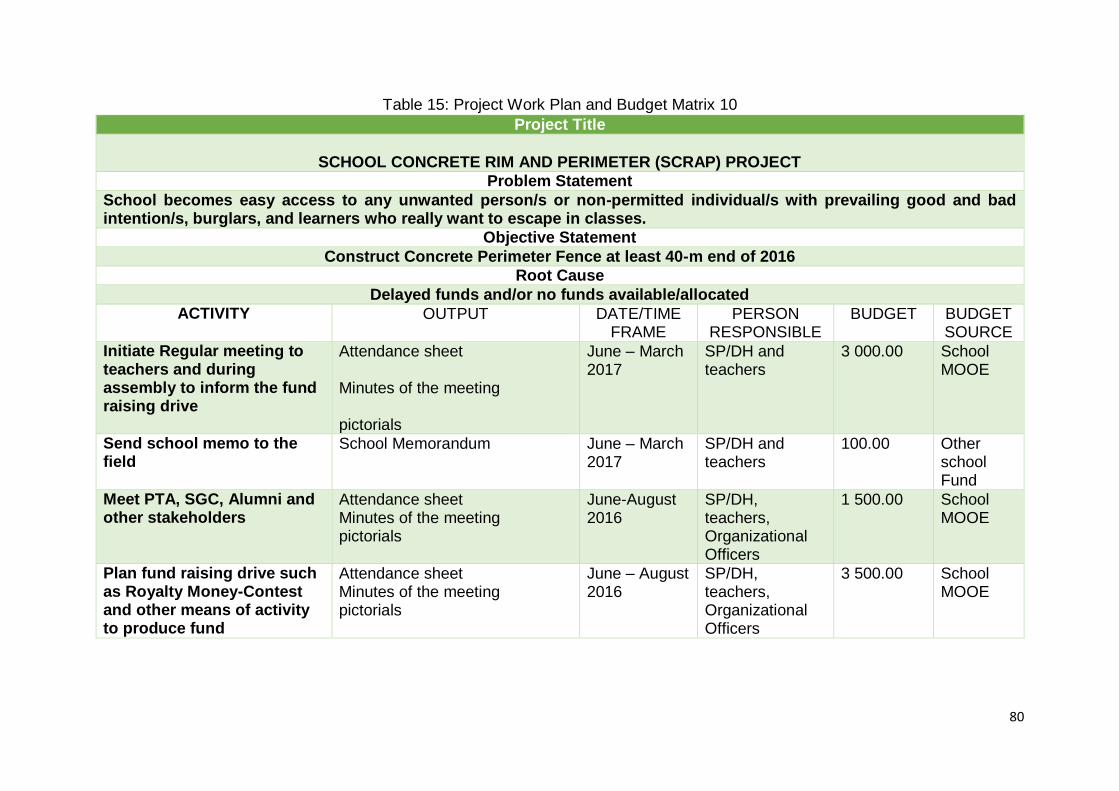
80
Table 15: Project Work Plan and Budget Matrix 10
Project Title
SCHOOL CONCRETE RIM AND PERIMETER (SCRAP) PROJECT
Problem Statement
School becomes easy access to any unwanted person/s or non-permitted individual/s with prevailing good and bad intention/s, burglars, and learners who really want to escape in classes.
Objective Statement
Construct Concrete Perimeter Fence at least 40-m end of 2016
Root Cause
Delayed funds and/or no funds available/allocated
ACTIVITY OUTPUT DATE/TIME FRAME
PERSON RESPONSIBLE
BUDGET BUDGET SOURCE
Initiate Regular meeting to teachers and during assembly to inform the fund raising drive
Attendance sheet Minutes of the meeting pictorials
June – March 2017
SP/DH and teachers
3 000.00 School MOOE
Send school memo to the field
School Memorandum June – March 2017
SP/DH and teachers
100.00 Other school Fund
Meet PTA, SGC, Alumni and other stakeholders
Attendance sheet Minutes of the meeting pictorials
June-August 2016
SP/DH, teachers, Organizational Officers
1 500.00 School MOOE
Plan fund raising drive such as Royalty Money-Contest and other means of activity to produce fund
Attendance sheet Minutes of the meeting pictorials
June – August 2016
SP/DH, teachers, Organizational Officers
3 500.00 School MOOE
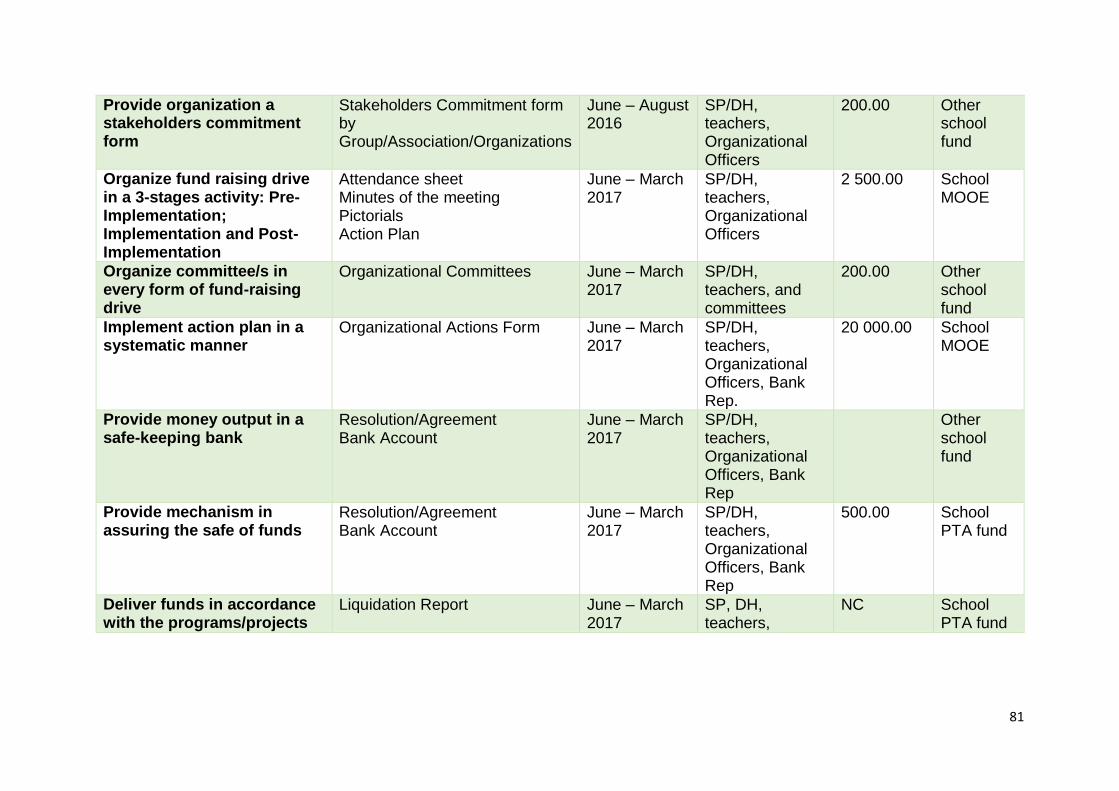
81
Provide organization a stakeholders commitment form
Stakeholders Commitment form by Group/Association/Organizations
June – August 2016
SP/DH, teachers, Organizational Officers
200.00 Other school fund
Organize fund raising drive in a 3-stages activity: Pre-Implementation; Implementation and Post-Implementation
Attendance sheet Minutes of the meeting Pictorials Action Plan
June – March 2017
SP/DH, teachers, Organizational Officers
2 500.00 School MOOE
Organize committee/s in every form of fund-raising drive
Organizational Committees June – March 2017
SP/DH, teachers, and committees
200.00 Other school fund
Implement action plan in a systematic manner
Organizational Actions Form June – March 2017
SP/DH, teachers, Organizational Officers, Bank Rep.
20 000.00 School MOOE
Provide money output in a safe-keeping bank
Resolution/Agreement Bank Account
June – March 2017
SP/DH, teachers, Organizational Officers, Bank Rep
Other school fund
Provide mechanism in assuring the safe of funds
Resolution/Agreement Bank Account
June – March 2017
SP/DH, teachers, Organizational Officers, Bank Rep
500.00 School PTA fund
Deliver funds in accordance with the programs/projects
Liquidation Report June – March 2017
SP, DH, teachers,
NC School PTA fund
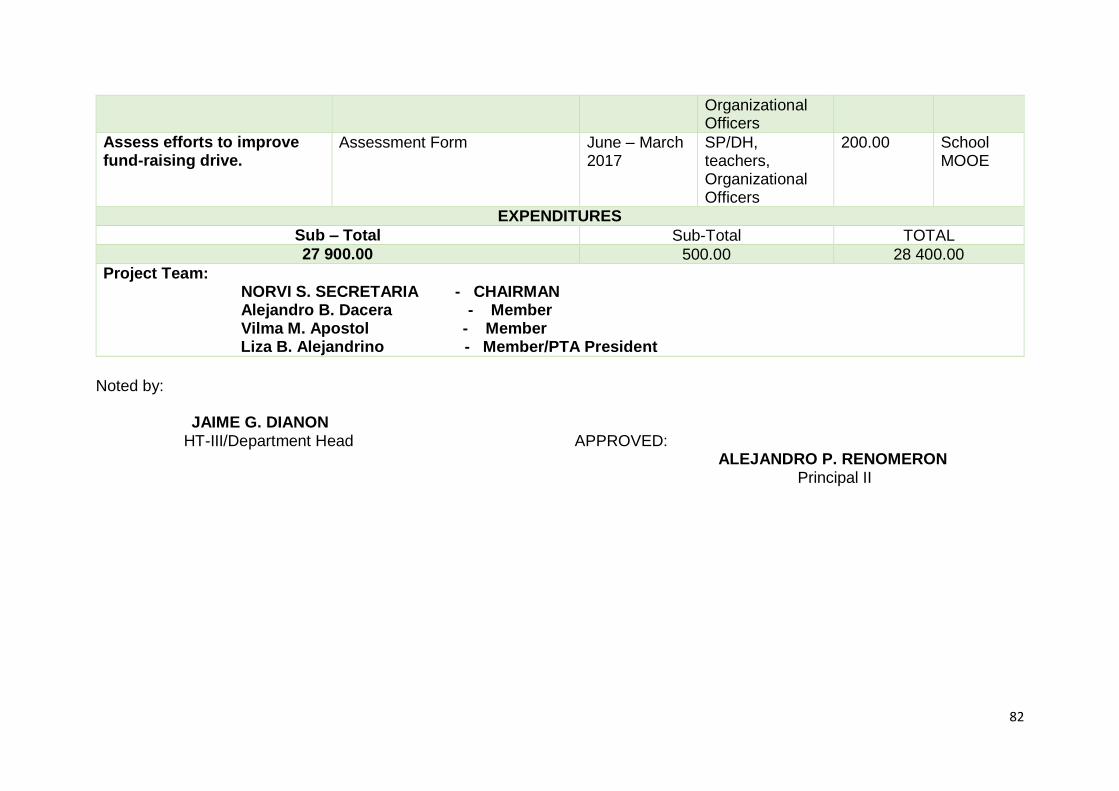
82
Noted by: JAIME G. DIANON
HT-III/Department Head APPROVED: ALEJANDRO P. RENOMERON Principal II
Organizational Officers
Assess efforts to improve fund-raising drive.
Assessment Form June – March 2017
SP/DH, teachers, Organizational Officers
200.00 School MOOE
EXPENDITURES
Sub – Total Sub-Total TOTAL 27 900.00 500.00 28 400.00
Project Team: NORVI S. SECRETARIA - CHAIRMAN Alejandro B. Dacera - Member Vilma M. Apostol - Member Liza B. Alejandrino - Member/PTA President
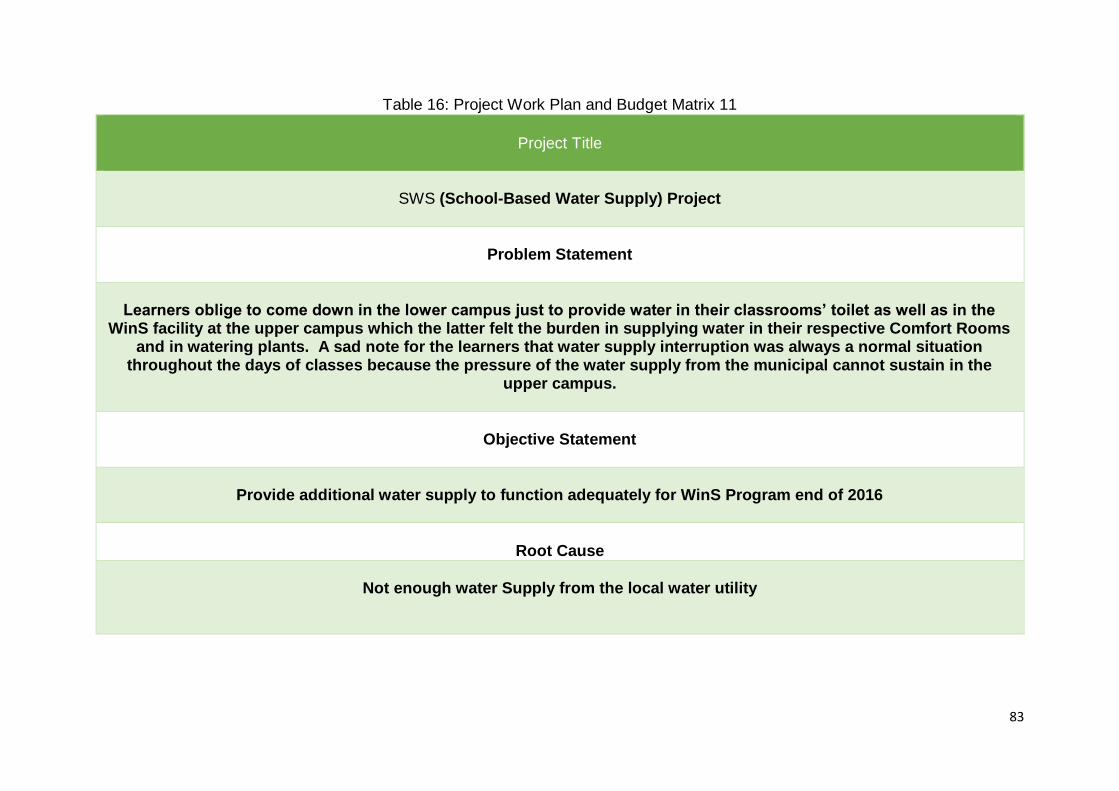
83
Table 16: Project Work Plan and Budget Matrix 11
Project Title
SWS (School-Based Water Supply) Project
Problem Statement
Learners oblige to come down in the lower campus just to provide water in their classrooms’ toilet as well as in the
WinS facility at the upper campus which the latter felt the burden in supplying water in their respective Comfort Rooms and in watering plants. A sad note for the learners that water supply interruption was always a normal situation
throughout the days of classes because the pressure of the water supply from the municipal cannot sustain in the upper campus.
Objective Statement
Provide additional water supply to function adequately for WinS Program end of 2016
Root Cause
Not enough water Supply from the local water utility
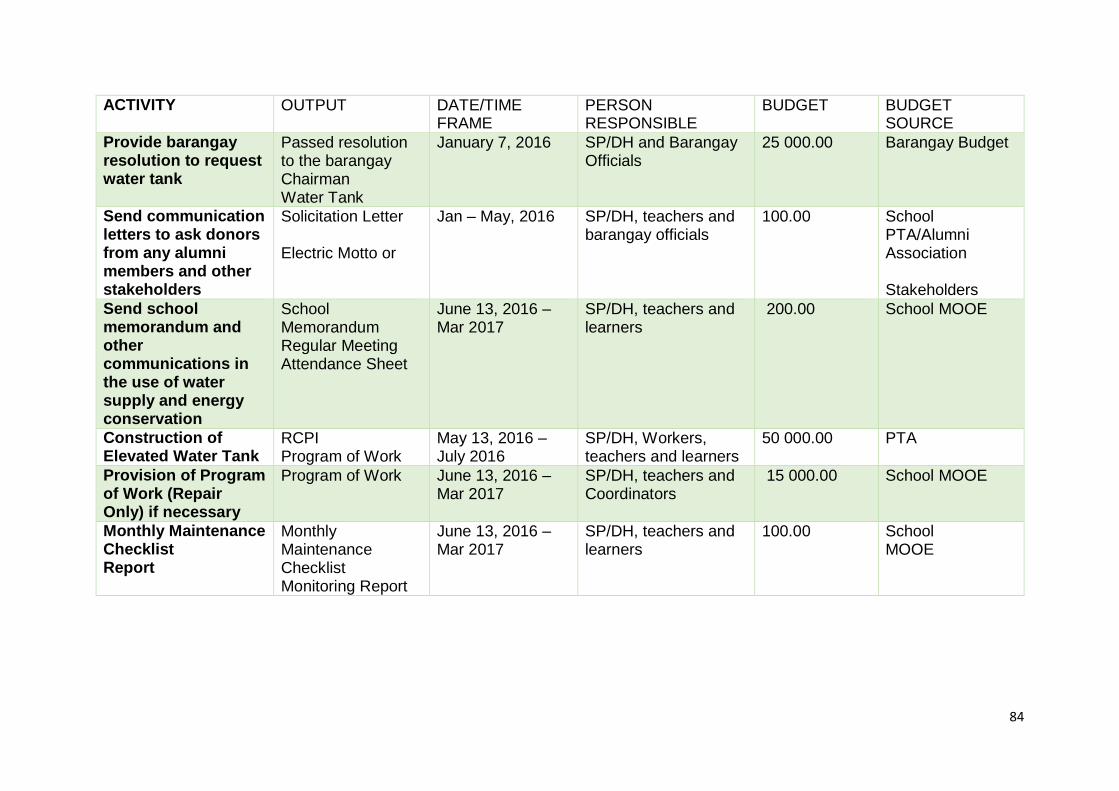
84
ACTIVITY OUTPUT DATE/TIME FRAME
PERSON RESPONSIBLE
BUDGET BUDGET SOURCE
Provide barangay resolution to request water tank
Passed resolution to the barangay Chairman Water Tank
January 7, 2016 SP/DH and Barangay Officials
25 000.00 Barangay Budget
Send communication letters to ask donors from any alumni members and other stakeholders
Solicitation Letter Electric Motto or
Jan – May, 2016 SP/DH, teachers and barangay officials
100.00 School PTA/Alumni Association Stakeholders
Send school memorandum and other communications in the use of water supply and energy conservation
School Memorandum Regular Meeting Attendance Sheet
June 13, 2016 – Mar 2017
SP/DH, teachers and learners
200.00 School MOOE
Construction of Elevated Water Tank
RCPI Program of Work
May 13, 2016 – July 2016
SP/DH, Workers, teachers and learners
50 000.00 PTA
Provision of Program of Work (Repair Only) if necessary
Program of Work June 13, 2016 – Mar 2017
SP/DH, teachers and Coordinators
15 000.00 School MOOE
Monthly Maintenance Checklist Report
Monthly Maintenance Checklist Monitoring Report
June 13, 2016 – Mar 2017
SP/DH, teachers and learners
100.00 School MOOE
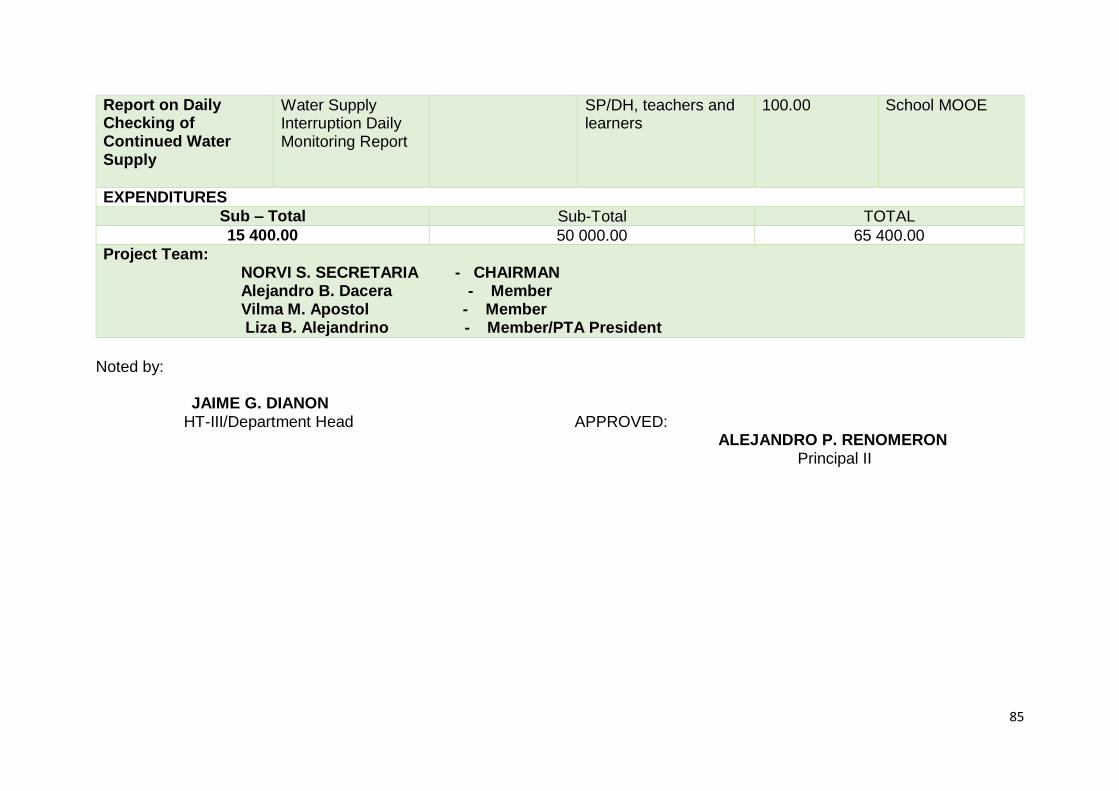
85
Report on Daily Checking of Continued Water Supply
Water Supply Interruption Daily Monitoring Report
SP/DH, teachers and learners
100.00 School MOOE
EXPENDITURES
Sub – Total Sub-Total TOTAL
15 400.00 50 000.00 65 400.00 Project Team: NORVI S. SECRETARIA - CHAIRMAN Alejandro B. Dacera - Member Vilma M. Apostol - Member Liza B. Alejandrino - Member/PTA President
Noted by: JAIME G. DIANON
HT-III/Department Head APPROVED: ALEJANDRO P. RENOMERON Principal II
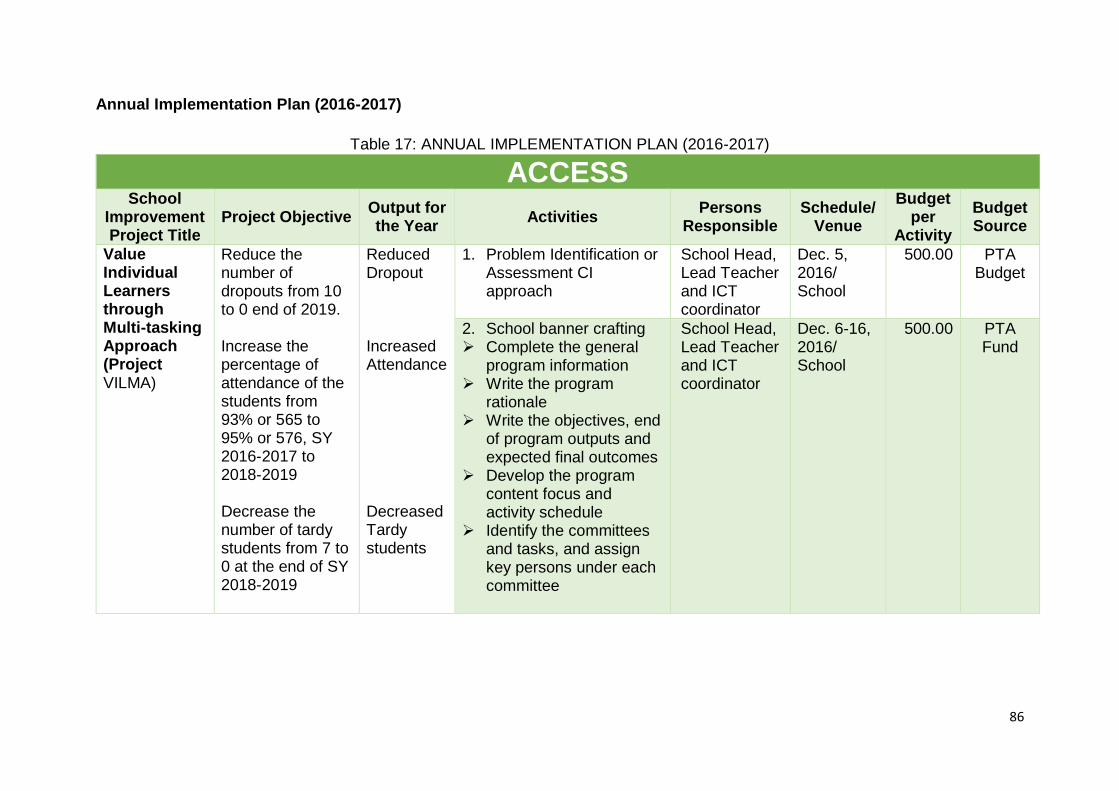
86
Annual Implementation Plan (2016-2017)
Table 17: ANNUAL IMPLEMENTATION PLAN (2016-2017)
ACCESS School
Improvement Project Title
Project Objective Output for the Year
Activities Persons
Responsible Schedule/
Venue
Budget per
Activity
Budget Source
Value Individual Learners through Multi-tasking Approach (Project VILMA)
Reduce the number of dropouts from 10 to 0 end of 2019. Increase the percentage of attendance of the students from 93% or 565 to 95% or 576, SY 2016-2017 to 2018-2019 Decrease the number of tardy students from 7 to 0 at the end of SY 2018-2019
Reduced Dropout Increased Attendance Decreased Tardy students
1. Problem Identification or Assessment CI approach
School Head, Lead Teacher and ICT coordinator
Dec. 5, 2016/ School
500.00 PTA Budget
2. School banner crafting Complete the general
program information Write the program
rationale Write the objectives, end
of program outputs and expected final outcomes
Develop the program content focus and activity schedule
Identify the committees and tasks, and assign key persons under each committee
School Head, Lead Teacher and ICT coordinator
Dec. 6-16, 2016/ School
500.00 PTA Fund
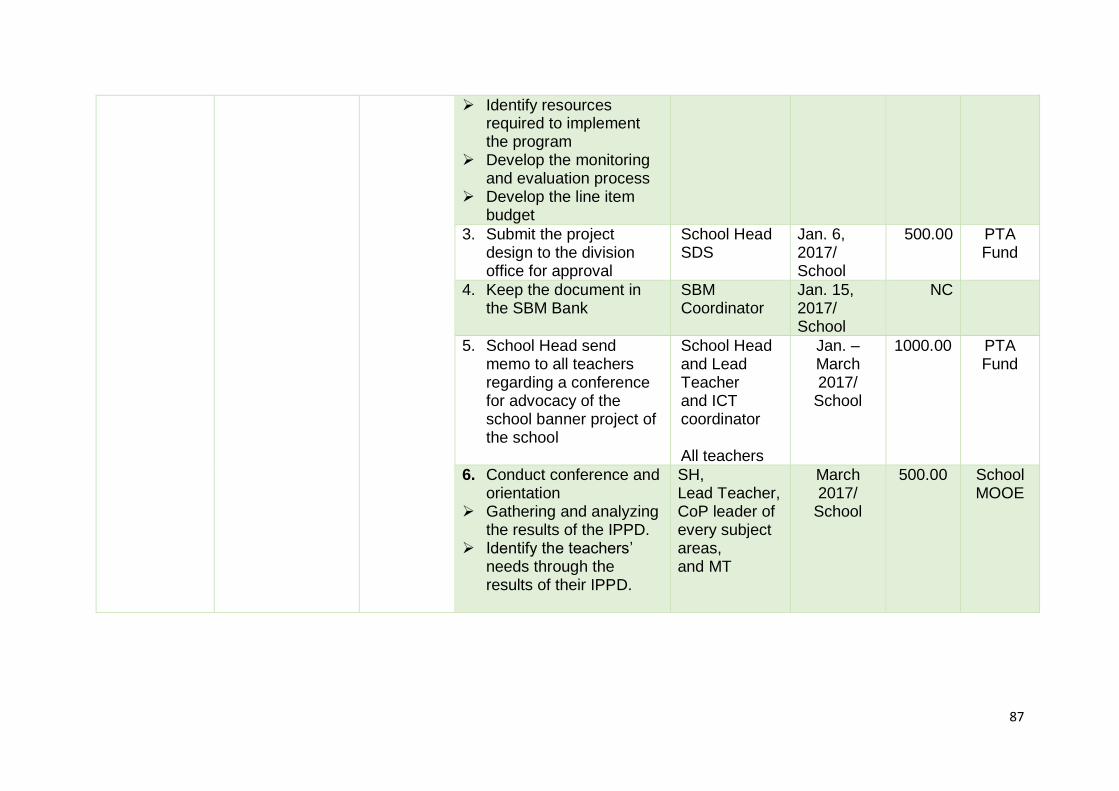
87
Identify resources required to implement the program
Develop the monitoring and evaluation process
Develop the line item budget
3. Submit the project design to the division office for approval
School Head SDS
Jan. 6, 2017/ School
500.00 PTA Fund
4. Keep the document in the SBM Bank
SBM Coordinator
Jan. 15, 2017/ School
NC
5. School Head send memo to all teachers regarding a conference for advocacy of the school banner project of the school
School Head and Lead Teacher and ICT coordinator All teachers
Jan. – March 2017/
School
1000.00 PTA Fund
6. Conduct conference and orientation
Gathering and analyzing the results of the IPPD.
Identify the teachers’ needs through the results of their IPPD.
SH, Lead Teacher, CoP leader of every subject areas, and MT
March 2017/
School
500.00 School MOOE
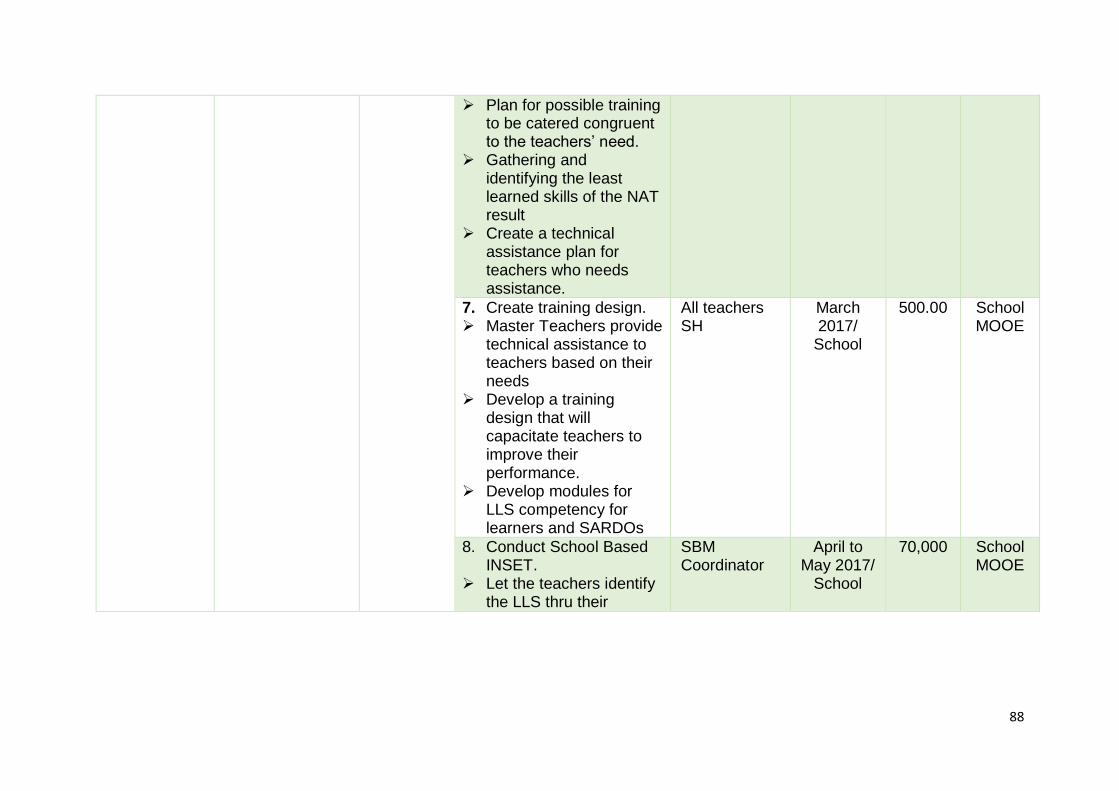
88
Plan for possible training to be catered congruent to the teachers’ need.
Gathering and identifying the least learned skills of the NAT result
Create a technical assistance plan for teachers who needs assistance.
7. Create training design. Master Teachers provide
technical assistance to teachers based on their needs
Develop a training design that will capacitate teachers to improve their performance.
Develop modules for LLS competency for learners and SARDOs
All teachers SH
March 2017/
School
500.00
School MOOE
8. Conduct School Based INSET.
Let the teachers identify the LLS thru their
SBM Coordinator
April to May 2017/
School
70,000
School MOOE
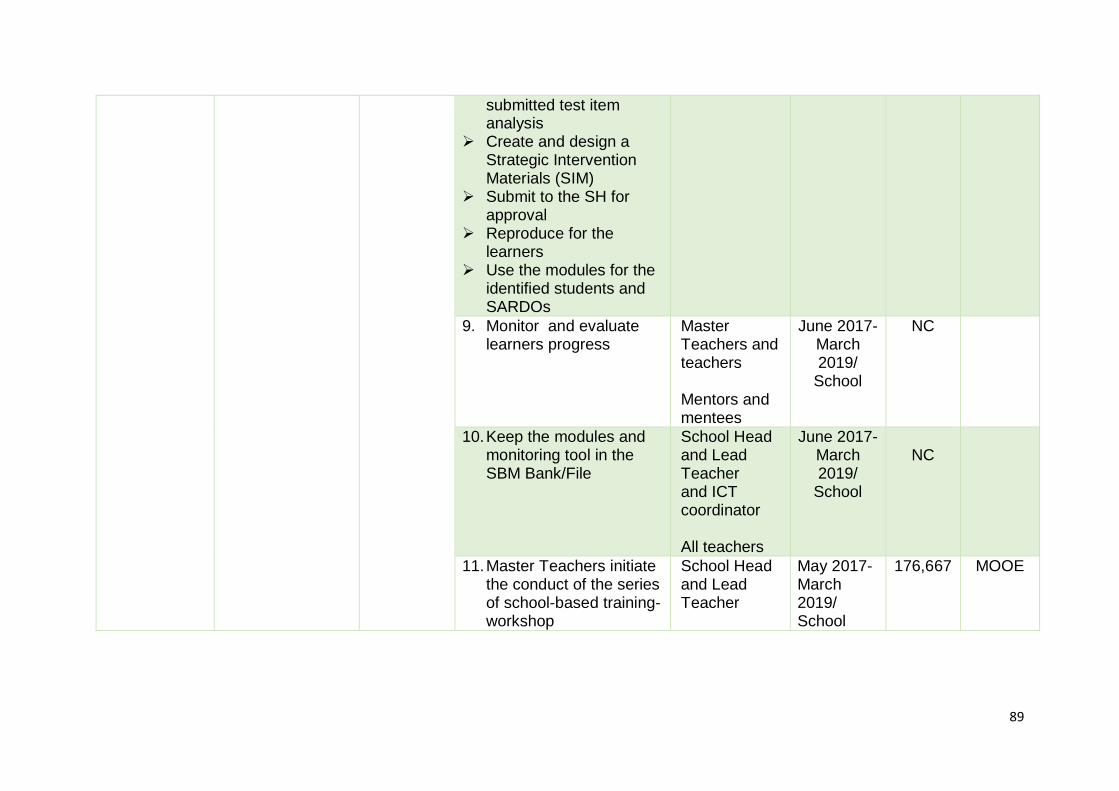
89
submitted test item analysis
Create and design a Strategic Intervention Materials (SIM)
Submit to the SH for approval
Reproduce for the learners
Use the modules for the identified students and SARDOs
9. Monitor and evaluate learners progress
Master Teachers and teachers Mentors and mentees
June 2017-March 2019/
School
NC
10. Keep the modules and monitoring tool in the SBM Bank/File
School Head and Lead Teacher and ICT coordinator All teachers
June 2017-March 2019/
School
NC
11. Master Teachers initiate the conduct of the series of school-based training-workshop
School Head and Lead Teacher
May 2017-March 2019/ School
176,667 MOOE
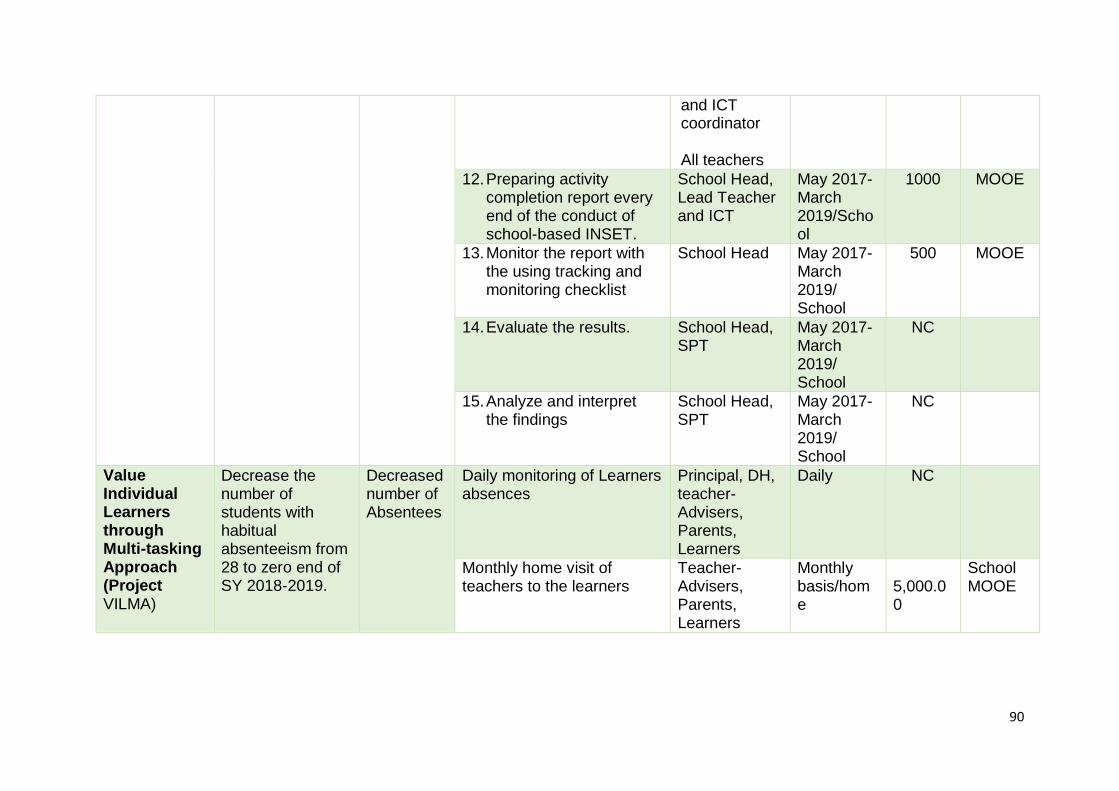
90
and ICT coordinator All teachers
12. Preparing activity completion report every end of the conduct of school-based INSET.
School Head, Lead Teacher and ICT
May 2017-March 2019/School
1000 MOOE
13. Monitor the report with the using tracking and monitoring checklist
School Head May 2017-March 2019/ School
500 MOOE
14. Evaluate the results. School Head, SPT
May 2017-March 2019/ School
NC
15. Analyze and interpret the findings
School Head, SPT
May 2017-March 2019/ School
NC
Value Individual Learners through Multi-tasking Approach (Project VILMA)
Decrease the number of students with habitual absenteeism from 28 to zero end of SY 2018-2019.
Decreased number of Absentees
Daily monitoring of Learners absences
Principal, DH, teacher-Advisers, Parents, Learners
Daily NC
Monthly home visit of teachers to the learners
Teacher-Advisers, Parents, Learners
Monthly basis/home
5,000.00
School MOOE
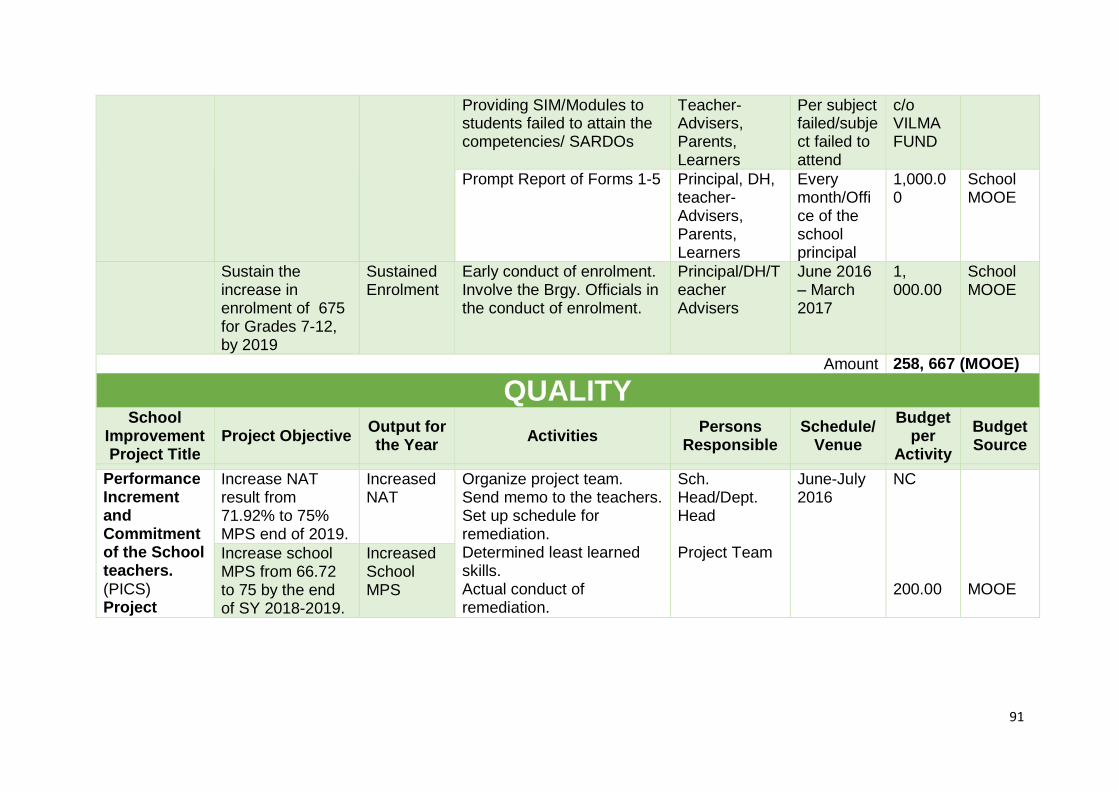
91
Providing SIM/Modules to students failed to attain the competencies/ SARDOs
Teacher-Advisers, Parents, Learners
Per subject failed/subject failed to attend
c/o VILMA FUND
Prompt Report of Forms 1-5 Principal, DH, teacher-Advisers, Parents, Learners
Every month/Office of the school principal
1,000.00
School MOOE
Sustain the increase in enrolment of 675 for Grades 7-12, by 2019
Sustained Enrolment
Early conduct of enrolment. Involve the Brgy. Officials in the conduct of enrolment.
Principal/DH/Teacher Advisers
June 2016 – March 2017
1, 000.00
School MOOE
Amount 258, 667 (MOOE)
QUALITY School
Improvement Project Title
Project Objective Output for the Year
Activities Persons
Responsible Schedule/
Venue
Budget per
Activity
Budget Source
Performance Increment and Commitment of the School teachers. (PICS) Project
Increase NAT result from 71.92% to 75% MPS end of 2019.
Increased NAT
Organize project team. Send memo to the teachers. Set up schedule for remediation. Determined least learned skills. Actual conduct of remediation.
Sch. Head/Dept. Head Project Team
June-July 2016
NC 200.00
MOOE
Increase school MPS from 66.72 to 75 by the end of SY 2018-2019.
Increased School MPS
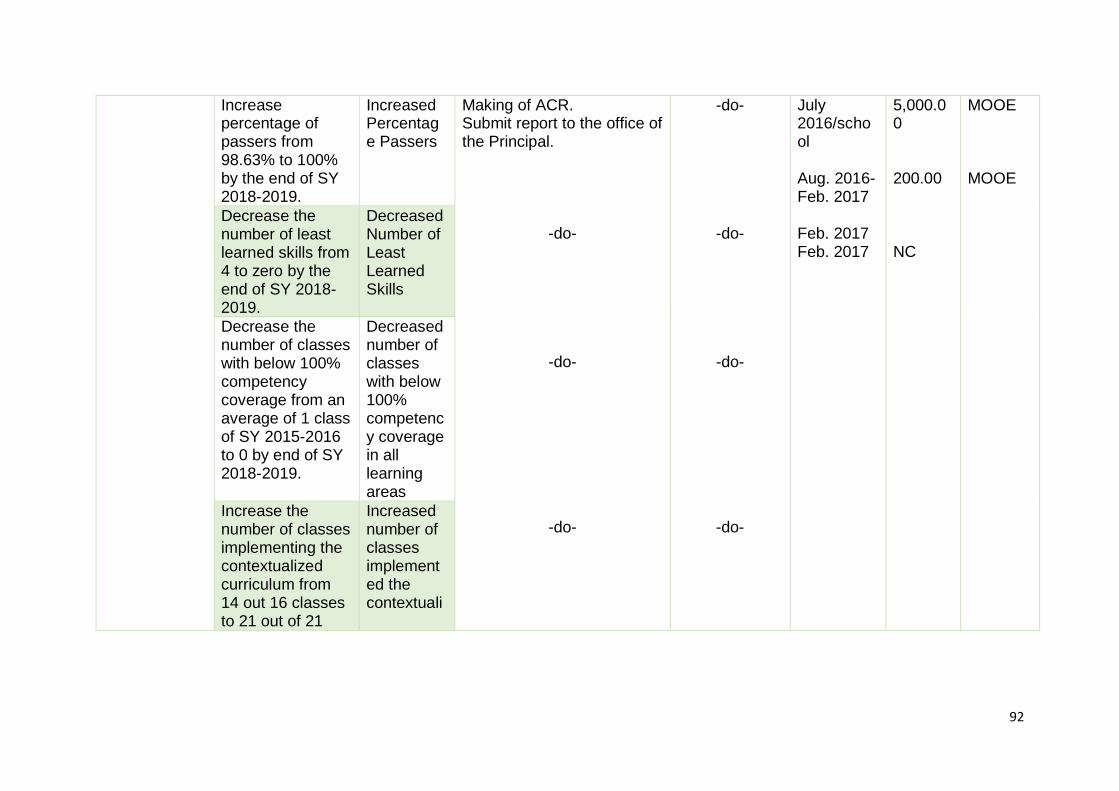
92
Increase percentage of passers from 98.63% to 100% by the end of SY 2018-2019.
Increased Percentage Passers
Making of ACR. Submit report to the office of the Principal.
-do-
-do-
-do-
-do-
-do-
-do-
-do-
July 2016/school Aug. 2016-Feb. 2017 Feb. 2017 Feb. 2017
5,000.00 200.00 NC
MOOE MOOE
Decrease the number of least learned skills from 4 to zero by the end of SY 2018-2019.
Decreased Number of Least Learned Skills
Decrease the number of classes with below 100% competency coverage from an average of 1 class of SY 2015-2016 to 0 by end of SY 2018-2019.
Decreased number of classes with below 100% competency coverage in all learning areas
Increase the number of classes implementing the contextualized curriculum from 14 out 16 classes to 21 out of 21
Increased number of classes implemented the contextuali
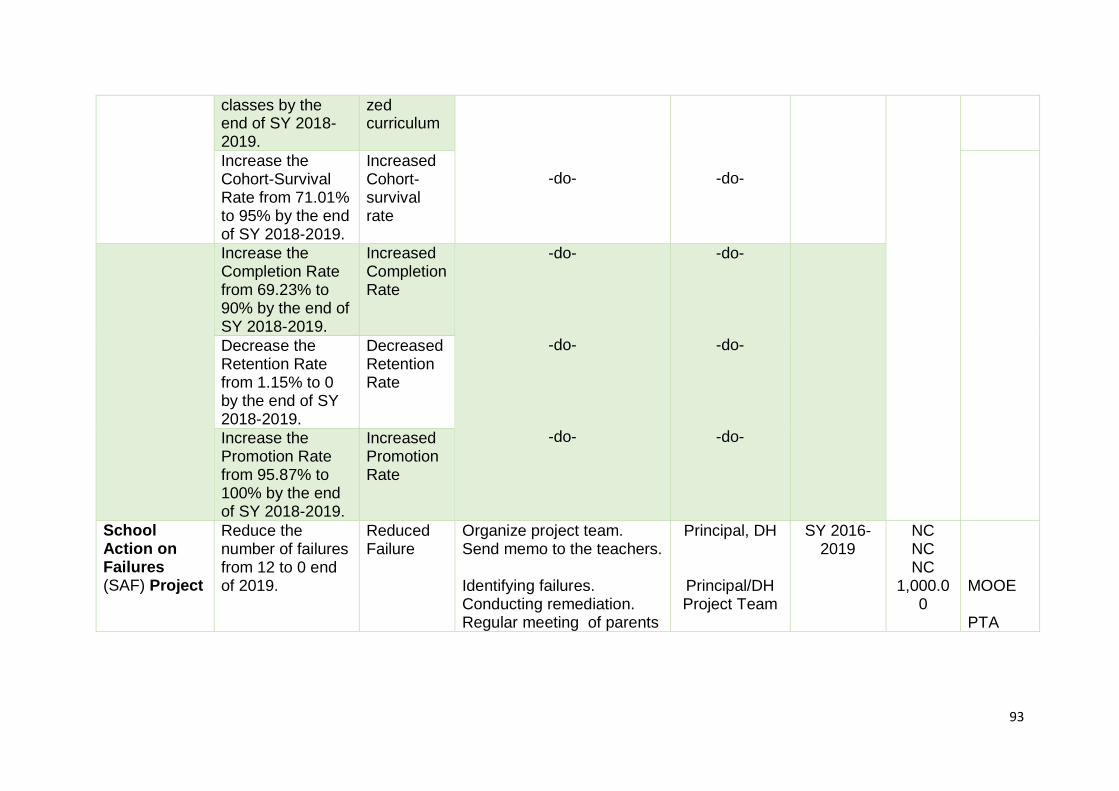
93
classes by the end of SY 2018-2019.
zed curriculum
-do-
-do-
Increase the Cohort-Survival Rate from 71.01% to 95% by the end of SY 2018-2019.
Increased Cohort-survival rate
Increase the Completion Rate from 69.23% to 90% by the end of SY 2018-2019.
Increased Completion Rate
-do-
-do-
-do-
-do-
-do-
-do-
Decrease the Retention Rate from 1.15% to 0 by the end of SY 2018-2019.
Decreased Retention Rate
Increase the Promotion Rate from 95.87% to 100% by the end of SY 2018-2019.
Increased Promotion Rate
School Action on Failures (SAF) Project
Reduce the number of failures from 12 to 0 end of 2019.
Reduced Failure
Organize project team. Send memo to the teachers. Identifying failures. Conducting remediation. Regular meeting of parents
Principal, DH
Principal/DH Project Team
SY 2016-2019
NC NC NC
1,000.00
MOOE
PTA
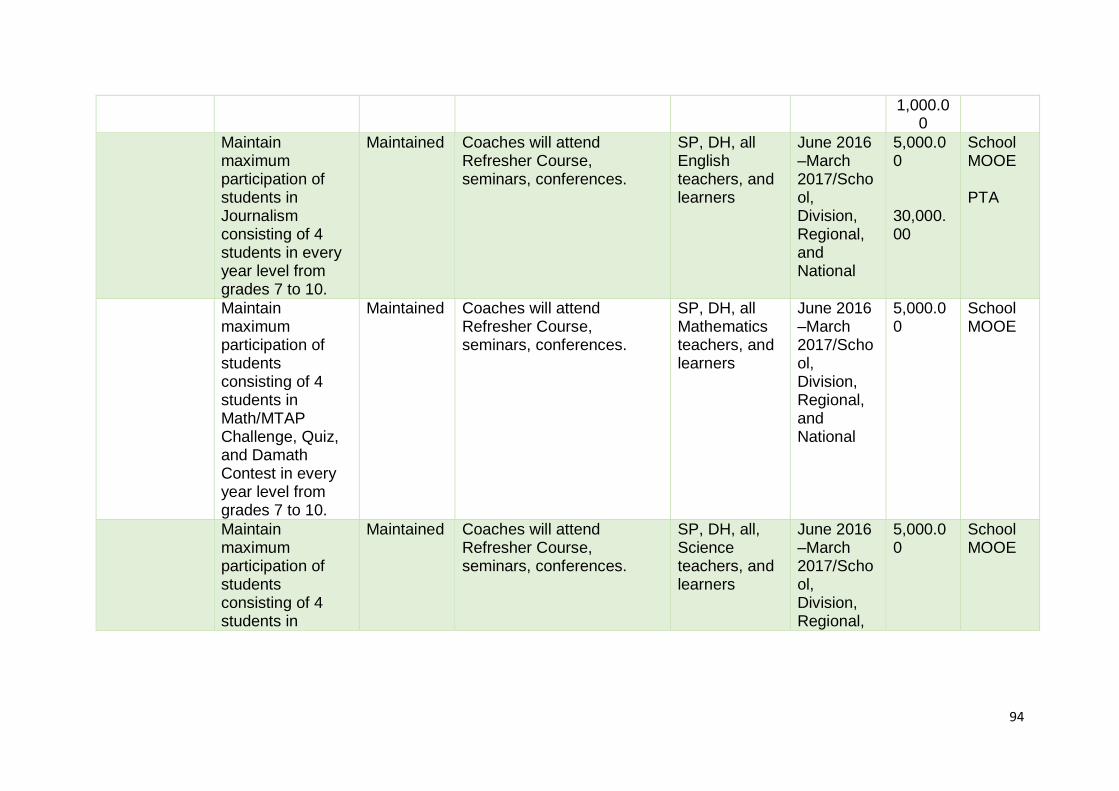
94
1,000.00
Maintain maximum participation of students in Journalism consisting of 4 students in every year level from grades 7 to 10.
Maintained Coaches will attend Refresher Course, seminars, conferences.
SP, DH, all English teachers, and learners
June 2016 –March 2017/School, Division, Regional, and National
5,000.00 30,000.00
School MOOE PTA
Maintain maximum participation of students consisting of 4 students in Math/MTAP Challenge, Quiz, and Damath Contest in every year level from grades 7 to 10.
Maintained Coaches will attend Refresher Course, seminars, conferences.
SP, DH, all Mathematics teachers, and learners
June 2016 –March 2017/School, Division, Regional, and National
5,000.00
School MOOE
Maintain maximum participation of students consisting of 4 students in
Maintained Coaches will attend Refresher Course, seminars, conferences.
SP, DH, all, Science teachers, and learners
June 2016 –March 2017/School, Division, Regional,
5,000.00
School MOOE
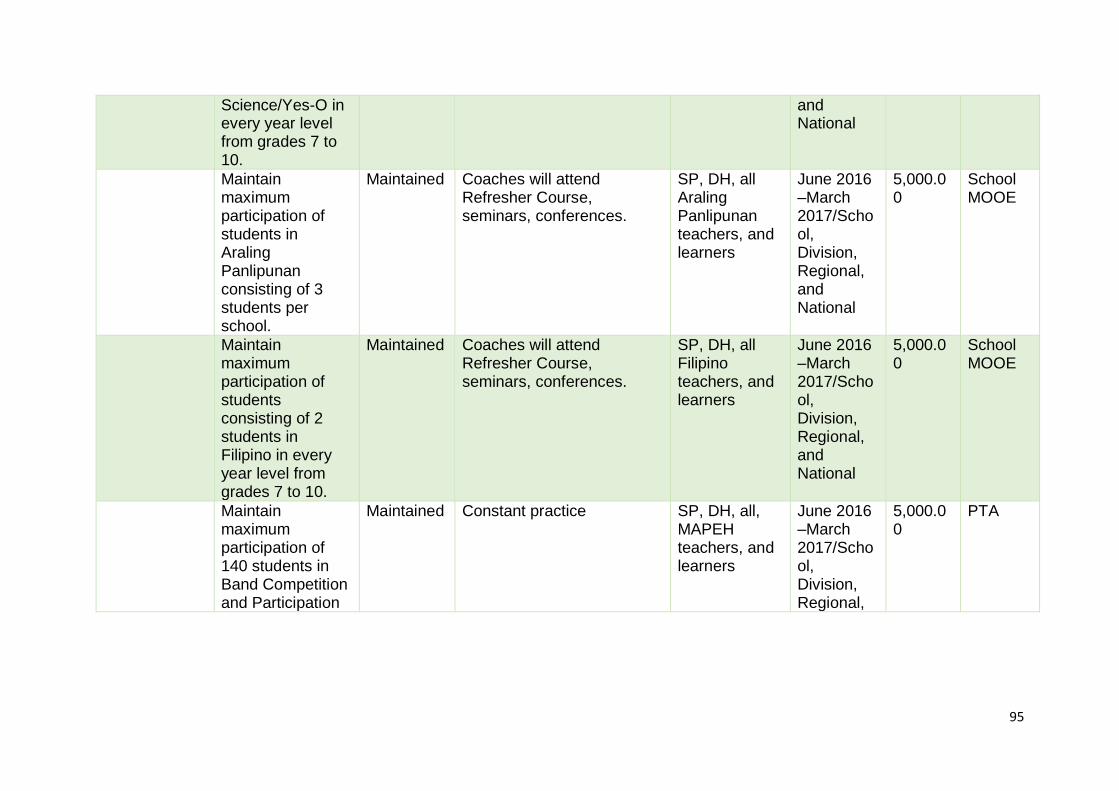
95
Science/Yes-O in every year level from grades 7 to 10.
and National
Maintain maximum participation of students in Araling Panlipunan consisting of 3 students per school.
Maintained Coaches will attend Refresher Course, seminars, conferences.
SP, DH, all Araling Panlipunan teachers, and learners
June 2016 –March 2017/School, Division, Regional, and National
5,000.00
School MOOE
Maintain maximum participation of students consisting of 2 students in Filipino in every year level from grades 7 to 10.
Maintained Coaches will attend Refresher Course, seminars, conferences.
SP, DH, all Filipino teachers, and learners
June 2016 –March 2017/School, Division, Regional, and National
5,000.00
School MOOE
Maintain maximum participation of 140 students in Band Competition and Participation
Maintained Constant practice SP, DH, all, MAPEH teachers, and learners
June 2016 –March 2017/School, Division, Regional,
5,000.00
PTA
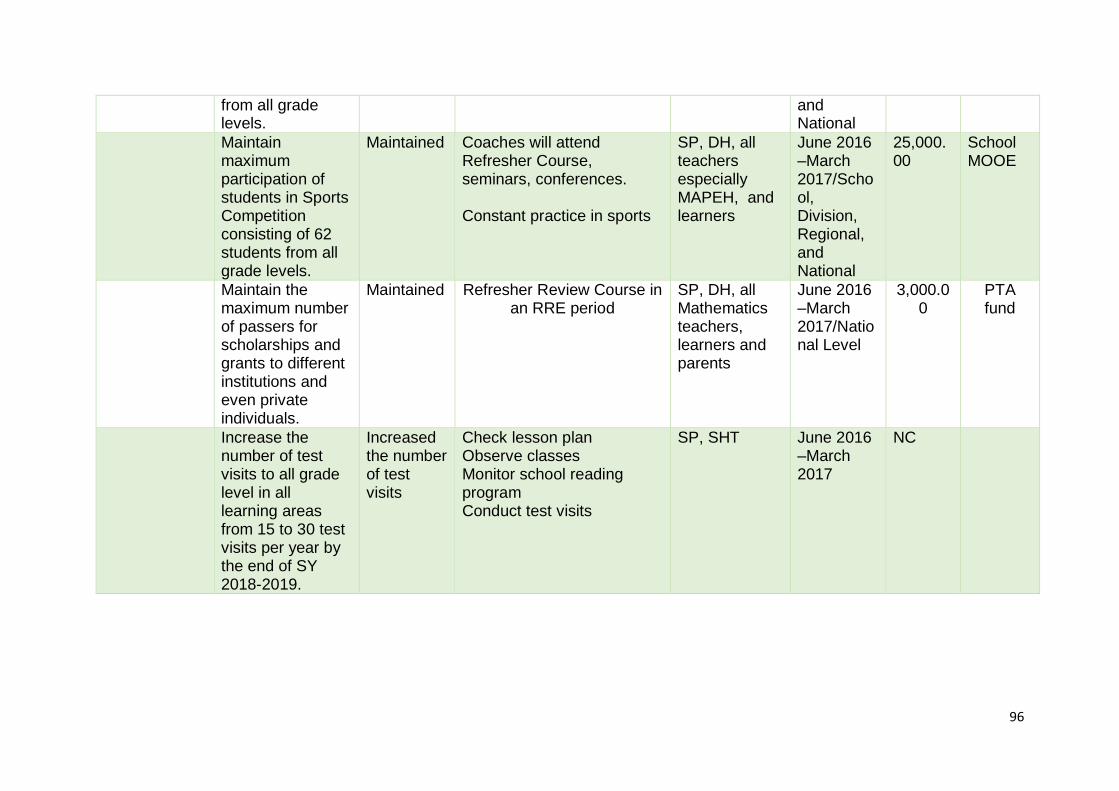
96
from all grade levels.
and National
Maintain maximum participation of students in Sports Competition consisting of 62 students from all grade levels.
Maintained Coaches will attend Refresher Course, seminars, conferences. Constant practice in sports
SP, DH, all teachers especially MAPEH, and learners
June 2016 –March 2017/School, Division, Regional, and National
25,000.00
School MOOE
Maintain the maximum number of passers for scholarships and grants to different institutions and even private individuals.
Maintained Refresher Review Course in an RRE period
SP, DH, all Mathematics teachers, learners and parents
June 2016 –March 2017/National Level
3,000.00
PTA fund
Increase the number of test visits to all grade level in all learning areas from 15 to 30 test visits per year by the end of SY 2018-2019.
Increased the number of test visits
Check lesson plan Observe classes Monitor school reading program Conduct test visits
SP, SHT June 2016 –March 2017
NC
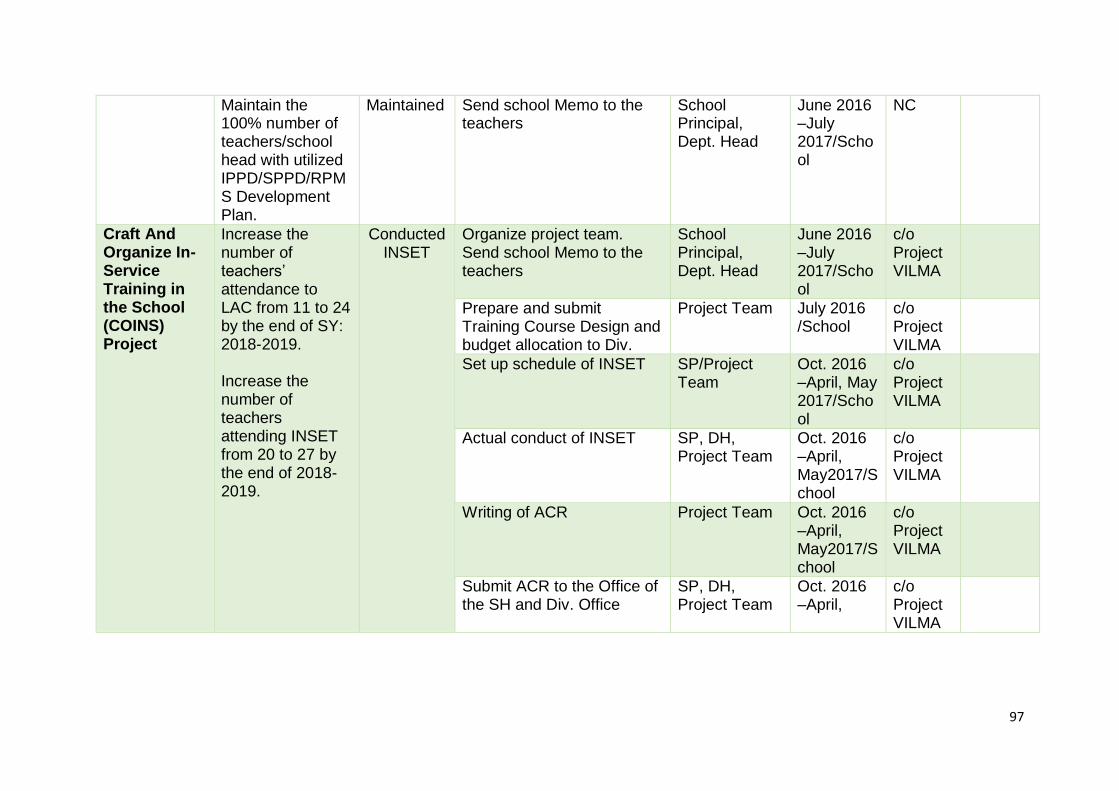
97
Maintain the 100% number of teachers/school head with utilized IPPD/SPPD/RPMS Development Plan.
Maintained Send school Memo to the teachers
School Principal, Dept. Head
June 2016 –July 2017/School
NC
Craft And Organize In-Service Training in the School (COINS) Project
Increase the number of teachers’ attendance to LAC from 11 to 24 by the end of SY: 2018-2019. Increase the number of teachers attending INSET from 20 to 27 by the end of 2018-2019.
Conducted INSET
Organize project team. Send school Memo to the teachers
School Principal, Dept. Head
June 2016 –July 2017/School
c/o Project VILMA
Prepare and submit Training Course Design and budget allocation to Div.
Project Team July 2016 /School
c/o Project VILMA
Set up schedule of INSET SP/Project Team
Oct. 2016 –April, May 2017/School
c/o Project VILMA
Actual conduct of INSET SP, DH, Project Team
Oct. 2016 –April, May2017/School
c/o Project VILMA
Writing of ACR Project Team Oct. 2016 –April, May2017/School
c/o Project VILMA
Submit ACR to the Office of the SH and Div. Office
SP, DH, Project Team
Oct. 2016 –April,
c/o Project VILMA
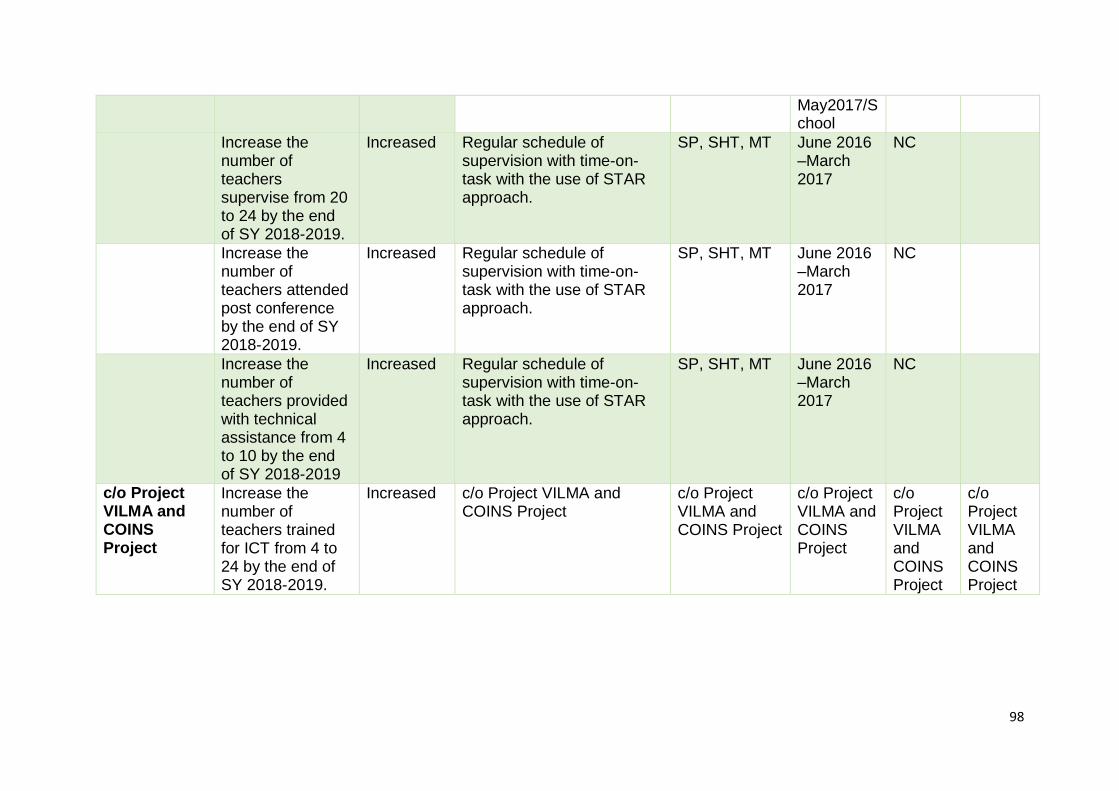
98
May2017/School
Increase the number of teachers supervise from 20 to 24 by the end of SY 2018-2019.
Increased Regular schedule of supervision with time-on-task with the use of STAR approach.
SP, SHT, MT June 2016 –March 2017
NC
Increase the number of teachers attended post conference by the end of SY 2018-2019.
Increased Regular schedule of supervision with time-on-task with the use of STAR approach.
SP, SHT, MT June 2016 –March 2017
NC
Increase the number of teachers provided with technical assistance from 4 to 10 by the end of SY 2018-2019
Increased Regular schedule of supervision with time-on-task with the use of STAR approach.
SP, SHT, MT June 2016 –March 2017
NC
c/o Project VILMA and COINS Project
Increase the number of teachers trained for ICT from 4 to 24 by the end of SY 2018-2019.
Increased c/o Project VILMA and COINS Project
c/o Project VILMA and COINS Project
c/o Project VILMA and COINS Project
c/o Project VILMA and COINS Project
c/o Project VILMA and COINS Project
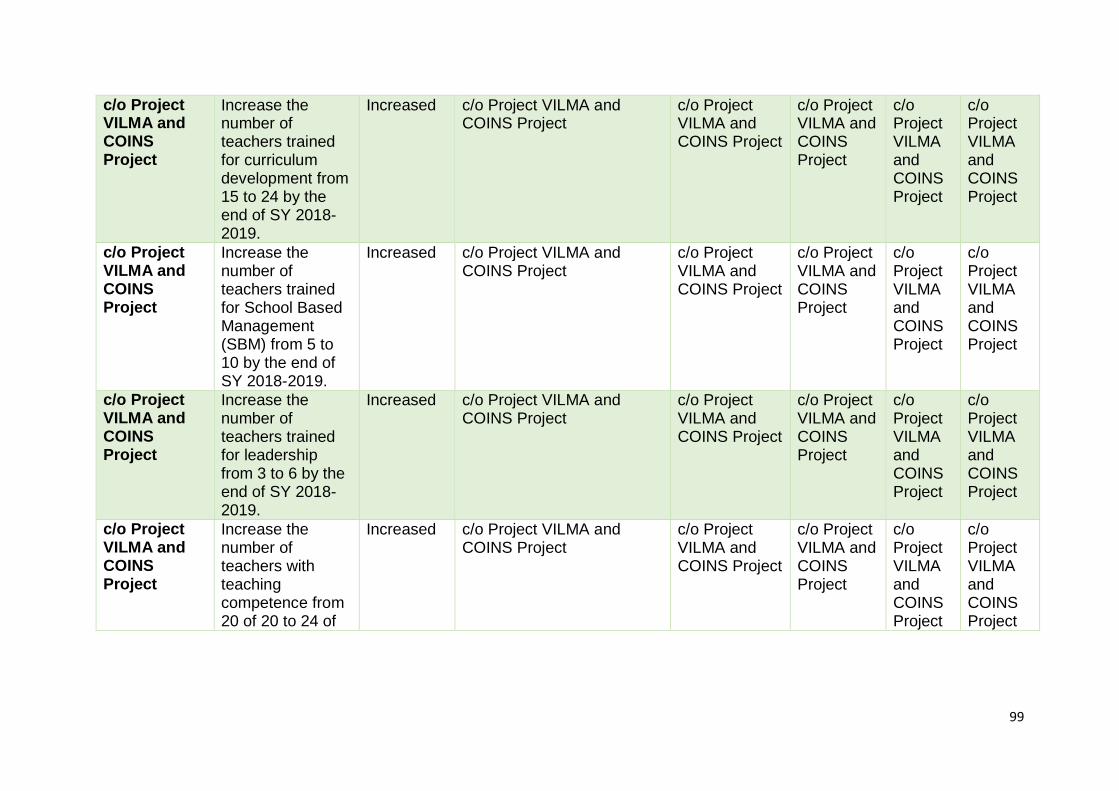
99
c/o Project VILMA and COINS Project
Increase the number of teachers trained for curriculum development from 15 to 24 by the end of SY 2018-2019.
Increased c/o Project VILMA and COINS Project
c/o Project VILMA and COINS Project
c/o Project VILMA and COINS Project
c/o Project VILMA and COINS Project
c/o Project VILMA and COINS Project
c/o Project VILMA and COINS Project
Increase the number of teachers trained for School Based Management (SBM) from 5 to 10 by the end of SY 2018-2019.
Increased c/o Project VILMA and COINS Project
c/o Project VILMA and COINS Project
c/o Project VILMA and COINS Project
c/o Project VILMA and COINS Project
c/o Project VILMA and COINS Project
c/o Project VILMA and COINS Project
Increase the number of teachers trained for leadership from 3 to 6 by the end of SY 2018-2019.
Increased c/o Project VILMA and COINS Project
c/o Project VILMA and COINS Project
c/o Project VILMA and COINS Project
c/o Project VILMA and COINS Project
c/o Project VILMA and COINS Project
c/o Project VILMA and COINS Project
Increase the number of teachers with teaching competence from 20 of 20 to 24 of
Increased c/o Project VILMA and COINS Project
c/o Project VILMA and COINS Project
c/o Project VILMA and COINS Project
c/o Project VILMA and COINS Project
c/o Project VILMA and COINS Project
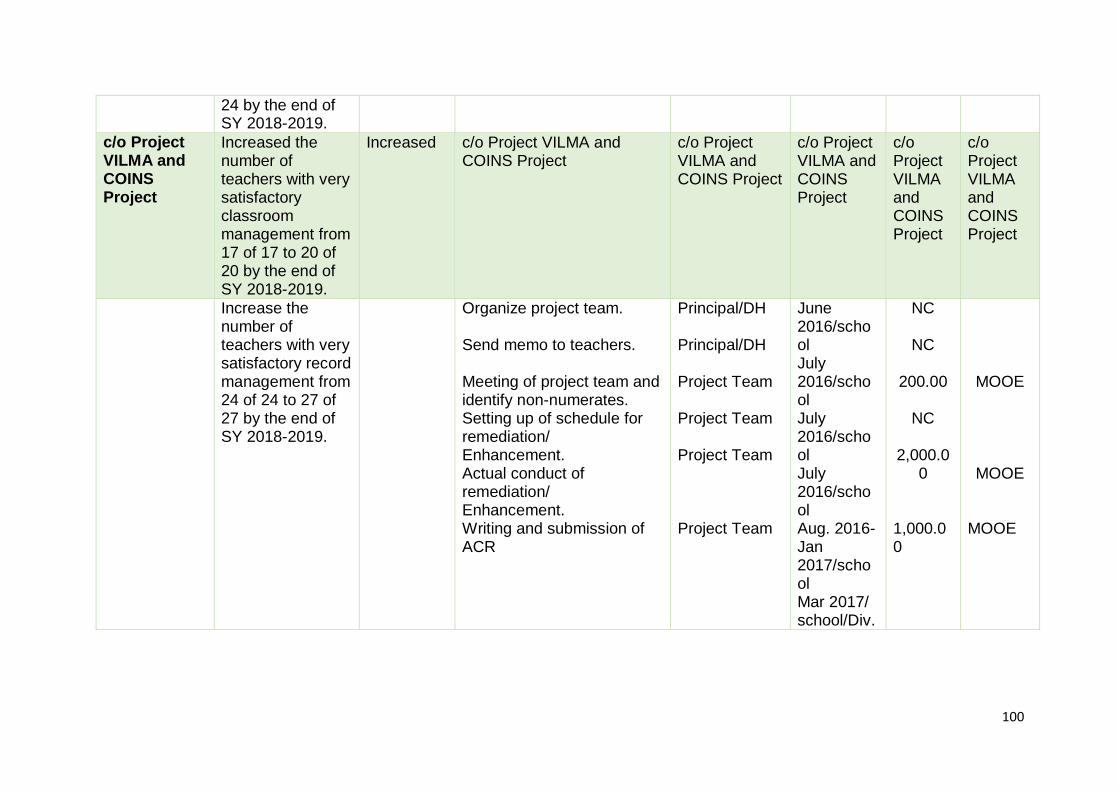
100
24 by the end of SY 2018-2019.
c/o Project VILMA and COINS Project
Increased the number of teachers with very satisfactory classroom management from 17 of 17 to 20 of 20 by the end of SY 2018-2019.
Increased c/o Project VILMA and COINS Project
c/o Project VILMA and COINS Project
c/o Project VILMA and COINS Project
c/o Project VILMA and COINS Project
c/o Project VILMA and COINS Project
Increase the number of teachers with very satisfactory record management from 24 of 24 to 27 of 27 by the end of SY 2018-2019.
Organize project team. Send memo to teachers. Meeting of project team and identify non-numerates. Setting up of schedule for remediation/ Enhancement. Actual conduct of remediation/ Enhancement. Writing and submission of ACR
Principal/DH Principal/DH Project Team Project Team Project Team Project Team
June 2016/school July 2016/school July 2016/school July 2016/school Aug. 2016-Jan 2017/school Mar 2017/ school/Div.
NC
NC 200.00
NC
2,000.0
0 1,000.00
MOOE
MOOE
MOOE
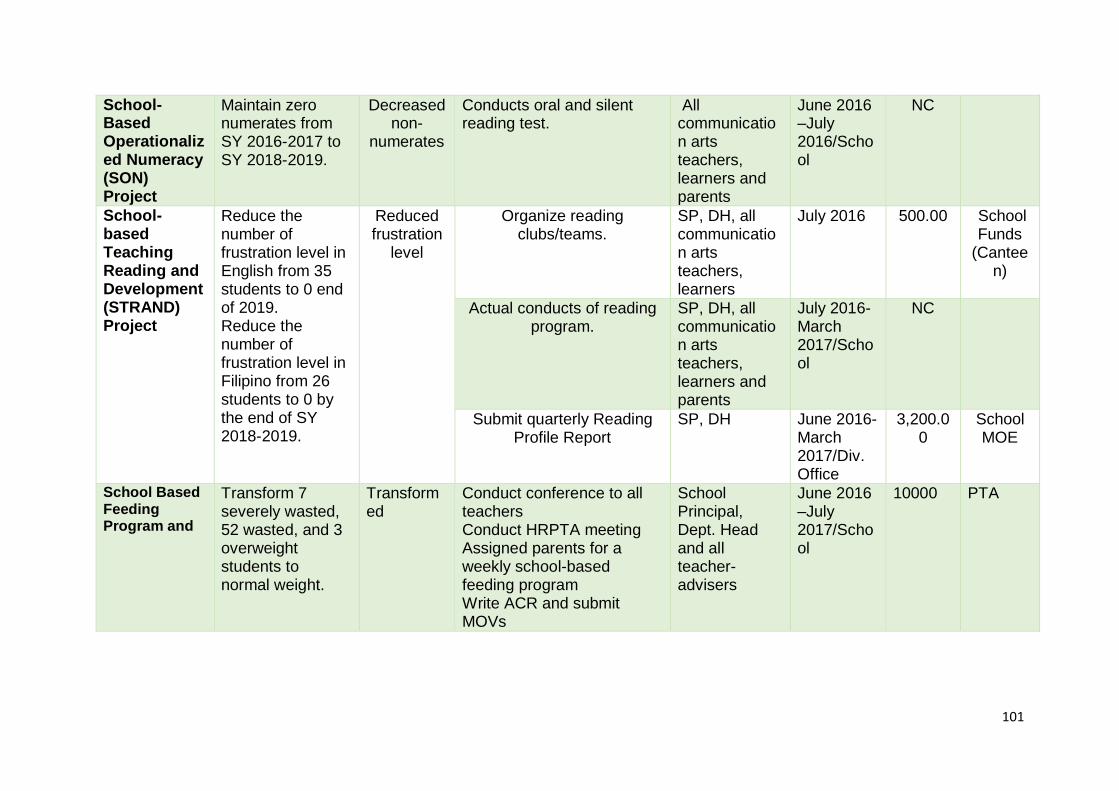
101
School-Based Operationalized Numeracy (SON) Project
Maintain zero numerates from SY 2016-2017 to SY 2018-2019.
Decreased non-
numerates
Conducts oral and silent reading test.
All communication arts teachers, learners and parents
June 2016 –July 2016/School
NC
School-based Teaching Reading and Development (STRAND) Project
Reduce the number of frustration level in English from 35 students to 0 end of 2019. Reduce the number of frustration level in Filipino from 26 students to 0 by the end of SY 2018-2019.
Reduced frustration
level
Organize reading clubs/teams.
SP, DH, all communication arts teachers, learners
July 2016 500.00 School Funds
(Canteen)
Actual conducts of reading program.
SP, DH, all communication arts teachers, learners and parents
July 2016- March 2017/School
NC
Submit quarterly Reading Profile Report
SP, DH June 2016-March 2017/Div. Office
3,200.00
School MOE
School Based Feeding Program and
Transform 7 severely wasted, 52 wasted, and 3 overweight students to normal weight.
Transformed
Conduct conference to all teachers Conduct HRPTA meeting Assigned parents for a weekly school-based feeding program Write ACR and submit MOVs
School Principal, Dept. Head and all teacher-advisers
June 2016 –July 2017/School
10000 PTA
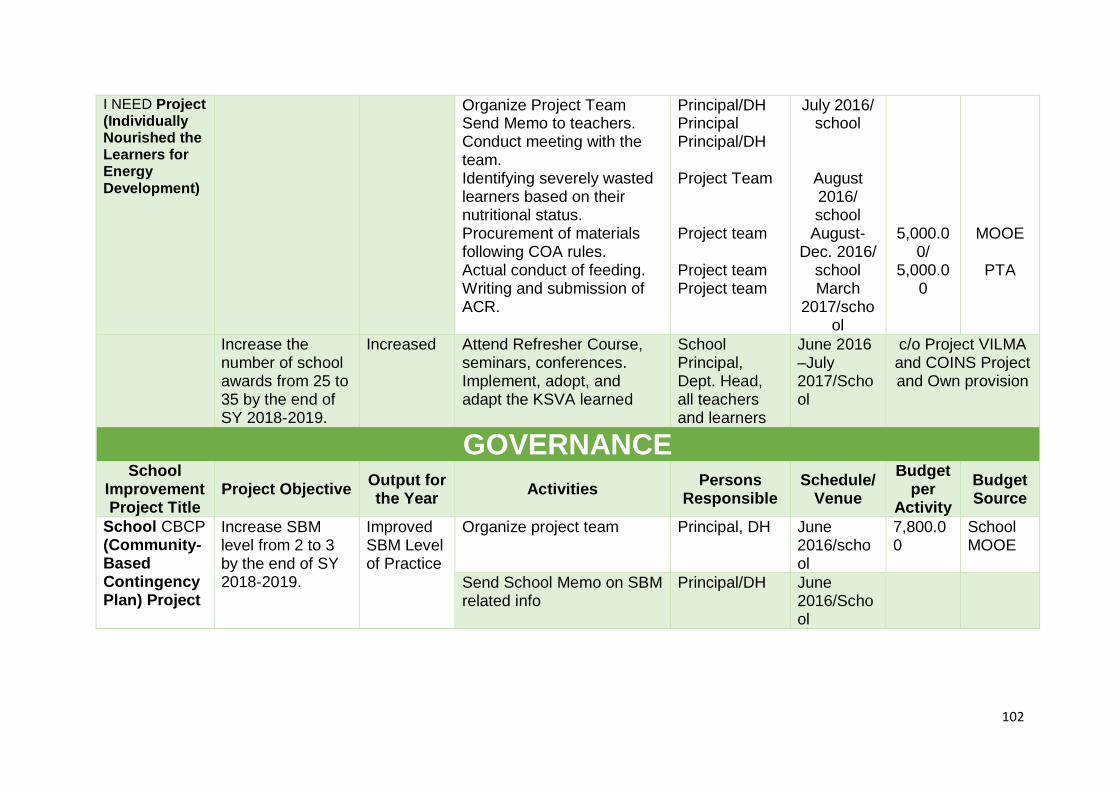
102
I NEED Project (Individually Nourished the Learners for Energy Development)
Organize Project Team Send Memo to teachers. Conduct meeting with the team. Identifying severely wasted learners based on their nutritional status. Procurement of materials following COA rules. Actual conduct of feeding. Writing and submission of ACR.
Principal/DH Principal Principal/DH Project Team Project team Project team Project team
July 2016/ school
August 2016/ school
August-Dec. 2016/
school March
2017/school
5,000.00/
5,000.00
MOOE
PTA
Increase the number of school awards from 25 to 35 by the end of SY 2018-2019.
Increased Attend Refresher Course, seminars, conferences. Implement, adopt, and adapt the KSVA learned
School Principal, Dept. Head, all teachers and learners
June 2016 –July 2017/School
c/o Project VILMA and COINS Project and Own provision
GOVERNANCE School
Improvement Project Title
Project Objective Output for the Year
Activities Persons
Responsible Schedule/
Venue
Budget per
Activity
Budget Source
School CBCP (Community-Based Contingency Plan) Project
Increase SBM level from 2 to 3 by the end of SY 2018-2019.
Improved SBM Level of Practice
Organize project team Principal, DH June 2016/school
7,800.00
School MOOE
Send School Memo on SBM related info
Principal/DH June 2016/School
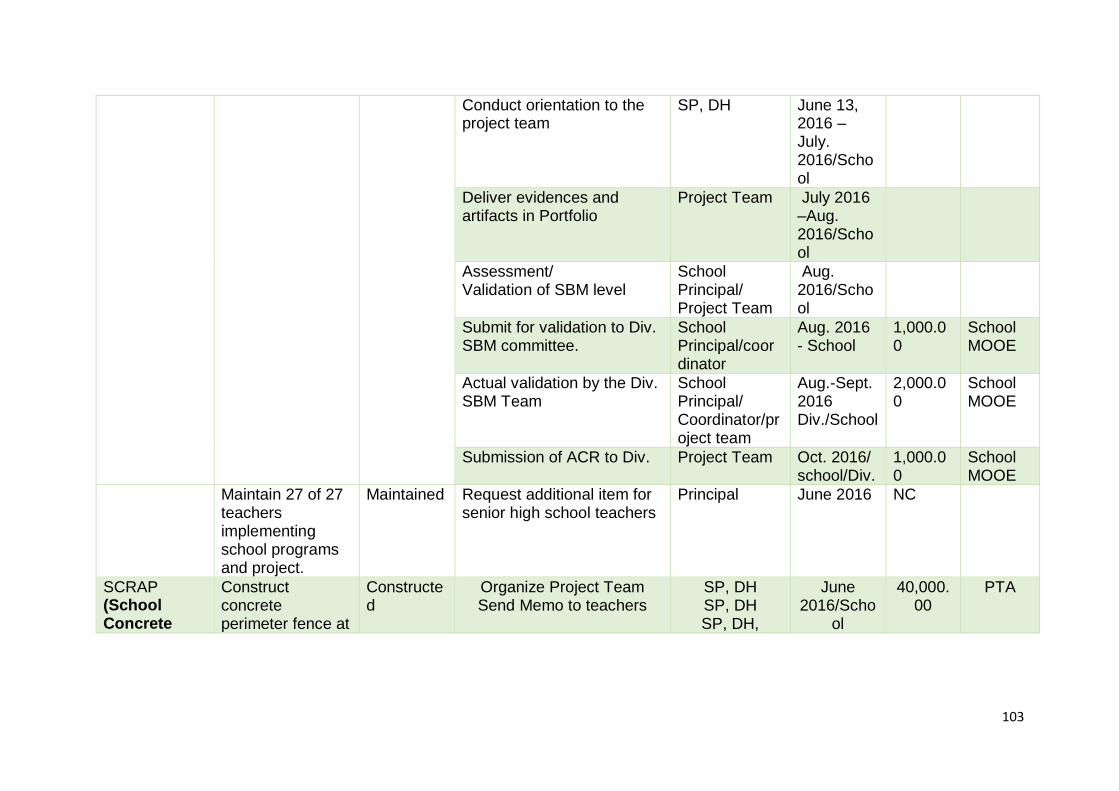
103
Conduct orientation to the project team
SP, DH June 13, 2016 – July. 2016/School
Deliver evidences and artifacts in Portfolio
Project Team July 2016 –Aug. 2016/School
Assessment/ Validation of SBM level
School Principal/ Project Team
Aug. 2016/School
Submit for validation to Div. SBM committee.
School Principal/coordinator
Aug. 2016 - School
1,000.00
School MOOE
Actual validation by the Div. SBM Team
School Principal/ Coordinator/project team
Aug.-Sept. 2016 Div./School
2,000.00
School MOOE
Submission of ACR to Div. Project Team Oct. 2016/ school/Div.
1,000.00
School MOOE
Maintain 27 of 27 teachers implementing school programs and project.
Maintained Request additional item for senior high school teachers
Principal June 2016 NC
SCRAP (School Concrete
Construct concrete perimeter fence at
Constructed
Organize Project Team Send Memo to teachers
SP, DH SP, DH SP, DH,
June 2016/Scho
ol
40,000.00
PTA
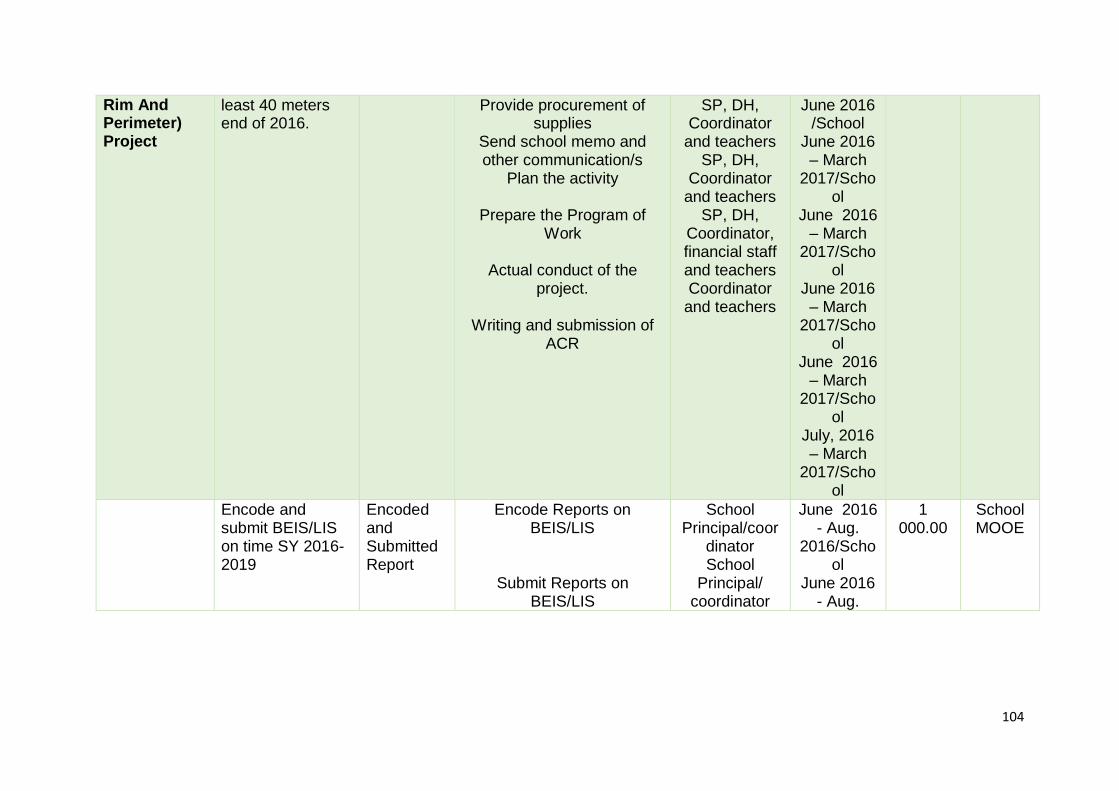
104
Rim And Perimeter) Project
least 40 meters end of 2016.
Provide procurement of supplies
Send school memo and other communication/s
Plan the activity
Prepare the Program of Work
Actual conduct of the
project.
Writing and submission of ACR
SP, DH, Coordinator
and teachers SP, DH,
Coordinator and teachers
SP, DH, Coordinator, financial staff and teachers Coordinator
and teachers
June 2016 /School
June 2016 – March
2017/School
June 2016 – March
2017/School
June 2016 – March
2017/School
June 2016 – March
2017/School
July, 2016 – March
2017/School
Encode and submit BEIS/LIS on time SY 2016-2019
Encoded and Submitted Report
Encode Reports on BEIS/LIS
Submit Reports on BEIS/LIS
School Principal/coor
dinator School
Principal/ coordinator
June 2016 - Aug.
2016/School
June 2016 - Aug.
1 000.00
School MOOE
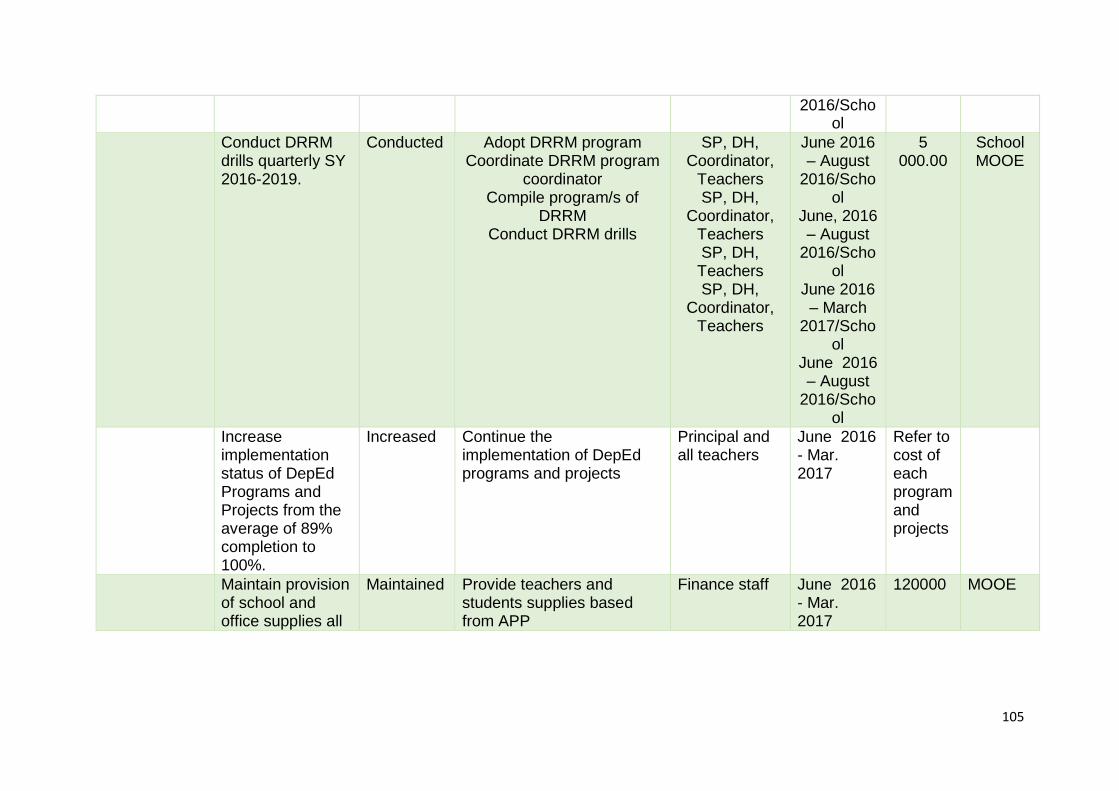
105
2016/School
Conduct DRRM drills quarterly SY 2016-2019.
Conducted Adopt DRRM program Coordinate DRRM program
coordinator Compile program/s of
DRRM Conduct DRRM drills
SP, DH, Coordinator,
Teachers SP, DH,
Coordinator, Teachers SP, DH, Teachers SP, DH,
Coordinator, Teachers
June 2016 – August
2016/School
June, 2016 – August
2016/School
June 2016 – March
2017/School
June 2016 – August
2016/School
5 000.00
School MOOE
Increase implementation status of DepEd Programs and Projects from the average of 89% completion to 100%.
Increased Continue the implementation of DepEd programs and projects
Principal and all teachers
June 2016 - Mar. 2017
Refer to cost of each program and projects
Maintain provision of school and office supplies all
Maintained Provide teachers and students supplies based from APP
Finance staff June 2016 - Mar. 2017
120000 MOOE
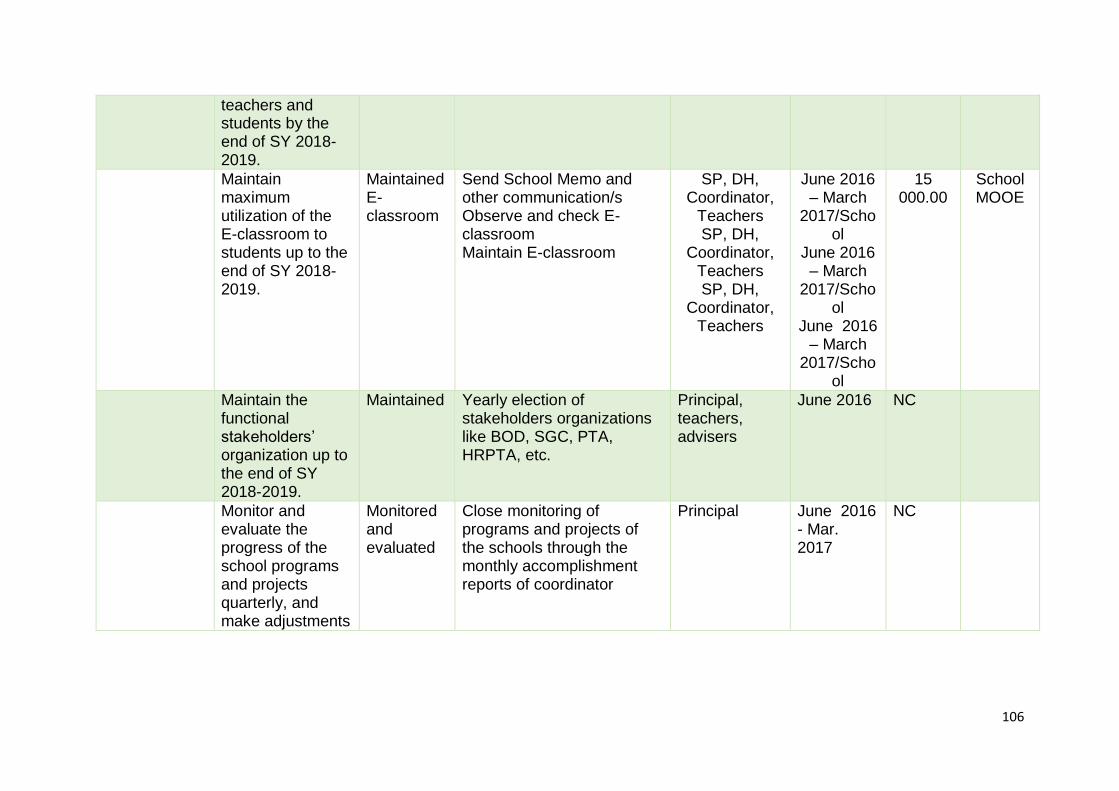
106
teachers and students by the end of SY 2018-2019.
Maintain maximum utilization of the E-classroom to students up to the end of SY 2018-2019.
Maintained E-classroom
Send School Memo and other communication/s Observe and check E-classroom Maintain E-classroom
SP, DH, Coordinator,
Teachers SP, DH,
Coordinator, Teachers SP, DH,
Coordinator, Teachers
June 2016 – March
2017/School
June 2016 – March
2017/School
June 2016 – March
2017/School
15 000.00
School MOOE
Maintain the functional stakeholders’ organization up to the end of SY 2018-2019.
Maintained Yearly election of stakeholders organizations like BOD, SGC, PTA, HRPTA, etc.
Principal, teachers, advisers
June 2016 NC
Monitor and evaluate the progress of the school programs and projects quarterly, and make adjustments
Monitored and evaluated
Close monitoring of programs and projects of the schools through the monthly accomplishment reports of coordinator
Principal June 2016 - Mar. 2017
NC
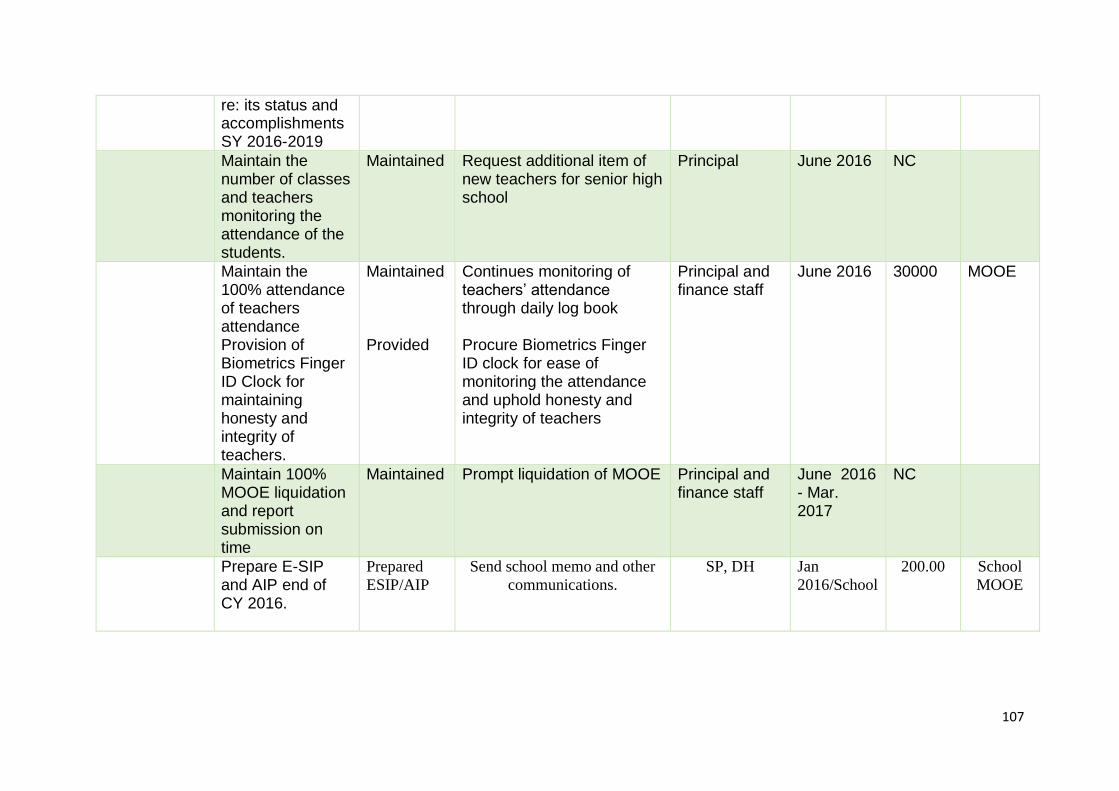
107
re: its status and accomplishments SY 2016-2019
Maintain the number of classes and teachers monitoring the attendance of the students.
Maintained Request additional item of new teachers for senior high school
Principal June 2016 NC
Maintain the 100% attendance of teachers attendance Provision of Biometrics Finger ID Clock for maintaining honesty and integrity of teachers.
Maintained Provided
Continues monitoring of teachers’ attendance through daily log book Procure Biometrics Finger ID clock for ease of monitoring the attendance and uphold honesty and integrity of teachers
Principal and finance staff
June 2016 30000 MOOE
Maintain 100% MOOE liquidation and report submission on time
Maintained Prompt liquidation of MOOE Principal and finance staff
June 2016 - Mar. 2017
NC
Prepare E-SIP and AIP end of CY 2016.
Prepared
ESIP/AIP
Send school memo and other
communications.
SP, DH
Jan
2016/School
200.00 School
MOOE
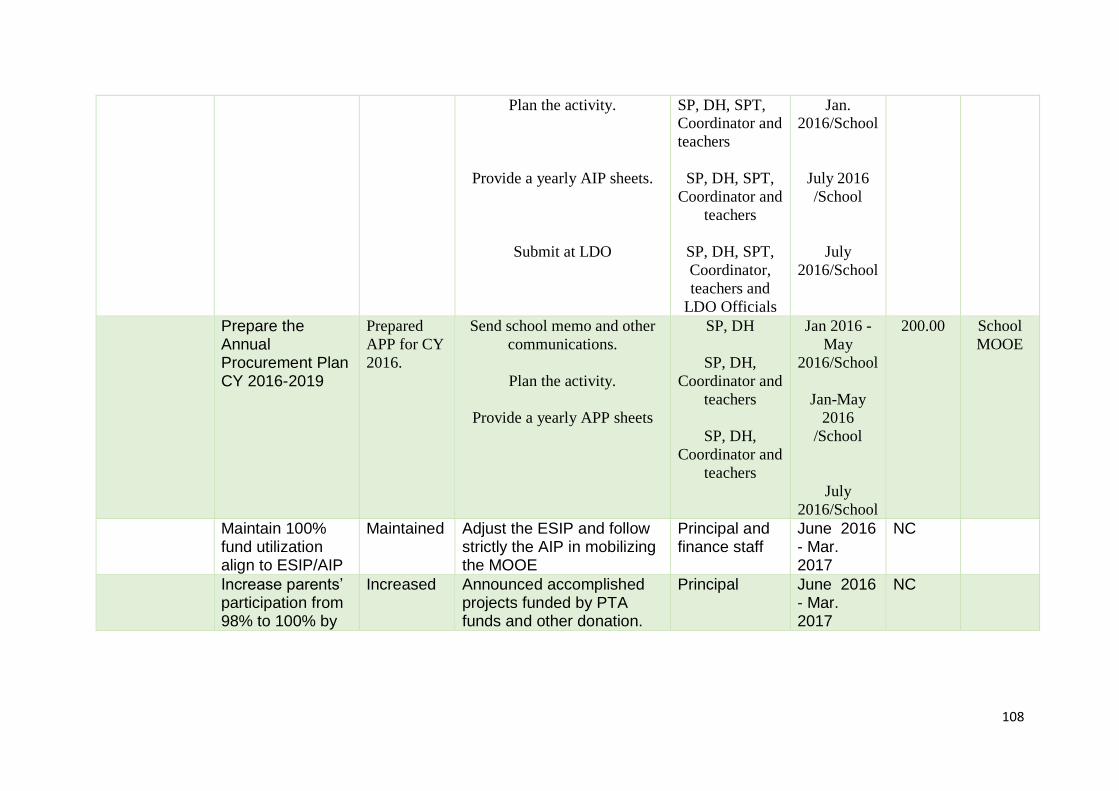
108
Plan the activity.
Provide a yearly AIP sheets.
Submit at LDO
SP, DH, SPT, Coordinator and
teachers
SP, DH, SPT,
Coordinator and
teachers
SP, DH, SPT,
Coordinator,
teachers and
LDO Officials
Jan. 2016/School
July 2016
/School
July
2016/School
Prepare the Annual Procurement Plan CY 2016-2019
Prepared
APP for CY
2016.
Send school memo and other
communications.
Plan the activity.
Provide a yearly APP sheets
SP, DH
SP, DH,
Coordinator and
teachers
SP, DH,
Coordinator and
teachers
Jan 2016 -
May
2016/School
Jan-May
2016
/School
July
2016/School
200.00 School
MOOE
Maintain 100% fund utilization align to ESIP/AIP
Maintained Adjust the ESIP and follow strictly the AIP in mobilizing the MOOE
Principal and finance staff
June 2016 - Mar. 2017
NC
Increase parents’ participation from 98% to 100% by
Increased Announced accomplished projects funded by PTA funds and other donation.
Principal June 2016 - Mar. 2017
NC
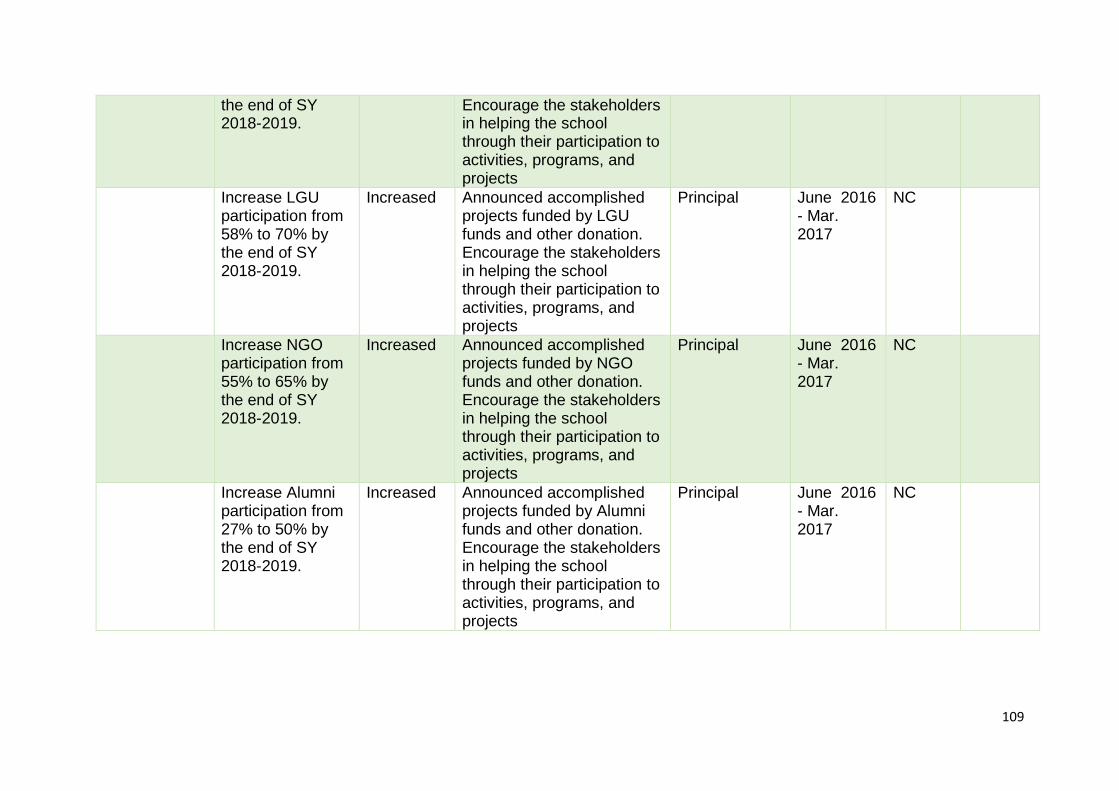
109
the end of SY 2018-2019.
Encourage the stakeholders in helping the school through their participation to activities, programs, and projects
Increase LGU participation from 58% to 70% by the end of SY 2018-2019.
Increased Announced accomplished projects funded by LGU funds and other donation. Encourage the stakeholders in helping the school through their participation to activities, programs, and projects
Principal June 2016 - Mar. 2017
NC
Increase NGO participation from 55% to 65% by the end of SY 2018-2019.
Increased Announced accomplished projects funded by NGO funds and other donation. Encourage the stakeholders in helping the school through their participation to activities, programs, and projects
Principal June 2016 - Mar. 2017
NC
Increase Alumni participation from 27% to 50% by the end of SY 2018-2019.
Increased Announced accomplished projects funded by Alumni funds and other donation. Encourage the stakeholders in helping the school through their participation to activities, programs, and projects
Principal June 2016 - Mar. 2017
NC
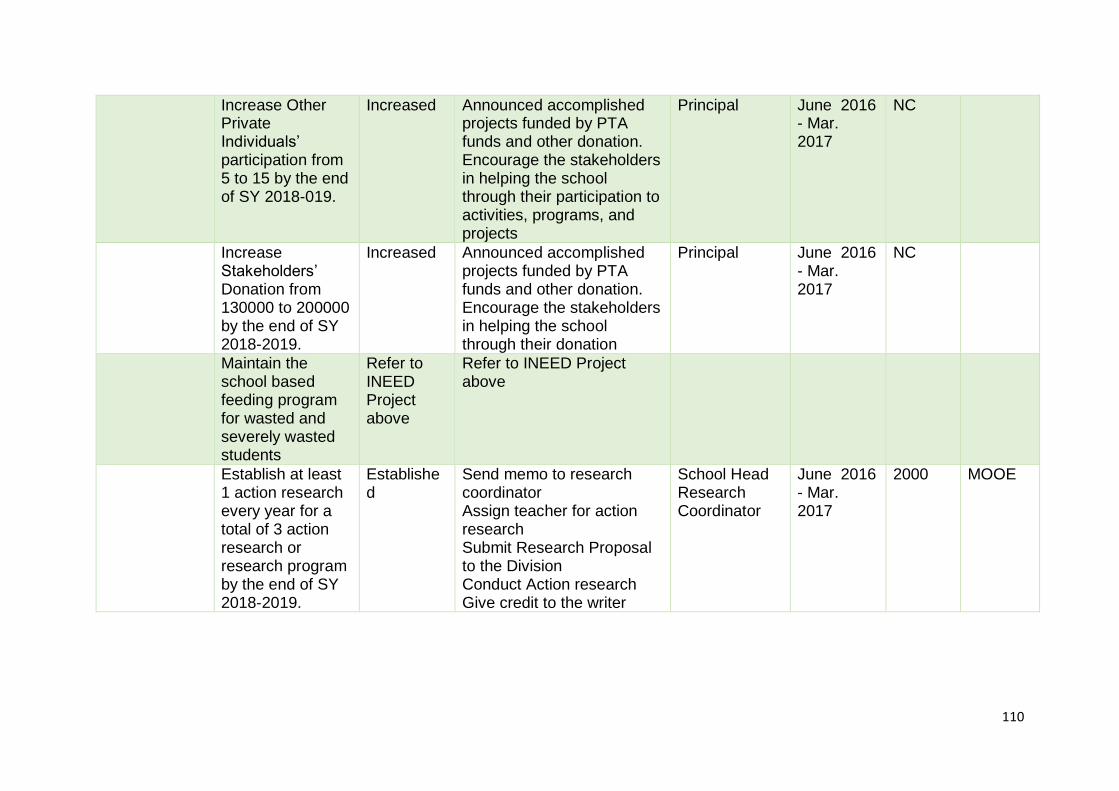
110
Increase Other Private Individuals’ participation from 5 to 15 by the end of SY 2018-019.
Increased Announced accomplished projects funded by PTA funds and other donation. Encourage the stakeholders in helping the school through their participation to activities, programs, and projects
Principal June 2016 - Mar. 2017
NC
Increase Stakeholders’ Donation from 130000 to 200000 by the end of SY 2018-2019.
Increased Announced accomplished projects funded by PTA funds and other donation. Encourage the stakeholders in helping the school through their donation
Principal June 2016 - Mar. 2017
NC
Maintain the school based feeding program for wasted and severely wasted students
Refer to INEED Project above
Refer to INEED Project above
Establish at least 1 action research every year for a total of 3 action research or research program by the end of SY 2018-2019.
Established
Send memo to research coordinator Assign teacher for action research Submit Research Proposal to the Division Conduct Action research Give credit to the writer
School Head Research Coordinator
June 2016 - Mar. 2017
2000 MOOE
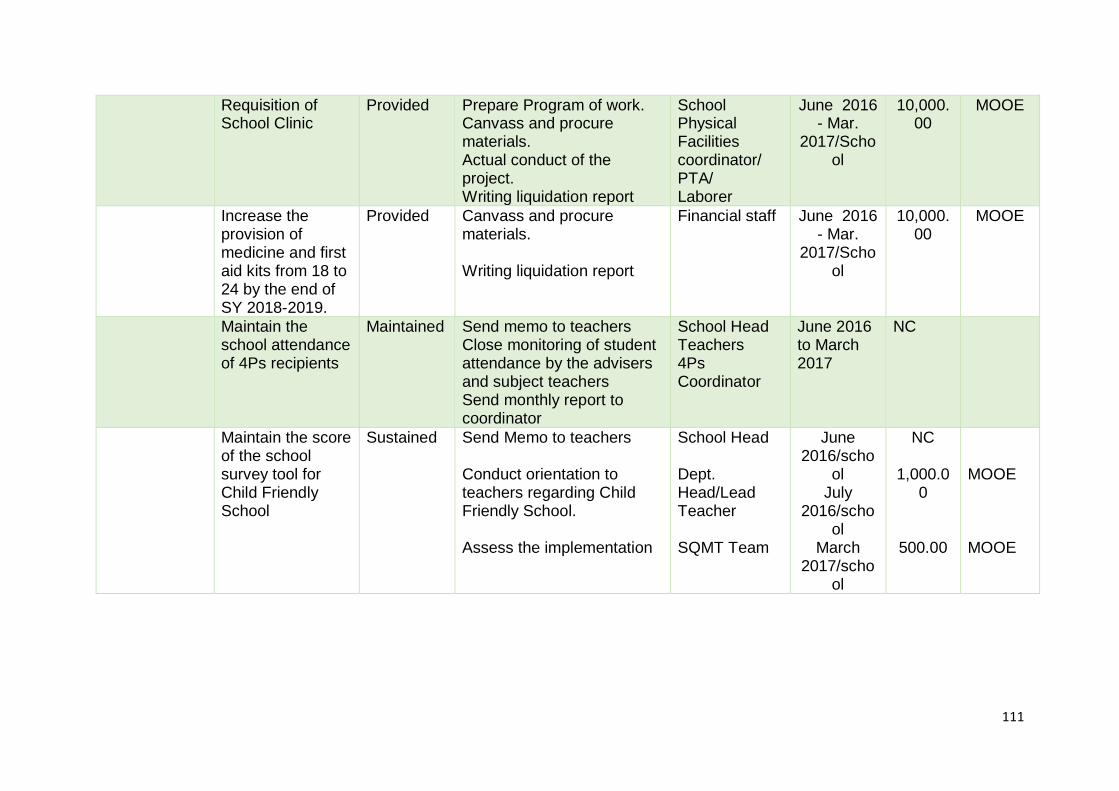
111
Requisition of School Clinic
Provided Prepare Program of work. Canvass and procure materials. Actual conduct of the project. Writing liquidation report
School Physical Facilities coordinator/ PTA/ Laborer
June 2016 - Mar.
2017/School
10,000.00
MOOE
Increase the provision of medicine and first aid kits from 18 to 24 by the end of SY 2018-2019.
Provided Canvass and procure materials. Writing liquidation report
Financial staff June 2016 - Mar.
2017/School
10,000.00
MOOE
Maintain the school attendance of 4Ps recipients
Maintained Send memo to teachers Close monitoring of student attendance by the advisers and subject teachers Send monthly report to coordinator
School Head Teachers 4Ps Coordinator
June 2016 to March 2017
NC
Maintain the score of the school survey tool for Child Friendly School
Sustained Send Memo to teachers Conduct orientation to teachers regarding Child Friendly School. Assess the implementation
School Head Dept. Head/Lead Teacher SQMT Team
June 2016/scho
ol July
2016/school
March 2017/scho
ol
NC 1,000.0
0
500.00
MOOE MOOE
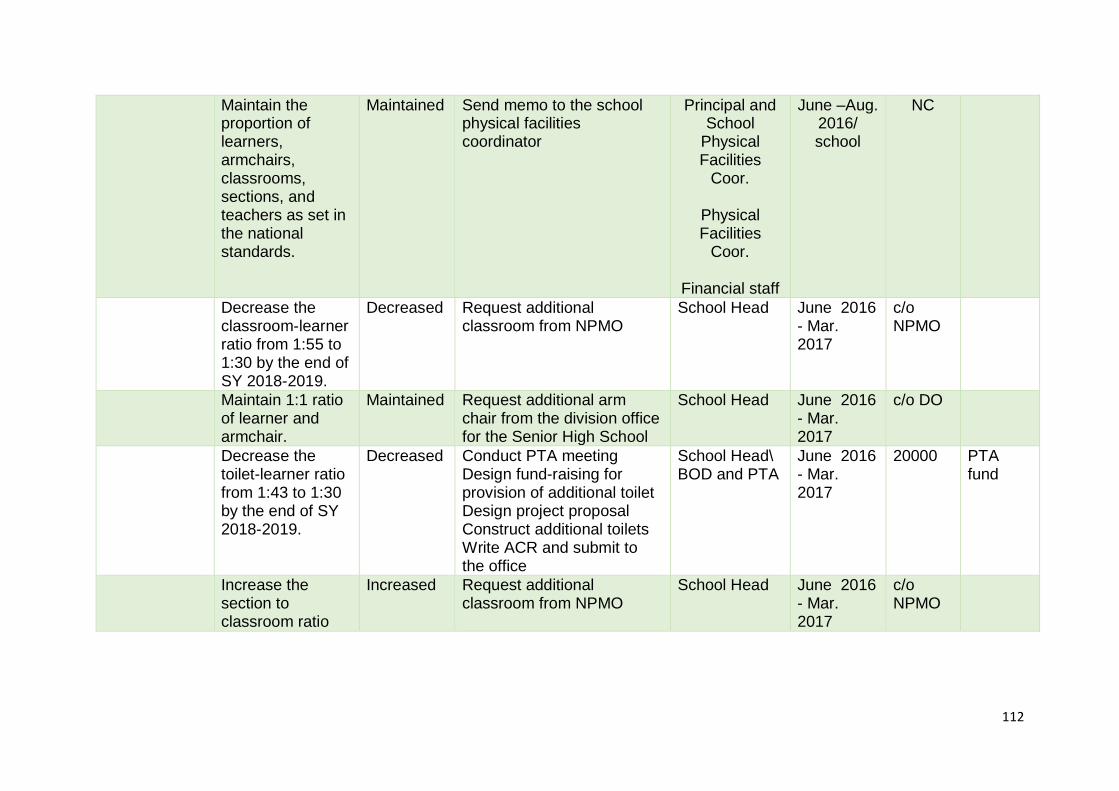
112
Maintain the proportion of learners, armchairs, classrooms, sections, and teachers as set in the national standards.
Maintained Send memo to the school physical facilities coordinator
Principal and School
Physical Facilities
Coor.
Physical Facilities
Coor.
Financial staff
June –Aug. 2016/ school
NC
Decrease the classroom-learner ratio from 1:55 to 1:30 by the end of SY 2018-2019.
Decreased Request additional classroom from NPMO
School Head June 2016 - Mar. 2017
c/o NPMO
Maintain 1:1 ratio of learner and armchair.
Maintained Request additional arm chair from the division office for the Senior High School
School Head June 2016 - Mar. 2017
c/o DO
Decrease the toilet-learner ratio from 1:43 to 1:30 by the end of SY 2018-2019.
Decreased Conduct PTA meeting Design fund-raising for provision of additional toilet Design project proposal Construct additional toilets Write ACR and submit to the office
School Head\ BOD and PTA
June 2016 - Mar. 2017
20000 PTA fund
Increase the section to classroom ratio
Increased Request additional classroom from NPMO
School Head June 2016 - Mar. 2017
c/o NPMO
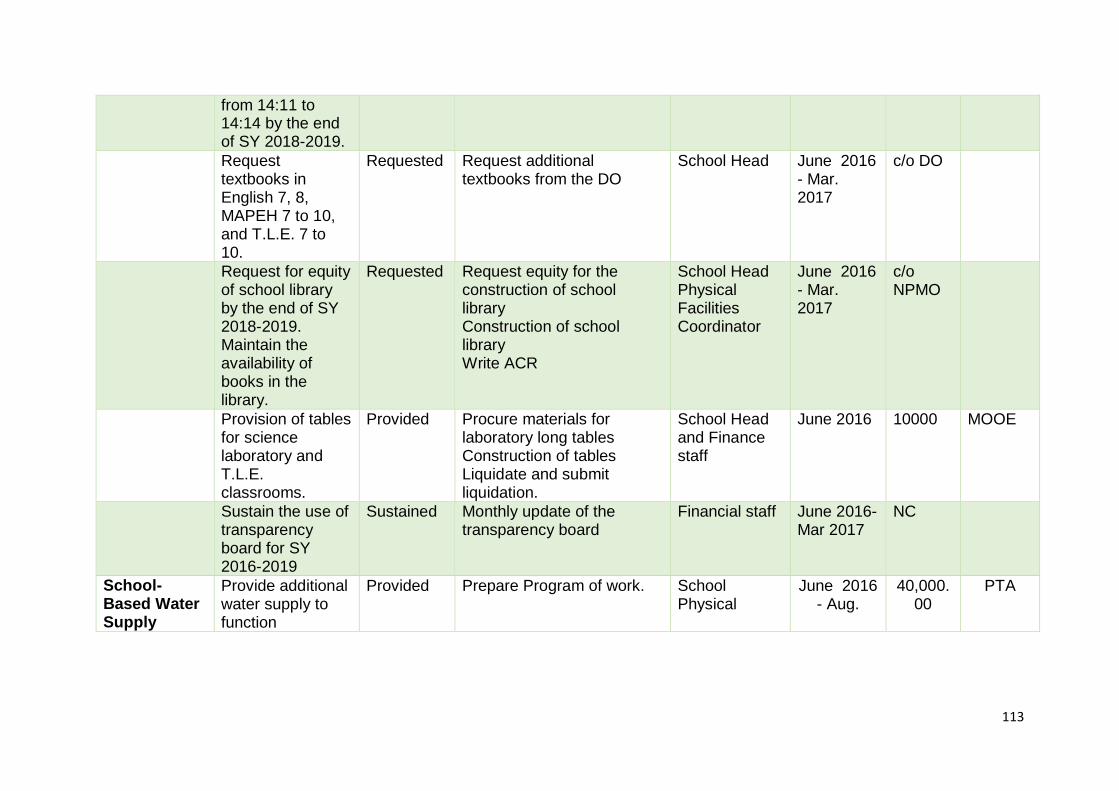
113
from 14:11 to 14:14 by the end of SY 2018-2019.
Request textbooks in English 7, 8, MAPEH 7 to 10, and T.L.E. 7 to 10.
Requested Request additional textbooks from the DO
School Head June 2016 - Mar. 2017
c/o DO
Request for equity of school library by the end of SY 2018-2019. Maintain the availability of books in the library.
Requested Request equity for the construction of school library Construction of school library Write ACR
School Head Physical Facilities Coordinator
June 2016 - Mar. 2017
c/o NPMO
Provision of tables for science laboratory and T.L.E. classrooms.
Provided Procure materials for laboratory long tables Construction of tables Liquidate and submit liquidation.
School Head and Finance staff
June 2016 10000 MOOE
Sustain the use of transparency board for SY 2016-2019
Sustained Monthly update of the transparency board
Financial staff June 2016-Mar 2017
NC
School- Based Water Supply
Provide additional water supply to function
Provided Prepare Program of work.
School Physical
June 2016 - Aug.
40,000.00
PTA
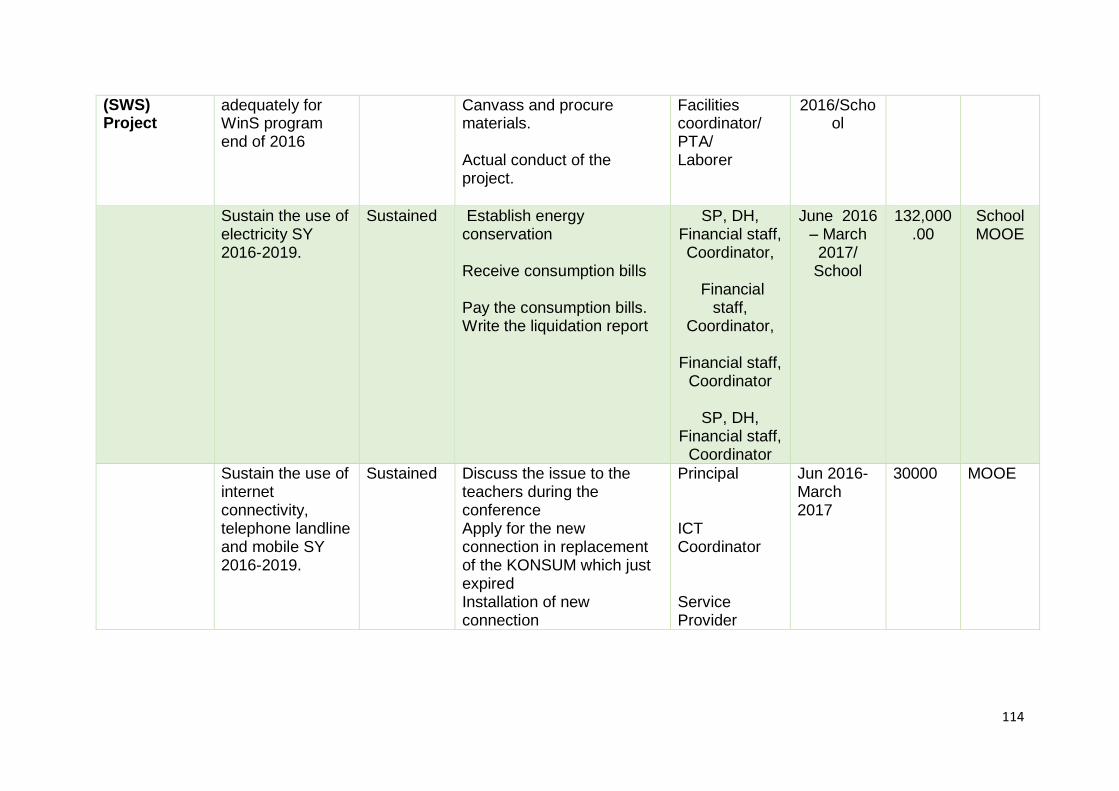
114
(SWS) Project
adequately for WinS program end of 2016
Canvass and procure materials. Actual conduct of the project.
Facilities coordinator/ PTA/ Laborer
2016/School
Sustain the use of electricity SY 2016-2019.
Sustained Establish energy conservation Receive consumption bills Pay the consumption bills. Write the liquidation report
SP, DH, Financial staff, Coordinator,
Financial
staff, Coordinator,
Financial staff,
Coordinator
SP, DH, Financial staff,
Coordinator
June 2016 – March 2017/
School
132,000.00
School MOOE
Sustain the use of internet connectivity, telephone landline and mobile SY 2016-2019.
Sustained Discuss the issue to the teachers during the conference Apply for the new connection in replacement of the KONSUM which just expired Installation of new connection
Principal ICT Coordinator Service Provider
Jun 2016-March 2017
30000 MOOE
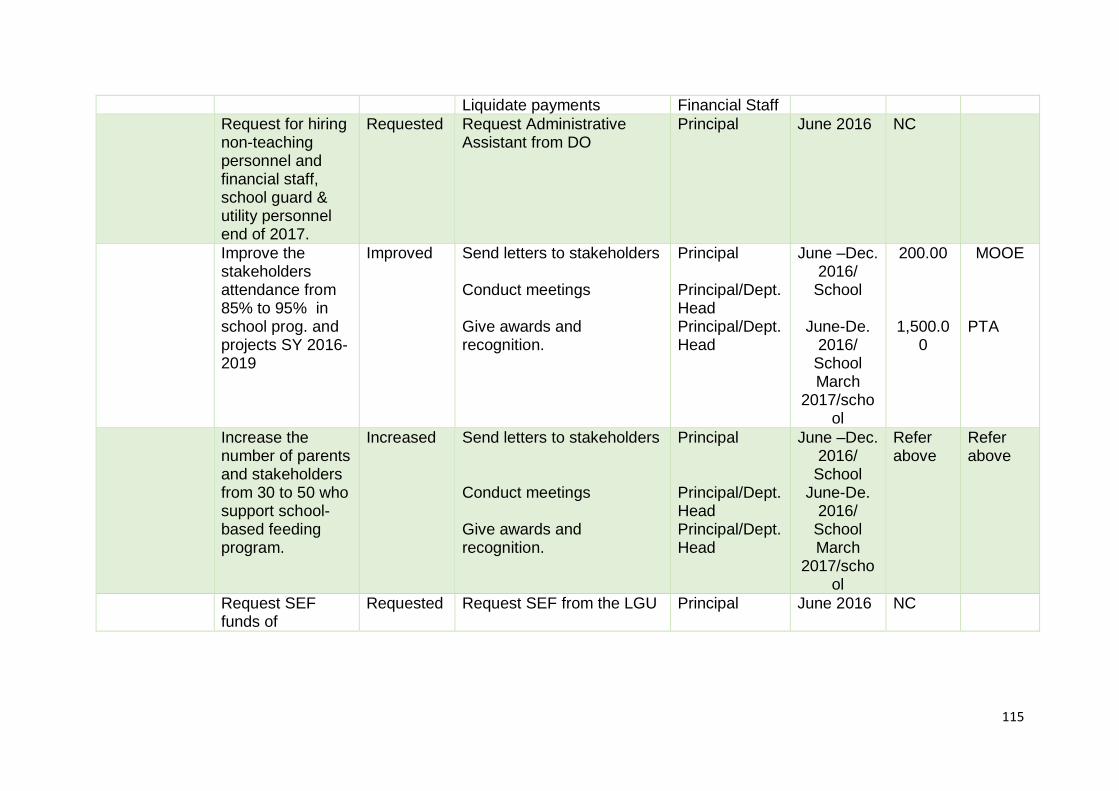
115
Liquidate payments Financial Staff Request for hiring
non-teaching personnel and financial staff, school guard & utility personnel end of 2017.
Requested Request Administrative Assistant from DO
Principal June 2016 NC
Improve the stakeholders attendance from 85% to 95% in school prog. and projects SY 2016-2019
Improved Send letters to stakeholders Conduct meetings Give awards and recognition.
Principal Principal/Dept. Head Principal/Dept. Head
June –Dec. 2016/
School
June-De. 2016/
School March
2017/school
200.00
1,500.0
0
MOOE
PTA
Increase the number of parents and stakeholders from 30 to 50 who support school-based feeding program.
Increased Send letters to stakeholders Conduct meetings Give awards and recognition.
Principal Principal/Dept. Head Principal/Dept. Head
June –Dec. 2016/
School June-De.
2016/ School March
2017/school
Refer above
Refer above
Request SEF funds of
Requested Request SEF from the LGU Principal June 2016 NC
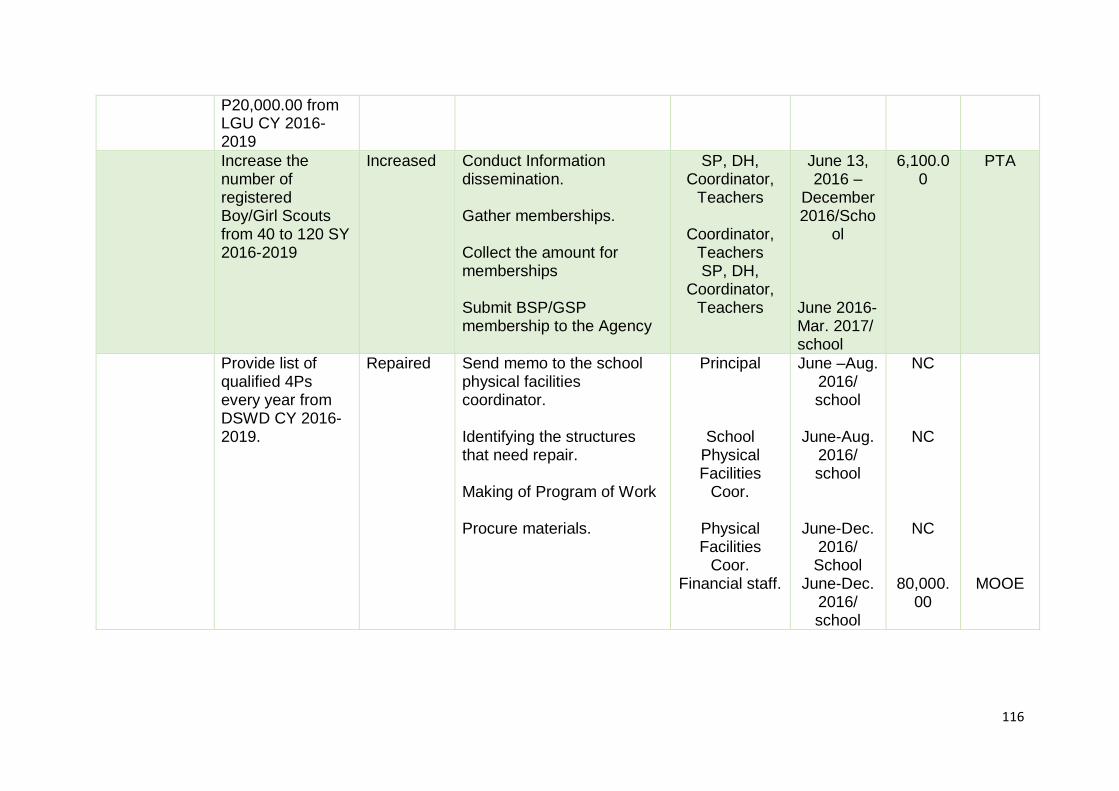
116
P20,000.00 from LGU CY 2016-2019
Increase the number of registered Boy/Girl Scouts from 40 to 120 SY 2016-2019
Increased Conduct Information dissemination. Gather memberships. Collect the amount for memberships Submit BSP/GSP membership to the Agency
SP, DH, Coordinator,
Teachers
Coordinator, Teachers SP, DH,
Coordinator, Teachers
June 13, 2016 –
December 2016/Scho
ol
June 2016-Mar. 2017/ school
6,100.00
PTA
Provide list of qualified 4Ps every year from DSWD CY 2016-2019.
Repaired Send memo to the school physical facilities coordinator. Identifying the structures that need repair. Making of Program of Work Procure materials.
Principal
School
Physical Facilities
Coor.
Physical Facilities
Coor. Financial staff.
June –Aug. 2016/ school
June-Aug.
2016/ school
June-Dec.
2016/ School
June-Dec. 2016/ school
NC
NC
NC
80,000.
00
MOOE
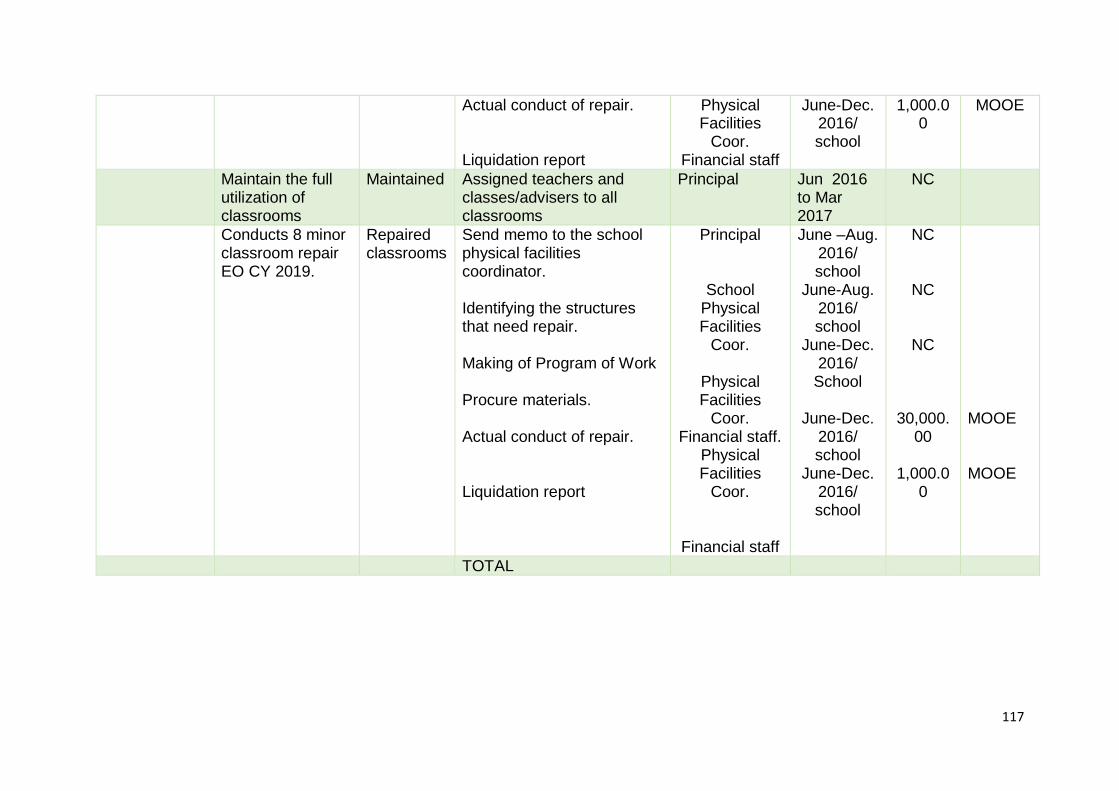
117
Actual conduct of repair. Liquidation report
Physical Facilities
Coor. Financial staff
June-Dec. 2016/ school
1,000.00
MOOE
Maintain the full utilization of classrooms
Maintained Assigned teachers and classes/advisers to all classrooms
Principal Jun 2016 to Mar 2017
NC
Conducts 8 minor classroom repair EO CY 2019.
Repaired classrooms
Send memo to the school physical facilities coordinator. Identifying the structures that need repair. Making of Program of Work Procure materials. Actual conduct of repair. Liquidation report
Principal
School
Physical Facilities
Coor.
Physical Facilities
Coor. Financial staff.
Physical Facilities
Coor.
Financial staff
June –Aug. 2016/ school
June-Aug. 2016/ school
June-Dec. 2016/
School
June-Dec. 2016/ school
June-Dec. 2016/ school
NC
NC
NC
30,000.
00
1,000.00
MOOE MOOE
TOTAL
118
Chapter 4
MONITORING AND EVALUATION
This Chapter contain the monitoring and evaluation process of the SQMT. The
School Quality Management Team (SQMT) is responsible in the monitoring and
evaluation of the programs and projects implemented by the school based on
the School Improvement Plan and the Annual Implementation Plan. M & E will
be done every quarter in order to keep track on the implementation and to
provide objective information that can inform decision-making in order to
continuously improve the delivery of school services for basic education and
the school’s performance or health to achieve the desired education outcomes.
This will even provide valid, reliable and accurate data in decision-making to
come up with possible actions and interventions to achieve the said desired
education outcomes.
The following are the procedures/processes followed in the School Monitoring Evaluation and Adjustment (SMEA) Process: 1. Data Gathering
Data gathering is done quarterly by internal M & E Team to Teachers,
SHs, & project Implementers during the pre-work prior to SMEA.
Physical Outputs (PO) accomplished are identified from their work plans
together with the standards if followed.
School Internal Monitoring and Evaluation Team (IMET) consolidate their
accomplishments using PO template and prepares the MOVs to support
the report.
Includes identification of issues, facilitating and hindering factors,
lessons learned and good practices encountered by schools which are
identified before the SMEA proper.
Collecting both quantitative and qualitative information
2. Data Validation
Determining if reported data are based on standards set and MOVs.
3. Data Processing and Analysis
Summary of accomplishments, issues for resolution and lessons learn
presented to management.
The quantitative data can be transformed into percentages, ratios, ranks
or measures of central tendency. These are also presented in tables and
graphs to show relationship between variables.
The analysis can also correlate physical outputs with funds utilized.
119
Analyzing information required to answer the M & E questions on
efficiency, effectiveness & relevance.
Agree on a set of Planning Standards
Review data and make initial conclusions.
Write conclusions
4. Management Response
Reporting of M & E results by the school IMET is used to validate
information during the actual MEA.
5. Adjustment of Plan
This can be in terms of modifying the earlier strategies used,
rescheduling of activities, aligning available resources, making decisions
on discontinuing the projects, etc.
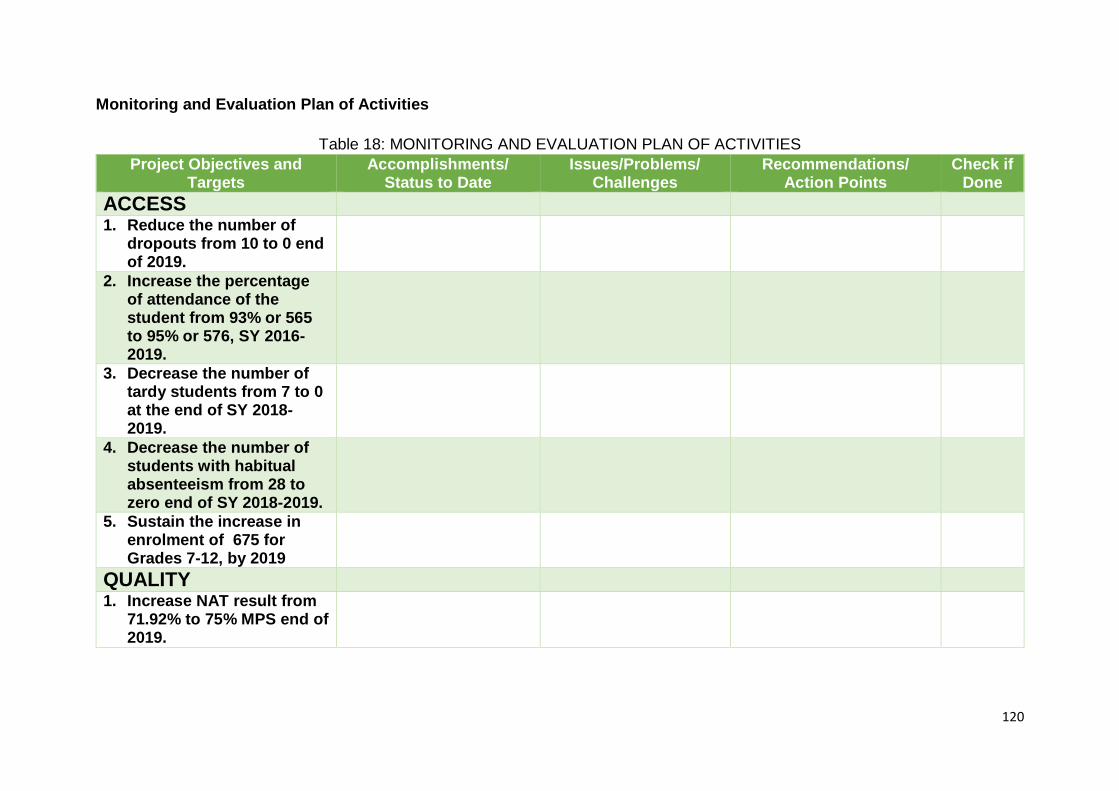
120
Monitoring and Evaluation Plan of Activities
Table 18: MONITORING AND EVALUATION PLAN OF ACTIVITIES
Project Objectives and Targets
Accomplishments/ Status to Date
Issues/Problems/ Challenges
Recommendations/ Action Points
Check if Done
ACCESS 1. Reduce the number of
dropouts from 10 to 0 end of 2019.
2. Increase the percentage of attendance of the student from 93% or 565 to 95% or 576, SY 2016-2019.
3. Decrease the number of tardy students from 7 to 0 at the end of SY 2018-2019.
4. Decrease the number of students with habitual absenteeism from 28 to zero end of SY 2018-2019.
5. Sustain the increase in enrolment of 675 for Grades 7-12, by 2019
QUALITY 1. Increase NAT result from
71.92% to 75% MPS end of 2019.
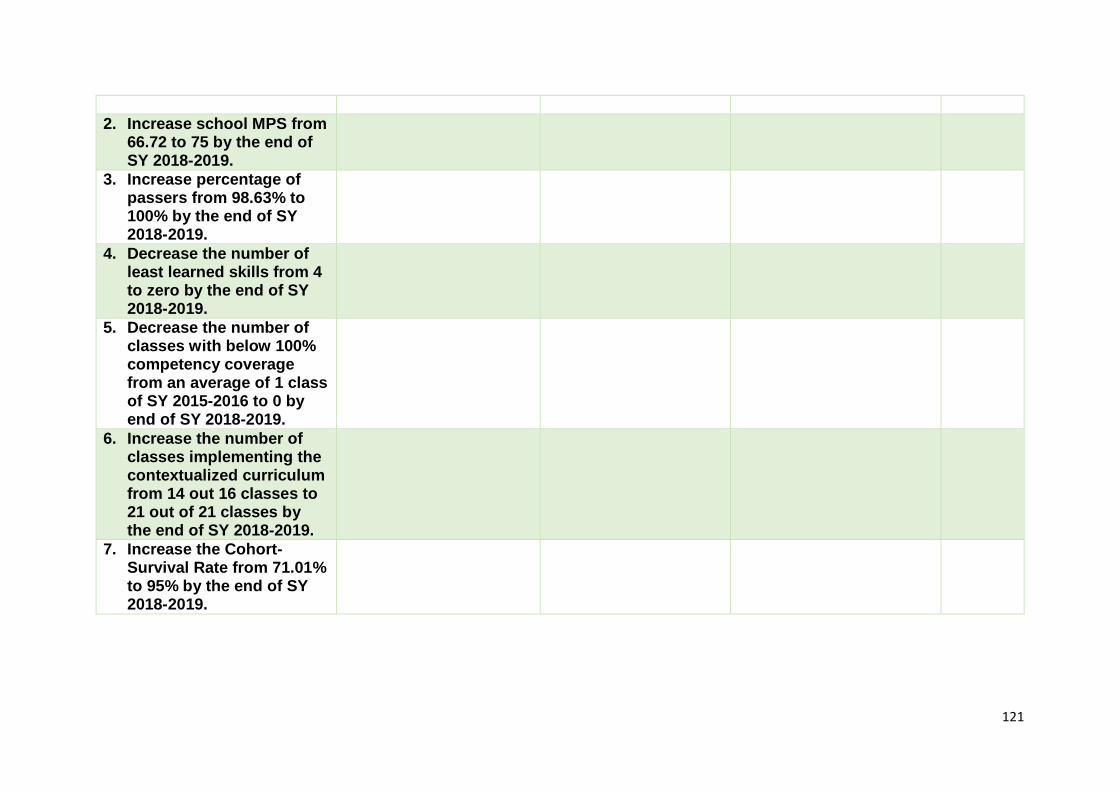
121
2. Increase school MPS from
66.72 to 75 by the end of SY 2018-2019.
3. Increase percentage of passers from 98.63% to 100% by the end of SY 2018-2019.
4. Decrease the number of least learned skills from 4 to zero by the end of SY 2018-2019.
5. Decrease the number of classes with below 100% competency coverage from an average of 1 class of SY 2015-2016 to 0 by end of SY 2018-2019.
6. Increase the number of classes implementing the contextualized curriculum from 14 out 16 classes to 21 out of 21 classes by the end of SY 2018-2019.
7. Increase the Cohort-Survival Rate from 71.01% to 95% by the end of SY 2018-2019.
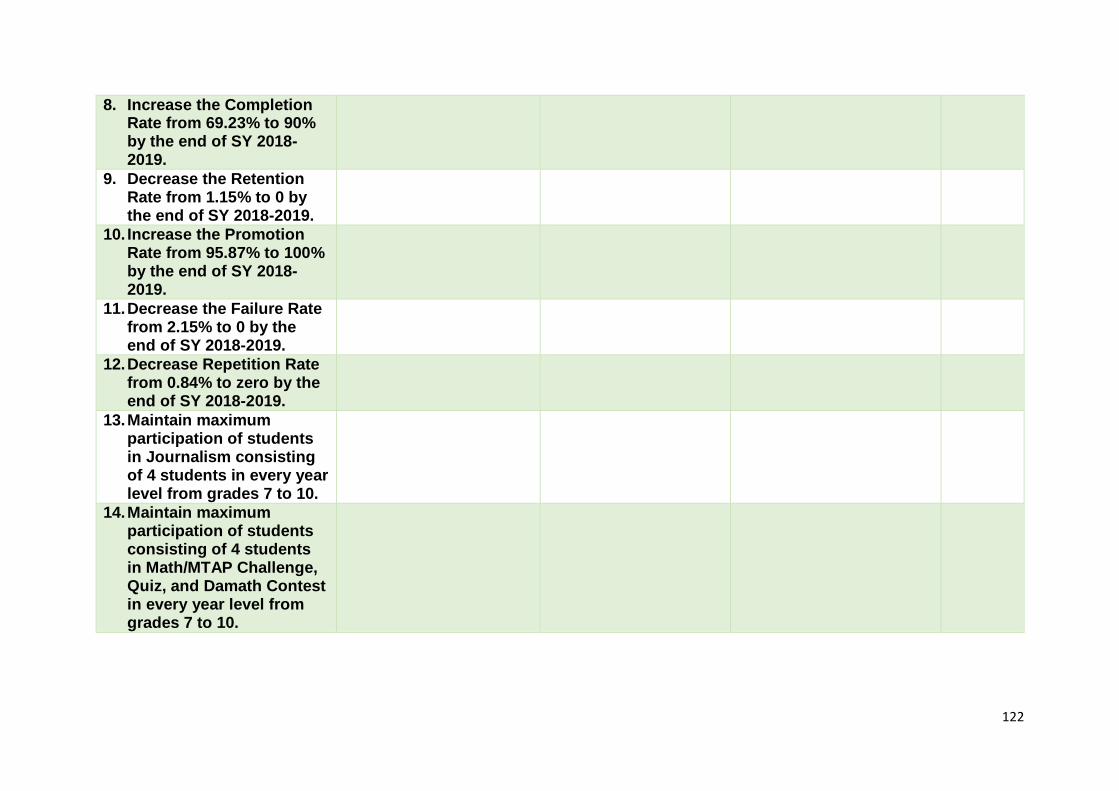
122
8. Increase the Completion Rate from 69.23% to 90% by the end of SY 2018-2019.
9. Decrease the Retention Rate from 1.15% to 0 by the end of SY 2018-2019.
10. Increase the Promotion Rate from 95.87% to 100% by the end of SY 2018-2019.
11. Decrease the Failure Rate from 2.15% to 0 by the end of SY 2018-2019.
12. Decrease Repetition Rate from 0.84% to zero by the end of SY 2018-2019.
13. Maintain maximum participation of students in Journalism consisting of 4 students in every year level from grades 7 to 10.
14. Maintain maximum participation of students consisting of 4 students in Math/MTAP Challenge, Quiz, and Damath Contest in every year level from grades 7 to 10.
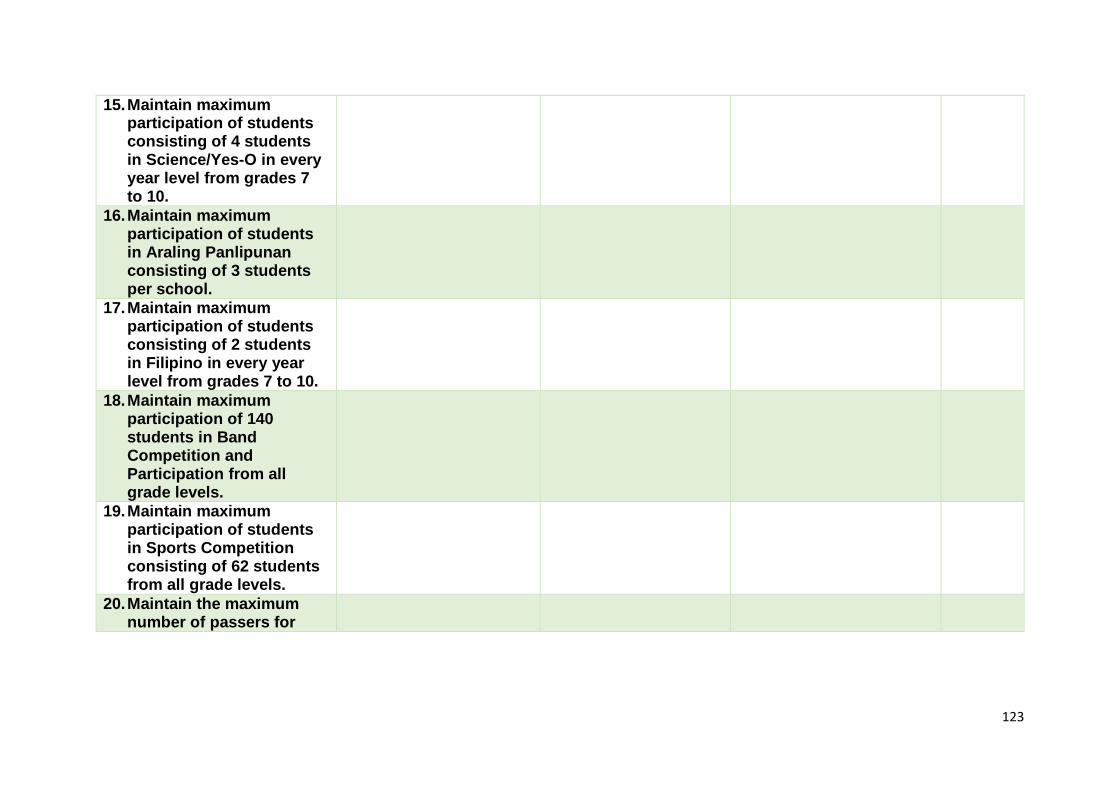
123
15. Maintain maximum participation of students consisting of 4 students in Science/Yes-O in every year level from grades 7 to 10.
16. Maintain maximum participation of students in Araling Panlipunan consisting of 3 students per school.
17. Maintain maximum participation of students consisting of 2 students in Filipino in every year level from grades 7 to 10.
18. Maintain maximum participation of 140 students in Band Competition and Participation from all grade levels.
19. Maintain maximum participation of students in Sports Competition consisting of 62 students from all grade levels.
20. Maintain the maximum number of passers for
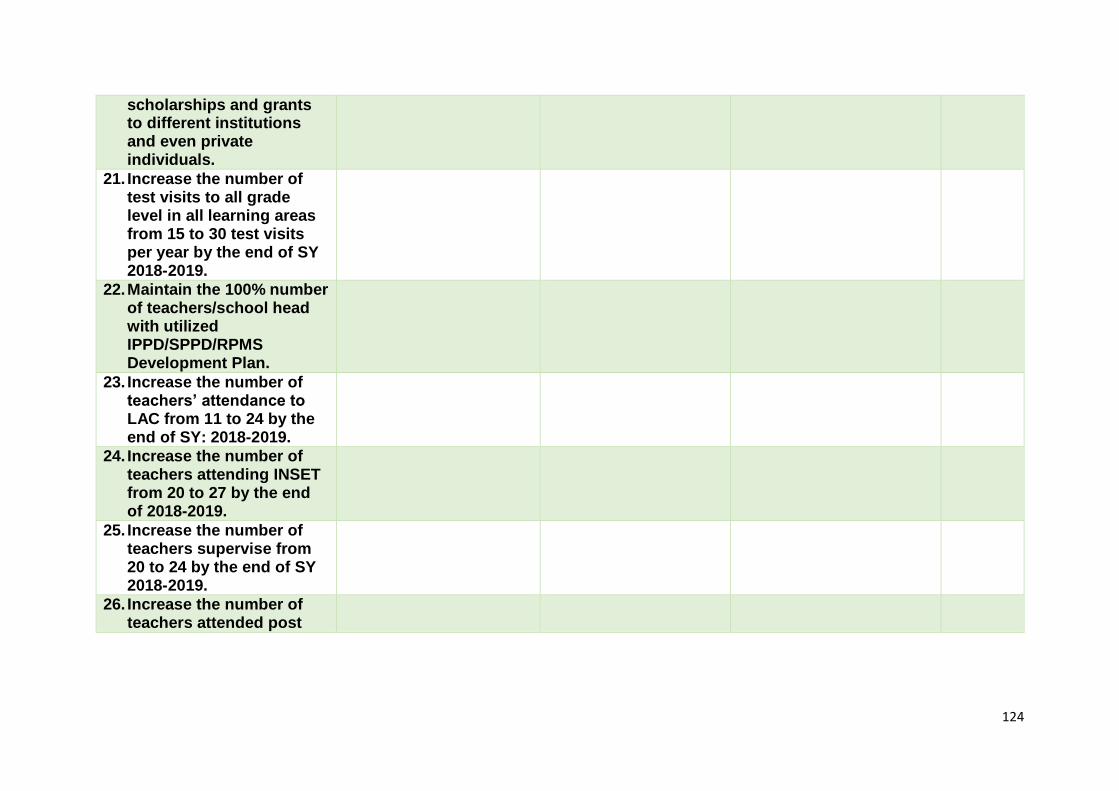
124
scholarships and grants to different institutions and even private individuals.
21. Increase the number of test visits to all grade level in all learning areas from 15 to 30 test visits per year by the end of SY 2018-2019.
22. Maintain the 100% number of teachers/school head with utilized IPPD/SPPD/RPMS Development Plan.
23. Increase the number of teachers’ attendance to LAC from 11 to 24 by the end of SY: 2018-2019.
24. Increase the number of teachers attending INSET from 20 to 27 by the end of 2018-2019.
25. Increase the number of teachers supervise from 20 to 24 by the end of SY 2018-2019.
26. Increase the number of teachers attended post
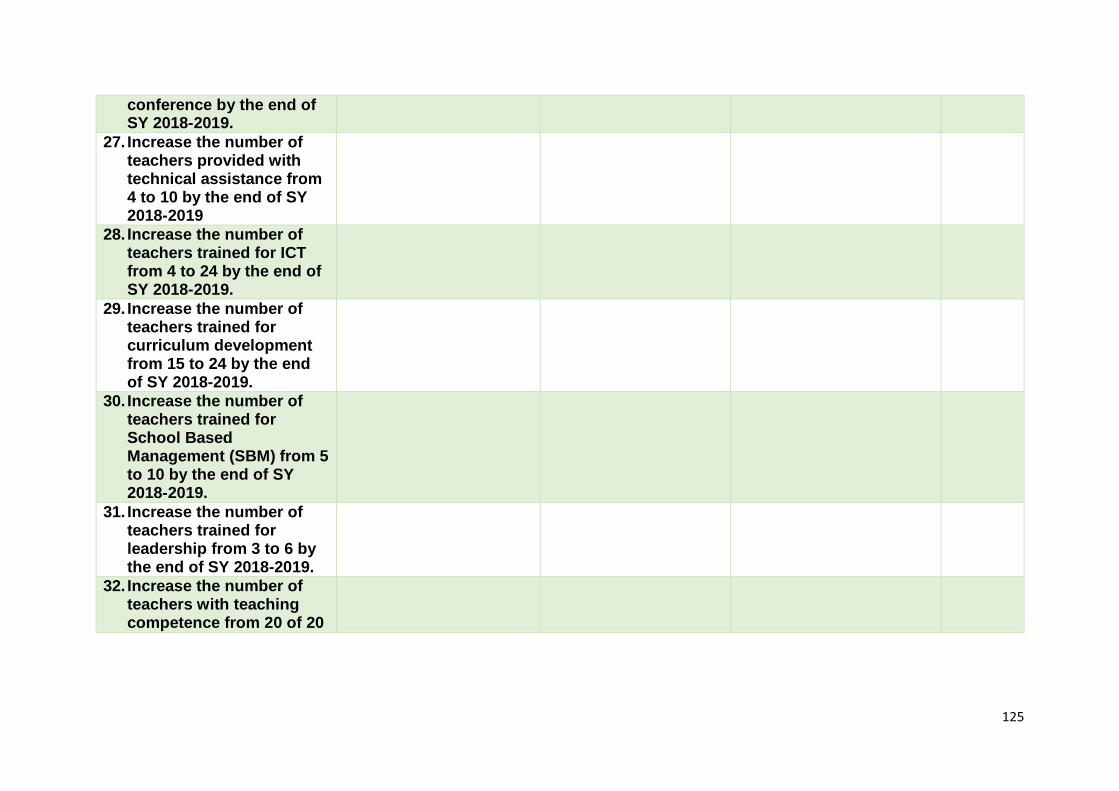
125
conference by the end of SY 2018-2019.
27. Increase the number of teachers provided with technical assistance from 4 to 10 by the end of SY 2018-2019
28. Increase the number of teachers trained for ICT from 4 to 24 by the end of SY 2018-2019.
29. Increase the number of teachers trained for curriculum development from 15 to 24 by the end of SY 2018-2019.
30. Increase the number of teachers trained for School Based Management (SBM) from 5 to 10 by the end of SY 2018-2019.
31. Increase the number of teachers trained for leadership from 3 to 6 by the end of SY 2018-2019.
32. Increase the number of teachers with teaching competence from 20 of 20
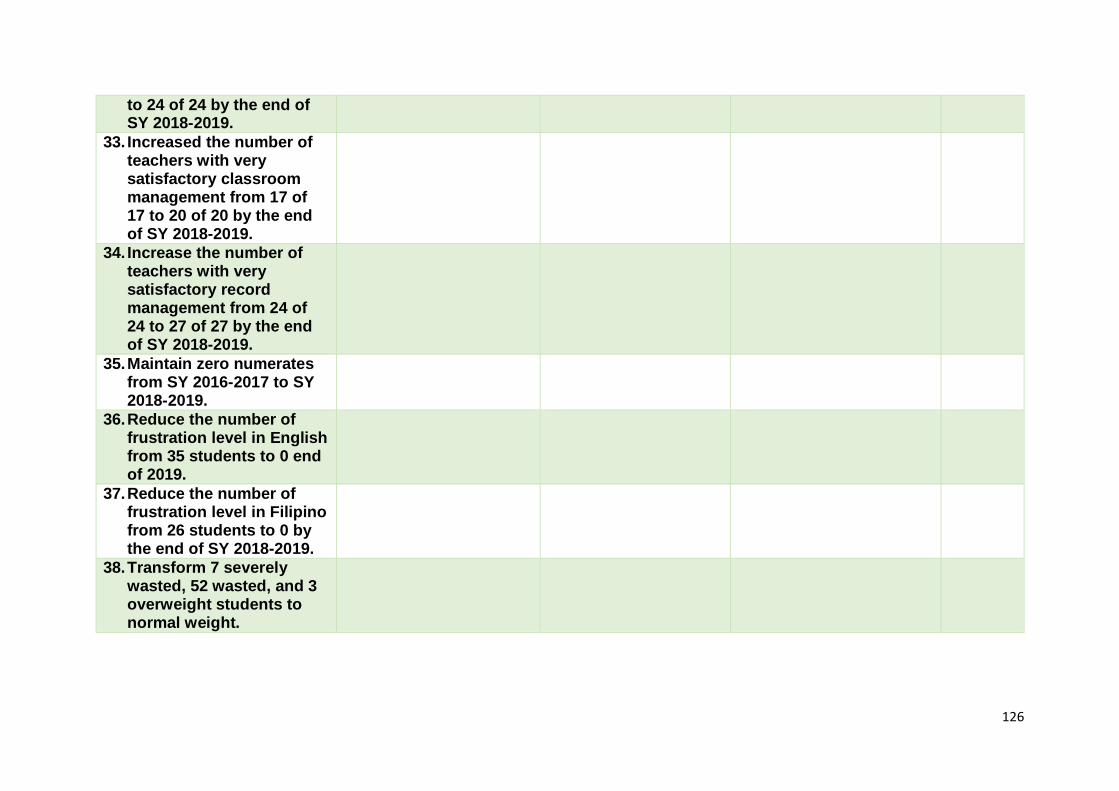
126
to 24 of 24 by the end of SY 2018-2019.
33. Increased the number of teachers with very satisfactory classroom management from 17 of 17 to 20 of 20 by the end of SY 2018-2019.
34. Increase the number of teachers with very satisfactory record management from 24 of 24 to 27 of 27 by the end of SY 2018-2019.
35. Maintain zero numerates from SY 2016-2017 to SY 2018-2019.
36. Reduce the number of frustration level in English from 35 students to 0 end of 2019.
37. Reduce the number of frustration level in Filipino from 26 students to 0 by the end of SY 2018-2019.
38. Transform 7 severely wasted, 52 wasted, and 3 overweight students to normal weight.
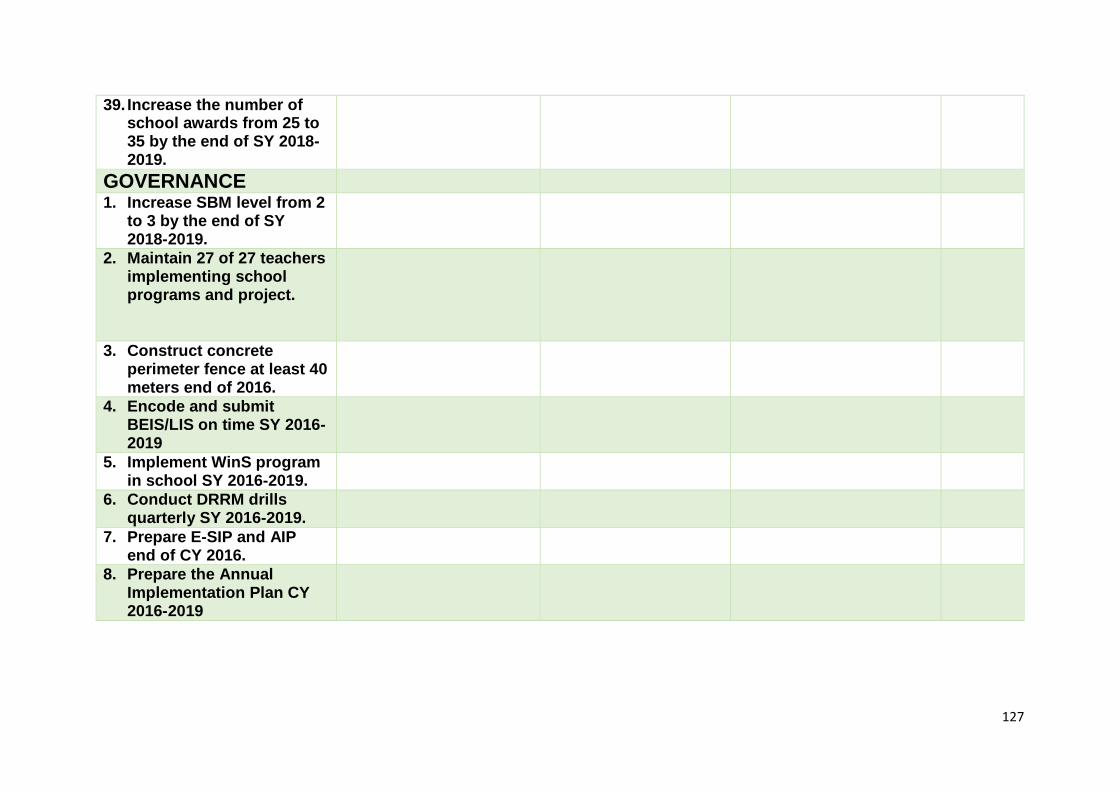
127
39. Increase the number of school awards from 25 to 35 by the end of SY 2018-2019.
GOVERNANCE 1. Increase SBM level from 2
to 3 by the end of SY 2018-2019.
2. Maintain 27 of 27 teachers implementing school programs and project.
3. Construct concrete perimeter fence at least 40 meters end of 2016.
4. Encode and submit BEIS/LIS on time SY 2016-2019
5. Implement WinS program in school SY 2016-2019.
6. Conduct DRRM drills quarterly SY 2016-2019.
7. Prepare E-SIP and AIP end of CY 2016.
8. Prepare the Annual Implementation Plan CY 2016-2019
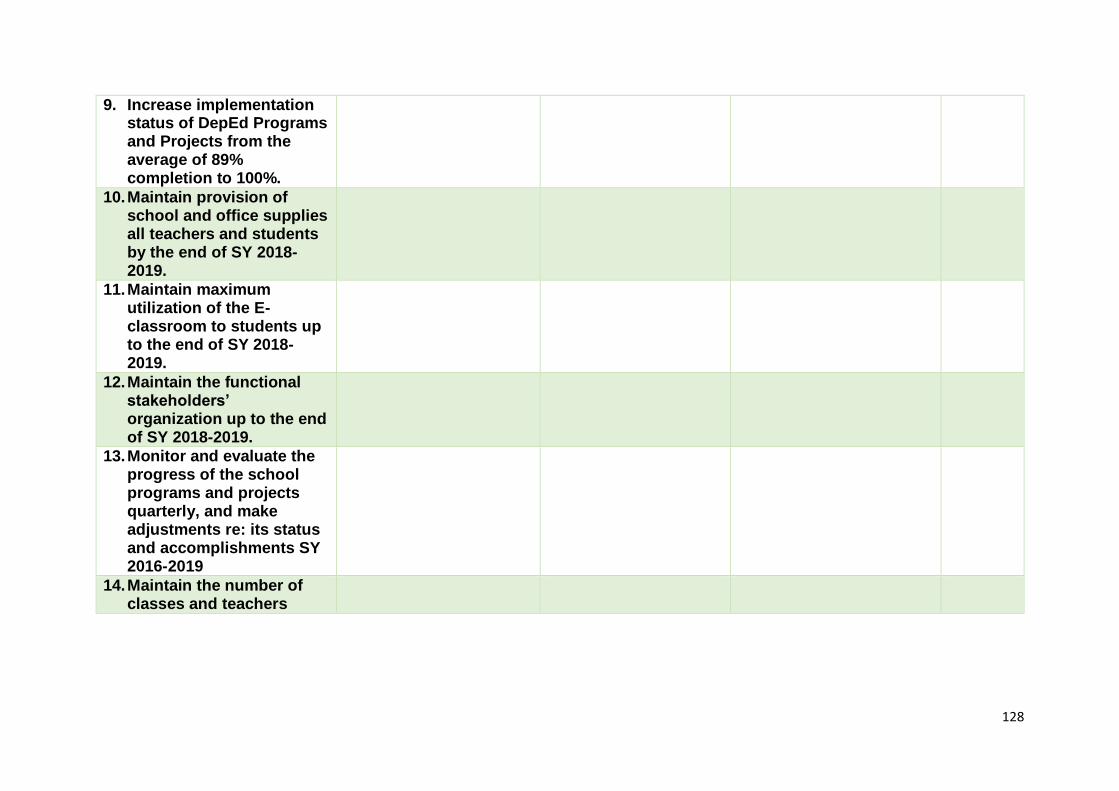
128
9. Increase implementation status of DepEd Programs and Projects from the average of 89% completion to 100%.
10. Maintain provision of school and office supplies all teachers and students by the end of SY 2018-2019.
11. Maintain maximum utilization of the E-classroom to students up to the end of SY 2018-2019.
12. Maintain the functional stakeholders’ organization up to the end of SY 2018-2019.
13. Monitor and evaluate the progress of the school programs and projects quarterly, and make adjustments re: its status and accomplishments SY 2016-2019
14. Maintain the number of classes and teachers
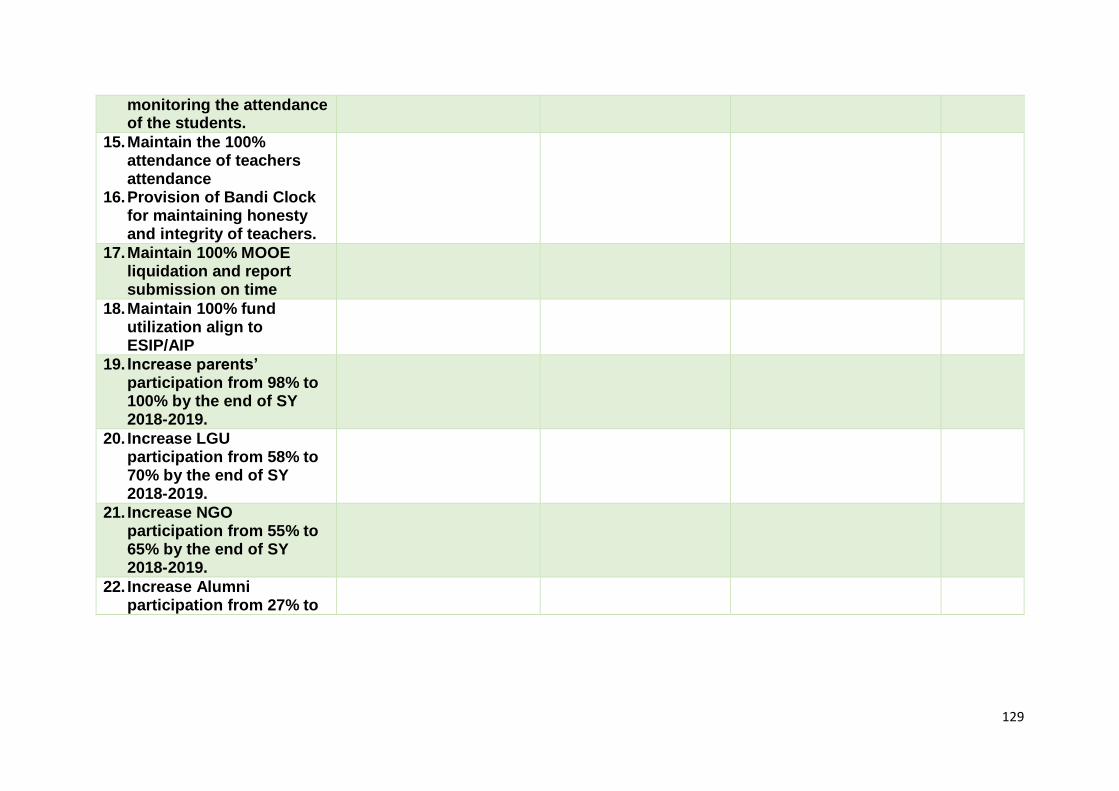
129
monitoring the attendance of the students.
15. Maintain the 100% attendance of teachers attendance
16. Provision of Bandi Clock for maintaining honesty and integrity of teachers.
17. Maintain 100% MOOE liquidation and report submission on time
18. Maintain 100% fund utilization align to ESIP/AIP
19. Increase parents’ participation from 98% to 100% by the end of SY 2018-2019.
20. Increase LGU participation from 58% to 70% by the end of SY 2018-2019.
21. Increase NGO participation from 55% to 65% by the end of SY 2018-2019.
22. Increase Alumni participation from 27% to
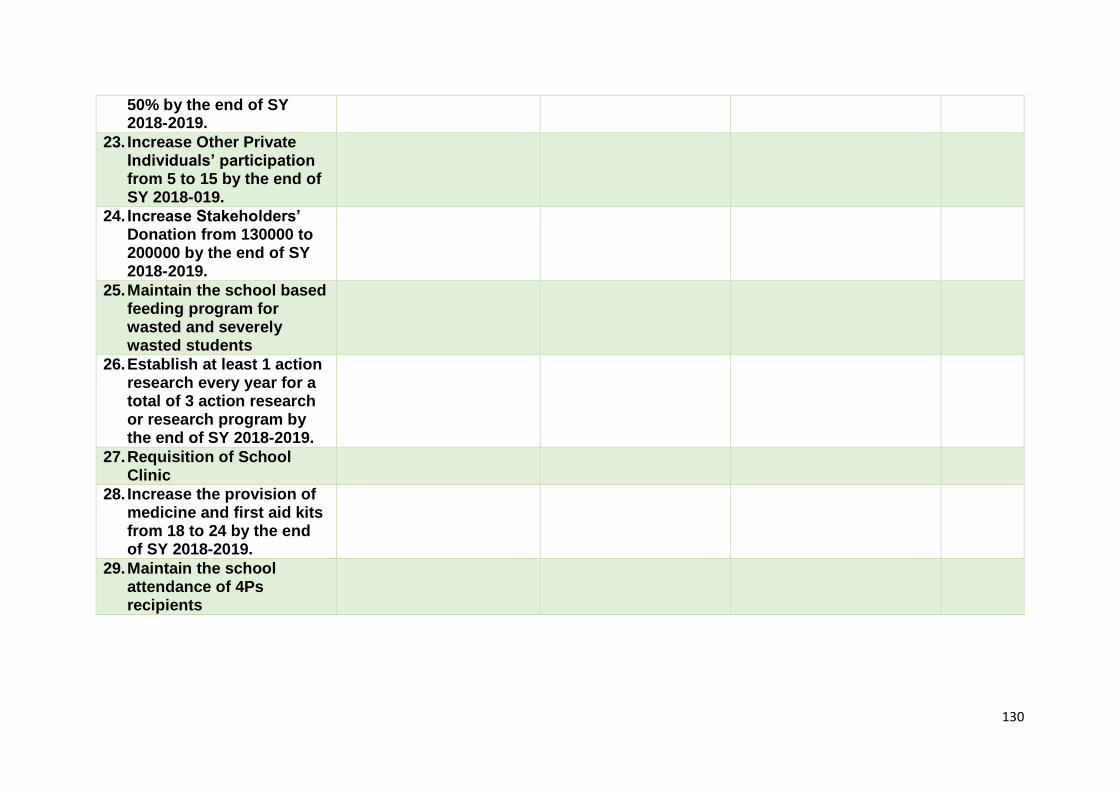
130
50% by the end of SY 2018-2019.
23. Increase Other Private Individuals’ participation from 5 to 15 by the end of SY 2018-019.
24. Increase Stakeholders’ Donation from 130000 to 200000 by the end of SY 2018-2019.
25. Maintain the school based feeding program for wasted and severely wasted students
26. Establish at least 1 action research every year for a total of 3 action research or research program by the end of SY 2018-2019.
27. Requisition of School Clinic
28. Increase the provision of medicine and first aid kits from 18 to 24 by the end of SY 2018-2019.
29. Maintain the school attendance of 4Ps recipients
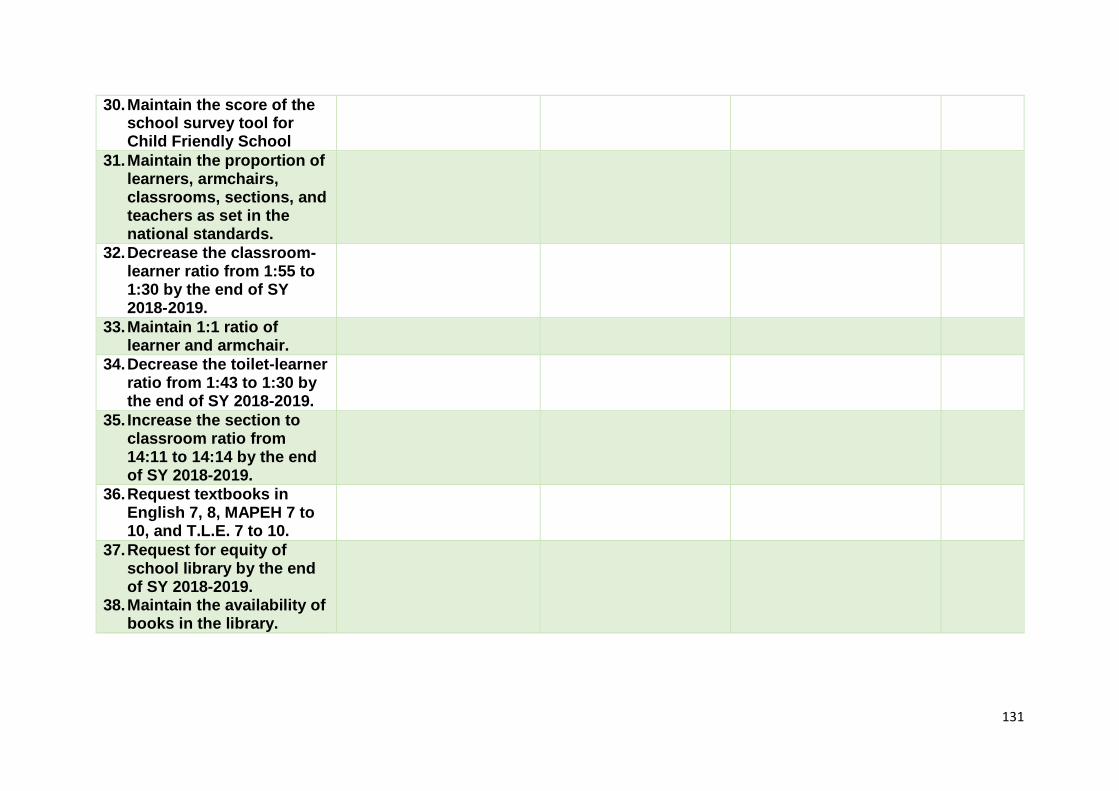
131
30. Maintain the score of the school survey tool for Child Friendly School
31. Maintain the proportion of learners, armchairs, classrooms, sections, and teachers as set in the national standards.
32. Decrease the classroom-learner ratio from 1:55 to 1:30 by the end of SY 2018-2019.
33. Maintain 1:1 ratio of learner and armchair.
34. Decrease the toilet-learner ratio from 1:43 to 1:30 by the end of SY 2018-2019.
35. Increase the section to classroom ratio from 14:11 to 14:14 by the end of SY 2018-2019.
36. Request textbooks in English 7, 8, MAPEH 7 to 10, and T.L.E. 7 to 10.
37. Request for equity of school library by the end of SY 2018-2019.
38. Maintain the availability of books in the library.
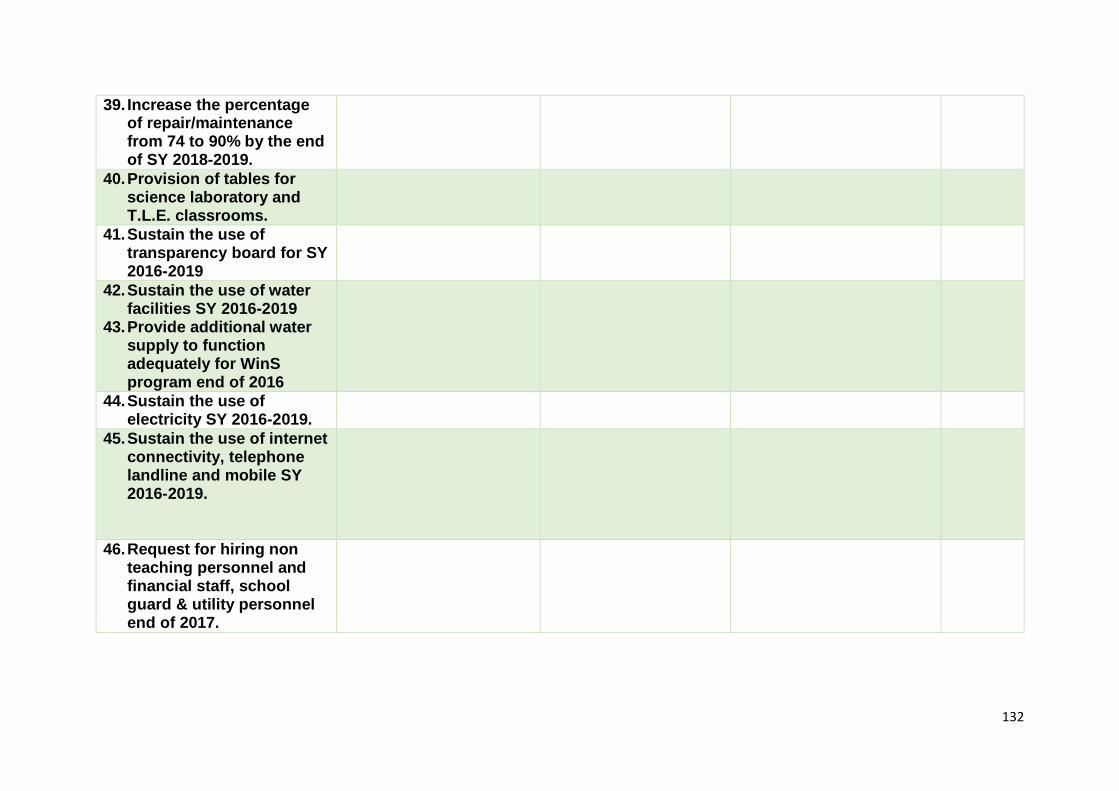
132
39. Increase the percentage of repair/maintenance from 74 to 90% by the end of SY 2018-2019.
40. Provision of tables for science laboratory and T.L.E. classrooms.
41. Sustain the use of transparency board for SY 2016-2019
42. Sustain the use of water facilities SY 2016-2019
43. Provide additional water supply to function adequately for WinS program end of 2016
44. Sustain the use of electricity SY 2016-2019.
45. Sustain the use of internet connectivity, telephone landline and mobile SY 2016-2019.
46. Request for hiring non teaching personnel and financial staff, school guard & utility personnel end of 2017.

133
47. Improve the stakeholders attendance from 85% to 95% in school prog. and projects SY 2016-2019
48. Increase the number of parents and stakeholders from 30 to 50 who support school-based feeding program.
49. Request SEF funds of P20,000.00 from LGU CY 2016-2019
50. Increase the number of registered Boy/Girl Scouts from 40 to 120 SY 2016-2019
51. Provide list of qualified 4Ps every year from DSWD CY 2016-2019.
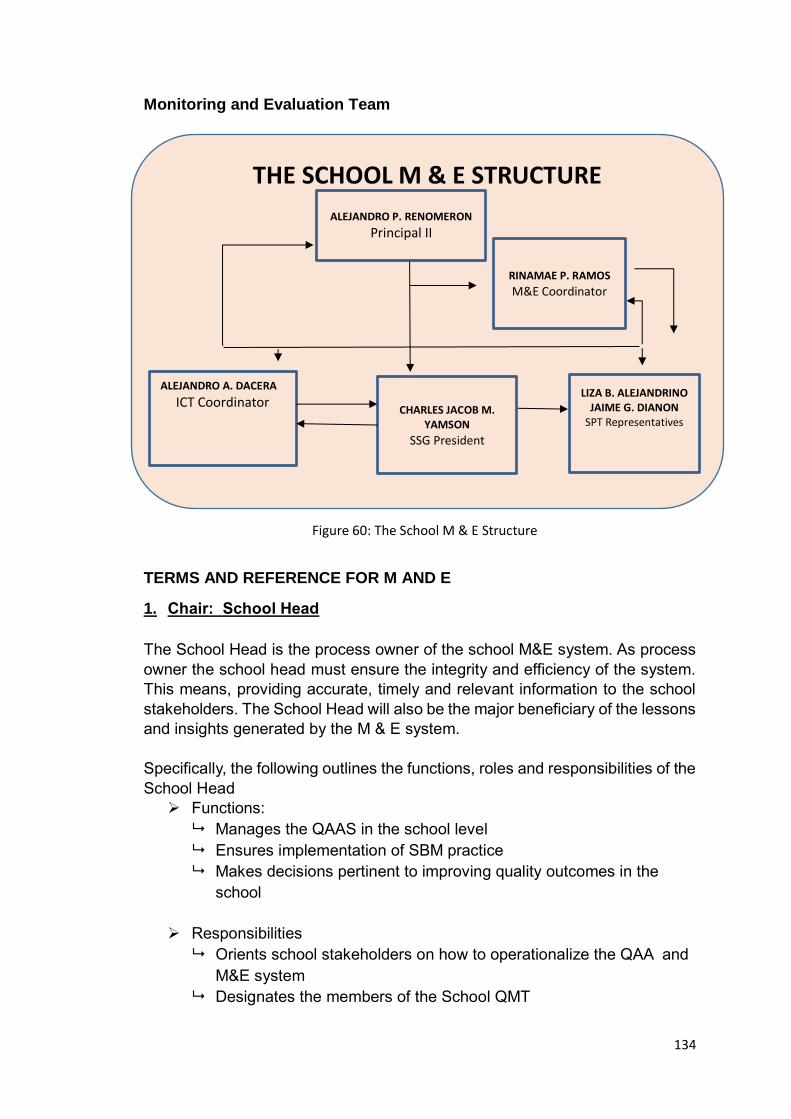
134
THE SCHOOL M & E STRUCTURE
Monitoring and Evaluation Team
TERMS AND REFERENCE FOR M AND E
1. Chair: School Head
The School Head is the process owner of the school M&E system. As process
owner the school head must ensure the integrity and efficiency of the system.
This means, providing accurate, timely and relevant information to the school
stakeholders. The School Head will also be the major beneficiary of the lessons
and insights generated by the M & E system.
Specifically, the following outlines the functions, roles and responsibilities of the
School Head
Functions:
Manages the QAAS in the school level
Ensures implementation of SBM practice
Makes decisions pertinent to improving quality outcomes in the
school
Responsibilities
Orients school stakeholders on how to operationalize the QAA and
M&E system
Designates the members of the School QMT
ALEJANDRO P. RENOMERON
Principal II
RINAMAE P. RAMOS
M&E Coordinator
ALEJANDRO A. DACERA ICT Coordinator
CHARLES JACOB M. YAMSON
SSG President
LIZA B. ALEJANDRINO JAIME G. DIANON
SPT Representatives
Figure 60: The School M & E Structure
135
Designs monitoring and feedback system (e.g. flow of reports and
feedback, reporting schedules, monitoring and feedback forms);
Convenes School QMT regularly to discuss M & E concerns
together with implementation team
Communicates the learners' progress to intended stakeholders
Submits quarterly accomplishment report to SDS and school
stakeholders
Interacts with SDS and school internal and external stakeholders
2. School M & E Coordinator
The M & E Coordinator is responsible for the overall M & E strategy and
implementation within the school following the M & E framework for the
school. The M & E Coordinator shall report directly to the School Head and
shall provide him/her with interpretation and analysis of M & E data. The
following outlines the roles and functions and responsibilities of the M & E
Coordinator
Functions: Monitors and evaluates regularly the implementation of school
improvement plan Responsibilities:
Conducts monitoring process during plan implementation Analyses and interprets M & E data for SH and project teams Evaluates results of SIP implementation which will be made as
basis for planning interventions and other plan adjustments Prepares regular M & E reports and submits to SH Interacts with SH and other members of the SQMT
3. Department Heads/Department Chairs (2)
Function: Manages M&E of learning outcomes
Responsibilities: Tracks/Monitors school and learner performance Recommends to the SH actions to improve learner achievement Submits quarterly consolidated learners performance report to
School Head and School M&E Team Interacts with School M&E Coordinator and teachers and
department chairs. 4. SPT Representative (Parent/LGU Rep)
Function: Monitors the implementation of SIP
Responsibility Updates M & E plan during SIP revisit
5. ICT Coordinator /Computer teacher Function:
Manages School Information System (SIS)
136
Responsibility: Gathers, records, organizes, stores data, and ensures that
school records are complete and up to date Interacts with School M&E coordinator and Department Chairs

137