adipic acid - a case of carbon leakage?
TRANSCRIPT
WP-US-1006
Industrial N2O Projects Under the CDM:
Adipic Acid - A Case of Carbon Leakage?
Lambert Schneider, Michael Lazarus, Anja Kollmuss
October 9, 2010
Stockholm Environment Institute
Working Paper WP-US-1006
Abstract
This paper evaluates projects under the Clean Development Mechanism (CDM) that abate N2O emissions from adipic acid production. The research shows that carbon markets enabled N2O emissions abatement levels that had not previously been achieved. However, data on adipic acid production, plant utilization and international trade patterns show that the CDM appears to have caused significant carbon leakage during the economic downturn in 2008 and 2009. Adipic acid production partially shifted from plants which installed abatement technology in the 1990s to CDM plants. Though the full extent of that leakage is uncertain; we estimate that about 20% of the CERs issued for CDM adipic acid plants for 2008 and 2009 – totaling to about 13.5 MtCO2e – do not represent real emission reductions. The paper also evaluates policy solutions to prevent carbon leakage in the future.
Adipic Acid - A Case of Carbon Leakage? WP-US-1006
1
Copyright © 2010 by the Stockholm Environment Institute
This publication may be reproduced in whole or in part and in any form for educational or non-profit purposes, without special permission from the copyright holder(s) provided acknowledgement of the source is made. No use of this publication may be made for resale or other commercial purpose, without the written permission of the copyright holder(s). For more information about this document, contact Anja Kollmuss at [email protected]. Stockholm Environment Institute - US 11 Curtis Avenue Somerville, MA 02144-1224, USA www.sei-us.org and www.sei-international.org
Acknowledgements This report was commissioned by CDM Watch.
Adipic Acid - A Case of Carbon Leakage? WP-US-1006
2
Introduction
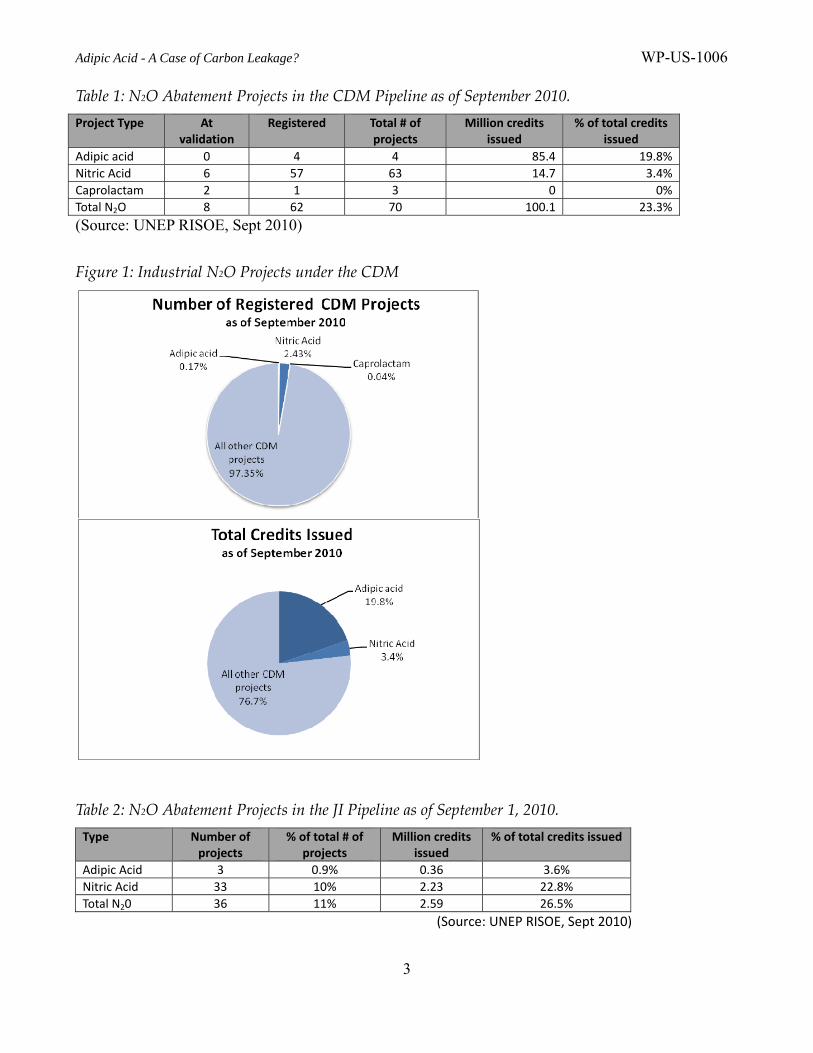
Over the past years, industrial gas projects implemented under the Clean Development Mechanism (CDM) have come under increased scrutiny, in particular HFC-23 from HCFC-22 production and N2O from adipic acid and nitric acid production. Although they make up only 2% of the projects in the CDM pipeline, industrial gas projects account for the lion’s share of emissions credits or CERs issued under the CDM (74% as of September 2010). With abatement costs that tend to be quite low (EUR 0.1 to EUR 4/tCO2e) relative to the price of CERs, these projects can generate very large profits that may lead to unintended consequences. An assessment of monitoring data from HFC-23 projects indicated that HCFC-22 plant operators increased their HCFC-22 production and HFC-23 generation in order to maximize revenues from the CDM (Schneider, in press). The EU Commission announced recently that it will propose limits on the use of industrial gas projects for the third trading period of the European Emissions Trading Scheme (ETS), starting in 2013. This paper addresses the case of adipic acid projects under the CDM and considers whether these projects pose a risk to environmental integrity. A second paper (Kollmuss et al, forthcoming) focuses on nitric acid projects. Both of our papers focus on the question of overall emissions impacts of these project types and discuss policy solutions that could address the identified shortcomings. These papers are meant to contribute to a constructive discussion on how to improve CDM performance by strengthening its environmental integrity and addressing any economic distortions that crediting mechanisms might create. Nitrous oxide (N2O) is a powerful greenhouse gas (GHG), with a global warming potential of 310 over a 100-year timeframe and an atmospheric lifetime of 114 years.1 N2O emissions account for approximately 9% of global annual GHG emissions, and their atmospheric concentration has increased by 15% since 1750 (IPCC FAR, 2007). Agricultural activity accounts for the large majority of global anthropogenic N2O emissions. Industrial processes, specifically the manufacture of adipic acid and nitric acid, also generate N2O as an unwanted by-product during production. Industrial N2O projects play a large role in the CDM. To date, almost a quarter of all issued CERs come from industrial N2O projects. Of those, 85% are from adipic acid projects and 15% from nitric acid projects, as shown in Table 1. These projects make only 3% of the projects registered under the CDM. Nitric acid projects produce on average 1.4 times as many CERs as the average CDM project, whereas adipic projects produce on average 116 times as many CERs2. Under Joint Implementation (JI), three adipic acid and 33 nitric acid projects are currently in the pipeline (table 2). As with CDM, industrial N2O projects under JI account for about a quarter of total credits issued to date; in the case of JI, however, the crediting of nitric acid projects dominates.
1 This GWP value is based on the Second Assessment Report of the IPCC and used during the first commitment period
under the Kyoto Protocol until 2010. The GWP in the Fourth Assessment Report is 298. 2 Based on total projects registered (CDM total: 2344) and total credits issued as of Sept 2010 (CDM total: 430,298,000).
Adipic Acid - A Case of Carbon Leakage? WP-US-1006
3
Table 1: N2O Abatement Projects in the CDM Pipeline as of September 2010.
Project Type At validation
Registered Total # of projects
Million credits issued
% of total credits issued
Adipic acid 0 4 4 85.4 19.8%
Nitric Acid 6 57 63 14.7 3.4%
Caprolactam 2 1 3 0 0%
Total N2O 8 62 70 100.1 23.3%
(Source: UNEP RISOE, Sept 2010)
Figure 1: Industrial N2O Projects under the CDM
Table 2: N2O Abatement Projects in the JI Pipeline as of September 1, 2010.
Type Number of projects
% of total # of projects
Million credits issued
% of total credits issued
Adipic Acid 3 0.9% 0.36 3.6%
Nitric Acid 33 10% 2.23 22.8%
Total N20 36 11% 2.59 26.5%
(Source: UNEP RISOE, Sept 2010)
Adipic Acid - A Case of Carbon Leakage? WP-US-1006
4
This paper focuses on the major concern we have identified with respect to adipic acid projects: whether the economic incentives provided by the CDM have caused adipic acid production to shift to CDM project plants and, as a result, inadvertently led to “carbon leakage.” We begin by providing an overview of the adipic acid sector. We then evaluate the operation and performance of CDM and JI projects, followed by an assessment of the economic incentives created by the CDM and JI and the overall emissions impact of shifts of adipic acid production among CDM, JI, and other adipic acid plants. We then analyze data on adipic acid production, plant utilization and international trade to assess to what extent the CDM may have caused carbon leakage. Based on this assessment we draw conclusions and discuss policy solutions that could address the identified shortcomings. . All information in this report on plant capacities, plant utilization factors, and trade patterns of adipic acid and the use of GHG abatement technology at the plants was provided by PCI Nylon GmbH.3
Adipic acid production and abatement of N2O
Adipic acid is an organic chemical that is used as a building block in a range of different products, most importantly polyamide, often referred to as “nylon.” Other applications include the production of polyurethanes and plasticizers. The quality of adipic acid is generally very homogenous, since most applications require high purity. Adipic acid is a globally traded commodity, with more than one-third of the production traded internationally. China is the largest importer; the European Union and the United States are the most important exporters.
Currently, 23 adipic acid plants are known to exist. They are all located in industrialized countries or in emerging economies. Global adipic acid production capacity was about 3,000 kt in 2010, with most of the capacity located in the United States (30%), the European Union (29%) and China (22%). Other producing countries include Brazil, Japan, Singapore, South Korea, and the Ukraine. Small quantities are also produced in India. Two plants located in the United Kingdom and in Canada were shut down recently. More than half of the production capacity is located in integrated chemical complexes that use the adipic acid at the site of production. These plants generally use the majority of their adipic acid production for nylon manufacturing and sell a small quantity in the market.
Nitrous oxide (N2O) is an unwanted by-product of adipic acid production. The formation of N2O cannot be avoided; it is the result of using nitric acid to oxidize cyclohexanone and/or cyclohexanol. The amount of N2O generated is proportional to the amount of adipic acid produced; it slightly depends on whether the plant uses cyclohexanone or cyclohexanol or a mix of both, but the differences are small. Generally, the amount of N2O generated varies very little over time and among plants. The 2006 IPCC Guidelines for National GHG Inventories provide a default value for N2O formation of 300 kg N2O / t adipic acid, with an uncertainty range of +/-10% (IPCC 2006, page 3.30). The CDM methodology for adipic acid plants4 uses the lower end of this range, i.e. 270 kg N2O / t adipic acid, as the maximum baseline emission rate. Project developers are also required to calculate baseline emissions based on the consumption of nitric acid and to measure the amount of N2O generated. To ensure a conservative approach, the lower of these three approaches is used to calculate baseline emissions. Project emissions are calculated by measuring the N2O concentration in the waste gas.
Nitrous oxide in the waste gas stream can be abated in different ways: by catalytic destruction, by thermal decomposition, by using the N2O for nitric acid production, or by recycling the N2O as
3 See http://pcinylon.com 4 Baseline and monitoring methodology AM0021 for decomposition of N2O from existing adipic acid production plants,
published at http://cdm.unfccc.int.
Adipic Acid - A Case of Carbon Leakage? WP-US-1006
5
feedstock for adipic acid production. These methods typically reach an abatement level of about 90% (IPCC 2006, page 3.30, Ecofys 2009, page 44). Abatement is not complete, as residual N2O emissions can occur due to regular and unplanned downtimes of the N2O abatement device and due to small fractions of N2O which are not decomposed.
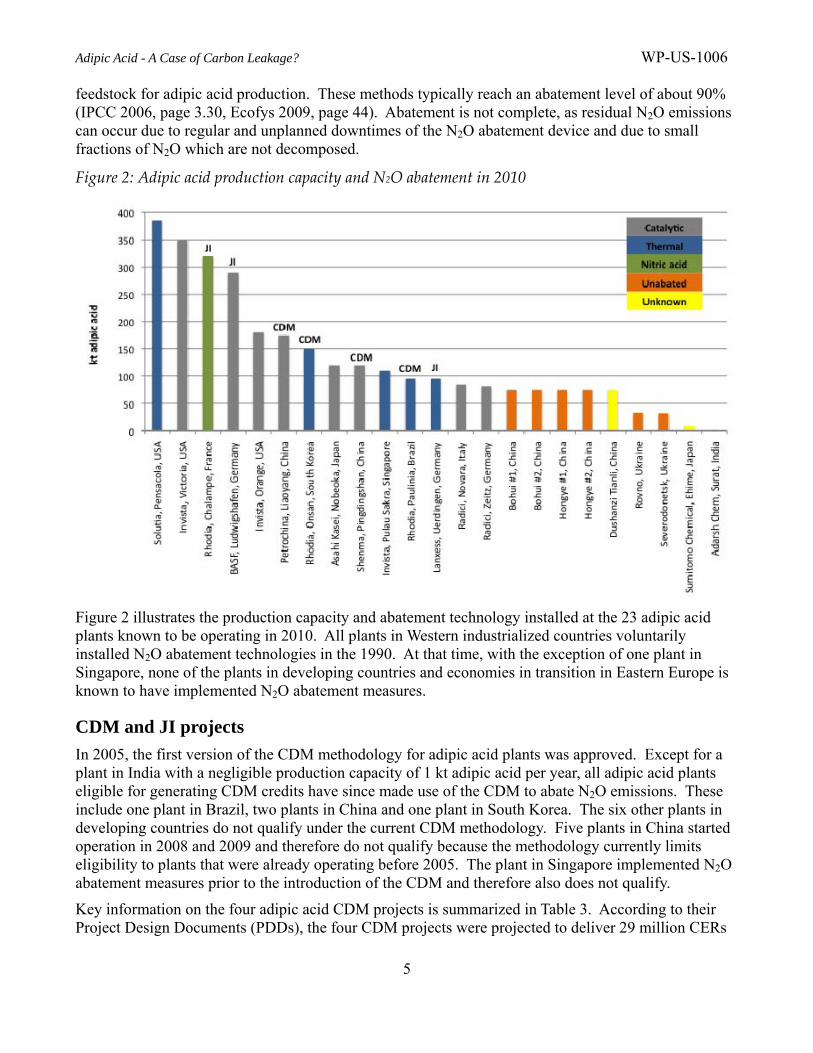
Figure 2: Adipic acid production capacity and N2O abatement in 2010
Figure 2 illustrates the production capacity and abatement technology installed at the 23 adipic acid plants known to be operating in 2010. All plants in Western industrialized countries voluntarily installed N2O abatement technologies in the 1990. At that time, with the exception of one plant in Singapore, none of the plants in developing countries and economies in transition in Eastern Europe is known to have implemented N2O abatement measures.
CDM and JI projects
In 2005, the first version of the CDM methodology for adipic acid plants was approved. Except for a plant in India with a negligible production capacity of 1 kt adipic acid per year, all adipic acid plants eligible for generating CDM credits have since made use of the CDM to abate N2O emissions. These include one plant in Brazil, two plants in China and one plant in South Korea. The six other plants in developing countries do not qualify under the current CDM methodology. Five plants in China started operation in 2008 and 2009 and therefore do not qualify because the methodology currently limits eligibility to plants that were already operating before 2005. The plant in Singapore implemented N2O abatement measures prior to the introduction of the CDM and therefore also does not qualify.
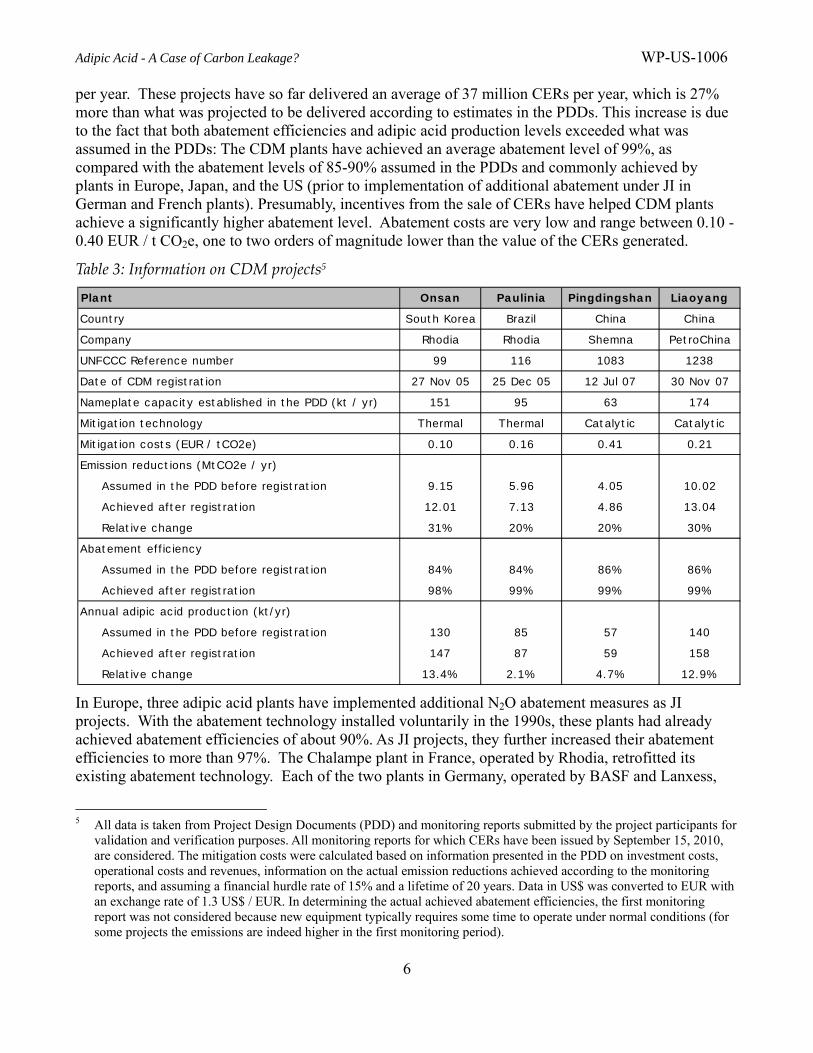
Key information on the four adipic acid CDM projects is summarized in Table 3. According to their Project Design Documents (PDDs), the four CDM projects were projected to deliver 29 million CERs
Adipic Acid - A Case of Carbon Leakage? WP-US-1006
6
per year. These projects have so far delivered an average of 37 million CERs per year, which is 27% more than what was projected to be delivered according to estimates in the PDDs. This increase is due to the fact that both abatement efficiencies and adipic acid production levels exceeded what was assumed in the PDDs: The CDM plants have achieved an average abatement level of 99%, as compared with the abatement levels of 85-90% assumed in the PDDs and commonly achieved by plants in Europe, Japan, and the US (prior to implementation of additional abatement under JI in German and French plants). Presumably, incentives from the sale of CERs have helped CDM plants achieve a significantly higher abatement level. Abatement costs are very low and range between 0.10 - 0.40 EUR / t CO2e, one to two orders of magnitude lower than the value of the CERs generated.
Table 3: Information on CDM projects5
In Europe, three adipic acid plants have implemented additional N2O abatement measures as JI projects. With the abatement technology installed voluntarily in the 1990s, these plants had already achieved abatement efficiencies of about 90%. As JI projects, they further increased their abatement efficiencies to more than 97%. The Chalampe plant in France, operated by Rhodia, retrofitted its existing abatement technology. Each of the two plants in Germany, operated by BASF and Lanxess,
5 All data is taken from Project Design Documents (PDD) and monitoring reports submitted by the project participants for
validation and verification purposes. All monitoring reports for which CERs have been issued by September 15, 2010, are considered. The mitigation costs were calculated based on information presented in the PDD on investment costs, operational costs and revenues, information on the actual emission reductions achieved according to the monitoring reports, and assuming a financial hurdle rate of 15% and a lifetime of 20 years. Data in US$ was converted to EUR with an exchange rate of 1.3 US$ / EUR. In determining the actual achieved abatement efficiencies, the first monitoring report was not considered because new equipment typically requires some time to operate under normal conditions (for some projects the emissions are indeed higher in the first monitoring period).
Plant Onsan Paulinia Pingdingshan Liaoyang
Country South Korea Brazil China China
Company Rhodia Rhodia Shemna PetroChina
UNFCCC Reference number 99 116 1083 1238
Date of CDM registration 27 Nov 05 25 Dec 05 12 Jul 07 30 Nov 07
Nameplate capacity established in the PDD (kt / yr) 151 95 63 174
Mitigation technology Thermal Thermal Catalytic Catalytic
Mitigation costs (EUR / tCO2e) 0.10 0.16 0.41 0.21
Emission reductions (MtCO2e / yr)
Assumed in the PDD before registration 9.15 5.96 4.05 10.02
Achieved after registration 12.01 7.13 4.86 13.04
Relative change 31% 20% 20% 30%
Abatement efficiency
Assumed in the PDD before registration 84% 84% 86% 86%
Achieved after registration 98% 99% 99% 99%
Annual adipic acid production (kt/yr)
Assumed in the PDD before registration 130 85 57 140
Achieved after registration 147 87 59 158
Relative change 13.4% 2.1% 4.7% 12.9%
Adipic Acid - A Case of Carbon Leakage? WP-US-1006
7
installed a second, redundant N2O abatement facility that minimizes the overall downtimes of the N2O abatement system.
Adipic acid plants in Italy and Japan are not eligible for JI because these countries do not allow for national JI projects to be implemented. Plants in the United States also do not qualify for JI because the US did not ratify the Kyoto Protocol. Two other plants in Poland and Romania (not listed in Figure 2) are apparently not operating.6 The remaining three plants shown in Figure 2 could potentially qualify as JI projects: the plant operated by Radici in Zeitz, Germany, and two plants in the Ukraine. It is not known why these plants have not as yet used the JI mechanism to implement (additional) abatement measures.
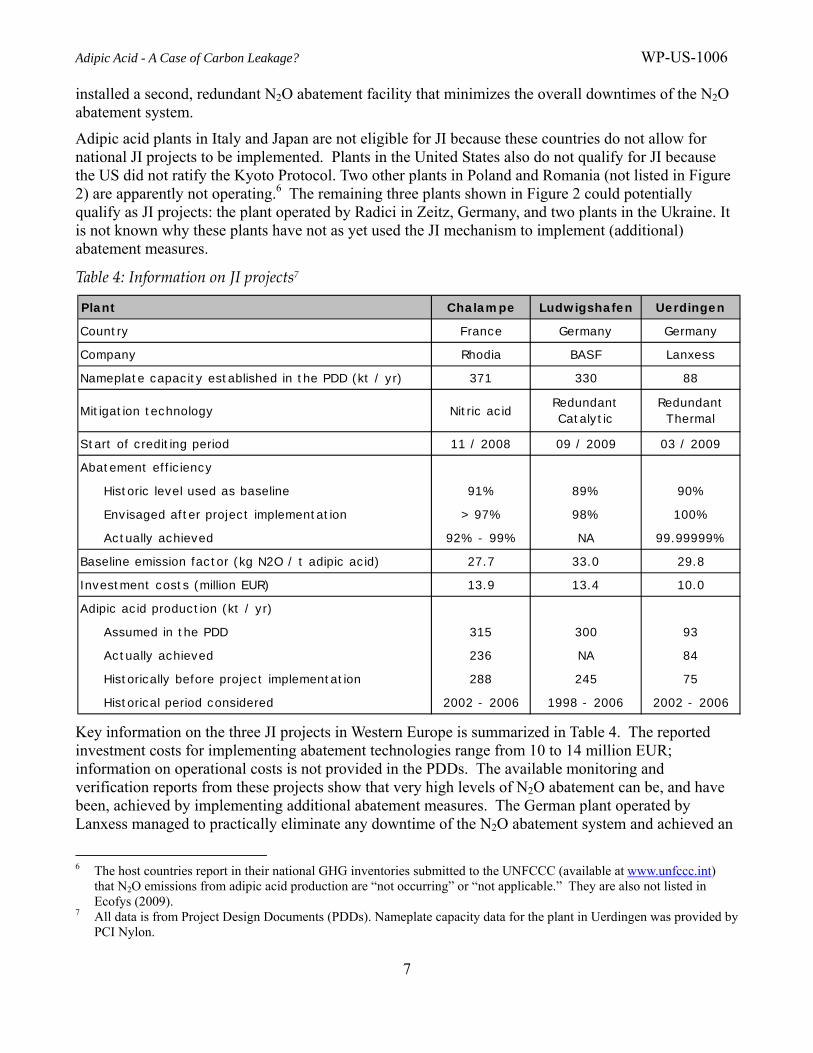
Table 4: Information on JI projects7
Key information on the three JI projects in Western Europe is summarized in Table 4. The reported investment costs for implementing abatement technologies range from 10 to 14 million EUR; information on operational costs is not provided in the PDDs. The available monitoring and verification reports from these projects show that very high levels of N2O abatement can be, and have been, achieved by implementing additional abatement measures. The German plant operated by Lanxess managed to practically eliminate any downtime of the N2O abatement system and achieved an
6 The host countries report in their national GHG inventories submitted to the UNFCCC (available at www.unfccc.int)
that N2O emissions from adipic acid production are “not occurring” or “not applicable.” They are also not listed in Ecofys (2009).
7 All data is from Project Design Documents (PDDs). Nameplate capacity data for the plant in Uerdingen was provided by PCI Nylon.
Plant Chalampe Ludwigshafen Uerdingen
Country France Germany Germany
Company Rhodia BASF Lanxess
Nameplate capacity established in the PDD (kt / yr) 371 330 88
Mitigation technology Nitric acidRedundant Catalytic
Redundant Thermal
Start of crediting period 11 / 2008 09 / 2009 03 / 2009
Abatement efficiency
Historic level used as baseline 91% 89% 90%
Envisaged after project implementation > 97% 98% 100%
Actually achieved 92% - 99% NA 99.99999%
Baseline emission factor (kg N2O / t adipic acid) 27.7 33.0 29.8
Investment costs (million EUR) 13.9 13.4 10.0
Adipic acid production (kt / yr)
Assumed in the PDD 315 300 93
Actually achieved 236 NA 84
Historically before project implementation 288 245 75
Historical period considered 2002 - 2006 1998 - 2006 2002 - 2006
Adipic Acid - A Case of Carbon Leakage? WP-US-1006
8
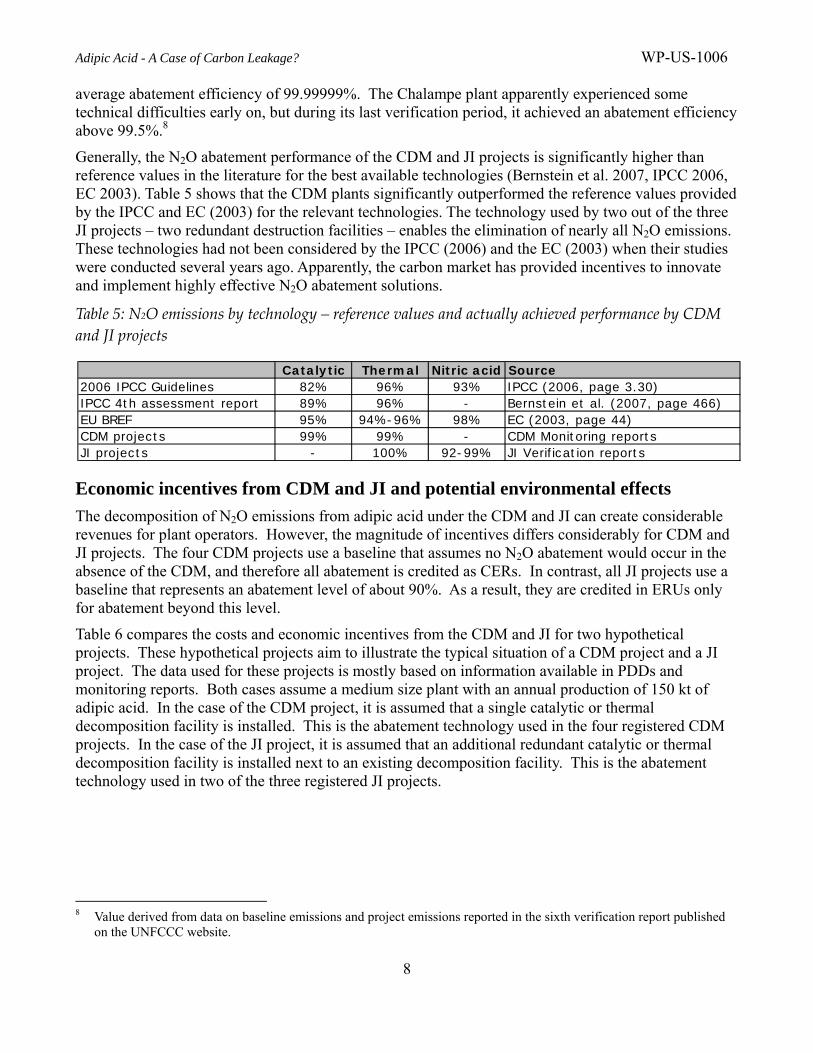
average abatement efficiency of 99.99999%. The Chalampe plant apparently experienced some technical difficulties early on, but during its last verification period, it achieved an abatement efficiency above 99.5%.8
Generally, the N2O abatement performance of the CDM and JI projects is significantly higher than reference values in the literature for the best available technologies (Bernstein et al. 2007, IPCC 2006, EC 2003). Table 5 shows that the CDM plants significantly outperformed the reference values provided by the IPCC and EC (2003) for the relevant technologies. The technology used by two out of the three JI projects – two redundant destruction facilities – enables the elimination of nearly all N2O emissions. These technologies had not been considered by the IPCC (2006) and the EC (2003) when their studies were conducted several years ago. Apparently, the carbon market has provided incentives to innovate and implement highly effective N2O abatement solutions.
Table 5: N2O emissions by technology – reference values and actually achieved performance by CDM
and JI projects
Economic incentives from CDM and JI and potential environmental effects
The decomposition of N2O emissions from adipic acid under the CDM and JI can create considerable revenues for plant operators. However, the magnitude of incentives differs considerably for CDM and JI projects. The four CDM projects use a baseline that assumes no N2O abatement would occur in the absence of the CDM, and therefore all abatement is credited as CERs. In contrast, all JI projects use a baseline that represents an abatement level of about 90%. As a result, they are credited in ERUs only for abatement beyond this level.
Table 6 compares the costs and economic incentives from the CDM and JI for two hypothetical projects. These hypothetical projects aim to illustrate the typical situation of a CDM project and a JI project. The data used for these projects is mostly based on information available in PDDs and monitoring reports. Both cases assume a medium size plant with an annual production of 150 kt of adipic acid. In the case of the CDM project, it is assumed that a single catalytic or thermal decomposition facility is installed. This is the abatement technology used in the four registered CDM projects. In the case of the JI project, it is assumed that an additional redundant catalytic or thermal decomposition facility is installed next to an existing decomposition facility. This is the abatement technology used in two of the three registered JI projects.
8 Value derived from data on baseline emissions and project emissions reported in the sixth verification report published
on the UNFCCC website.
Catalytic Thermal Nitric acid Source2006 IPCC Guidelines 82% 96% 93% IPCC (2006, page 3.30)IPCC 4th assessment report 89% 96% - Bernstein et al. (2007, page 466)EU BREF 95% 94%-96% 98% EC (2003, page 44)CDM projects 99% 99% - CDM Monitoring reportsJI projects - 100% 92-99% JI Verification reports
Adipic Acid - A Case of Carbon Leakage? WP-US-1006
9
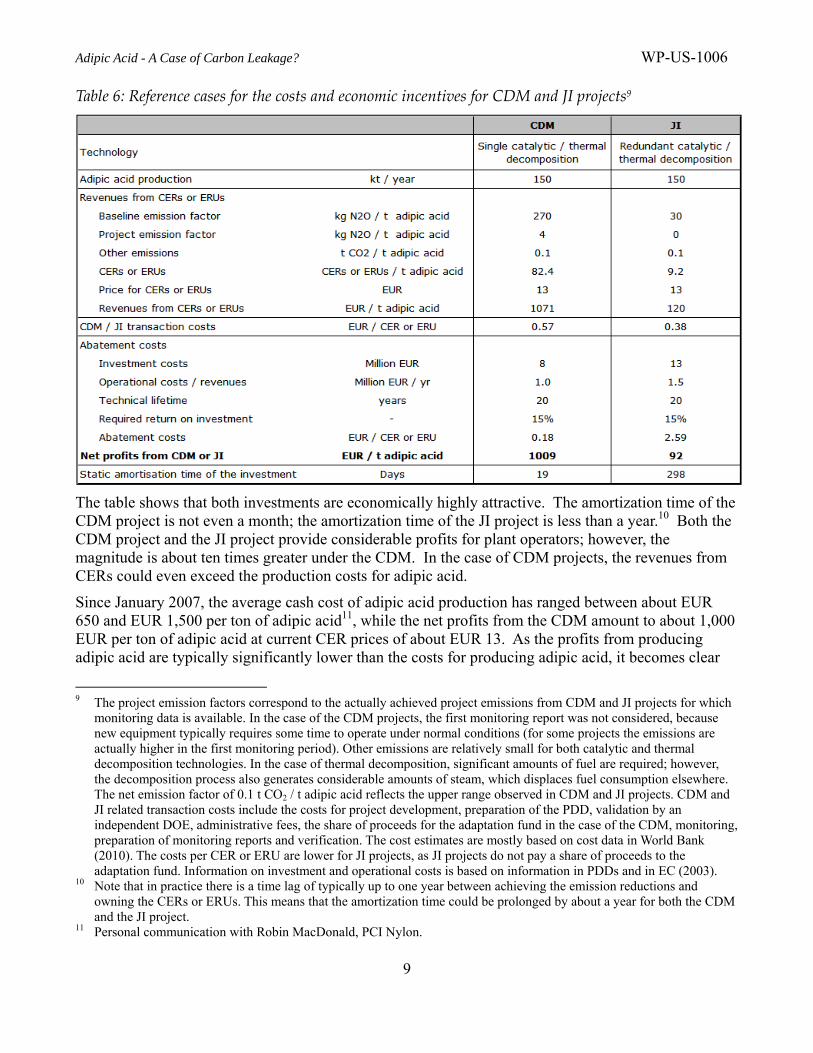
Table 6: Reference cases for the costs and economic incentives for CDM and JI projects9
The table shows that both investments are economically highly attractive. The amortization time of the CDM project is not even a month; the amortization time of the JI project is less than a year.10 Both the CDM project and the JI project provide considerable profits for plant operators; however, the magnitude is about ten times greater under the CDM. In the case of CDM projects, the revenues from CERs could even exceed the production costs for adipic acid.
Since January 2007, the average cash cost of adipic acid production has ranged between about EUR 650 and EUR 1,500 per ton of adipic acid11, while the net profits from the CDM amount to about 1,000 EUR per ton of adipic acid at current CER prices of about EUR 13. As the profits from producing adipic acid are typically significantly lower than the costs for producing adipic acid, it becomes clear
9 The project emission factors correspond to the actually achieved project emissions from CDM and JI projects for which
monitoring data is available. In the case of the CDM projects, the first monitoring report was not considered, because new equipment typically requires some time to operate under normal conditions (for some projects the emissions are actually higher in the first monitoring period). Other emissions are relatively small for both catalytic and thermal decomposition technologies. In the case of thermal decomposition, significant amounts of fuel are required; however, the decomposition process also generates considerable amounts of steam, which displaces fuel consumption elsewhere. The net emission factor of 0.1 t CO2 / t adipic acid reflects the upper range observed in CDM and JI projects. CDM and JI related transaction costs include the costs for project development, preparation of the PDD, validation by an independent DOE, administrative fees, the share of proceeds for the adaptation fund in the case of the CDM, monitoring, preparation of monitoring reports and verification. The cost estimates are mostly based on cost data in World Bank (2010). The costs per CER or ERU are lower for JI projects, as JI projects do not pay a share of proceeds to the adaptation fund. Information on investment and operational costs is based on information in PDDs and in EC (2003).
10 Note that in practice there is a time lag of typically up to one year between achieving the emission reductions and owning the CERs or ERUs. This means that the amortization time could be prolonged by about a year for both the CDM and the JI project.
11 Personal communication with Robin MacDonald, PCI Nylon.
Adipic Acid - A Case of Carbon Leakage? WP-US-1006
10
that profits from the CDM exceed the profits from the core business, the production of adipic acid by as much as an order of magnitude.12
The large added profits generated from abatement of N2O emissions at plants registered under the CDM suggest that CDM plants have significant competitive advantage. At current CER prices, these plants can produce adipic acid at negative costs or very low costs, in the range from EUR -350 to EUR +500 EUR, far below the costs faced by other producers. The magnitude of this competitive advantage and the fact that plants in industrialized countries generally abate their N2O emissions raises questions about potential carbon leakage: An economically rational producer can be expected to maximize the adipic acid production of a plant with N2O abatement under the CDM. Yet in the absence of the CDM, the same plant would not necessarily be able to maximize production, because it would have to compete with other plants, and its production rate would depend on the location of the plant, its specific production costs, and the market demand and prices for adipic acid. This indicates that the CDM incentives could steer the market to significantly shift adipic acid production away from non-CDM plants, leading to carbon leakage.
The incentives from the CDM and the potential for carbon leakage are well known. For this reason, the CDM Executive Board limited the eligibility of adipic acid projects to plants that already existed by the end of 2004 and also released guidance explaining under which conditions any new adipic acid plants or capacity additions could qualify as CDM projects.13 In addition, several proposals for crediting N2O abatement in new adipic acid facilities have been submitted to the CDM Executive Board, but all of them have been rejected so far, among other reasons, because the risk for carbon leakage was not deemed to be adequately addressed.
In the case of JI projects, the competitive advantage is significantly lower but could still play role. Most adipic acid producers have a very similar cost structure. The feedstock benzene is the main cost factor and is a globally traded commodity resulting in practically the same prices for all producers. For about 80% of the producers (excluding the CDM and JI projects) production costs vary only within a range of about EUR 120 per ton of adipic acid.14 In such a market situation, an additional profit of about 80 EUR per ton of adipic acid from ERU sales could still constitute a competitive advantage. This indicates that production shifts might also occur due to the implementation of JI projects, although the incentives for such shifts are much smaller than under the CDM.
The overall effect of production shifts on global GHG emissions is very different for the two mechanisms. The effect depends on which plants decrease adipic acid production in response to increased production at CDM and JI projects:
(a) plants operating under a cap on GHG emissions, i.e. plants located in an Annex 1 country with a binding emissions cap and/or covered under a regional GHG emissions trading scheme (this applies to the plants in Europe and Japan); or
(b) plants with a typically observed N2O abatement of about 90% that are located in a region not covered by a binding emissions cap (this applies to the plant in Singapore and all plants in the US); or
12 We cannot provide a precise estimate as we lack data on the current profit margins of adipic acid production. However, if
one assumes a 15-20% profit margin on adipic acid sales, then profits from CER sales would be in the range of 3 to 10 times profits from product sales.
13 Annex 10 of the meeting report of the 46th meeting of the CDM Executive Board 14 Personal communication with Robin MacDonald, PCI Nylon.
Adipic Acid - A Case of Carbon Leakage? WP-US-1006
11
(c) plants without any N2O abatement located in developing countries (this applies to the new capacity installed in China).
In the case of the CDM, it is important to bear in mind that it is an offsetting mechanism. This means that the emission reductions credited under the CDM entitle the buyers of the CERs to a corresponding increase of their emissions. The CDM by itself does not directly reduce global GHG emissions but helps to achieve a given emission reduction target at a lower cost.
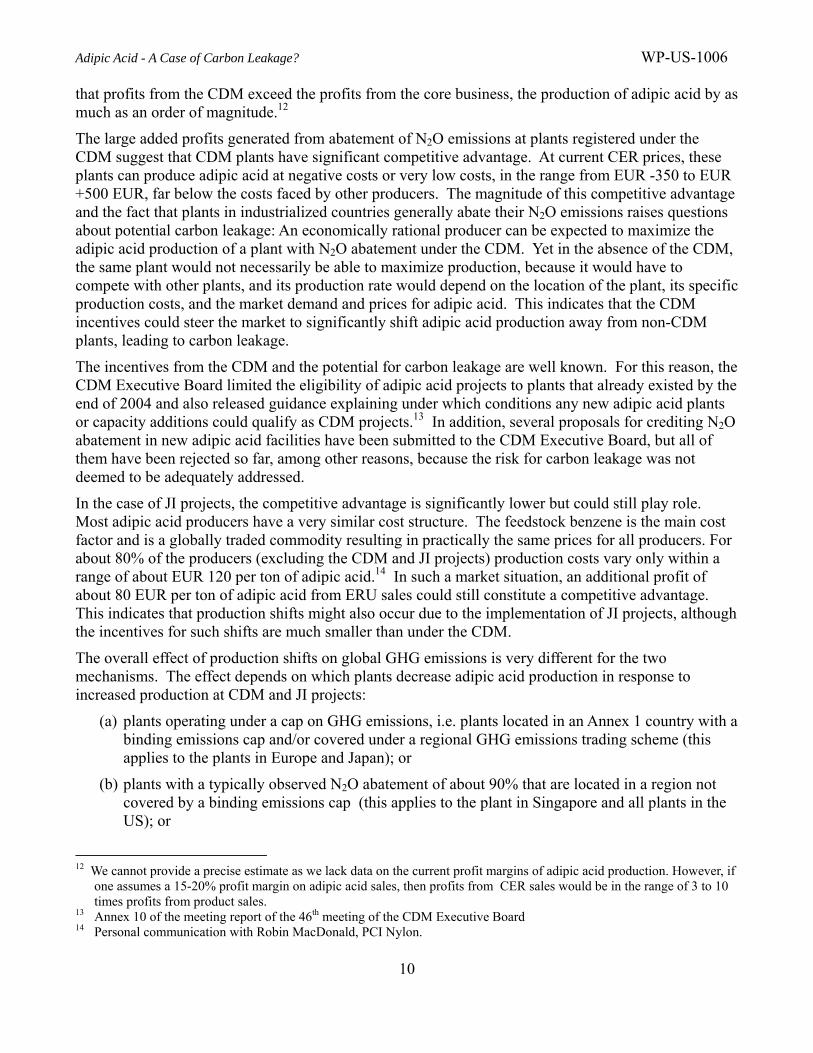
Global GHG emissions will increase if adipic acid is shifted to CDM plants away from plants operating under condition (a) or (b). The CERs resulting from production that has shifted to a CDM plant do not constitute real emission reductions, as the CDM displaces production in plants that are either (a) operating under a cap on total GHG emissions, or (b) are already largely abating N2O emissions. If N2O emissions under a cap are reduced, it allows the country or other entities within the emissions trading schemes to increase their emissions respectively. As the CERs issued from such shifts entitle third parties to increase their GHG emissions, the net result is a global increase in GHG emissions. Shifts from plants under condition (c) to CDM plants do not lead to an increase in global GHG emissions because the plants under (c) do not abate N2O emissions. In this case, the CERs resulting from a shift towards plants that abate N2O emissions still constitute real emission reductions achieved by the CDM project. As shown in Figure 3, shifts to CDM plants either increase or do not affect global GHG emissions.
Figure 3: Effect on Global Emissions of a Shift in Production of Adipic Acid from Non-CDM to CDM Plants
In the case of JI, the projects are located in Kyoto Parties. The emissions reductions issued under JI (ERUs) are converted from assigned amount units (AAUs) that have been allocated to the Party. The issuance of ERUs has no effect on global GHG emissions, because the amount of allowances available to Kyoto Parties remains the same. This means that shifts from plants operating under condition (a) to
(b) In region not covered by a binding emissions cap
Abate N2O 90%+
(Plants in Singapore, US)
(c) In region not covered by a binding emissions cap
No N2O abatement
(e.g. all new capacity in China)
(a) In region covered by a binding emissions cap
(Plants in Europe and Japan)
CDM plants
Increases emissions
Arrow shows direction of production shift
Increases emissions
No effect on emissions
Adipic Acid - A Case of Carbon Leakage? WP-US-1006
12
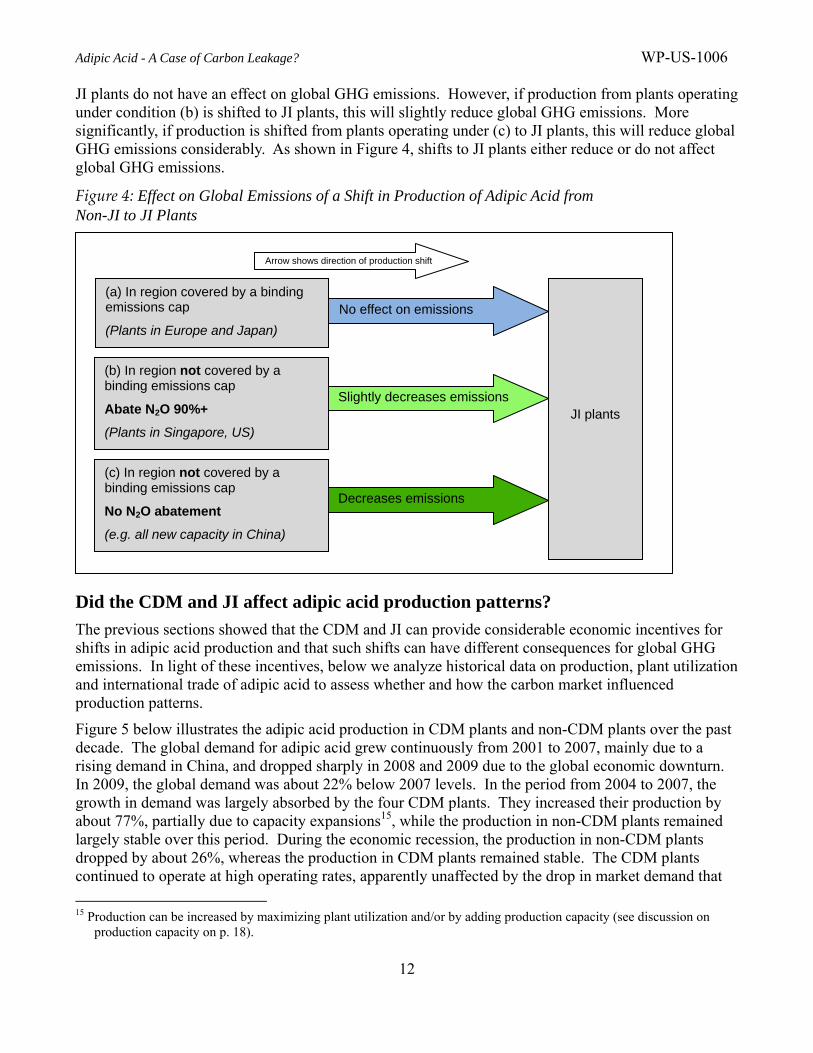
JI plants do not have an effect on global GHG emissions. However, if production from plants operating under condition (b) is shifted to JI plants, this will slightly reduce global GHG emissions. More significantly, if production is shifted from plants operating under (c) to JI plants, this will reduce global GHG emissions considerably. As shown in Figure 4, shifts to JI plants either reduce or do not affect global GHG emissions.
Figure 4: Effect on Global Emissions of a Shift in Production of Adipic Acid from Non-JI to JI Plants
Did the CDM and JI affect adipic acid production patterns?
The previous sections showed that the CDM and JI can provide considerable economic incentives for shifts in adipic acid production and that such shifts can have different consequences for global GHG emissions. In light of these incentives, below we analyze historical data on production, plant utilization and international trade of adipic acid to assess whether and how the carbon market influenced production patterns.
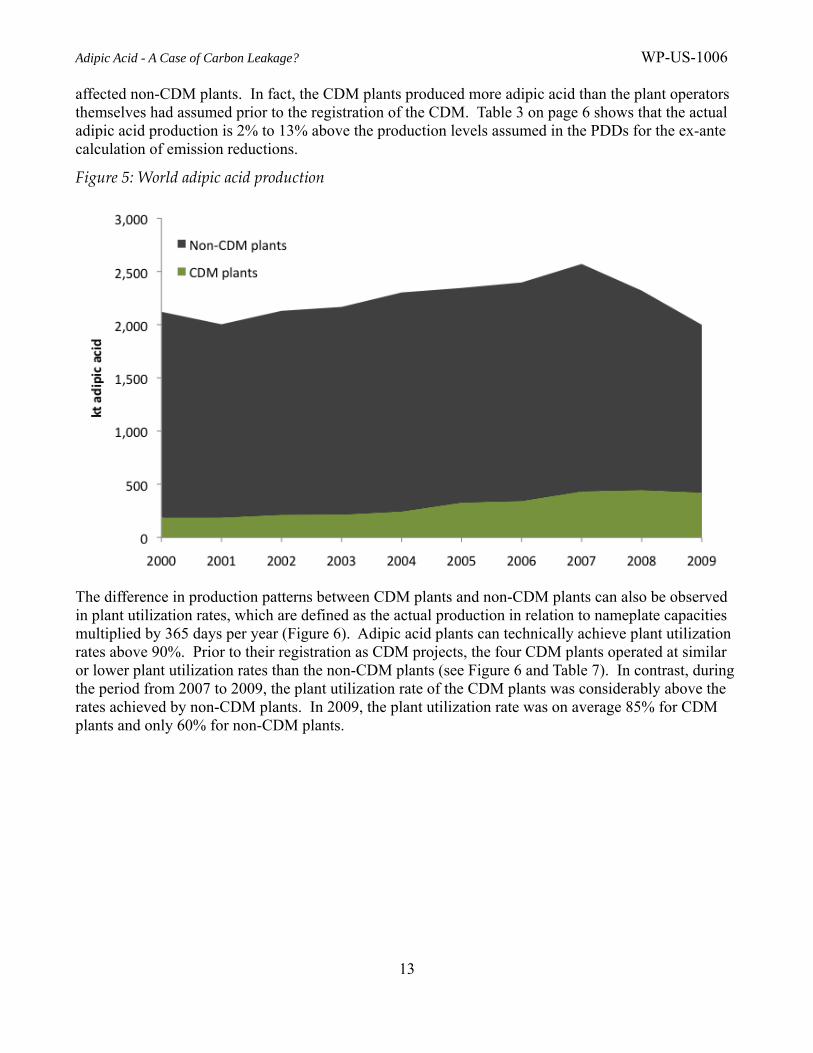
Figure 5 below illustrates the adipic acid production in CDM plants and non-CDM plants over the past decade. The global demand for adipic acid grew continuously from 2001 to 2007, mainly due to a rising demand in China, and dropped sharply in 2008 and 2009 due to the global economic downturn. In 2009, the global demand was about 22% below 2007 levels. In the period from 2004 to 2007, the growth in demand was largely absorbed by the four CDM plants. They increased their production by about 77%, partially due to capacity expansions15, while the production in non-CDM plants remained largely stable over this period. During the economic recession, the production in non-CDM plants dropped by about 26%, whereas the production in CDM plants remained stable. The CDM plants continued to operate at high operating rates, apparently unaffected by the drop in market demand that
15 Production can be increased by maximizing plant utilization and/or by adding production capacity (see discussion on
production capacity on p. 18).
(b) In region not covered by a binding emissions cap
Abate N2O 90%+
(Plants in Singapore, US)
(c) In region not covered by a binding emissions cap
No N2O abatement
(e.g. all new capacity in China)
(a) In region covered by a binding emissions cap
(Plants in Europe and Japan)
JI plants Slightly decreases emissions
Arrow shows direction of production shift
Decreases emissions
No effect on emissions
Adipic Acid - A Case of Carbon Leakage? WP-US-1006
13
affected non-CDM plants. In fact, the CDM plants produced more adipic acid than the plant operators themselves had assumed prior to the registration of the CDM. Table 3 on page 6 shows that the actual adipic acid production is 2% to 13% above the production levels assumed in the PDDs for the ex-ante calculation of emission reductions.
Figure 5: World adipic acid production
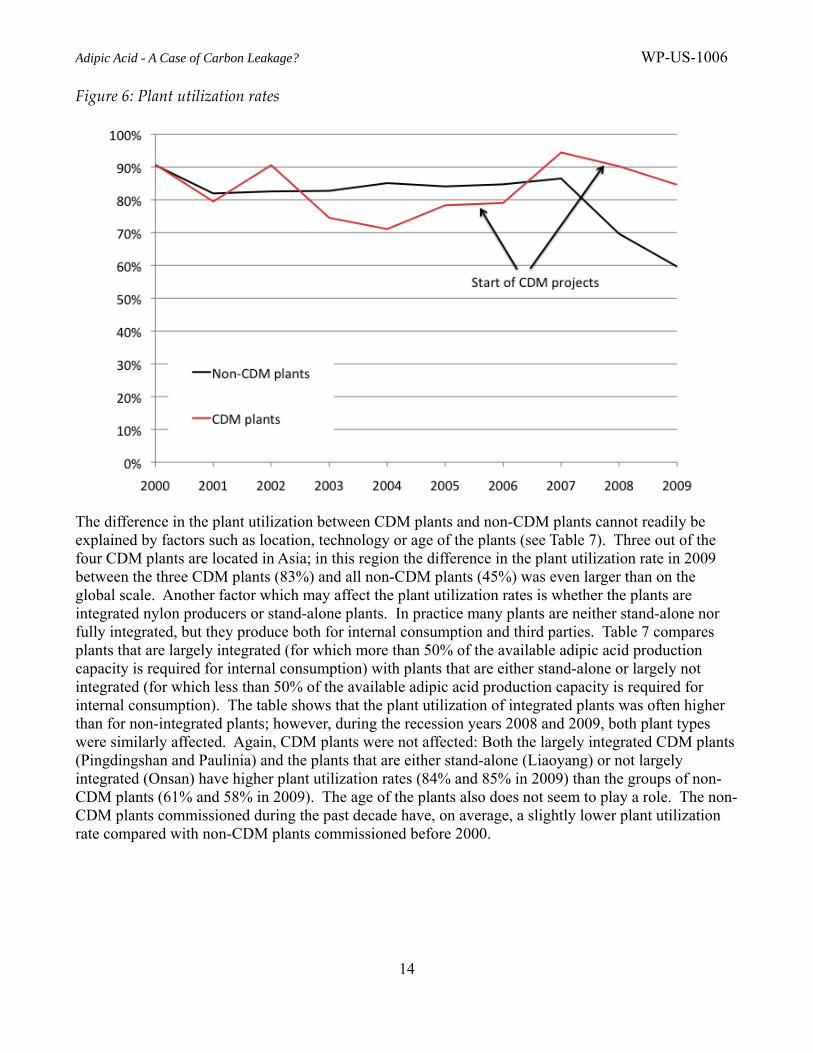
The difference in production patterns between CDM plants and non-CDM plants can also be observed in plant utilization rates, which are defined as the actual production in relation to nameplate capacities multiplied by 365 days per year (Figure 6). Adipic acid plants can technically achieve plant utilization rates above 90%. Prior to their registration as CDM projects, the four CDM plants operated at similar or lower plant utilization rates than the non-CDM plants (see Figure 6 and Table 7). In contrast, during the period from 2007 to 2009, the plant utilization rate of the CDM plants was considerably above the rates achieved by non-CDM plants. In 2009, the plant utilization rate was on average 85% for CDM plants and only 60% for non-CDM plants.
Adipic Acid - A Case of Carbon Leakage? WP-US-1006
14
Figure 6: Plant utilization rates
The difference in the plant utilization between CDM plants and non-CDM plants cannot readily be explained by factors such as location, technology or age of the plants (see Table 7). Three out of the four CDM plants are located in Asia; in this region the difference in the plant utilization rate in 2009 between the three CDM plants (83%) and all non-CDM plants (45%) was even larger than on the global scale. Another factor which may affect the plant utilization rates is whether the plants are integrated nylon producers or stand-alone plants. In practice many plants are neither stand-alone nor fully integrated, but they produce both for internal consumption and third parties. Table 7 compares plants that are largely integrated (for which more than 50% of the available adipic acid production capacity is required for internal consumption) with plants that are either stand-alone or largely not integrated (for which less than 50% of the available adipic acid production capacity is required for internal consumption). The table shows that the plant utilization of integrated plants was often higher than for non-integrated plants; however, during the recession years 2008 and 2009, both plant types were similarly affected. Again, CDM plants were not affected: Both the largely integrated CDM plants (Pingdingshan and Paulinia) and the plants that are either stand-alone (Liaoyang) or not largely integrated (Onsan) have higher plant utilization rates (84% and 85% in 2009) than the groups of non-CDM plants (61% and 58% in 2009). The age of the plants also does not seem to play a role. The non-CDM plants commissioned during the past decade have, on average, a slightly lower plant utilization rate compared with non-CDM plants commissioned before 2000.
Adipic Acid - A Case of Carbon Leakage? WP-US-1006
15
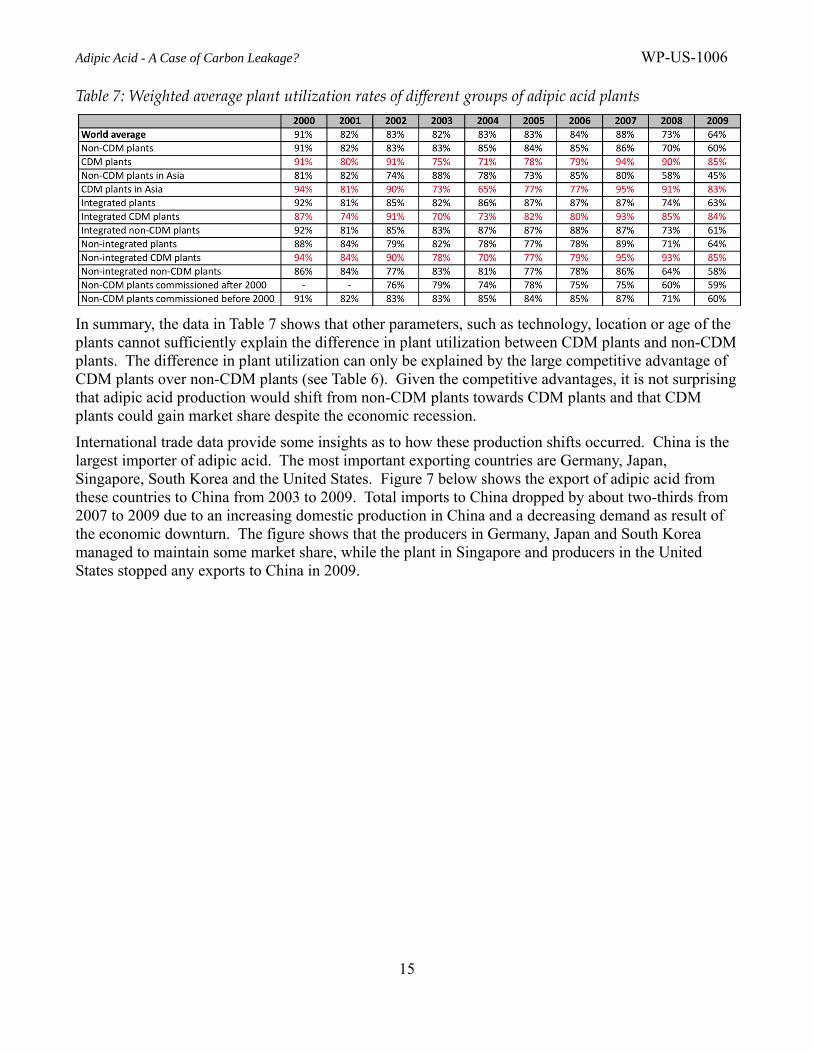
Table 7: Weighted average plant utilization rates of different groups of adipic acid plants
In summary, the data in Table 7 shows that other parameters, such as technology, location or age of the plants cannot sufficiently explain the difference in plant utilization between CDM plants and non-CDM plants. The difference in plant utilization can only be explained by the large competitive advantage of CDM plants over non-CDM plants (see Table 6). Given the competitive advantages, it is not surprising that adipic acid production would shift from non-CDM plants towards CDM plants and that CDM plants could gain market share despite the economic recession.
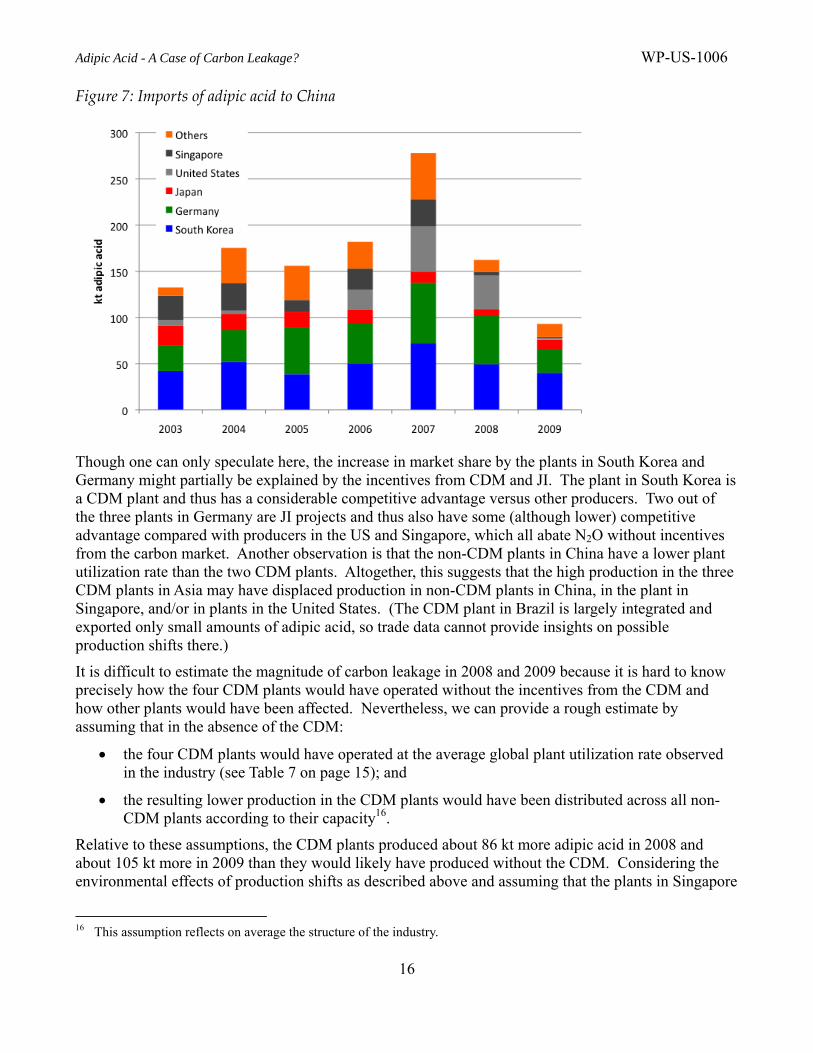
International trade data provide some insights as to how these production shifts occurred. China is the largest importer of adipic acid. The most important exporting countries are Germany, Japan, Singapore, South Korea and the United States. Figure 7 below shows the export of adipic acid from these countries to China from 2003 to 2009. Total imports to China dropped by about two-thirds from 2007 to 2009 due to an increasing domestic production in China and a decreasing demand as result of the economic downturn. The figure shows that the producers in Germany, Japan and South Korea managed to maintain some market share, while the plant in Singapore and producers in the United States stopped any exports to China in 2009.
Adipic Acid - A Case of Carbon Leakage? WP-US-1006
16
Figure 7: Imports of adipic acid to China
Though one can only speculate here, the increase in market share by the plants in South Korea and Germany might partially be explained by the incentives from CDM and JI. The plant in South Korea is a CDM plant and thus has a considerable competitive advantage versus other producers. Two out of the three plants in Germany are JI projects and thus also have some (although lower) competitive advantage compared with producers in the US and Singapore, which all abate N2O without incentives from the carbon market. Another observation is that the non-CDM plants in China have a lower plant utilization rate than the two CDM plants. Altogether, this suggests that the high production in the three CDM plants in Asia may have displaced production in non-CDM plants in China, in the plant in Singapore, and/or in plants in the United States. (The CDM plant in Brazil is largely integrated and exported only small amounts of adipic acid, so trade data cannot provide insights on possible production shifts there.)
It is difficult to estimate the magnitude of carbon leakage in 2008 and 2009 because it is hard to know precisely how the four CDM plants would have operated without the incentives from the CDM and how other plants would have been affected. Nevertheless, we can provide a rough estimate by assuming that in the absence of the CDM:
the four CDM plants would have operated at the average global plant utilization rate observed in the industry (see Table 7 on page 15); and
the resulting lower production in the CDM plants would have been distributed across all non-CDM plants according to their capacity16.
Relative to these assumptions, the CDM plants produced about 86 kt more adipic acid in 2008 and about 105 kt more in 2009 than they would likely have produced without the CDM. Considering the environmental effects of production shifts as described above and assuming that the plants in Singapore
16 This assumption reflects on average the structure of the industry.
Adipic Acid - A Case of Carbon Leakage? WP-US-1006
17
and the US abate on average about 90% of the N2O, we estimate that the shift in production led to an increase in global GHG emissions (i.e., CERs not representing real emission reductions) of approximately 6.3 MtCO2e or about 17% of the CERs issued for this project type in 2008 and approximately 7.2 MtCO2e or about 21% of the adipic acid CERs in 2009.
The picture for the three JI plants is less clear, as two out of the three JI projects were only implemented in 2009. The available data for 2009 suggests that the mechanism did not result in any significant production shifts so far. The production by the three JI plants decreased by about 18% from 2007 to 2009, whereas the world average production dropped by about 22%. The output of the three JI plants in 2009 was also lower than projected in the PDDs (see Table 4 on page 7), whereas the CDM projects’ output was higher than projected in the PDDs.
Conclusions and recommendations
The evaluation of CDM and JI projects for N2O abatement from adipic acid production reveals two interesting results:
1. The carbon market was very effective in achieving previously unknown abatement levels. The carbon market provided incentives for adipic acid producers to abate N2O emissions to an extent which had previously not been achieved and which had not been considered practical or feasible in the relevant technical literature. While the IPCC and the European Commission considered catalytic or thermal destruction efficiencies between 82% and 96% as the best available technology (see Table 5), CDM and JI projects managed to eliminate 98% to 100% of their N2O emissions. The carbon market triggered the implementation of innovative low-cost solutions which had not been considered before, such as the installation of a redundant N2O abatement facility in order to eliminate N2O emissions during down-times of the abatement facility. In this regard, the project-based carbon market mechanisms have proven to be highly successful at expanding the boundaries of emission reduction possibilities.
2. The CDM appears to have caused carbon leakage during the economic downturn in 2008 and 2009. Data on adipic acid production, plant utilization and international trade patterns show that adipic acid production shifted from non-CDM plants to CDM plants during the economic downturn in 2008 and 2009. It is likely that the production partially moved away from plants that abate N2O emissions without the CDM or that are operating in countries with a cap under the Kyoto Protocol and that the revenues from the CDM were the main reason for these shifts. The extent of this carbon leakage is uncertain; however, assuming that the CDM plants would in the absence of the CDM have operated at the average global plant utilization rate, the shifts in production amount to about 86 kt adipic acid in 2008 and about 105 kt in 2009. This translates into increased greenhouse gas emissions of about 6.3 MtCO2e in 2008 and about 7.2 MtCO2e in 2009. This represents 17% to 22% of CERs issued from this project type which did not result in actual emission reductions. In the case of JI, shifts in production cannot be identified. It is also less likely that such shifts occurred, given that the revenues from the sales of JI credits are significantly lower than under the CDM.
In the light of these findings, we explore different options to effectively prevent carbon leakage in the future, while at the same time ensuring that N2O emissions from adipic acid production continue to be abated at high levels:
Adipic Acid - A Case of Carbon Leakage? WP-US-1006
18
Revision of the baseline and monitoring methodology
The current baseline and monitoring methodology could be revised to better avoid the risk of future carbon leakage. However, a revised version of the methodology would only apply at the renewal of the crediting period for the four registered CDM projects, i.e. it would become applicable between 2013 and 2015. The methodology could be revised in two ways:
Introducing a lower cap for the amount of adipic acid eligible for crediting; or
Introducing an ambitious baseline emission benchmark.
All four CDM projects were registered using the first version of the baseline and monitoring methodology. This version limited eligibility to production capacity already in place by the end of 2004. In practice, this provision was interpreted by project participants, DOEs and the CDM Executive Board, to enable the crediting of significant increases in adipic acid production beyond historical levels. While the methodology was designed to prevent carbon leakage, it did not. A revision of the methodology approved in 2007 aimed to address the risk of carbon leakage. It limited the amount of adipic acid eligible for crediting to the maximum historical adipic acid production of the plant during the three years before the implementation of the CDM project. While this provision lowers the amount of adipic acid eligible for crediting, it still implicitly assumes that, in the absence of the CDM, the production during the crediting period would always be as large or larger than the maximum production observed historically. Clearly, this provision is not effective in times of an economic downturn. In the years 2000 to 2007, the global plant utilization rate was on average 84%. In 2009, during the peak of the economic crisis, the plant utilization rate shrank to 64%. This shows that the methodology’s current eligibility criteria, which define production limits based on historical data, do not protect against carbon leakage occurring during times of an economic downturn.
For this reason, a lower cap would be required to prevent carbon leakage, yet it would be challenging to determine at what level to set the appropriate cap. The economic downturn observed recently caused a decline in global adipic acid production of about 22%. However, a future economic downturn could potentially result in an even greater decrease in demand.
Over longer time periods, the demand for adipic acid may change for other reasons, such as increased replacement of nylon by other products, due to technological innovation, changes in prices for raw products, etc. It is therefore unclear whether more stringent caps would be able to prevent carbon leakage. The experience with HFC-23 projects also showed that historical caps on the amount of eligible HCFC-22 production were not effective (Schneider, in press). More generally, such caps cannot readily reflect new technological or policy developments, such as the accelerated phase out of HCFCs under the Montreal Protocol.
A possible approach might be to include provisions in the methodology to update the cap annually, based on the current global adipic acid demand and production capacity. During an economic downturn, a lower cap would be applied, which could then increase again in times of economic recovery. However, such an approach could be difficult to implement in practice. It would require collecting reliable data on both global adipic acid capacity and production, which could be viewed as proprietary and confidential. Furthermore, there is no system to collect such information; in some countries, not even the number of operating plants is known with certainty. Moreover, global adipic acid production data for the most recent year might not be immediately available, which could cause a considerable delay in requests for the issuance of the CERs.
Adipic Acid - A Case of Carbon Leakage? WP-US-1006
19
For these reasons, the second proposed option, an ambitious baseline emission benchmark, could offer a more effective and straightforward way to prevent competitive distortions and carbon leakage. An ambitious emission benchmark would address the underlying cause that triggers carbon leakage: profits from CER revenue so large as to dramatically reduce the net costs of adipic acid production at CDM plants. It could remove or strongly reduce the incentives for shifting adipic acid production and be effective independent of the future demand for adipic acid. Moreover, this option could potentially also enable the inclusion of new adipic acid plants in the CDM.
Table 8 shows different levels at which the baseline emission benchmark could be set. Abatement levels of around 30 kg N2O per ton of adipic acid or 90% of N2O formation have been achieved by about 85% of the adipic acid capacity installed globally by 2010: for 60% of the capacity through voluntary action by industry and for 25% of the capacity through the CDM. Emission rates in this range were also used as the baseline for the three currently-implemented JI projects (see Table 4 on page 7) and have been proposed by the European Chemical Industry Council for free allocation of emission allowances in the EU ETS from 2013 (Ecofys 2009). However, for the EU ETS, even lower values have been proposed or are under discussion. The Methodology Panel under the CDM Executive Board suggested an emissions benchmark of 50 kg N2O per ton of adipic acid for new adipic acid plants.17 We recommend that a benchmark within the range shown in Table 8 be considered as emission reference level in the CDM methodology.
Table 8: Emission benchmarks for adipic acid production implemented or under discussion
A standardized global emission benchmark for all adipic acid plants, regardless of policy approach or specific emission trading mechanism, could provide a level playing field for the adipic acid industry and eliminate potential economic distortions. For example, the same emission benchmark could be used for free allocation of emission allowances in regional emissions trading schemes, as a regulatory performance standard, or for national or international offset projects. Adipic acid production is particularly amenable to a standardized global benchmark because it is a highly globalized industry, and all plants are very similar in structure and technology. Such an approach could also be used to extend the carbon market to plants that are currently not covered by or eligible under carbon market mechanisms.18
Even if they differ among regions, or are only introduced in the CDM and the EU ETS, benchmarks within the range indicated in Table 8 would largely eliminate competitive distortions between plants since:
17 Response of the Methodology Panel to the request for revision REV0110, available at http://cdm.unfccc.int. 18 All five operating plants in the EU will be included in the EU ETS in 2013. The two plants in the Ukraine could
potentially continue to qualify as JI projects. So far excluded from the current carbon markets are the plants with abatement in Japan, Singapore and the United States as well as the new plants without abatement in China. Moreover, further capacity additions are planned in China and Saudi Arabia. The plants in Japan and the United States could be covered under proposed domestic emissions trading schemes or participate as national offsetting projects with the current level of abatement (about 90%) as baseline, similar to the JI projects in Europe.
kg N2O / t adipic acid Abatement levelProposal by the Methodology Panel for new adipic acid plants under the CDM 50 83%Benchmarks used in JI projects 28 - 33 89% - 91%Proposal by the European Chemical Industry Council for the EU ETS (Ecofys 2009) 27 91%Ecofys, Fraunhofer Institute, Öko-Institut proposal for the EU ETS (Ecofys 2009) 18 94%Benchmark under discussion by the European Community for the EU ETS 9 97%
Adipic Acid - A Case of Carbon Leakage? WP-US-1006
20
Plants operating under JI would receive similar incentives from the carbon market as CDM plants, thereby eliminating any competitive distortions between these groups of plants.
Plants under regional emissions trading schemes would also have similar incentives from the carbon market if the benchmarks for free allocation of emission allowances were set in the same range.
The competitive advantage of CDM plants over plants currently outside the carbon market (i.e. in the US and Japan) would decrease considerably. And importantly, should the CDM still result in some production shifts from these countries to CDM plants, these shifts would not cause carbon leakage. Given that only emission reductions beyond the abatement level generally achieved in the industry in these countries are credited, a displacement of production from plants in these countries to CDM plants, issuance of added carbon credits would still represent real reductions.
An emissions benchmark in the range shown in Table 8 still provides considerable incentives for the industry to abate N2O emissions, as shown by the three JI projects implemented in the EU. There is little reason to believe CDM projects would be hampered by such a benchmark, particularly at the higher levels shown. Even with a baseline emission factor of roughly 90% abatement, the cost of abatement is less than 3 EUR/ERU for a typical JI project. Finally, using an ambitious emission benchmark could also enable the inclusion of new adipic acid plants in the CDM under the same methodology as for existing plants, thereby leveling the playing field between new and existing plants.
Exclusion of adipic acid plants from the CDM
The exclusion of adipic acid plants from the CDM would be a blunt but simple way to eliminate competitive distortions. Plants in non-Annex 1 countries would be left to pursue abatement effort to the extent they choose, for reasons such as corporate social responsibility, generation of voluntary market offsets, or to preempt regulatory initiatives. Alternatively, governments could aim to address N2O emissions through regulations or other national policies in the relevant host countries. An advantage of the regulatory approach is that it, in principle, could provides a longer-term solution, to the extent N2O abatement regulations are enforced and permanent. However, given that N2O abatement at adipic acid plants offer no social or environmental benefits other than GHG reduction, the incentives for non-Annex 1 countries, at present, to pursue a regulatory path are limited.
Restrictions on the use of CERs from adipic acid projects
In November 2010, the European Community may decide on quality restrictions on the use of industrial gas projects in the EU ETS. This could, for example, include the exclusion of adipic acid plants or discounting of CERs from adipic acid projects. Discounting of adipic acid CERs (i.e. allowing only a fraction of CERs to be used for compliance while the remainder is transferred to a cancellation account) could, like ambitious benchmark, limit the large profit margins and thus sizeable competitive advantage of CDM plants, thereby reduce the risk of carbon leakage.
A major advantage of the discounting approach is that it can be applied immediately for existing projects, in contrast to a revised version of the methodology with an ambitious benchmark that would only apply at the renewal of the crediting period in 2013 or 2015. In addition, the administrator of an ETS, such as the EC, can make a unilateral decision to discount, rather than having to wait for the uncertain outcome of the CDM decision-making process on a methodology change. However, demand side quality restrictions also pose challenges. Because adipic acid CERs could still be used outside the
Adipic Acid - A Case of Carbon Leakage? WP-US-1006
21
area that imposed the quality restrictions, the effectiveness of demand-side restrictions may be limited. In addition, imposing a discount could also affect fungibility of the CERs in the trading market.
Furthermore, discounting has a somewhat different impact on the incentives to abate. While a discount affects crediting proportionately, regardless of the level of abatement, a benchmark credits only the abatement beyond a specified emission rate. Under a benchmark, a full CER is issued for each additional ton of N2O avoided beyond the benchmark, whereas with a discount only a fraction of CER is issued. As a result, the benchmark approach will generally provide greater incentives for innovation and advancing technology to higher abatement levels. Discounting and benchmarks are not mutually exclusive. A discounting approach could possibly be used as an interim solution until a benchmark comes into effect.
Sectoral emissions trading
In the long term, inclusion of all adipic acid plants in one or more globally harmonized emission trading programs would provide an economically efficient means to address adipic acid N2O emissions. This could be achieved by linking several regional emissions trading schemes through the harmonized rules for auctioning or free allocation of emission allowances. Alternatively, a global sectoral adipic acid emissions trading scheme could be linked with other emission trading programs.
In conclusion, this paper has identified several mechanisms to address the risk of carbon leakage from the current approach to adipic acid plants in the CDM. Among the options discussed, a revision of the CDM methodology introducing an ambitious benchmark presents some clear advantages in terms of efficiency and effectiveness. However, given the uncertainty of its adoption, and the delay until 2013-2015 in taking effect, the EC and other national entities and buyers may wish to consider demand-side restrictions, such as exclusion or discounting especially in the near-term. If discounting is pursued, potential implementation challenges would need to be addressed. Alternatively, N2O abatement in non-Annex 1 countries could be achieved outside the carbon market, e.g. through national policies possibly supported through multilateral or bilateral agreements (e.g. through supported NAMAs). Inclusion of all global adipic acid production in one or more harmonized emission trading systems would be the most economically efficient approach, but such an outcome is unlikely in the near future.
Adipic Acid - A Case of Carbon Leakage? WP-US-1006
22
References Bernstein, L., J. Roy, K. C. Delhotal, J. Harnisch, R. Matsuhashi, L. Price, K. Tanaka, E. Worrell, F. Yamba, Z. Fengqi,
(2007). Industry. In Climate Change 2007: Mitigation. Contribution of Working Group III to the Fourth Assessment Report of the Intergovernmental Panel on Climate Change [B. Metz, O.R. Davidson, P.R. Bosch, R. Dave, L.A. Meyer (eds)], Cambridge University Press, Cambridge, United Kingdom and New York, NY, USA.
Ecofys (2009). Methodology for the free allocation of emission allowances in the EU ETS post 2012. Sector report for the chemical industry. By order of the European Commission. Ecofys (project leader), Fraunhofer Institute for Systems and Innovation Research, O�ko-Institut. Last retrieved 1 October 2010 from http://ec.europa.eu/environment/climat/emission/pdf/bm/BM%20study%20-%20Chemicals.pdf
European Commission (2003). Integrated Pollution Prevention and Control (IPPC). Reference Document on Best Available Techniques in the Large Volume Organic Chemical Industry. Integrated Pollution Prevention and Control (IPPC). February 2003, last retrieved 1 October 2010 from http://eippcb.jrc.es/reference
IPCC (2006). 2006 IPCC Guidelines for National Greenhouse Gas Inventories. Prepared by the National Greenhouse Gas Inventories Programme, Eggleston H.S., Buendia L., Miwa K., Ngara T. and Tanabe K. (eds). Published: IGES, Japan.
Kollmuss, A., Lazarus M. (forthcoming). Industrial N2O Projects Under the CDM: The Case of Nitric Acid Production Stockholm Environment Institute Working Paper WP-US-1007
Schneider, L. (in press). Perverse incentives under the Clean Development Mechanism (CDM): an evaluation of HFC-23 destruction projects. Manuscript submitted to Climate Policy and accepted for publication.
UNEP RISOE (2010). CDM/JI Pipeline Analysis and Database. September 1st 2010. http://cdmpipeline.org/
World Bank (2010). 10 Years of Experience in Carbon Finance. Insights from working with the Kyoto mechanisms. The World Bank, 1818 H Street NW, Washington, DC 20433, USA