adhidarma et al - re outlook-resi-preg
TRANSCRIPT

8/3/2019 Adhidarma Et Al - RE Outlook-RESI-PREG
http://slidepdf.com/reader/full/adhidarma-et-al-re-outlook-resi-preg 1/8
World Renewable Energy Congress-IndonesiaInternational Conference on Renewable Energy and Energy Efficiency, 16-20 October 2011, Bali, Indonesia
_________________________________________________________________________________
RE Outlook (RESI/PREG)
1
Indonesia Renewable Energy Outlook: The Challenges Ahead
Adhi Dharma Permana*, M.A.M. Oktaufik, Yudiartono, Ira FitrianaCentre of Energy Resource Development Technology (PTPSE),
Agency for Assessment and Application of Technology (BPPT), Jl.MH Thamrin No.8, Jakarta 10340, Indonesia* Corresponding author: [email protected], [email protected]
Abstract
Indonesia new & renewable energy potential is quite large. However, the reality of new & renewableenergy (NRE) application up to a significant share in the energy supply mix in Indonesia has not beena bright picture. The share of NRE in 2009 energy supply share was at the 4% level. On the one hand,the Government of Indonesia has set targets in the National Energy Policy of 2006 to increase thecombined use of NRE of all types up to 17% in 2025. A new plan was also been proposed currently toachieved at least 25% of NRE utilization in 2025. This paper discusses the future prospects and
challenges facing NRE application in Indonesia based on BPPT’s Energy Model study of Indonesia Energy Outlook to 2030. The projection of future energy demand is obtained using the BPPT Model for Energy Demand of Indonesia (MEDI), an energy demand model based on activities and intensitiesof various subsectors of the Indonesia economy. On the supply side, the MARKAL model is employed
to allocate energy resources and supply energy demand. MARKAL is an optimization model that employs linear programming to calculate decision variables based on total cost minimization. In
addition, this paper addresses efforts to increase NRE application. Several key sectors for NRE applications are examined, i.e. the industry, transportation, and household sectors.Keyword: Markal Model, Energy Outlook, Renewable Energy, Energy Model
1. Introduction
Over the past 20 years, Indonesia energy demand has risen steadily at an average growth rate of 6.08% pa. This trend is consistent with the country’s economic development. On the demand side, in2009 the two leading end-use energy consuming sectors were the industry and transportation sectors,
each of which had a share of 52% and 31%, respectfuly followed by household and commercialsectors. The industry sector is mostly dependant on gas and coal, whereas the transportation sector is
mostly supplied by oil fuel (gasoline, diesel fuel). On the supply side, during the same period oil based energy has been the major energy supply contributing to 43% of total energy supply, followed
by coal, natural gas and new and renewable energy (NRE) being 4%. Figure 1 shows historical energydemand vs supply during 1990 – 2009.
Figure 1. Historical Energy Demand vs Supply (1990 – 2009)
Source: Ministry of Energy & Mineral Resources, 2010

8/3/2019 Adhidarma Et Al - RE Outlook-RESI-PREG
http://slidepdf.com/reader/full/adhidarma-et-al-re-outlook-resi-preg 2/8
World Renewable Energy Congress-IndonesiaInternational Conference on Renewable Energy and Energy Efficiency, 16-20 October 2011, Bali, Indonesia
_________________________________________________________________________________
RE Outlook (RESI/PREG)
2
The currently small contribution of NRE has the potential to be increased. the Government of Indonesia has set targets in the National Energy Policy of 2006 to increase the combined use of NRE
of all types up to 17% in 2025. A new plan was also been proposed currently to achieved around 25-26% of NRE utilization in 2025. Potential application of NRE are in alternative liquid fuels and
electricity power generation. The current energy market is restricted by the presence of fuel subsidyfor most consumers and the regulated electricity price for most consumers. However, there have
actions to move towards the direction of employing subsidies for alternative liquid fuels, i.e. biofuelsand to employ Feed In Tariffs (FIT) to power generation from certain NRE sources, e.g. geothermal,solar, and wind energy. This paper discusses future outlook for NRE in Indonesia, the challengesahead, and efforts to overcome these barrier to promote NRE application. A future projection of Indonesia energy supply demand will be presented.
2. Methodology
In this section, a brief discussion on the method to project future energy demand and supply and theunderlying assumptions are presented. The projection of future energy demand is obtained using theBPPT,s Model for Energy Demand of Indonesia (MEDI), an energy demand model based on activities
and intensities of various subsectors of the Indonesia economy. The sectors considered are industry,transportation, household, commercial and others. The main driver for activities are GDP, populationgrowth, and other relevant parameters to the sectors of the economy. Table shows parameters
considered for the various sectors in the economy.
Table 1. Parameters considered for the sectors No Sectors Parameter
1 Transportation GDP growth, population growth, number of vehicles, vehicleenergy intensity
2 Industry GDP growth, population growth, energy intensity,
3 Household GDP growth, population growth, energy intensity, electrification
ratio, government program on kerosene to LPG conversion
4 Others GDP growth, population growth
On the supply side, the MARKAL model is employed to allocate energy resources and supply energy
demand. MARKAL is an optimization model that employs linear programming to calculate decisionvariables based on total cost minimization. The energy system being considered encompasses the
networks from resources, import, export, energy transformation to final (end-use) consumers is shownin Figure 2.
Figure 1. Schematic Representation of Energy System
8/3/2019 Adhidarma Et Al - RE Outlook-RESI-PREG
http://slidepdf.com/reader/full/adhidarma-et-al-re-outlook-resi-preg 3/8
World Renewable Energy Congress-IndonesiaInternational Conference on Renewable Energy and Energy Efficiency, 16-20 October 2011, Bali, Indonesia
_________________________________________________________________________________
RE Outlook (RESI/PREG)
3
A set of major assumptions are employed in the projection of future energy supply demand. Thesemajor assumptions include: GDP growth rate, population growth rate, fossil energy prices as shown in
Table 2. In addition to these assumptions, relevant programs/projects in the electricity, oil and gasareas are also considered as the energy supply infracture.
Table 2. Key Assumptions for Future Projections2010 2015 2020 2025 2030
Population Million 237 251 263 274 284
GDP Billion USD 259 363 509 714 1002
Crude Oil USD/barrel 95 120 150 175 200
Coal price (high calory) USD/ton 80 90 115 135 150
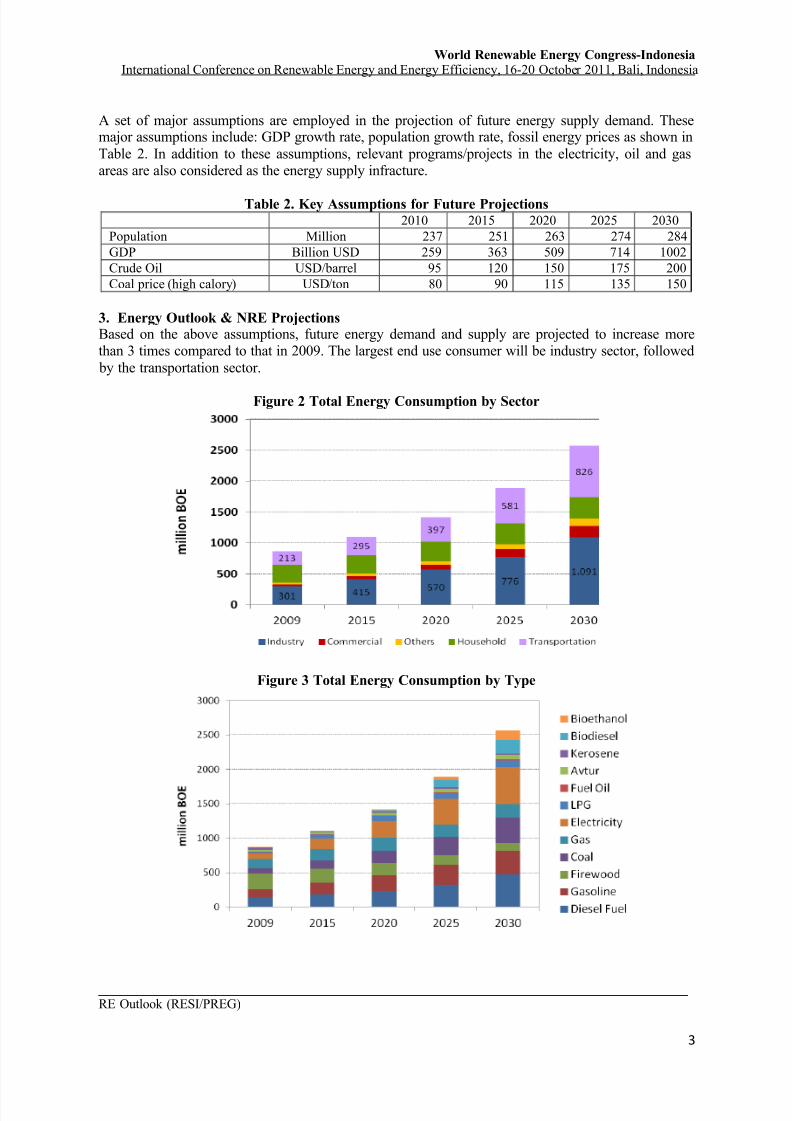
3. Energy Outlook & NRE ProjectionsBased on the above assumptions, future energy demand and supply are projected to increase morethan 3 times compared to that in 2009. The largest end use consumer will be industry sector, followed
by the transportation sector.
Figure 2 Total Energy Consumption by Sector
Figure 3 Total Energy Consumption by Type
8/3/2019 Adhidarma Et Al - RE Outlook-RESI-PREG
http://slidepdf.com/reader/full/adhidarma-et-al-re-outlook-resi-preg 4/8
World Renewable Energy Congress-IndonesiaInternational Conference on Renewable Energy and Energy Efficiency, 16-20 October 2011, Bali, Indonesia
_________________________________________________________________________________
RE Outlook (RESI/PREG)
4
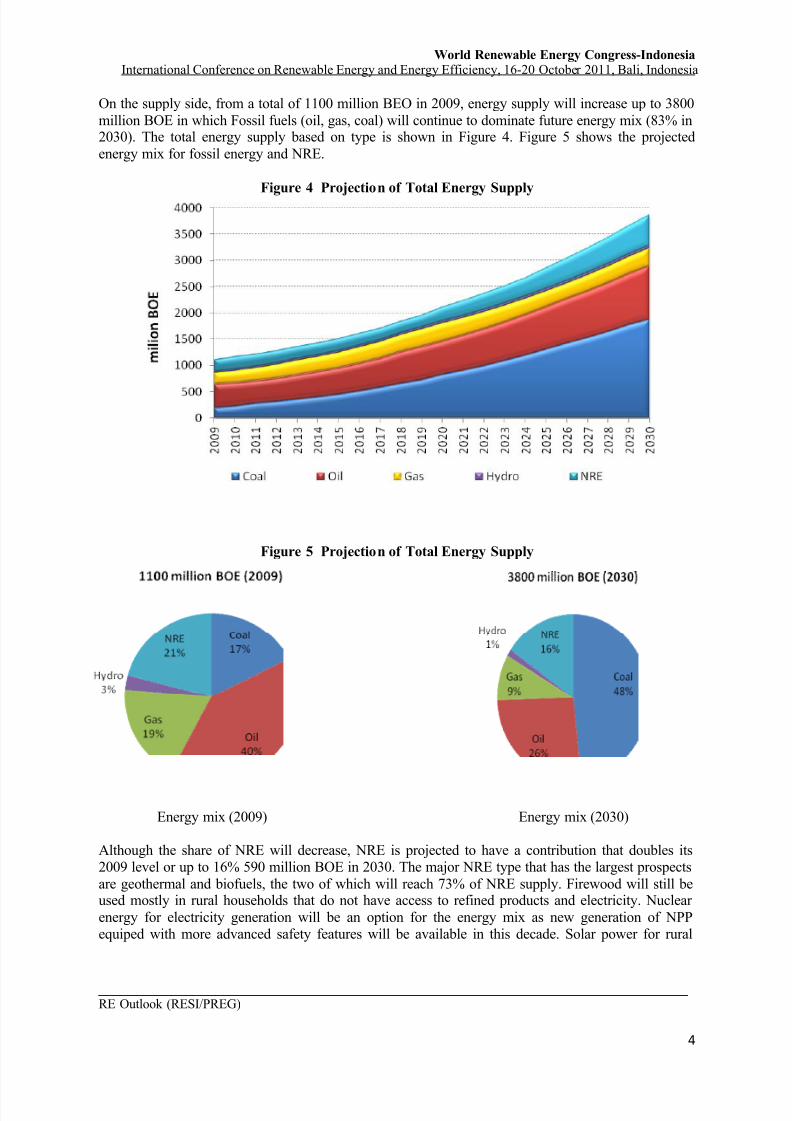
On the supply side, from a total of 1100 million BEO in 2009, energy supply will increase up to 3800
million BOE in which Fossil fuels (oil, gas, coal) will continue to dominate future energy mix (83% in2030). The total energy supply based on type is shown in Figure 4. Figure 5 shows the projected
energy mix for fossil energy and NRE.
Figure 4 Projection of Total Energy Supply
Figure 5 Projection of Total Energy Supply
Energy mix (2009) Energy mix (2030)
Although the share of NRE will decrease, NRE is projected to have a contribution that doubles its2009 level or up to 16% 590 million BOE in 2030. The major NRE type that has the largest prospects
are geothermal and biofuels, the two of which will reach 73% of NRE supply. Firewood will still beused mostly in rural households that do not have access to refined products and electricity. Nuclear
energy for electricity generation will be an option for the energy mix as new generation of NPPequiped with more advanced safety features will be available in this decade. Solar power for rural

8/3/2019 Adhidarma Et Al - RE Outlook-RESI-PREG
http://slidepdf.com/reader/full/adhidarma-et-al-re-outlook-resi-preg 5/8
World Renewable Energy Congress-IndonesiaInternational Conference on Renewable Energy and Energy Efficiency, 16-20 October 2011, Bali, Indonesia
_________________________________________________________________________________
RE Outlook (RESI/PREG)
5
electrification will continue to increase its share as solar cell technology become more available and
more affordable. Coal to Liquid (coal liquefaction or CTL) will be able to provide synthetic fuelsfrom coal up to 5 million kl per year, based on the Government’s energy policy. Figure 6 shows the
share of NRE by type in more detail.
Figure 6 Share of NRE by type
Electricity Power sector
The demand for electricity in the future will increase significantly. It is projected that electricityconsumption will reach up to 1.050 TWh in 2030 from 134 TWh (2009). To supply electricitydemand, the total generating capacity will increase from 31 GW (2009) to 180 GW (2030). Most of the generating capacity will based on coal power plants followed by NRE, hydro, gas fired, and Diesel
fuel.
Figure 7. Total Capacity of Electricity Generation
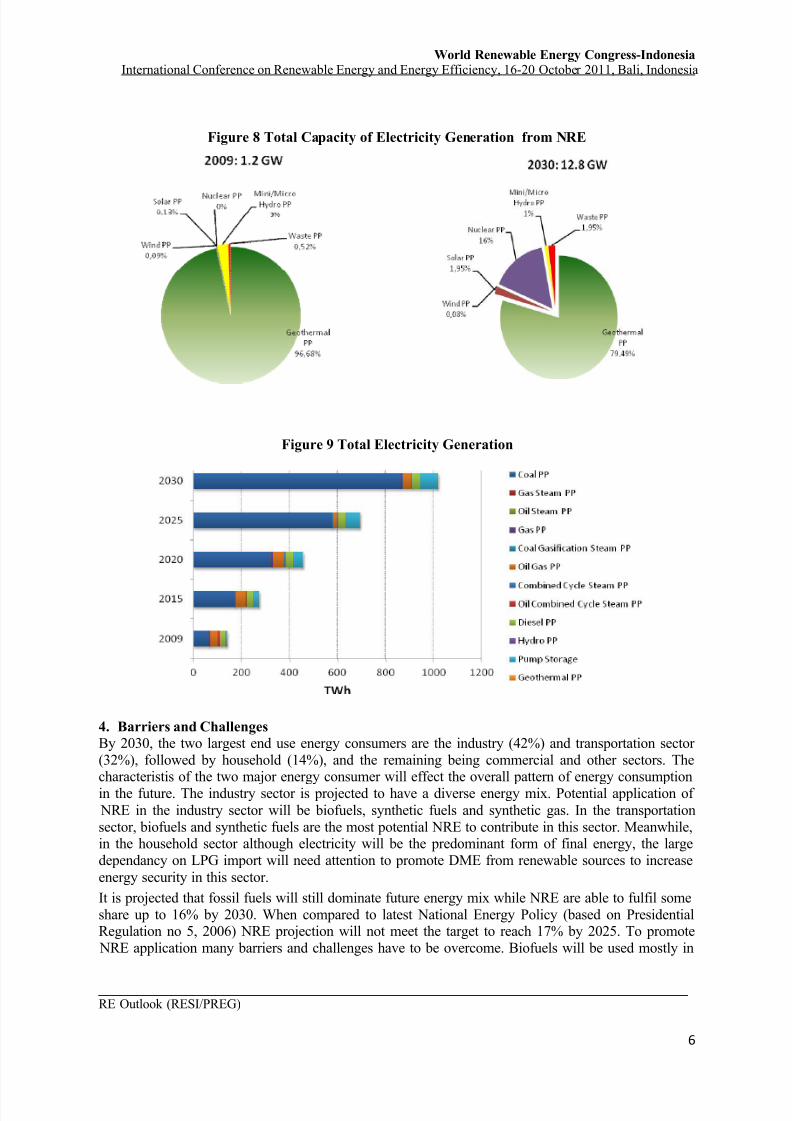
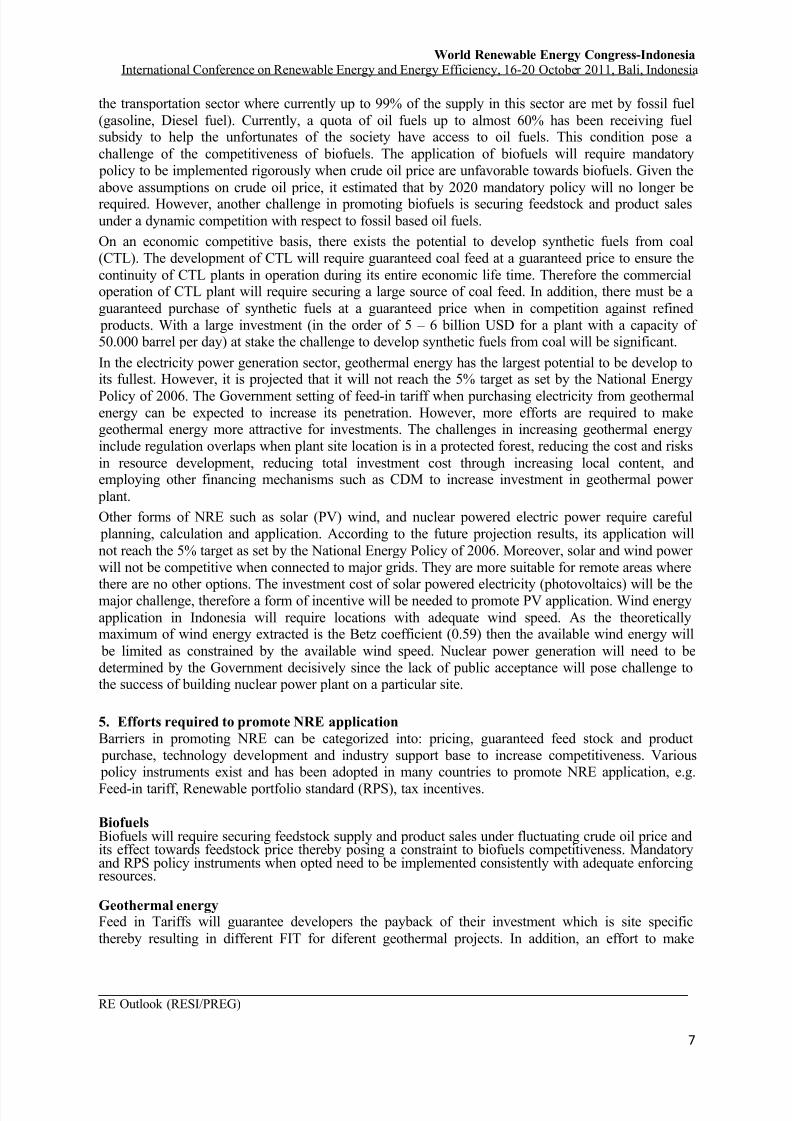
NRE power generation capacity is projected increase from 1.2 GW to reach 12 GW by 2030 (or contribute to 7% of total share). By 2030, most of the power generation from NRE will be supplied by
geothermal (79%), while mini/microhydro, solar, waste, and nuclear energy has the potential tocontribute up to 20% of total capacity.Similary to the projected capacity of power generation, the total electricity generation based on fueltype follows the same trend as that of projected power generation capacity.
8/3/2019 Adhidarma Et Al - RE Outlook-RESI-PREG
http://slidepdf.com/reader/full/adhidarma-et-al-re-outlook-resi-preg 6/8
World Renewable Energy Congress-IndonesiaInternational Conference on Renewable Energy and Energy Efficiency, 16-20 October 2011, Bali, Indonesia
_________________________________________________________________________________
RE Outlook (RESI/PREG)
6
Figure 8 Total Capacity of Electricity Generation from NRE
Figure 9 Total Electricity Generation
4. Barriers and Challenges
By 2030, the two largest end use energy consumers are the industry (42%) and transportation sector (32%), followed by household (14%), and the remaining being commercial and other sectors. Thecharacteristis of the two major energy consumer will effect the overall pattern of energy consumptionin the future. The industry sector is projected to have a diverse energy mix. Potential application of
NRE in the industry sector will be biofuels, synthetic fuels and synthetic gas. In the transportationsector, biofuels and synthetic fuels are the most potential NRE to contribute in this sector. Meanwhile,in the household sector although electricity will be the predominant form of final energy, the largedependancy on LPG import will need attention to promote DME from renewable sources to increase
energy security in this sector.
It is projected that fossil fuels will still dominate future energy mix while NRE are able to fulfil someshare up to 16% by 2030. When compared to latest National Energy Policy (based on PresidentialRegulation no 5, 2006) NRE projection will not meet the target to reach 17% by 2025. To promote NRE application many barriers and challenges have to be overcome. Biofuels will be used mostly in
8/3/2019 Adhidarma Et Al - RE Outlook-RESI-PREG
http://slidepdf.com/reader/full/adhidarma-et-al-re-outlook-resi-preg 7/8
World Renewable Energy Congress-IndonesiaInternational Conference on Renewable Energy and Energy Efficiency, 16-20 October 2011, Bali, Indonesia
_________________________________________________________________________________
RE Outlook (RESI/PREG)
7
the transportation sector where currently up to 99% of the supply in this sector are met by fossil fuel
(gasoline, Diesel fuel). Currently, a quota of oil fuels up to almost 60% has been receiving fuelsubsidy to help the unfortunates of the society have access to oil fuels. This condition pose a
challenge of the competitiveness of biofuels. The application of biofuels will require mandatory policy to be implemented rigorously when crude oil price are unfavorable towards biofuels. Given the
above assumptions on crude oil price, it estimated that by 2020 mandatory policy will no longer berequired. However, another challenge in promoting biofuels is securing feedstock and product sales
under a dynamic competition with respect to fossil based oil fuels.
On an economic competitive basis, there exists the potential to develop synthetic fuels from coal(CTL). The development of CTL will require guaranteed coal feed at a guaranteed price to ensure the
continuity of CTL plants in operation during its entire economic life time. Therefore the commercialoperation of CTL plant will require securing a large source of coal feed. In addition, there must be a
guaranteed purchase of synthetic fuels at a guaranteed price when in competition against refined products. With a large investment (in the order of 5 – 6 billion USD for a plant with a capacity of 50.000 barrel per day) at stake the challenge to develop synthetic fuels from coal will be significant.
In the electricity power generation sector, geothermal energy has the largest potential to be develop toits fullest. However, it is projected that it will not reach the 5% target as set by the National Energy
Policy of 2006. The Government setting of feed-in tariff when purchasing electricity from geothermalenergy can be expected to increase its penetration. However, more efforts are required to makegeothermal energy more attractive for investments. The challenges in increasing geothermal energyinclude regulation overlaps when plant site location is in a protected forest, reducing the cost and risks
in resource development, reducing total investment cost through increasing local content, andemploying other financing mechanisms such as CDM to increase investment in geothermal power
plant.
Other forms of NRE such as solar (PV) wind, and nuclear powered electric power require careful planning, calculation and application. According to the future projection results, its application will
not reach the 5% target as set by the National Energy Policy of 2006. Moreover, solar and wind power will not be competitive when connected to major grids. They are more suitable for remote areas where
there are no other options. The investment cost of solar powered electricity (photovoltaics) will be themajor challenge, therefore a form of incentive will be needed to promote PV application. Wind energy
application in Indonesia will require locations with adequate wind speed. As the theoreticallymaximum of wind energy extracted is the Betz coefficient (0.59) then the available wind energy will
be limited as constrained by the available wind speed. Nuclear power generation will need to bedetermined by the Government decisively since the lack of public acceptance will pose challenge tothe success of building nuclear power plant on a particular site.
5. Efforts required to promote NRE application
Barriers in promoting NRE can be categorized into: pricing, guaranteed feed stock and product purchase, technology development and industry support base to increase competitiveness. Various policy instruments exist and has been adopted in many countries to promote NRE application, e.g.
Feed-in tariff, Renewable portfolio standard (RPS), tax incentives.
BiofuelsBiofuels will require securing feedstock supply and product sales under fluctuating crude oil price andits effect towards feedstock price thereby posing a constraint to biofuels competitiveness. Mandatoryand RPS policy instruments when opted need to be implemented consistently with adequate enforcingresources.
Geothermal energyFeed in Tariffs will guarantee developers the payback of their investment which is site specific
thereby resulting in different FIT for diferent geothermal projects. In addition, an effort to make

8/3/2019 Adhidarma Et Al - RE Outlook-RESI-PREG
http://slidepdf.com/reader/full/adhidarma-et-al-re-outlook-resi-preg 8/8
World Renewable Energy Congress-IndonesiaInternational Conference on Renewable Energy and Energy Efficiency, 16-20 October 2011, Bali, Indonesia
_________________________________________________________________________________
RE Outlook (RESI/PREG)
8
regulations in different sectors (forestry, mining, industry, etc) coherent and consistent will support
geothermal energy development.
Solar, Wind, Nuclear energy
Solar and wind power applciation require careful planning and calculation to ensure their feasibility.
As they are not competitive when connected to major grids, they are constructed on a closed systemsupplying electricity at remote areas where electricity generation using oil fuels are more expensive.
In addition to technical and economical aspects, the application of nuclear energy require moreintensive efforts to educate public acceptance based on credible and fair information.
6. Conclusion
This paper has discussed future projections of NRE application in various sectors of the Indonesiaeconomy based on BPPT energy model. Biofuels and geothermal are the two major NRE that deservesupport for their promotion. Major challenge in promoting biofuels include securing feed and product
sales, competitiveness against fossil based oil fuels. Policy instruments such as feed-in price, biofuelsubsidy may be employed as a temporary approah to develop biofuels market. Geothermal energy hasa large potential to be fully developed as source of electric power generation. Feed-in Tariff based on
a specific site need to be examined carefuly. In addition the coherency of regulations accross differentsectors (forestry, mining, industry, etc) need to be developed to support geothermal energy. Other types of NRE such as solar and wind power require careful planning and calculation to ensure its
feasibility.
7. Reference
1) Anon.,Renewables 2010 Global Status Report, REN21, 2010.2) Adhi D. Permana, et.al., BPPT Indonesia Energy Outlook, 20113) Anon., Handbook of Energy & Economic Statistics of Indonesia,MEMR, 20104) Jane Early, US Trade Policies on Biofuels and Sustainable Development, 2009
5)
Wallace E. Tyner and Farzad Thaeripou, Future Biofuels Policy Alternatives, 2007