adf foods ltd. buy
TRANSCRIPT

ADF Foods Ltd. BUY
- 1 - Wednesday, 27th December, 2018
This document is for private circulation, and must be read in conjunction with the disclaimer on the last page.
ST
OC
K P
OIN
TE
R
Target Price ₹ 349 CMP₹ 260 FY21E PE 18
Index Details ADF Foods Ltd (ADF) after having seen stagnating revenues for the
period FY11-16 has seen the trajectory improve since then. We believe
that this is sustainable given the fact that the management foray into
frozen foods has met with good success. The recent capex (Rs 12 cr)
to enhance frozen food capacity at its Nadiad plant will help bolster
revenue growth over the next few years.
The manufacturing operations at its US subsidiary, Elena were a drag
on the operating performance. Closure of this manufacturing facility
and shift to outsourcing has helped ADF arrest the decline in the
profitability and improve the performance on all operating matrics.
ADF having negligible debt is undertaking buyback in the current fiscal.
This follow up buyback (Rs 30 crore) comes close on the heels of a
previous buyback (Rs 18 crore) and capex (Rs 10-12 crore) to be
completed by March 2019. This implies that management has
confidence in the future cash flow generation. We believe that the
company operating cash flows should cumulate to Rs 98 crore by FY
21.
We initiate coverage with a BUY for a price target of Rs 349 representing
an upside of 33% from the CMP of Rs 260 over the next 21 months. We
expect the revenues to grow at 16.8% CAGR to INR 333 crores by FY
2021. On the back of robust revenues, we expect the EBITDA and PAT
to grow to Rs. 53 crores (21.6% CAGR) and Rs. 39 crores (29% CAGR)
respectively over the same period. Operating margins are also set to
improve by 180 bps to 15.9%. Return ratios ROE & ROCE are also
expected to remain elevated at 16.8% & 19.7% respectively.
Sensex 35,649
Nifty 10,729
Industry FMCG
Scrip Details
MktCap (`cr) 520
BVPS (`) 80.7
O/s Shares (Cr) 2.01
AvVol 42,473
52 Week H/L 337/191.0
Div Yield (%) 0
FVPS (`) 10.0
Shareholding Pattern
Shareholders %
Promoters 32.3
Public 67.7
Total 100.0
ADF Foods vs. Sensex
0.0050.00100.00150.00200.00250.00300.00350.00
0.00
10000.00
20000.00
30000.00
40000.00
50000.00
SENSEX ADF
Key Financials (Rs in cr)

- 2 -Wednesday, 27th December, 2018
This document is for private circulation, and must be read in conjunction with the disclaimer on the last page.
Our optimism stems from the following:-
• Sales are expected to grow at a CAGR of 16.8% to Rs 333
crores driven by a faster growth in frozen food under Ashoka
brand. Camel and Aeroplane brands have demonstrated
robust growth. The capex of Rs 10-12 crores should help
scale up business significantly and improve operating
margins.
• EBITDA is expected to grow at a CAGR of 21.6% from Rs 29.4
crores in FY18 to Rs 52.9 crores in FY21.
• Operating cashflows are expected to grow at CAGR of 16.8%
from Rs 24.3 crore in FY18 to Rs 38.7 crore in FY21.

- 3 -Wednesday, 27th December, 2018
This document is for private circulation, and must be read in conjunction with the disclaimer on the last page.
❖ Company Background
ADF Foods is a food processing company and its products include
- an array of traditional ethnic Indian, spicy Mexican and exotic mediterranean
foods.
- frozen foods, salted, sweet & savory pickles and the wide variety of pizza &
pasta sauces.
Its brand includes Ashoka, Soul, PJ’s, Nates, Camel, Aeroplane and Truly Indian.
This have been catering to the native and the international palate from the very
beginning.
It has a strong network of over 180 distributors in over 52 countries making it one
of the leading ethnic Indian food companies in the world.
ADF Foods and product portfolio
Source: Company, Ventura Research,
- 4 -Wednesday, 27th December, 2018
This document is for private circulation, and must be read in conjunction with the disclaimer on the last page.
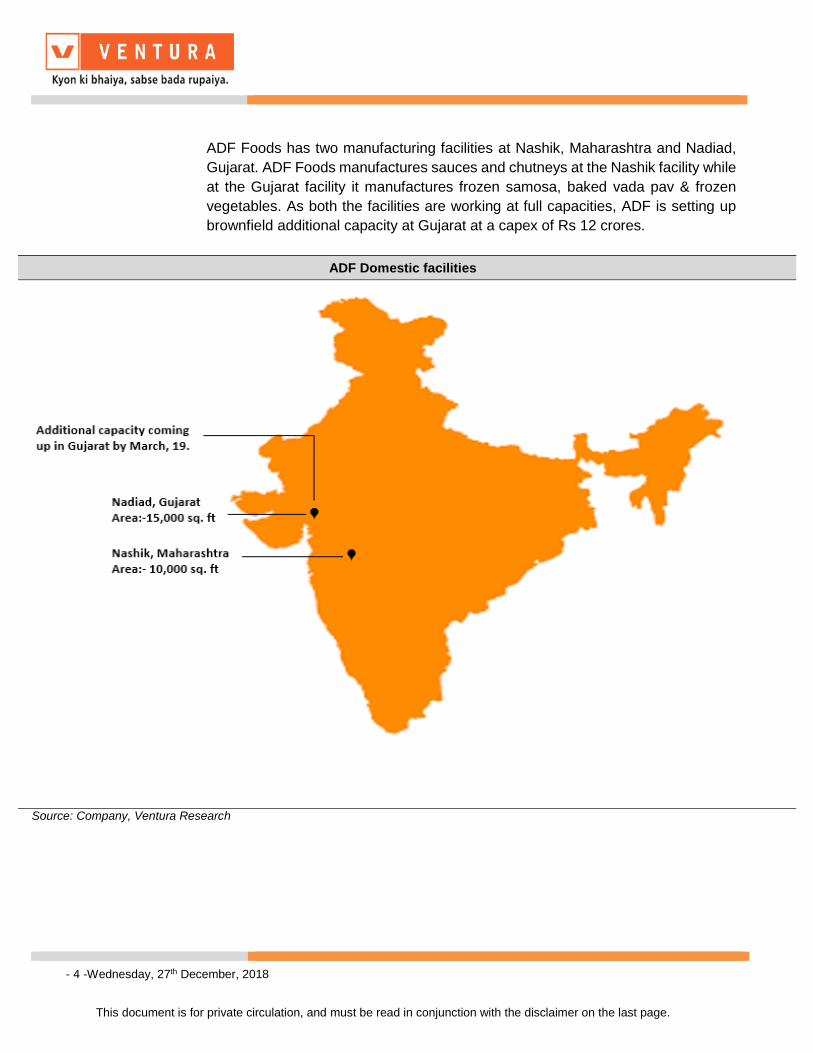
ADF Foods has two manufacturing facilities at Nashik, Maharashtra and Nadiad,
Gujarat. ADF Foods manufactures sauces and chutneys at the Nashik facility while
at the Gujarat facility it manufactures frozen samosa, baked vada pav & frozen
vegetables. As both the facilities are working at full capacities, ADF is setting up
brownfield additional capacity at Gujarat at a capex of Rs 12 crores.
ADF Domestic facilities
Source: Company, Ventura Research,

- 5 -Wednesday, 27th December, 2018
This document is for private circulation, and must be read in conjunction with the disclaimer on the last page.
Name Designation Prior experience
Bimal Thakkar Chairman, Managing Director &
C.E.O
He is B.Com., Diploma (Export) and has been an Executive
Chairman of ADF Foods Limited since June 5, 2018. Mr. Thakkar
serves as MD of ADF Holdings (USA) Ltd. He has over 20 years of
experience and is spearheading the ADF Group. He has been
instrumental in expansion of the business and promoting the ADF
Group's products in international markets, development of Brands
and creating new markets.
Ravinder Kumar Jain Independent Non-executive
Director
1971-74-MD- Warner Hindustan
1992-99- MD-Shaw Wallace Ltd.
1974-2006- Brand Manager of Mcdowel & Co.
2006-present- Non-executive director at ADF Foods Ltd.
Anjali Seth Independent Non-executive Director She served as a Non-Executive & Independent Director at Adlabs
Entertainment Limited since April, 2014 to Nov,2018. She is also
on board of Endurance Technologies Limited since June, 2016 and
Centrum Capital Ltd since November, 2018 .
Viren Merchant Independent Non-executive Director Mr. Viren A. Merchant has been an Independent Non Executive
Director of ADF Foods Limited since August 10, 2016. Mr.
Merchant also serves as a Director of ZYG Pharma Private Limited
and Encore group.
Naresh Lakshman
Singh Kothari
Independent Non-executive
Director
He has been Independent Additional Director at ADF Foods Limited
since May 12, 2017. He has also been on board Director of B.L.
Kashyap and Sons Limited since December 12, 2014.
Key Management personnel

- 6 -Wednesday, 27th December, 2018
This document is for private circulation, and must be read in conjunction with the disclaimer on the last page.
❖ Key Investment Rationale.
Revenues set for robust growth.
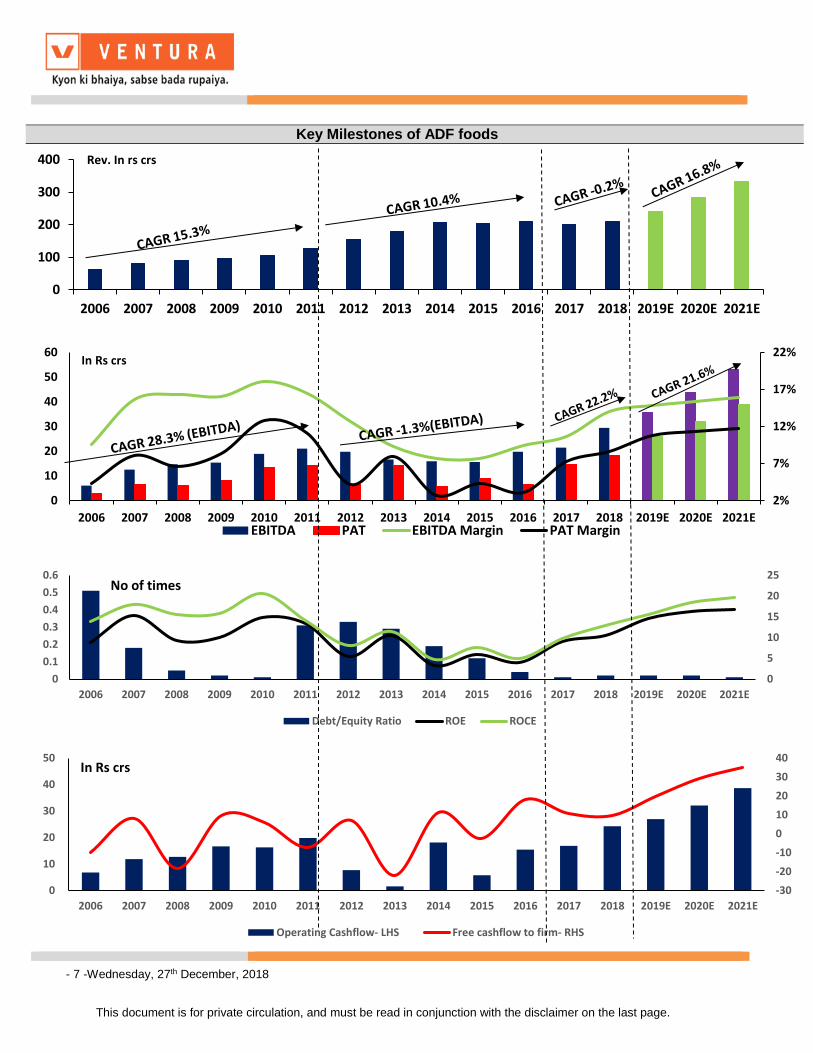
ADF exhibited strong growth over the period FY11-16.
From FY 06-11, ADF’s sales grew at a CAGR of 15.3% to Rs 128 crores while
EBITDA grew at a rapid 28.3% CAGR. Margin during this period also increased by
679 bps to 16.4%.
Decision to acquire Elena Foods, USA backfires.
ADF acquired Elena Foods in FY11 to foray in the Mexican foods products.
However, ADF incurred cumulative loss of ~Rs 35 crores during the period FY11-
16 due to operational losses and product recalls.
Over the fiscal period FY 11-16, ADF’s performance remained stagnant. Revenue
during this period grew at a CAGR of 10.4% to Rs 210 crores. At the same time,
EBITDA and net earnings grew at a dismal CAGR of 4.9% and 3.6% to Rs 29.4
crores and Rs 14.6 crores respectively. This resulted in EBITDA and PAT margins
decreasing by 230 bps and 240 bps to 14.1% and 8.7% respectively as it struggled
with its inefficient operations.
Finally, in Dec FY16 the company decided to shutdown manufacturing at Elena
and outsource all manufacturing. This proved to be a succor for its operations as
the profitability decline was arrested.
FY17-18 a period of consolidation
FY17-18 was a period of consolidation, wherein revenue growth was flattish, but
EBITDA and PAT margins improved by 469 bps and 552 bps to 14.1% and 8.7%
respectively. The change in the sales mix in favor of frozen foods and outsourcing
helped script the improvement.
FY19-21 growth expected to accelerate.
Going ahead we expect revenue to grow at a CAGR of 16.8% to Rs 333 crores by
FY 21 to be driven by:
1) Volume growth of 12% in overall revenue led by 22% volume growth in high
margin frozen food segment.
- 7 -Wednesday, 27th December, 2018
This document is for private circulation, and must be read in conjunction with the disclaimer on the last page.
Key Milestones of ADF foods
0
100
200
300
400
2006 2007 2008 2009 2010 2011 2012 2013 2014 2015 2016 2017 2018 2019E 2020E 2021E
Rev. In rs crs
2%
7%
12%
17%
22%
0
10
20
30
40
50
60
2006 2007 2008 2009 2010 2011 2012 2013 2014 2015 2016 2017 2018 2019E 2020E 2021EEBITDA PAT EBITDA Margin PAT Margin
In Rs crs
0
5
10
15
20
25
0
0.1
0.2
0.3
0.4
0.5
0.6
2006 2007 2008 2009 2010 2011 2012 2013 2014 2015 2016 2017 2018 2019E 2020E 2021E
Debt/Equity Ratio ROE ROCE
No of times
-30
-20
-10
0
10
20
30
40
0
10
20
30
40
50
2006 2007 2008 2009 2010 2011 2012 2013 2014 2015 2016 2017 2018 2019E 2020E 2021E
Operating Cashflow- LHS Free cashflow to firm- RHS
In Rs crs

- 8 -Wednesday, 27th December, 2018
This document is for private circulation, and must be read in conjunction with the disclaimer on the last page.
2) Improved focus by appointing 3-4 country managers, one for each geography.
3) Rupee depreciation benefits as 95% of revenue is being exported.
ADF foods scouting for opportunities as business throws up good cash.
ADF Foods is a debt free company and a highly profitable cash machine. This is
evident from the fact that it has undertaken a buyback (Rs 18 crores in July 2016)
and a capex of Rs 10-12 crores without raising debt. It continues to return cash to
shareholders and is undertaking a buyback of Rs 30 crores in the current fiscal.
Also, the management have guided that they are looking for opportunities to grow
inorganically through acquisitions. As per our estimate ADF should generate
cumulative operating cashflow of Rs 98 crores over the period FY19-21. This we
believe would be the currency for acquisitions and launch the company to another
level of growth.
Operating cashflows are expected to grow at CAGR of 16.8% from Rs 24.3 crore
in FY17 to Rs 38.7 crore in FY21. Cash flow generation outstrips the investment
needs.

- 9 -Wednesday, 27th December, 2018
This document is for private circulation, and must be read in conjunction with the disclaimer on the last page.
Brand name Products
Soul Pickles, sauces & Paneer Makhani.
Camel
Condiment paste & Cooking
sauces
Ashoka
Nate
Truly Indian
Ponk, Chutney, Tandoori pastes,
baked vada pav & punjabi samosa
Ginger paste, Mango Pickles and
lemon chilly pickle
Meatless meatballs, Indian Bistro-
Chaats and Aloo tikki chaat

- 10 -Wednesday, 27th December, 2018
This document is for private circulation, and must be read in conjunction with the disclaimer on the last page.
❖ Industry outlook in in brief.
❖ Financial Performance
In Q4FY18, ADF Foods reported a healthy 31% growth in topline to Rs 63.1 crores from Rs 48.2 crores reported in the same quarter of the previous year. The EBITDA margin increased 1000 bps to 22.9% from 12.9%, mainly on account of increasing frozen foods revenue in product mix. PAT stood at Rs 10.4 crores increasing 75.2% YoY. During FY18, company net sales stood at Rs 208.9 crore registering a growth of 4% YOY. EBITDA margin increased by 300 bps YOY to 14%. PAT increased by 2%YOY.
The food processing sector in India has gained prominence in recent years. A well-developed food processing sector
with higher level of processing helps in the reduction of wastage, improves value addition, promotes crop diversification,
ensure better return to the farmers, employment as well as increases export earnings. This sector is also capable of
addressing critical issues of food security, food inflation and providing wholesome, nutritious food to the masses.
The India’s food processing industry is poised for huge growth. It is likely to grow 258 billion USD in the year 2015 to
482 billion USD in the year 2020.
The exports of food items have been rising steadily. During FY11-16, India’s exports of processed food and related
products grew at 11.7% CAGR, reaching 16.2 billion USD.
The department of Industrial Policy and Promotion (DIPP) has stated that the food processing has been identified as
one of the 10 key sectors under make in India as it presents an attractive capital and technology investment opportunity
for domestic and foreign investors.
According to the data provided by the department of Industrial and Promotion (DIPP), the food processing sector in India
has received around 7.47 billion $ worth of Foreign Direct Investment (FDI) during the period April 2000- December
2016. The Confederation of Indian Industry (CII) estimates that the food processing sectors have the potential to attract
as much as 33 billion $ of investment over the next 10 years and also the generate employment of 9 million person-
days.

- 11 -Wednesday, 27th December, 2018
This document is for private circulation, and must be read in conjunction with the disclaimer on the last page.
Financial performance (Rs in crores)
Source: Ventura Research
- 12 -Wednesday, 27th December, 2018
This document is for private circulation, and must be read in conjunction with the disclaimer on the last page.
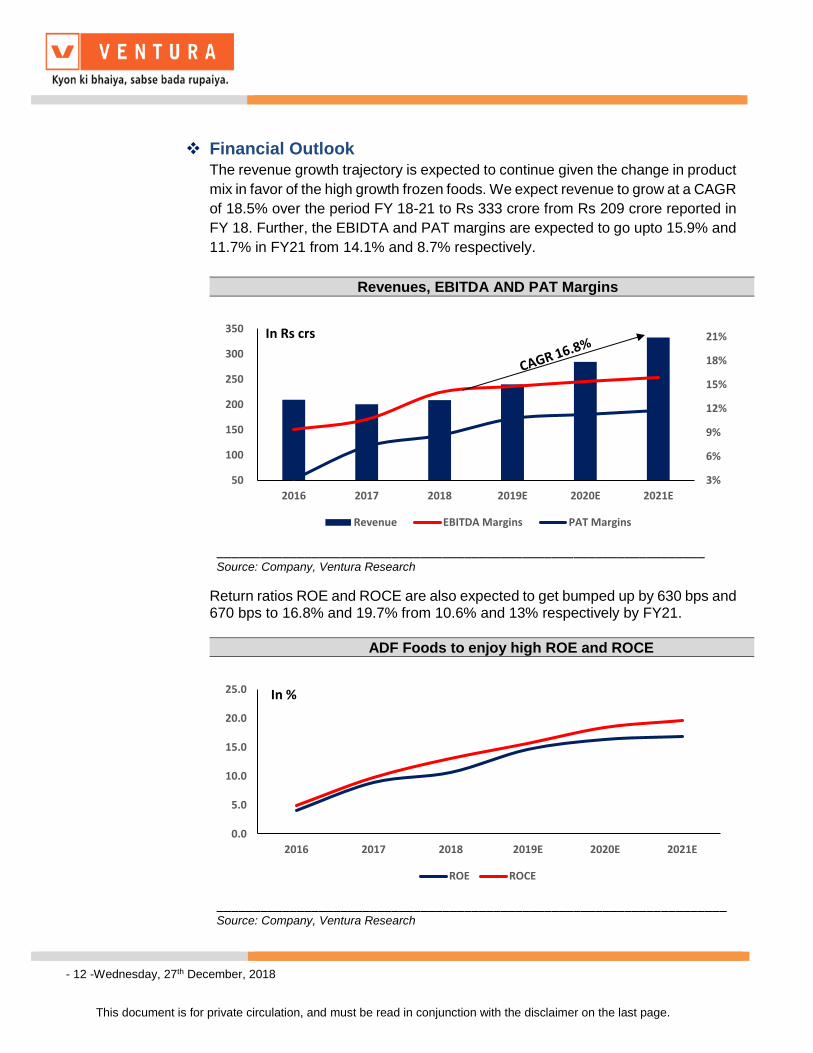
❖ Financial Outlook
The revenue growth trajectory is expected to continue given the change in product
mix in favor of the high growth frozen foods. We expect revenue to grow at a CAGR
of 18.5% over the period FY 18-21 to Rs 333 crore from Rs 209 crore reported in
FY 18. Further, the EBIDTA and PAT margins are expected to go upto 15.9% and
11.7% in FY21 from 14.1% and 8.7% respectively.
Revenues, EBITDA AND PAT Margins
___________________________________________________________________ Source: Company, Ventura Research
Return ratios ROE and ROCE are also expected to get bumped up by 630 bps and 670 bps to 16.8% and 19.7% from 10.6% and 13% respectively by FY21.
ADF Foods to enjoy high ROE and ROCE
______________________________________________________________________ Source: Company, Ventura Research
3%
6%
9%
12%
15%
18%
21%
50
100
150
200
250
300
350
2016 2017 2018 2019E 2020E 2021E
Revenue EBITDA Margins PAT Margins
In Rs crs
0.0
5.0
10.0
15.0
20.0
25.0
2016 2017 2018 2019E 2020E 2021E
ROE ROCE
In %

- 13 -Wednesday, 27th December, 2018
This document is for private circulation, and must be read in conjunction with the disclaimer on the last page.
❖ Key risks and threats
• The low prooter holding of 33% shows very low skin in the game. However, this is expected to go up post the buy back.
• Increase in the prices of raw material and packing material due to seasonality.
• Intense Competition from other Organized player in Domestic Market like ITC, Kohinoor, MTR, Gilts in Ready to eat Segment and from Tasty bites in International Market.
• Exchange rate fluctuations on account of Brexit.
• Change in consumer preferences for fresh food.
• Economic slowdown can affect the demand of the economy. People will spend less money on the discretionary items which will hit the FMCG Industry.
❖ Valuation
We initiate coverage on ADF as a BUY, with a price objective of Rs. 349 (18x FY20 earnings) over the next 21 months representing upside of 33%. We value the stock at a 10% discount to its weighted average PE of 20x.
Peer comparison on financial parameters
Source: Ventura Research

- 14 -Wednesday, 27th December, 2018
This document is for private circulation, and must be read in conjunction with the disclaimer on the last page.
ADF PB trend
Source: Company, Ventura Research
ADF PE trend
Source: Company, Ventura Research
ADF EV/EBITDA trend
Source: Company, Ventura Research
- 15 -Wednesday, 27th December, 2018
This document is for private circulation, and must be read in conjunction with the disclaimer on the last page.
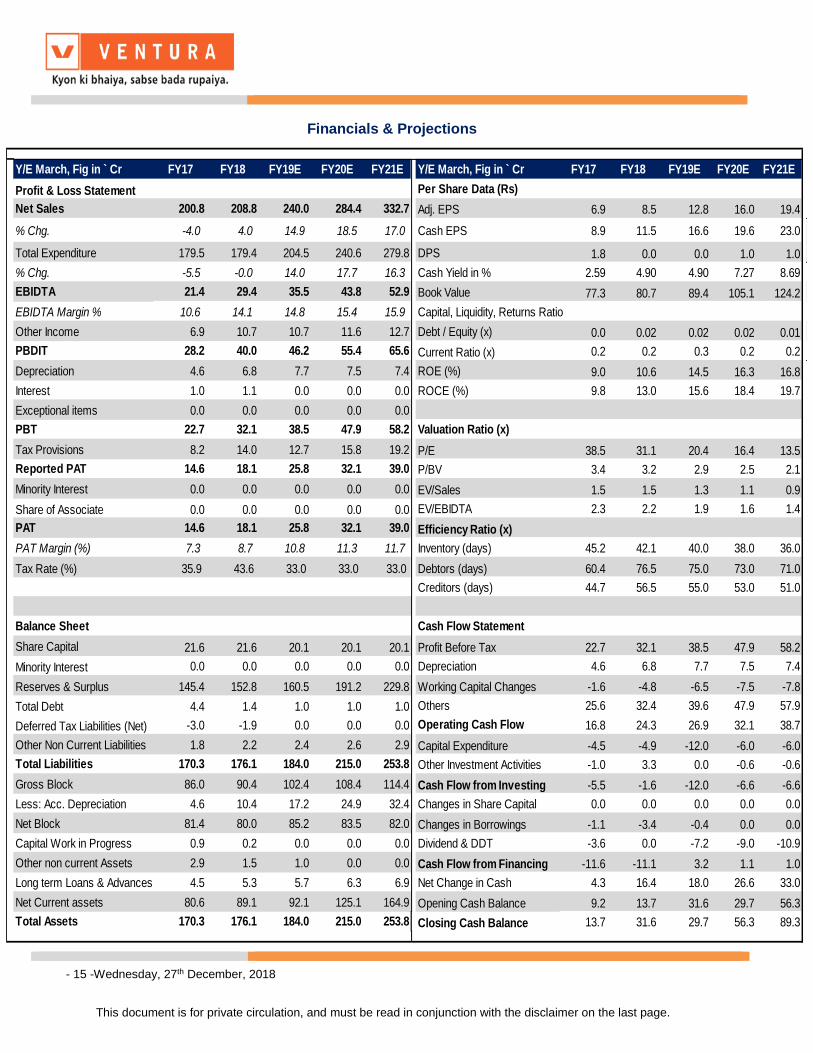
Financials & Projections
Y/E March, Fig in ` Cr FY17 FY18 FY19E FY20E FY21E Y/E March, Fig in ` Cr FY17 FY18 FY19E FY20E FY21E
Profit & Loss Statement Per Share Data (Rs)
Net Sales 200.8 208.8 240.0 284.4 332.7 Adj. EPS 6.9 8.5 12.8 16.0 19.4
% Chg. -4.0 4.0 14.9 18.5 17.0 Cash EPS 8.9 11.5 16.6 19.6 23.0
Total Expenditure 179.5 179.4 204.5 240.6 279.8 DPS 1.8 0.0 0.0 1.0 1.0
% Chg. -5.5 -0.0 14.0 17.7 16.3 Cash Yield in % 2.59 4.90 4.90 7.27 8.69
EBIDTA 21.4 29.4 35.5 43.8 52.9 Book Value 77.3 80.7 89.4 105.1 124.2
EBIDTA Margin % 10.6 14.1 14.8 15.4 15.9 Capital, Liquidity, Returns Ratio
Other Income 6.9 10.7 10.7 11.6 12.7 Debt / Equity (x) 0.0 0.02 0.02 0.02 0.01
PBDIT 28.2 40.0 46.2 55.4 65.6 Current Ratio (x) 0.2 0.2 0.3 0.2 0.2
Depreciation 4.6 6.8 7.7 7.5 7.4 ROE (%) 9.0 10.6 14.5 16.3 16.8
Interest 1.0 1.1 0.0 0.0 0.0 ROCE (%) 9.8 13.0 15.6 18.4 19.7
Exceptional items 0.0 0.0 0.0 0.0 0.0
PBT 22.7 32.1 38.5 47.9 58.2 Valuation Ratio (x)
Tax Provisions 8.2 14.0 12.7 15.8 19.2 P/E 38.5 31.1 20.4 16.4 13.5
Reported PAT 14.6 18.1 25.8 32.1 39.0 P/BV 3.4 3.2 2.9 2.5 2.1
Minority Interest 0.0 0.0 0.0 0.0 0.0 EV/Sales 1.5 1.5 1.3 1.1 0.9
Share of Associate 0.0 0.0 0.0 0.0 0.0 EV/EBIDTA 2.3 2.2 1.9 1.6 1.4
PAT 14.6 18.1 25.8 32.1 39.0 Efficiency Ratio (x)
PAT Margin (%) 7.3 8.7 10.8 11.3 11.7 Inventory (days) 45.2 42.1 40.0 38.0 36.0
Tax Rate (%) 35.9 43.6 33.0 33.0 33.0 Debtors (days) 60.4 76.5 75.0 73.0 71.0
Creditors (days) 44.7 56.5 55.0 53.0 51.0
Balance Sheet Cash Flow Statement
Share Capital 21.6 21.6 20.1 20.1 20.1 Profit Before Tax 22.7 32.1 38.5 47.9 58.2
Minority Interest 0.0 0.0 0.0 0.0 0.0 Depreciation 4.6 6.8 7.7 7.5 7.4
Reserves & Surplus 145.4 152.8 160.5 191.2 229.8 Working Capital Changes -1.6 -4.8 -6.5 -7.5 -7.8
Total Debt 4.4 1.4 1.0 1.0 1.0 Others 25.6 32.4 39.6 47.9 57.9
Deferred Tax Liabilities (Net) -3.0 -1.9 0.0 0.0 0.0 Operating Cash Flow 16.8 24.3 26.9 32.1 38.7
Other Non Current Liabilities 1.8 2.2 2.4 2.6 2.9 Capital Expenditure -4.5 -4.9 -12.0 -6.0 -6.0
Total Liabilities 170.3 176.1 184.0 215.0 253.8 Other Investment Activities -1.0 3.3 0.0 -0.6 -0.6
Gross Block 86.0 90.4 102.4 108.4 114.4 Cash Flow from Investing -5.5 -1.6 -12.0 -6.6 -6.6
Less: Acc. Depreciation 4.6 10.4 17.2 24.9 32.4 Changes in Share Capital 0.0 0.0 0.0 0.0 0.0
Net Block 81.4 80.0 85.2 83.5 82.0 Changes in Borrowings -1.1 -3.4 -0.4 0.0 0.0
Capital Work in Progress 0.9 0.2 0.0 0.0 0.0 Dividend & DDT -3.6 0.0 -7.2 -9.0 -10.9
Other non current Assets 2.9 1.5 1.0 0.0 0.0 Cash Flow from Financing -11.6 -11.1 3.2 1.1 1.0
Long term Loans & Advances 4.5 5.3 5.7 6.3 6.9 Net Change in Cash 4.3 16.4 18.0 26.6 33.0
Net Current assets 80.6 89.1 92.1 125.1 164.9 Opening Cash Balance 9.2 13.7 31.6 29.7 56.3
Total Assets 170.3 176.1 184.0 215.0 253.8 Closing Cash Balance 13.7 31.6 29.7 56.3 89.3

- 16 -Wednesday, 27th December, 2018
This document is for private circulation, and must be read in conjunction with the disclaimer on the last page.
Disclosures and Disclaimer Ventura Securities Limited (VSL) is a SEBI registered intermediary offering broking, depository and portfolio management services to clients. VSL is member of BSE, NSE and MCX-SX. VSL is a depository participant of NSDL. VSL states that no disciplinary action whatsoever has been taken by SEBI against it in last five years except administrative warning issued in connection with technical and venial lapses observed while inspection of books of accounts and records. Ventura Commodities Limited, Ventura Guaranty Limited, Ventura Insurance Brokers Limited and Ventura Allied Services Private Limited are associates of VSL. Research Analyst (RA) involved in the preparation of this research report and VSL disclose that neither RA nor VSL nor its associates (i) have any financial interest in the company which is the subject matter of this research report (ii) holds ownership of one percent or more in the securities of subject company (iii) have any material conflict of interest at the time of publication of this research report (iv) have received any compensation from the subject company in the past twelve months (v) have managed or co-managed public offering of securities for the subject company in past twelve months (vi) have received any compensation for investment banking merchant banking or brokerage services from the subject company in the past twelve months (vii) have received any compensation for product or services from the subject company in the past twelve months (viii) have received any compensation or other benefits from the subject company or third party in connection with the research report. RA involved in the preparation of this research report discloses that he / she has not served as an officer, director or employee of the subject company. RA involved in the preparation of this research report and VSL discloses that they have not been engaged in the market making activity for the subject company. Our sales people, dealers, traders and other professionals may provide oral or written market commentary or trading strategies to our clients that reflect opinions that are contrary to the opinions expressed herein. We may have earlier issued or may issue in future reports on the companies covered herein with recommendations/ information inconsistent or different those made in this report. In reviewing this document, you should be aware that any or all of the foregoing, among other things, may give rise to or potential conflicts of interest. We may rely on information barriers, such as "Chinese Walls" to control the flow of information contained in one or more areas within us, or other areas, units, groups or affiliates of VSL. This report is for information purposes only and this document/material should not be construed as an offer to sell or the solicitation of an offer to buy, purchase or subscribe to any securities, and neither this document nor anything contained herein shall form the basis of or be relied upon in connection with any contract or commitment whatsoever. This document does not solicit any action based on the material contained herein. It is for the general information of the clients / prospective clients of VSL. VSL will not treat recipients as clients by virtue of their receiving this report. It does not constitute a personal recommendation or take into account the particular investment objectives, financial situations, or needs of clients / prospective clients. Similarly, this document does not have regard to the specific investment objectives, financial situation/circumstances and the particular needs of any specific person who may receive this document. The securities discussed in this report may not be suitable for all investors. The appropriateness of a particular investment or strategy will depend on an investor's individual circumstances and objectives. Persons who may receive this document should consider and independently evaluate whether it is suitable for his/ her/their particular circumstances and, if necessary, seek professional/financial advice. And such person shall be responsible for conducting his/her/their own investigation and analysis of the information contained or referred to in this document and of evaluating the merits and risks involved in the securities forming the subject matter of this document. The projections and forecasts described in this report were based upon a number of estimates and assumptions and are inherently subject to significant uncertainties and contingencies. Projections and forecasts are necessarily speculative in nature, and it can be expected that one or more of the estimates on which the projections and forecasts were based will not materialize or will vary significantly from actual results, and such variances will likely increase over time. All projections and forecasts described in this report have been prepared solely by the authors of this report independently of the Company. These projections and forecasts were not prepared with a view toward compliance with published guidelines or generally accepted accounting principles. No independent accountants have expressed an opinion or any other form of assurance on these projections or forecasts. You should not regard the inclusion of the projections and forecasts described herein as a representation or warranty by VSL, its associates, the authors of this report or any other person that these projections or forecasts or their underlying assumptions will be achieved. For these reasons, you should only consider the projections and forecasts described in this report after carefully evaluating all of the information in this report, including the assumptions underlying such projections and forecasts. The price and value of the investments referred to in this document/material and the income from them may go down as well as up, and investors may realize losses on any investments. Past performance is not a guide for future performance. Future returns are not guaranteed and a loss of original capital may occur. Actual results may differ materially from those set forth in projections. Forward-looking statements are not predictions and may be subject to change without notice. We do not provide tax advice to our clients, and all investors are strongly advised to consult regarding any potential investment. VSL, the RA involved in the preparation of this research report and its associates accept no liabilities for any loss or damage of any kind arising out of the use of this report. This report/document has been prepared by VSL, based upon information available to the public and sources, believed to be reliable. No representation or warranty, express or implied is made that it is accurate or complete. VSL has reviewed the report and, in so far as it includes current or historical information, it is believed to be reliable, although its accuracy and completeness cannot be guaranteed. The opinions expressed in this document/material are subject to change without notice and have no obligation to tell you when opinions or information in this report change. This report or recommendations or information contained herein do/does not constitute or purport to constitute investment advice in publicly accessible media and should not be reproduced, transmitted or published by the recipient. The report is for the use and consumption of the recipient only. This publication may not be distributed to the public used by the public media without the express written consent of VSL. This report or any portion hereof may not be printed, sold or distributed without the written consent of VSL. This document does not constitute an offer or invitation to subscribe for or purchase or deal in any securities and neither this document nor anything contained herein shall form the basis of any contract or commitment whatsoever. This document is strictly confidential and is being furnished to you solely for your information, may not be distributed to the press or other media and may not be reproduced or redistributed to any other person. The opinions and projections expressed herein are entirely those of the author and are given as part of the normal research activity of VSL and are given as of this date and are subject to change without notice. Any opinion estimate or projection herein constitutes a view as of the date of this report and there can be no assurance that future results or events will be consistent with any such opinions, estimate or projection. This document has not been prepared by or in conjunction with or on behalf of or at the instigation of, or by arrangement with the company or any of its directors or any other person. Information in this document must not be relied upon as having been authorized or approved by the company or its directors or any other person. Any opinions and projections contained herein are entirely those of the authors. None of the company or its directors or any other person accepts any liability whatsoever for any loss arising from any use of this document or its contents or otherwise arising in connection therewith. The information contained herein is not intended for publication or distribution or circulation in any manner whatsoever and any unauthorized reading, dissemination, distribution or copying of this communication is prohibited unless otherwise expressly authorized. Please ensure that you have read “Risk Disclosure Document for Capital Market and Derivatives Segments” as prescribed by Securities and Exchange Board of India before investing in Securities Market. Ventura Securities Limited Corporate Office: 8th Floor, ‘B’ Wing, I Think Techno Campus, Pokhran Road no. 02, Off Eastern Express Highway, Thane (West) 400 607. SEBI Registration No.: INH000001634