additive & bench test development - stle
TRANSCRIPT

Additive & Bench Test Development
Jeffrey M. Guevremont, Ph.D.Sr. R&D ScientistTechnology DevelopmentAfton Chemical
2015 STLE Tribology Frontiers:Pre-Conference WorkshopAdvances & Opportunities in Lubrication: Wind TurbinesSunday, October 25, 20158:30am – 12:30pmGrand Hyatt, Denver, Colorado

Technology Development Approach
Field
• Lubricant performance rated in highly variable environment• Changing wind speeds and directions• Starts and stops that result in high transient loads• Wide operational temperature range• Water and other contamination
Approvals / Specifications
• Tests aimed at judging ability of lubricant in field• Standardized testing• Tests of fully formulated fluids• Pass / fail criteria
Bench Tests
• Tests aimed at understanding impact of lubricant and additives• Test fully formulated fluids to singular additives• Results can be used to model rig or field test resultsOffshore wind farm using 5MW
turbines in the North Sea off the coast of Belgium

New Idea
Synthesis (Months)
Testing(Years)
Discuss Result
Time Cycle of Testing
New Idea
Synthesis (5 Days)
Testing(Days/Weeks)
Discuss Result
Rig TestingField Testing

Time Cycle of Testing
Bench testing saves time and moneyBench testing can also reduce variability of results and improve understanding of additives!
New Idea
Synthesis (5 Days)
Testing(Days/Weeks)
Discuss Result
New Idea
Synthesis (1 Day)
Testing(0.1 Day)
Discuss Result
Rig Testing Bench Testing
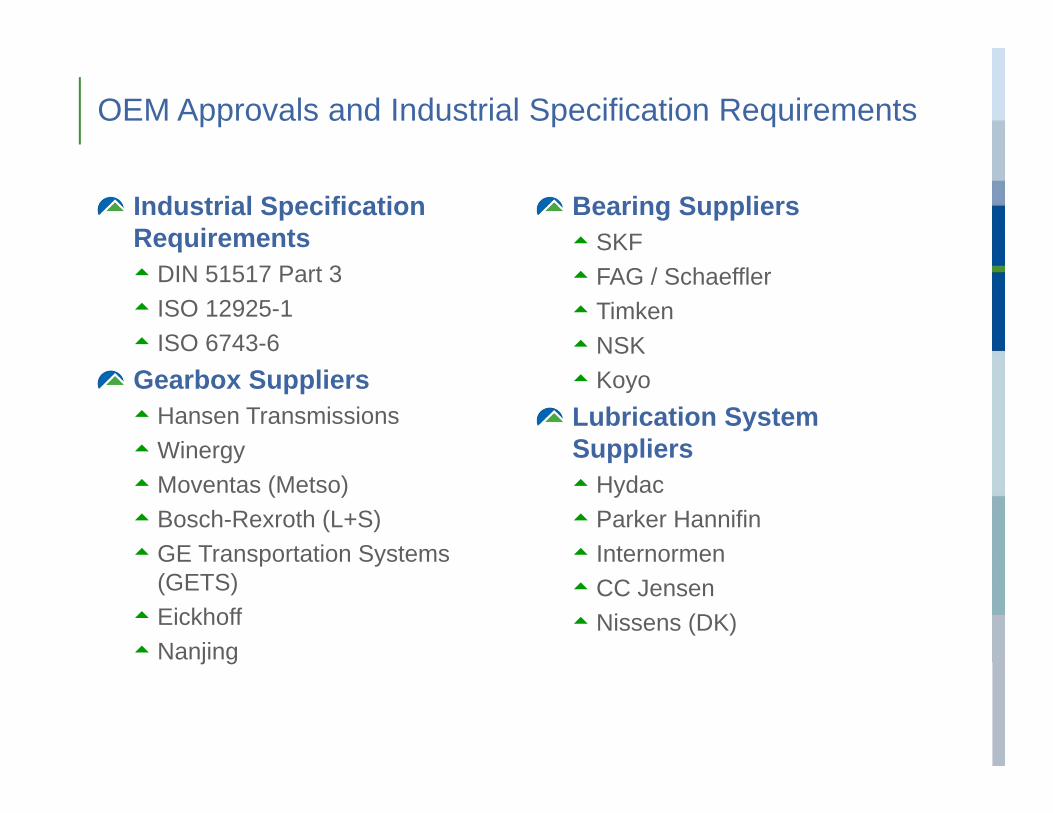
OEM Approvals and Industrial Specification Requirements
Industrial Specification Requirements DIN 51517 Part 3 ISO 12925-1 ISO 6743-6Gearbox Suppliers Hansen Transmissions Winergy Moventas (Metso) Bosch-Rexroth (L+S) GE Transportation Systems
(GETS) Eickhoff Nanjing
Bearing Suppliers SKF FAG / Schaeffler Timken NSK KoyoLubrication System Suppliers Hydac Parker Hannifin Internormen CC Jensen Nissens (DK)

Test Categories Included in OEM Approvals1. Viscometrics and Shear Stability Kinematic Viscosity Viscosity Index Brookfield Viscosity Dynamic Viscosity Shear stability2. Physical Properties Acid value Density Flash point Pour point Storage Stability Evaporation Loss Water content Cleanliness Heat capacity3. Surface Properties Demulsibility Air Release Foaming Air entrainment4. Corrosion Copper Iron/Steel Bearings
5. Oxidation Oxidation Stability, Temperature Oxidation Stability, Bearing Oxidation Stability, Gear6. Load Carrying and Wear Scuffing tests Wear tests EP tests Micropitting tests7. Filters and Filterability Various material and size Temperature8. Fluid Compatibility Repeat of many of tests in all categories9. Seal Compatibility Static, many materials and temperatures Dynamic, many materialsOther Compatibility Paint Sealants/Gaskets Cage material Hoses14. Product Durability High Temperature Low Temperature Sludge Formation16. Service Performance / Field Trial Field Trial Agreement
Number of individual tests is much longer…

Tests Required for a Commercial Wind Turbine Fluid
As seen earlier, these tests have common themes
Focus on two areas that bench testing can really help

Picking the Right Bench Test
There is already a wealth of knowledge on how many additives affect performance in bench tests
OR HSV
HFRR
MTM
SLIM
EHD
Surface Analysis
ANTIWEAR AGENTS
FRICTION MODIFIERS
CORROSION INHIBITORS
DETERGENTS
DISPERSANTS
OXIDATION INHIBITORS
RUST INHIBITORS
DEMULSIFIERS
FOAM INHIBITORS
PPD
VII
Used to study additive.
Sensitive to, but generally not used to study.

Low Temperature Properties
Low temperature visometrics are important for restarting of turbines in low temperature environments
Low Temperature
Viscosity
Base Oils
Solubilizers
Thickeners

Comparison of Industry Standard Low Temperature Testing
Mini-Rotary ViscometerMRV
• Rotational Viscometer
• Temperature range:• -15°C to -40°C
• Cooling rate:• Very slow (variable)
• Shear rate:• 0.4 to 15 s-1
• Results:• Yield Stress (Pa) at
final temperature• Viscosity (cP) at final
temperature
• Rotational Viscometer
• Temperature range:• -15°C to -40°C
• Cooling rate:• Very slow (variable)
• Shear rate:• 0.4 to 15 s-1
• Results:• Yield Stress (Pa) at
final temperature• Viscosity (cP) at final
temperature
Cold Crank SimulatorCCS
• Rotational Viscometer
• Temperature range:• -10°C to -35°C
• Cooling rate:• Very fast
• Shear rate:• 104 to 105 s-1
• Results:• Viscosity (cP) at final
temperature
• Rotational Viscometer
• Temperature range:• -10°C to -35°C
• Cooling rate:• Very fast
• Shear rate:• 104 to 105 s-1
• Results:• Viscosity (cP) at final
temperature
Brookfield ViscometerFixed BV
• Rotational Viscometer
• Temperature range:• -5°C to -40°C
• Cooling rate:• very fast, hold
• Shear rate:• up to 100 s-1
• Results:• Viscosity (cP) at final
temperature
• Rotational Viscometer
• Temperature range:• -5°C to -40°C
• Cooling rate:• very fast, hold
• Shear rate:• up to 100 s-1
• Results:• Viscosity (cP) at final
temperature
Brookfield ViscometerScanning BV
• Rotational Viscometer
• Temperature range:• -5°C to -40°C
• Cooling rate:• 1°C per hour
• Shear rate:• 0.2s-1
• Results:• Viscosity (cP) during
cooling cycle• Gelation Index
• Rotational Viscometer
• Temperature range:• -5°C to -40°C
• Cooling rate:• 1°C per hour
• Shear rate:• 0.2s-1
• Results:• Viscosity (cP) during
cooling cycle• Gelation Index

Velocity (v)
Velocity (v)
Cool
Output
Viscosity (T),Limited network
information
Velocity (v)
Velocity (v)
Cool
Output
Viscosity at EOT,No information during
cooling cycle
Viscosity (T) with network information during cooling
cycle
Rotational Rheology(i.e. Scanning Brookfield)
Rotational Rheology(i.e. MRV and Fixed BV) Oscillatory Rheology
Frequency (ω)
Frequency (ω)
Cool
Output

Relating Complex Viscosity to the Elastic and Viscous Behavior of Commercial Wind Turbine Oils
Oscillatory Rheometer results correlate to Brookfield ViscosityThere is more to learn from the OR data
0
100000
200000
300000
400000
500000
600000
700000
800000
Oil A
Oil B
Oil C
Oil D
Oil E
Oil F
Oil G
Viscos
ity at
‐40°C
(cP)
Brookfield Viscosity
0
100000
200000
300000
400000
500000
600000
700000
800000
Oil A
Oil B
Oil C
Oil D
Oil E
Oil F
Oil G
Viscos
ity at
‐40°C
(cP)
Brookfield ViscosityComplex Viscosity

Relating Complex Viscosity to the Elastic and Viscous Behavior of Commercial Wind Turbine Oils
0
100000
200000
300000
400000
500000
600000
700000
800000
Oil A
Oil B
Oil C
Oil D
Oil E
Oil F
Oil G
Viscos
ity at
‐40°C
(cP)
Brookfield Viscosity
0
100000
200000
300000
400000
500000
600000
700000
800000
Oil A
Oil B
Oil C
Oil D
Oil E
Oil F
Oil G
Viscos
ity at
‐40°C
(cP)
Brookfield ViscosityComplex Viscosity
0
2
4
6
8
10
12
14
16
Oil A
Oil B
Oil C
Oil D
Oil E
Oil F
Oil G
Mod
ulus (P
a) at ‐40
°C
Elastic behavior (G’) at -40°C
0
200
400
600
800
1000
1200
Oil A
Oil B
Oil C
Oil D
Oil E
Oil F
Oil G
Mod
ulus (P
a) at ‐40
°C
Viscous behavior (G”) at -40°C

1
10
100
1000
‐40 ‐30 ‐20 ‐10 0 10 20
Complex Visc
osity
(Pa s)
Temperature (°C)
Oscillatory Rheology Gives More Than Just Viscosity
Two oils showing different viscosity curves as temperature decreases
Differences in viscosity can be attributed to changes in the elastic and viscous modulus of the oil as temperature decreases
Oil AOil B
Sample gaining structure

Summary
Oscillatory rheology (OR) used for the development of a wind turbine fluid to be used in extreme cold environments OR used to systematically optimize low temperature viscosity of
base oil, thickener, and solubilizersMeasuring the elastic and viscous behavior of an oil during the
whole cooling cycleCorrelates to BV and gives more information than BVRed flag any combinations that form any type of structure
measurable by the OR
OR allows testing of singular additives, binary mixtures as well as fully formulated fluidGreater insight into unwanted interactions in the fluid

Bearing Durability
Bearing durability is important to achieve the predicted lifetimes of equipment
Friction, Antiwearfilm formation
AntiwearAdditives
Friction Modifiers
Solubilizers

Previous Results from Research on Industry Standard Gear and Bearing Protection Testing
Rolling 4-Ball Test
• Lower thin film friction increases life to pitting
• Reduce sub-surface stress
• Lower thin film friction increases life to pitting
• Reduce sub-surface stress
FE8
• High P in tribofilmsreduces wear
• High P in tribofilmscreates a stronger film that is more resistant to wear
• High P in tribofilmsreduces wear
• High P in tribofilmscreates a stronger film that is more resistant to wear
FZG (micropitting)
• Lower boundary friction improves micropitting life
• Lower boundary friction means less stress in the aspirity-aspirity contact
• Lower boundary friction improves micropitting life
• Lower boundary friction means less stress in the aspirity-aspirity contact

Friction Measured with Mini Traction Machine (MTM)Friction coefficients from MTM have been correlated to FZG gear testsLower friction results in longer lifeChoose test conditions to mimic operating conditions of wind turbines

MTM Friction : Competitive Wind Turbine Oils
Look for best friction performance of known chemistries under benchtop “wind turbine conditions”Iterate discovery process of idea-formulate -test-discuss
0.030
0.035
0.040
0.045
0.050
0.055
0.060
A B C D E F G H I Candidate1Reference
FrictionCoef.80 C
50%SRR35N Load
1 m/s
Friction: Lower is
better

Afton Knows how to Prevent Fatigue
0.020
0.025
0.030
0.035
0.040
0.045
0.050
AA
AB
AC
AD
AE
AF
AG
AH
AI
AJ
AK
AL
AM
AN
AO
AP
AQ
AR
AS
AT
1
Iterative process quickly gives many candidates with low frictionTurn to another bench test to differentiate good friction candidates
Friction: Lower is
better
Reference
FrictionCoef.80C
50%SRR35N Load
1 m/s

Measuring Tribofilm Formation with MTM-SLIMResults from MTM with Spacer Layer Imaging Method (SLIM) have been correlated to bearing and gear fatigue and wearFilm formation and presence of high P in the film is better for fatigue and wear

Not Too Thick, Not Too Thin, Just Right
Thin / smooth tribofilms give the lowest thin film and boundary friction
0.030
0.035
0.040
0.045
0.050
0.055
0.060
Castrol Optigear A Mobil SHC XMP 320 BP/ Afton
Thin Film
Frictio
n Co
efficient
nm
Fluid BFluid A Fluid C
Fluid BFluid A Fluid C

Its All About the Pressure
Motivation to study chemistry at higher pressures Industry standard
tests Field tests – High load
transient loads

Need High Amount of Phosphorus in Film at High Pressure
Need fluid that can with stand occasional high pressuresAmount of P in film increases as pressure increases
0
2
4
6
8
10
12
14
B11-14072 B12-7329 B12-0361 HI24881
2 GPa 3 GPa
Nor
mal
ized
P
Tribofilm %P: Higher is
better.
Fluid BFluid A Fluid C Fluid D

SummaryMTM and MTM-SLIM used for the development of a low friction wind turbine fluid that performs under high loadsMTM used to systematically optimize desired friction and antiwear
propertiesMTM used to measure friction properties of fluidMTM SLIM used to study tribofilm formation and compositionRed flag any fluids with high friction or poor tribofilm composition
MTM allows testing of singular additives, binary mixtures as well as fully formulated fluidGreater insight into wanted or unwanted interactions in the fluid
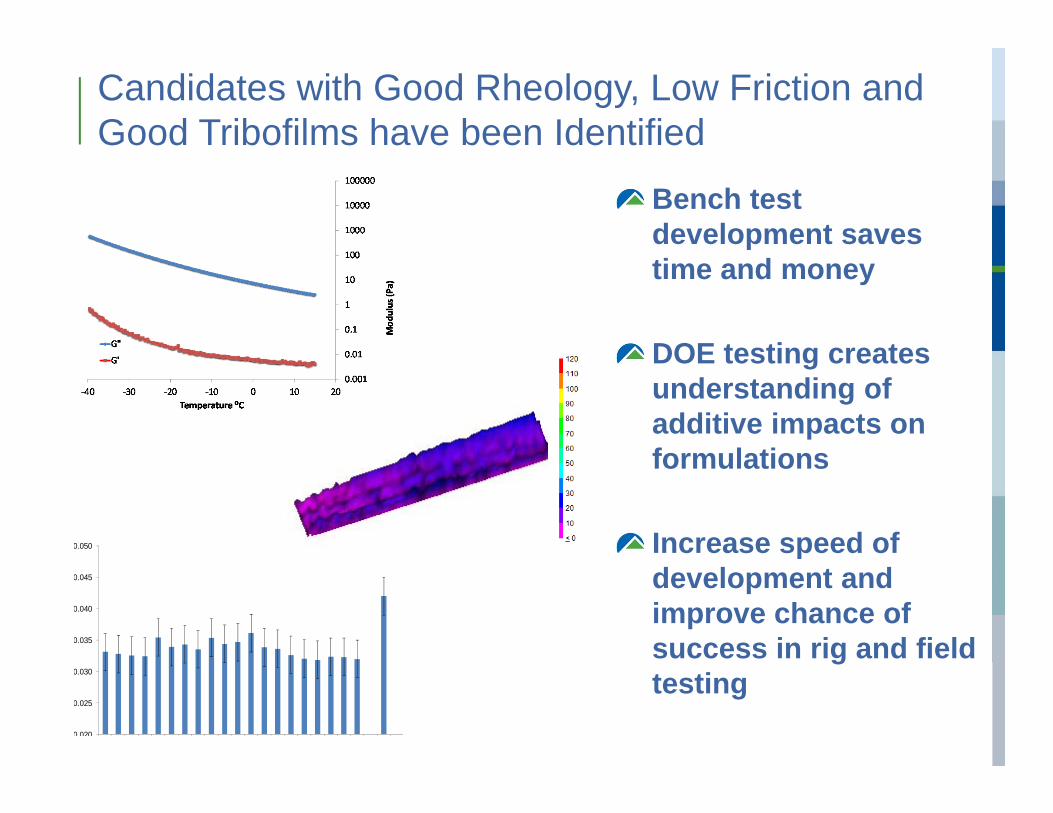
Candidates with Good Rheology, Low Friction and Good Tribofilms have been Identified
Bench test development saves time and money
DOE testing creates understanding of additive impacts on formulations
Increase speed of development and improve chance of success in rig and field testing
0 020
0.025
0.030
0.035
0.040
0.045
0.050

Thank You!