additional disclosures for analysts february 2015 - hbl presentation - fy14.pdf · additional...
TRANSCRIPT
110 175 220
Color scheme
0 140 210
235 195 20
255 153 51
150 160 170
160 20 50
0 115 50
30 188 130
Additional Disclosures for Analysts February 2015
110 175 220
Color scheme
0 140 210
235 195 20
255 153 51
150 160 170
160 20 50
0 115 50
30 188 130
1
This presentation has been prepared by Habib Bank Limited (the “Bank”) solely for information purposes. No representation or warranty express
or implied is made as to, and no reliance should be placed on, the fairness, accuracy, completeness or correctness of the information or any
opinion contained herein. The information contained in this presentation should be considered in the context of the circumstances prevailing at
the time and will not be updated to reflect material developments that may occur after the date of the presentation. Neither the Bank nor any of
its respective affiliates, officials or advisors shall have any liability whatsoever (in negligence or otherwise) for any loss arising from any use of
this presentation or its contents or otherwise arising in connection with this presentation.
This presentation does not constitute or form part of a prospectus, offering circular or offering memorandum or an offer, solicitation, invitation or
recommendation to purchase or subscribe for any securities and no part of it shall form the basis of, or be relied upon in connection with, or act
as any inducement to enter into any contract, commitment or investment decision in relation to any securities. This presentation is intended to
present background information on the Bank, its business and the industry in which it operates and is not intended to provide complete
disclosure upon which an investment decision could be made. No money, securities or other consideration is being solicited, and, if sent in
response to this presentation or the information contained herein, will not be accepted.
The presentation may contain statements that reflect the Bank’s beliefs and expectations about the future. These forward-looking statements are
based on a number of assumptions about the future, some of which are beyond the Bank’s control. Such forward-looking statements represent,
in each case, only one of many possible scenarios and should not be viewed as the most likely or standard scenario. Such forward-looking
statements are subject to certain risks and uncertainties that could cause actual results to differ materially from those contemplated by the
relevant forward-looking statements. The Bank does not undertake any obligation to update any forward-looking statements to reflect events
that occur or circumstances that arise after the date of this presentation and it does not make any representation, warranty or prediction that the
results anticipated by such forward-looking statements will be achieved. In addition, past performance should not be taken as an indication or
guarantee of future results.
Certain data in this presentation was obtained from various external data sources that the Bank believes to be reliable, but the Bank has not
verified such data with independent sources and there can be no assurance as to the accuracy or completeness of the included information.
Accordingly, the Bank makes no representations as to the accuracy or completeness of that data, and such data involves risks and uncertainties
and is subject to change based on various factors.
Disclaimer
110 175 220
Color scheme
0 140 210
235 195 20
255 153 51
150 160 170
160 20 50
0 115 50
30 188 130
Contents
2
1 Introduction p. 3
2 Highlights p. 8
3 Financial performance p. 20
4 Additional information p. 26

110 175 220
Color scheme
0 140 210
235 195 20
255 153 51
150 160 170
160 20 50
0 115 50
30 188 130
1. Introduction
3
110 175 220
Color scheme
0 140 210
235 195 20
255 153 51
150 160 170
160 20 50
0 115 50
30 188 130
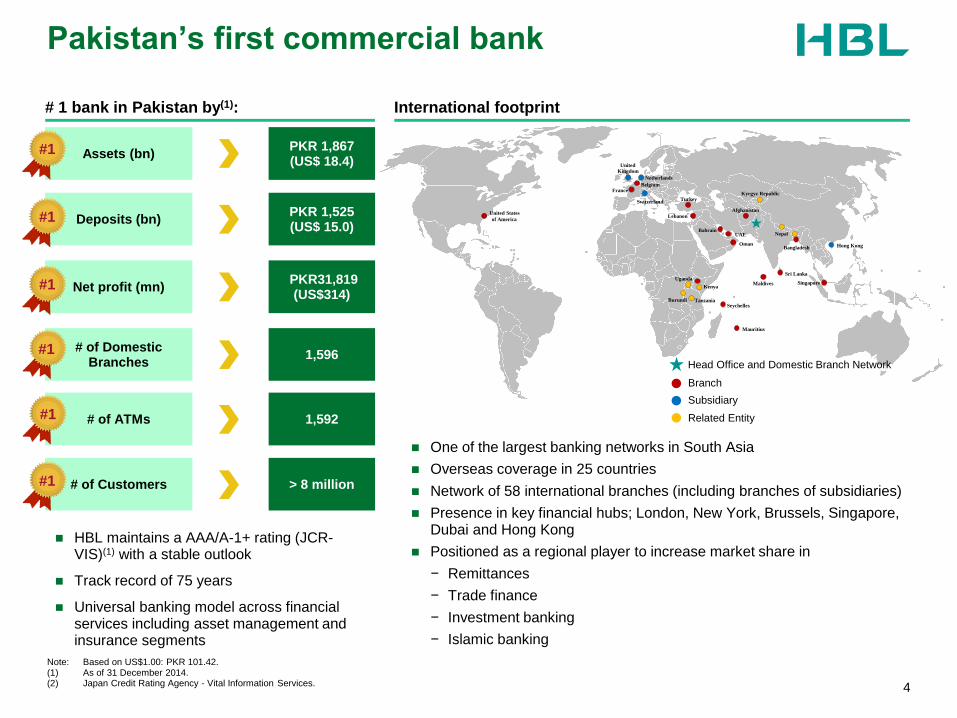
Pakistan’s first commercial bank
4
# 1 bank in Pakistan by(1): International footprint
HBL maintains a AAA/A-1+ rating (JCR-VIS)(1) with a stable outlook
Track record of 75 years
Universal banking model across financial services including asset management and insurance segments
One of the largest banking networks in South Asia
Overseas coverage in 25 countries
Network of 58 international branches (including branches of subsidiaries)
Presence in key financial hubs; London, New York, Brussels, Singapore, Dubai and Hong Kong
Positioned as a regional player to increase market share in
− Remittances
− Trade finance
− Investment banking
− Islamic banking
Note: Based on US$1.00: PKR 101.42. (1) As of 31 December 2014. (2) Japan Credit Rating Agency - Vital Information Services.
Kenya
Seychelles
Mauritius
Singapore Maldives
Sri Lanka
Bangladesh
Nepal
Afghanistan
Kyrgyz Republic
United States
of America
United Kingdom
Hong Kong
Turkey
Oman
UAE Bahrain
Lebanon
France Belgium
Netherlands
Switzerland
Tanzania
Uganda
Burundi
Subsidiary
Related Entity
Branch
Head Office and Domestic Branch Network
Assets (bn) PKR 1,867 (US$ 18.4)
#1
Deposits (bn) PKR 1,525 (US$ 15.0)
#1
# of Domestic Branches
1,596 #1
# of ATMs 1,592 #1
# of Customers > 8 million #1
Net profit (mn) PKR31,819
(US$314) #1
110 175 220
Color scheme
0 140 210
235 195 20
255 153 51
150 160 170
160 20 50
0 115 50
30 188 130
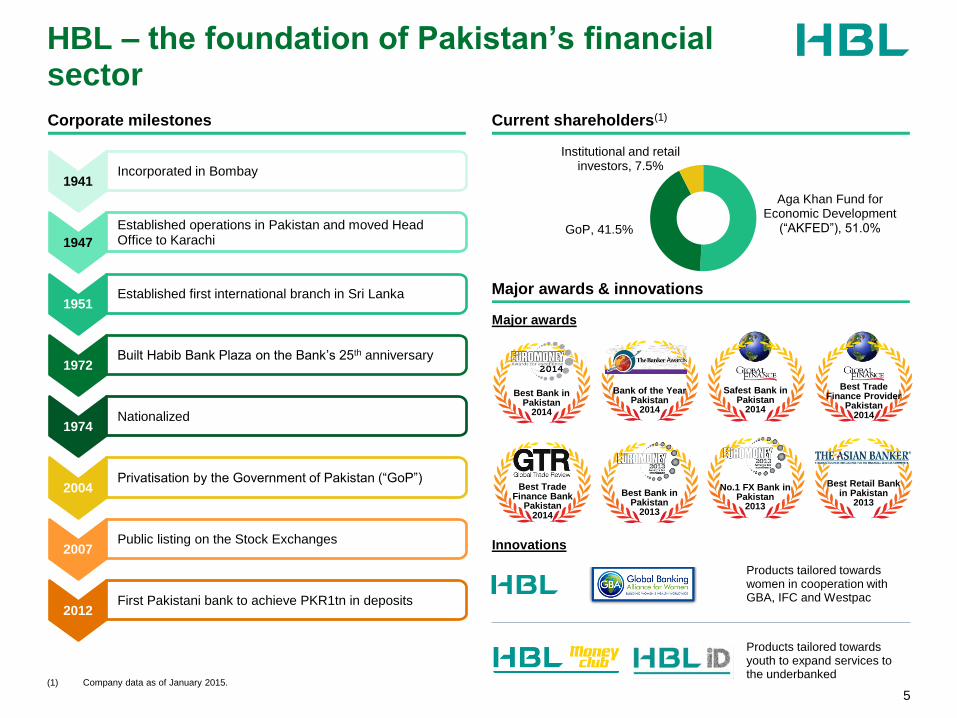
HBL – the foundation of Pakistan’s financial sector
5
1941 Incorporated in Bombay
1947
Established operations in Pakistan and moved Head Office to Karachi
1951 Established first international branch in Sri Lanka
1972 Built Habib Bank Plaza on the Bank’s 25th anniversary
1974 Nationalized
Corporate milestones Current shareholders(1)
Major awards & innovations
Aga Khan Fund for Economic Development
(“AKFED”), 51.0%
Institutional and retail investors, 7.5%
GoP, 41.5%
Bank of the Year Pakistan
2014
Safest Bank in Pakistan
2014
Best Trade Finance Bank
Pakistan 2014
Best Trade Finance Provider
Pakistan 2014
Best Bank in Pakistan
2013
No.1 FX Bank in Pakistan
2013
Best Retail Bank in Pakistan
2013
Major awards
2004 Privatisation by the Government of Pakistan (“GoP”)
2007 Public listing on the Stock Exchanges
(1) Company data as of January 2015.
2012 First Pakistani bank to achieve PKR1tn in deposits
Best Bank in Pakistan
2014
Products tailored towards women in cooperation with GBA, IFC and Westpac
Innovations
Products tailored towards youth to expand services to the underbanked
110 175 220
Color scheme
0 140 210
235 195 20
255 153 51
150 160 170
160 20 50
0 115 50
30 188 130
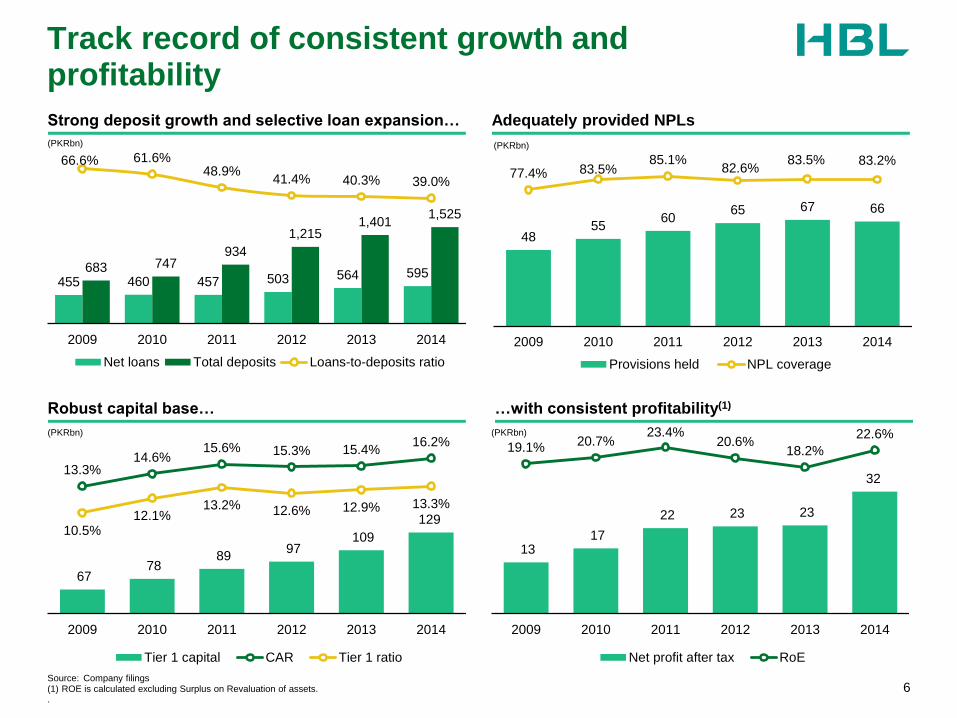
Track record of consistent growth and profitability
6
Robust capital base…
Strong deposit growth and selective loan expansion…
…with consistent profitability(1)
Adequately provided NPLs
67 78
89 97
109
129
13.3% 14.6%
15.6% 15.3% 15.4% 16.2%
10.5% 12.1%
13.2% 12.6% 12.9% 13.3%
2009 2010 2011 2012 2013 2014
Tier 1 capital CAR Tier 1 ratio
(PKRbn)
455 460 457 503 564 595 683 747 934
1,215 1,401
1,525
66.6% 61.6% 48.9%
41.4% 40.3% 39.0%
2009 2010 2011 2012 2013 2014
Net loans Total deposits Loans-to-deposits ratio
(PKRbn)
Source: Company filings (1) ROE is calculated excluding Surplus on Revaluation of assets. .
13 17
22 23 23
32
19.1% 20.7% 23.4%
20.6% 18.2%
22.6%
2009 2010 2011 2012 2013 2014
Net profit after tax RoE
(PKRbn)
48 55
60 65 67 66
77.4% 83.5% 85.1%
82.6% 83.5% 83.2%
2009 2010 2011 2012 2013 2014
Provisions held NPL coverage
(PKRbn)
110 175 220
Color scheme
0 140 210
235 195 20
255 153 51
150 160 170
160 20 50
0 115 50
30 188 130
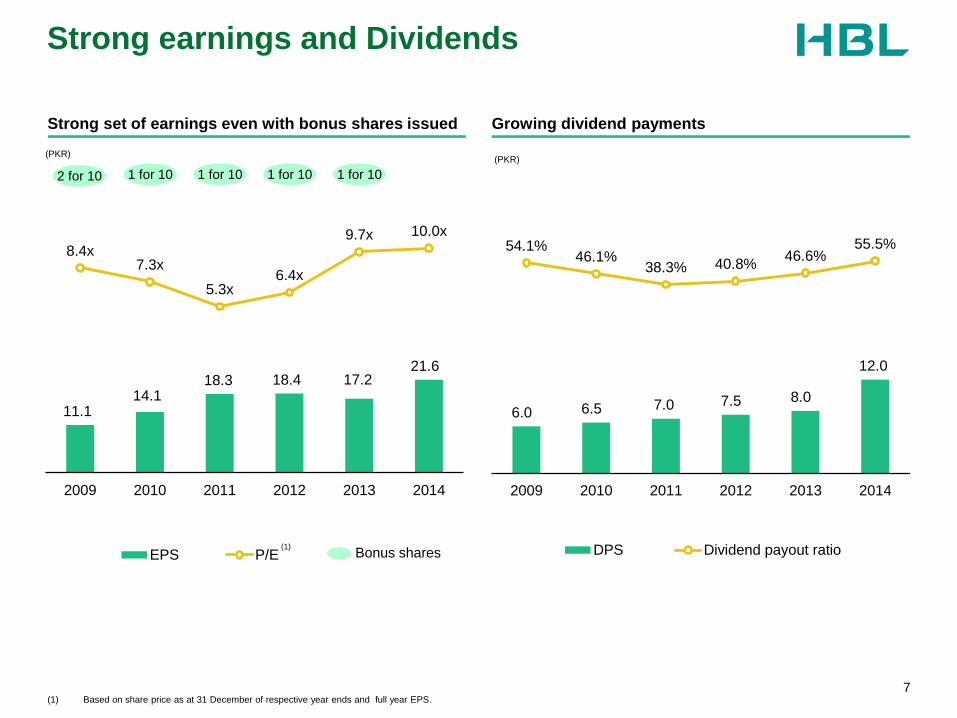
Strong earnings and Dividends
7
Strong set of earnings even with bonus shares issued
11.1 14.1
18.3 18.4 17.2 21.6
8.4x 7.3x
5.3x 6.4x
9.7x 10.0x
2009 2010 2011 2012 2013 2014
EPS P/E
(PKR)
(1) Based on share price as at 31 December of respective year ends and full year EPS.
(1)
2 for 10 1 for 10 1 for 10 1 for 10 1 for 10
Bonus shares
Growing dividend payments
6.0 6.5 7.0 7.5 8.0
12.0
54.1% 46.1%
38.3% 40.8% 46.6%
55.5%
2009 2010 2011 2012 2013 2014
DPS Dividend payout ratio
(PKR)
110 175 220
Color scheme
0 140 210
235 195 20
255 153 51
150 160 170
160 20 50
0 115 50
30 188 130
2. Highlights
8
110 175 220
Color scheme
0 140 210
235 195 20
255 153 51
150 160 170
160 20 50
0 115 50
30 188 130
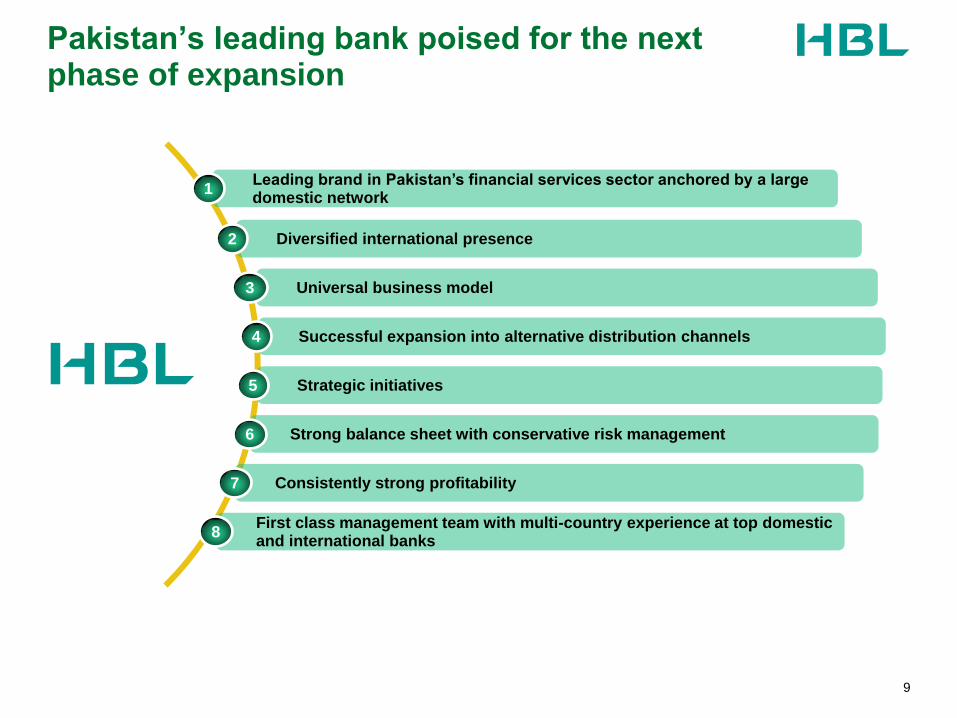
Pakistan’s leading bank poised for the next phase of expansion
9
Universal business model 3
Diversified international presence 2
Strong balance sheet with conservative risk management 6
Strategic initiatives 5
Successful expansion into alternative distribution channels 4
Consistently strong profitability 7
First class management team with multi-country experience at top domestic and international banks
8
Leading brand in Pakistan’s financial services sector anchored by a large domestic network
1

110 175 220
Color scheme
0 140 210
235 195 20
255 153 51
150 160 170
160 20 50
0 115 50
30 188 130
13.4%
12.6%
13.5%
15.3% 15.1% 14.8%
2009 2010 2011 2012 2013 2014
568 639 790 991
1,199 1,375 115 109
143
224
202 149
2009 2010 2011 2012 2013 2014
Government
Private Sector
HBL is maintaining a leading market share of c.15%
Brand positioning and largest branch network leading to strong deposit growth
10
Domestic branches
1,454 1,459 1,464
1,497
1,546
1,596
2009 2010 2011 2012 2013 2014
1
Total deposits growth has outpaced market
Historical market share by deposits
#1
683 748 933
1,215
1,401 1,525

110 175 220
Color scheme
0 140 210
235 195 20
255 153 51
150 160 170
160 20 50
0 115 50
30 188 130
Large and diversified international presence which is unique among regional peers
11
International footprint
HBL currently holds complete banking licenses in key regional locations including Sri Lanka, Afghanistan, Oman, UAE, Bahrain and Bangladesh
Well-positioned regional player to increase market share in:
− Trade finance
− Remittances
− Investment banking
Subsidiary
Related Entity
Branch
Head Office and Domestic Branch Network
Direct presence in 25 countries
Network of 58 branches(1)
Presence in key financial hubs; London, New York, Brussels, Singapore, Dubai and Hong Kong
Presence in 5 countries through associates and related entities
2
Comprehensive regional coverage
(1) Includes branches of HBL’s subsidiaries.
Kenya
Seychelles
Mauritius
Singapore Maldives
Sri Lanka
Bangladesh
Nepal
Afghanistan
Kyrgyz Republic
United States
of America
United Kingdom
Hong Kong
Turkey
Oman
UAE Bahrain
Lebanon
France Belgium
Netherlands
Switzerland
Tanzania
Uganda
Burundi
110 175 220
Color scheme
0 140 210
235 195 20
255 153 51
150 160 170
160 20 50
0 115 50
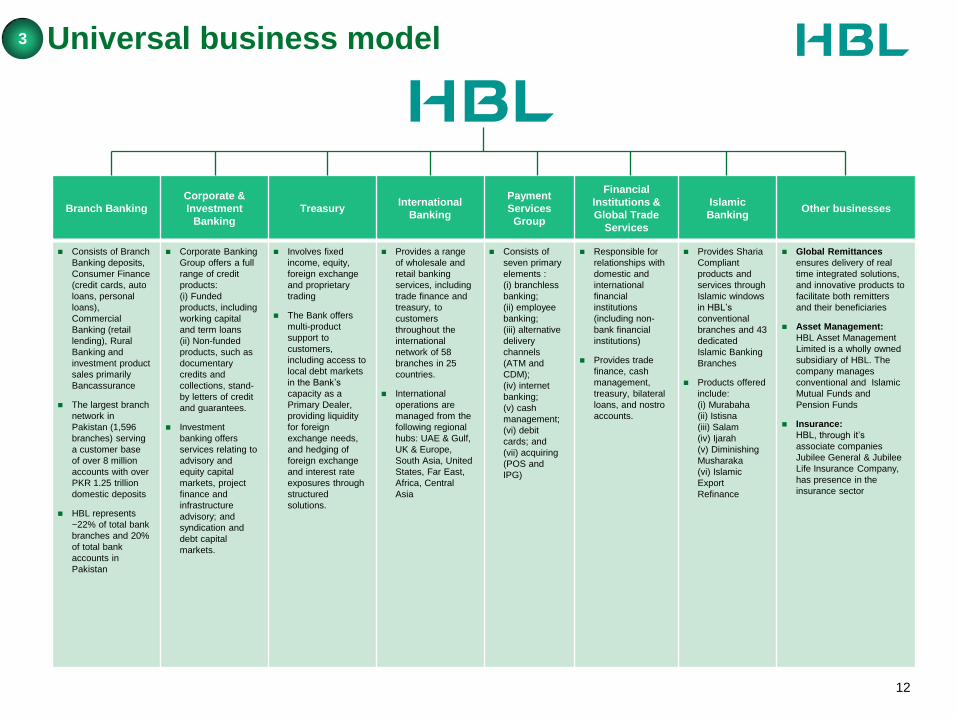
30 188 130 Branch Banking
Corporate &
Investment
Banking
Treasury International
Banking
Payment
Services
Group
Financial
Institutions &
Global Trade
Services
Islamic
Banking Other businesses
Consists of Branch
Banking deposits,
Consumer Finance
(credit cards, auto
loans, personal
loans),
Commercial
Banking (retail
lending), Rural
Banking and
investment product
sales primarily
Bancassurance
The largest branch
network in
Pakistan (1,596
branches) serving
a customer base
of over 8 million
accounts with over
PKR 1.25 trillion
domestic deposits
HBL represents
~22% of total bank
branches and 20%
of total bank
accounts in
Pakistan
Corporate Banking
Group offers a full
range of credit
products:
(i) Funded
products, including
working capital
and term loans
(ii) Non-funded
products, such as
documentary
credits and
collections, stand-
by letters of credit
and guarantees.
Investment
banking offers
services relating to
advisory and
equity capital
markets, project
finance and
infrastructure
advisory; and
syndication and
debt capital
markets.
Involves fixed
income, equity,
foreign exchange
and proprietary
trading
The Bank offers
multi-product
support to
customers,
including access to
local debt markets
in the Bank’s
capacity as a
Primary Dealer,
providing liquidity
for foreign
exchange needs,
and hedging of
foreign exchange
and interest rate
exposures through
structured
solutions.
Provides a range
of wholesale and
retail banking
services, including
trade finance and
treasury, to
customers
throughout the
international
network of 58
branches in 25
countries.
International
operations are
managed from the
following regional
hubs: UAE & Gulf,
UK & Europe,
South Asia, United
States, Far East,
Africa, Central
Asia
Consists of
seven primary
elements :
(i) branchless
banking;
(ii) employee
banking;
(iii) alternative
delivery
channels
(ATM and
CDM);
(iv) internet
banking;
(v) cash
management;
(vi) debit
cards; and
(vii) acquiring
(POS and
IPG)
Responsible for
relationships with
domestic and
international
financial
institutions
(including non-
bank financial
institutions)
Provides trade
finance, cash
management,
treasury, bilateral
loans, and nostro
accounts.
Provides Sharia
Compliant
products and
services through
Islamic windows
in HBL’s
conventional
branches and 43
dedicated
Islamic Banking
Branches
Products offered
include:
(i) Murabaha
(ii) Istisna
(iii) Salam
(iv) Ijarah
(v) Diminishing
Musharaka
(vi) Islamic
Export
Refinance
Global Remittances
ensures delivery of real
time integrated solutions,
and innovative products to
facilitate both remitters
and their beneficiaries
Asset Management:
HBL Asset Management
Limited is a wholly owned
subsidiary of HBL. The
company manages
conventional and Islamic
Mutual Funds and
Pension Funds
Insurance:
HBL, through it’s
associate companies
Jubilee General & Jubilee
Life Insurance Company,
has presence in the
insurance sector
Universal business model 3
12

110 175 220
Color scheme
0 140 210
235 195 20
255 153 51
150 160 170
160 20 50
0 115 50
30 188 130
Strong investment in technology underpins commitment to the future
13
Investment in IT infrastructure
282
791
1,256 1,313
849 895 917
1,162
1,445
2,270
2,716
2004 2005 2006 2007 2008 2009 2010 2011 2012 2013 2014
(PKRmn)
4
Development &
implementation of core
banking systems 1
Strengthening &
consolidation of IT
systems 2
New systems for delivery
channels & efficiency,
system upgrades 3
110 175 220
Color scheme
0 140 210
235 195 20
255 153 51
150 160 170
160 20 50
0 115 50
30 188 130
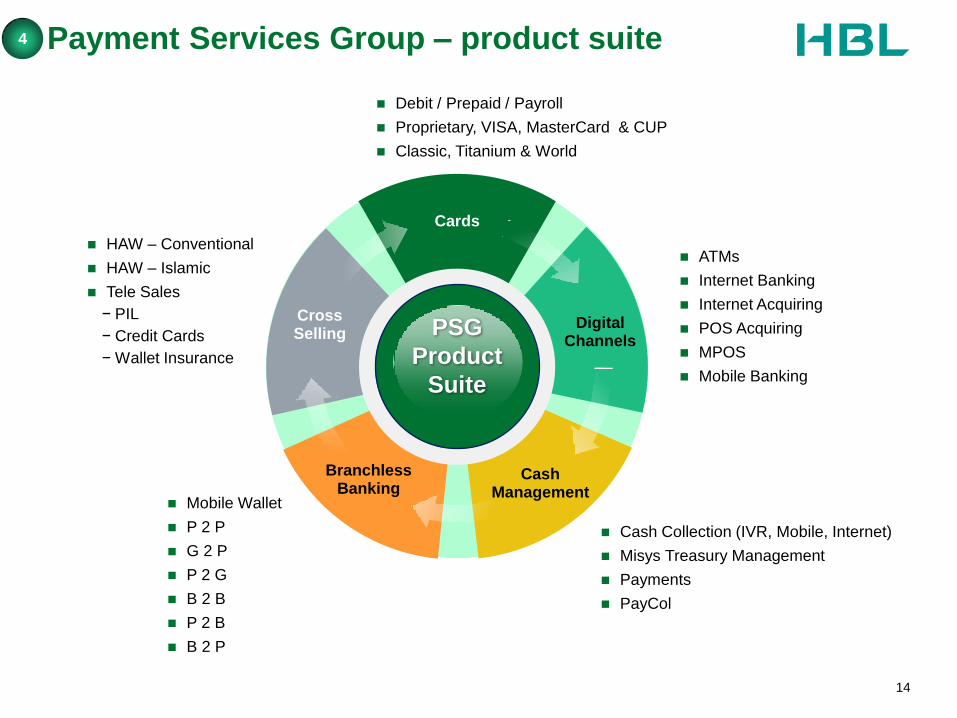
Payment Services Group – product suite
14
4
HAW – Conventional
HAW – Islamic
Tele Sales
− PIL
− Credit Cards
− Wallet Insurance
Mobile Wallet
P 2 P
G 2 P
P 2 G
B 2 B
P 2 B
B 2 P
ATMs
Internet Banking
Internet Acquiring
POS Acquiring
MPOS
Mobile Banking
Cash Collection (IVR, Mobile, Internet)
Misys Treasury Management
Payments
PayCol
Debit / Prepaid / Payroll
Proprietary, VISA, MasterCard & CUP
Classic, Titanium & World
PSG
Product
Suite
Cards
Cross Selling
Branchless Banking
Digital Channels
Cash Management
110 175 220
Color scheme
0 140 210
235 195 20
255 153 51
150 160 170
160 20 50
0 115 50
30 188 130
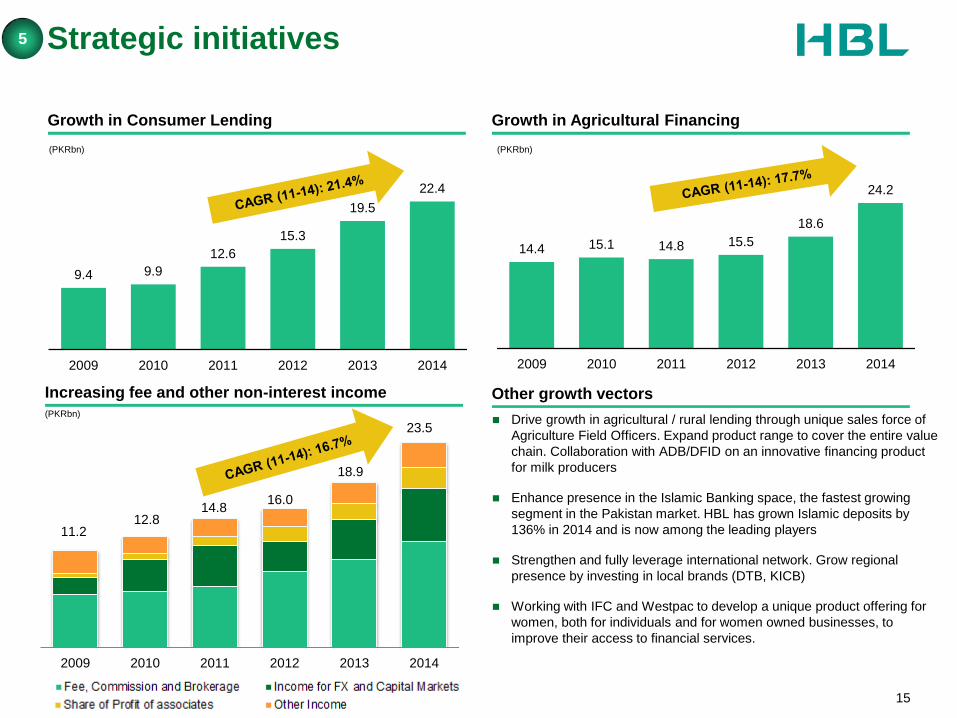
2009 2010 2011 2012 2013 2014
11.2 12.8
14.8 16.0
18.9
23.5
Strategic initiatives
15
Growth in Consumer Lending
Other growth vectors
Growth in Agricultural Financing
5
14.4 15.1 14.8 15.5
18.6
24.2
2009 2010 2011 2012 2013 2014
(PKRbn)
Drive growth in agricultural / rural lending through unique sales force of
Agriculture Field Officers. Expand product range to cover the entire value
chain. Collaboration with ADB/DFID on an innovative financing product
for milk producers
Enhance presence in the Islamic Banking space, the fastest growing
segment in the Pakistan market. HBL has grown Islamic deposits by
136% in 2014 and is now among the leading players
Strengthen and fully leverage international network. Grow regional
presence by investing in local brands (DTB, KICB)
Working with IFC and Westpac to develop a unique product offering for
women, both for individuals and for women owned businesses, to
improve their access to financial services.
Increasing fee and other non-interest income
9.4 9.9
12.6
15.3
19.5
22.4
2009 2010 2011 2012 2013 2014
(PKRbn)
(PKRbn)

110 175 220
Color scheme
0 140 210
235 195 20
255 153 51
150 160 170
160 20 50
0 115 50
30 188 130
Strong balance sheet with ample liquidity, high capitalization and conservative risk management
16
Robust capital adequacy ratio
Strong deposit growth Liabilities composed mainly of sticky deposits
683 747 934
1,215 1,401
1,525
66.5% 61.6% 48.9%
41.4% 40.3% 39.0%
2009 2010 2011 2012 2013 2014
Total deposits Loans-to-deposits ratio
(PKRbn)
6
13.3%
14.6%
15.6% 15.3% 15.4%
16.2%
2009 2010 2011 2012 2013 2014
Current 30.7%
Savings 39.4%
Time 19.7%
Other liabilities 10.2%
Total liabilities:
PKR1,697bn
Conservative risk management practices
62 66 70 78 80 80
48 55
60 65 67 66
77.4% 83.5% 85.1% 82.6% 83.5% 83.2%
2009 2010 2011 2012 2013 2014
NPL Provisions held Coverage ratio
(PKRbn)

110 175 220
Color scheme
0 140 210
235 195 20
255 153 51
150 160 170
160 20 50
0 115 50
30 188 130
21
27
34 36 36
49
13 17
22 23 23
32
2009 2010 2011 2012 2013 2014
PBT NPAT
(PKRbn)
Delivering consistently strong profitability
17
Net interest margin(1)
Return on Equity(2)
Cost to income ratio
19.1% 20.7%
23.4%
20.6%
18.2%
22.6%
2009 2010 2011 2012 2013 2014
7
42.3% 40.6% 41.3% 41.2%
48.6% 44.6%
2009 2010 2011 2012 2013 2014
0.00%
4.00%
8.00%
12.00%
16.00%
4Q09 4Q10 4Q11 4Q12 4Q13 4Q 14
Income yield Cost of funds Net interest margin
Profit before tax (“PBT”) / Net profit after tax (“NPAT”)
(1) Income Yield = (Interest Income + Investment Income) / Net Earning Assets. Cost of Funds = Interest Expense / Total Liabilities. Net Interest Margin = Income Yield – Cost of Funds.
(2) ROE is calculated excluding Surplus on Revaluation of assets.
1Q09
110 175 220
Color scheme
0 140 210
235 195 20
255 153 51
150 160 170
160 20 50
0 115 50
30 188 130
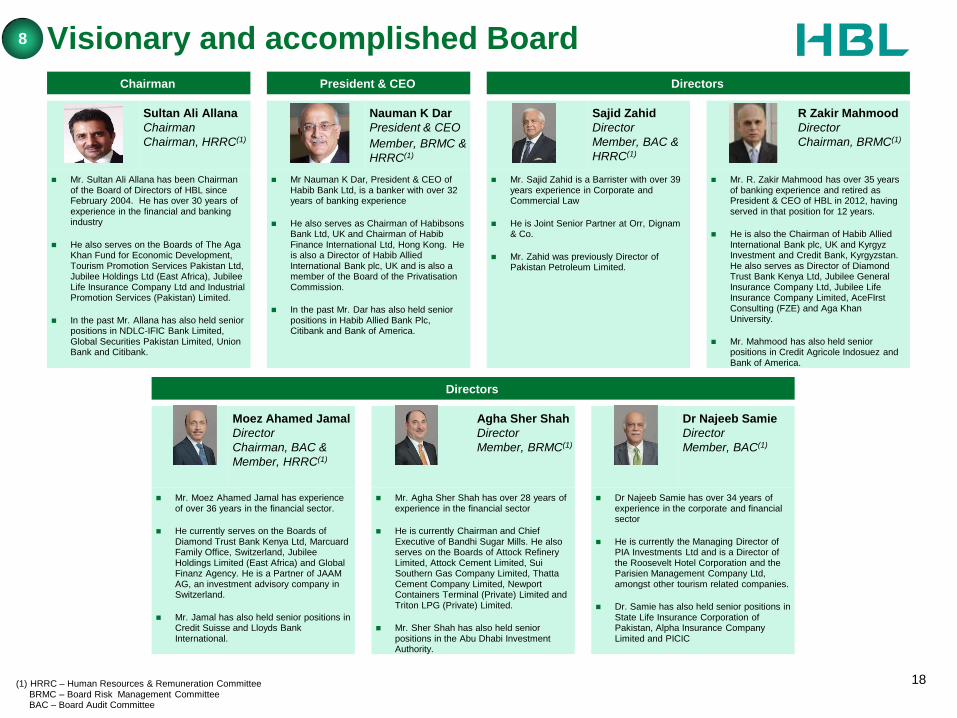
Visionary and accomplished Board
Chairman President & CEO Directors
Sultan Ali Allana
Chairman
Chairman, HRRC(1)
Nauman K Dar
President & CEO
Member, BRMC &
HRRC(1)
Sajid Zahid
Director
Member, BAC &
HRRC(1)
R Zakir Mahmood
Director
Chairman, BRMC(1)
Mr. Sultan Ali Allana has been Chairman of the Board of Directors of HBL since February 2004. He has over 30 years of experience in the financial and banking industry
He also serves on the Boards of The Aga Khan Fund for Economic Development, Tourism Promotion Services Pakistan Ltd, Jubilee Holdings Ltd (East Africa), Jubilee Life Insurance Company Ltd and Industrial Promotion Services (Pakistan) Limited.
In the past Mr. Allana has also held senior positions in NDLC-IFIC Bank Limited, Global Securities Pakistan Limited, Union Bank and Citibank.
Mr Nauman K Dar, President & CEO of Habib Bank Ltd, is a banker with over 32 years of banking experience
He also serves as Chairman of Habibsons Bank Ltd, UK and Chairman of Habib Finance International Ltd, Hong Kong. He is also a Director of Habib Allied International Bank plc, UK and is also a member of the Board of the Privatisation Commission.
In the past Mr. Dar has also held senior positions in Habib Allied Bank Plc, Citibank and Bank of America.
Mr. Sajid Zahid is a Barrister with over 39 years experience in Corporate and Commercial Law
He is Joint Senior Partner at Orr, Dignam & Co.
Mr. Zahid was previously Director of Pakistan Petroleum Limited.
Mr. R. Zakir Mahmood has over 35 years of banking experience and retired as President & CEO of HBL in 2012, having served in that position for 12 years.
He is also the Chairman of Habib Allied International Bank plc, UK and Kyrgyz Investment and Credit Bank, Kyrgyzstan. He also serves as Director of Diamond Trust Bank Kenya Ltd, Jubilee General Insurance Company Ltd, Jubilee Life Insurance Company Limited, AceFIrst Consulting (FZE) and Aga Khan University.
Mr. Mahmood has also held senior positions in Credit Agricole Indosuez and Bank of America.
Directors
Moez Ahamed Jamal
Director
Chairman, BAC &
Member, HRRC(1)
Agha Sher Shah
Director
Member, BRMC(1)
Dr Najeeb Samie
Director
Member, BAC(1)
Mr. Moez Ahamed Jamal has experience of over 36 years in the financial sector.
He currently serves on the Boards of Diamond Trust Bank Kenya Ltd, Marcuard Family Office, Switzerland, Jubilee Holdings Limited (East Africa) and Global Finanz Agency. He is a Partner of JAAM AG, an investment advisory company in Switzerland.
Mr. Jamal has also held senior positions in Credit Suisse and Lloyds Bank International.
Mr. Agha Sher Shah has over 28 years of experience in the financial sector
He is currently Chairman and Chief Executive of Bandhi Sugar Mills. He also serves on the Boards of Attock Refinery Limited, Attock Cement Limited, Sui Southern Gas Company Limited, Thatta Cement Company Limited, Newport Containers Terminal (Private) Limited and Triton LPG (Private) Limited.
Mr. Sher Shah has also held senior positions in the Abu Dhabi Investment Authority.
Dr Najeeb Samie has over 34 years of experience in the corporate and financial sector
He is currently the Managing Director of PIA Investments Ltd and is a Director of the Roosevelt Hotel Corporation and the Parisien Management Company Ltd, amongst other tourism related companies.
Dr. Samie has also held senior positions in State Life Insurance Corporation of Pakistan, Alpha Insurance Company Limited and PICIC
8
18 (1) HRRC – Human Resources & Remuneration Committee BRMC – Board Risk Management Committee BAC – Board Audit Committee
110 175 220
Color scheme
0 140 210
235 195 20
255 153 51
150 160 170
160 20 50
0 115 50
30 188 130
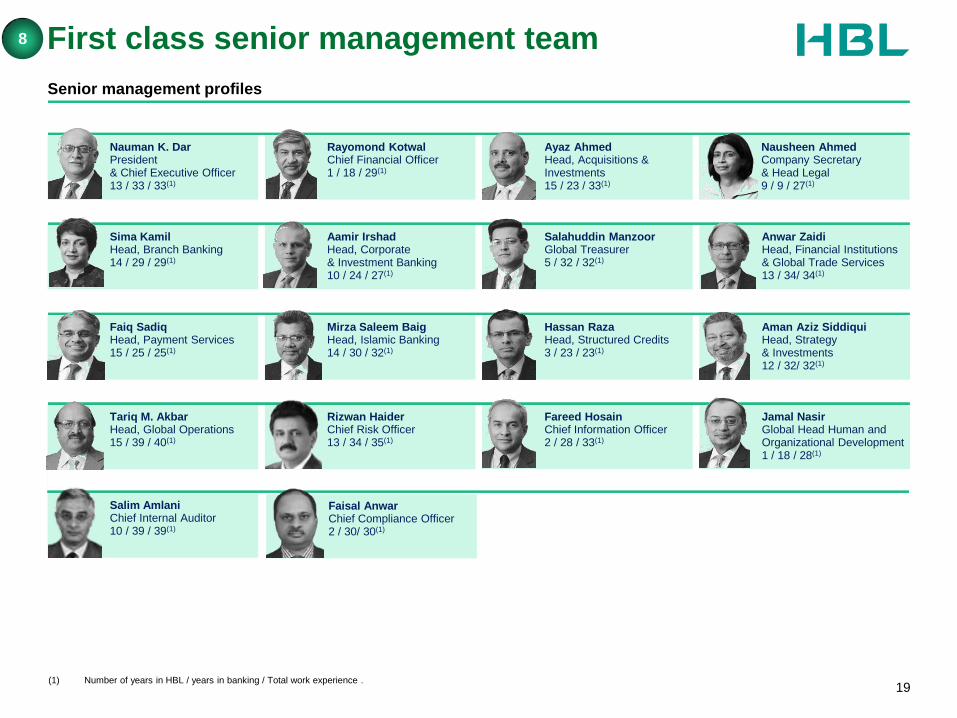
Faisal Anwar Chief Compliance Officer 2 / 30/ 30(1)
Nauman K. Dar President & Chief Executive Officer 13 / 33 / 33(1)
Rayomond Kotwal Chief Financial Officer 1 / 18 / 29(1)
Nausheen Ahmed Company Secretary & Head Legal 9 / 9 / 27(1)
Ayaz Ahmed Head, Acquisitions & Investments 15 / 23 / 33(1)
First class senior management team
19
Senior management profiles
Aamir Irshad Head, Corporate & Investment Banking 10 / 24 / 27(1)
Anwar Zaidi Head, Financial Institutions & Global Trade Services 13 / 34/ 34(1)
Salahuddin Manzoor Global Treasurer 5 / 32 / 32(1)
Faiq Sadiq Head, Payment Services 15 / 25 / 25(1)
Hassan Raza Head, Structured Credits 3 / 23 / 23(1)
Mirza Saleem Baig Head, Islamic Banking 14 / 30 / 32(1)
8
(1) Number of years in HBL / years in banking / Total work experience .
Sima Kamil Head, Branch Banking 14 / 29 / 29(1)
Aman Aziz Siddiqui Head, Strategy & Investments 12 / 32/ 32(1)
Fareed Hosain Chief Information Officer 2 / 28 / 33(1)
Jamal Nasir Global Head Human and Organizational Development 1 / 18 / 28(1)
Salim Amlani Chief Internal Auditor 10 / 39 / 39(1)
Tariq M. Akbar Head, Global Operations 15 / 39 / 40(1)
Rizwan Haider Chief Risk Officer 13 / 34 / 35(1)
110 175 220
Color scheme
0 140 210
235 195 20
255 153 51
150 160 170
160 20 50
0 115 50
30 188 130
3. Financial performance
20
110 175 220
Color scheme
0 140 210
235 195 20
255 153 51
150 160 170
160 20 50
0 115 50
30 188 130
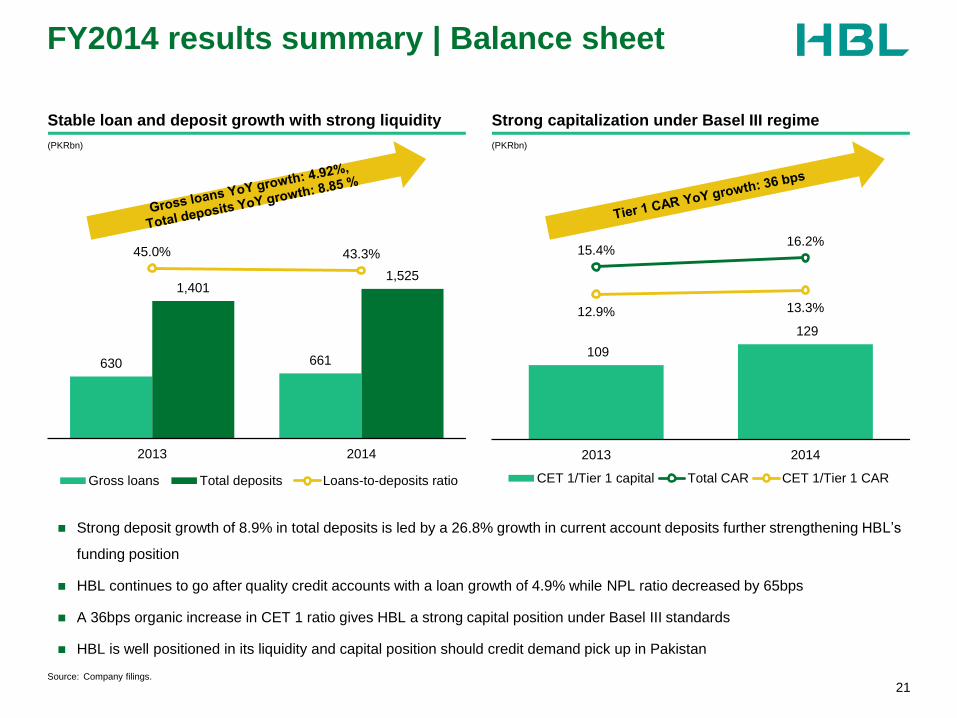
FY2014 results summary | Balance sheet
21
Stable loan and deposit growth with strong liquidity Strong capitalization under Basel III regime
630 661
1,401 1,525
45.0% 43.3%
2013 2014
Gross loans Total deposits Loans-to-deposits ratio
(PKRbn)
Source: Company filings.
109
129
15.4% 16.2%
12.9% 13.3%
2013 2014
CET 1/Tier 1 capital Total CAR CET 1/Tier 1 CAR
(PKRbn)
Strong deposit growth of 8.9% in total deposits is led by a 26.8% growth in current account deposits further strengthening HBL’s
funding position
HBL continues to go after quality credit accounts with a loan growth of 4.9% while NPL ratio decreased by 65bps
A 36bps organic increase in CET 1 ratio gives HBL a strong capital position under Basel III standards
HBL is well positioned in its liquidity and capital position should credit demand pick up in Pakistan
110 175 220
Color scheme
0 140 210
235 195 20
255 153 51
150 160 170
160 20 50
0 115 50
30 188 130
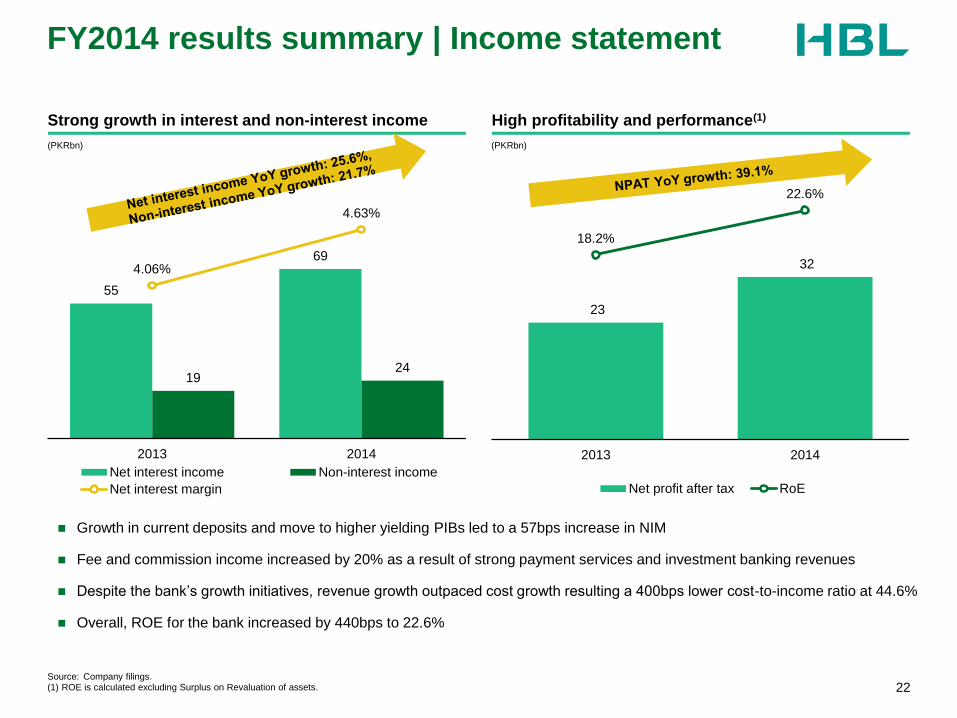
23
32
18.2%
22.6%
2013 2014
Net profit after tax RoE
(PKRbn)
FY2014 results summary | Income statement
22
Strong growth in interest and non-interest income High profitability and performance(1)
55
69
19 24
4.06%
4.63%
2013 2014
Net interest income Non-interest income
Net interest margin
(PKRbn)
Source: Company filings. (1) ROE is calculated excluding Surplus on Revaluation of assets.
Growth in current deposits and move to higher yielding PIBs led to a 57bps increase in NIM
Fee and commission income increased by 20% as a result of strong payment services and investment banking revenues
Despite the bank’s growth initiatives, revenue growth outpaced cost growth resulting a 400bps lower cost-to-income ratio at 44.6%
Overall, ROE for the bank increased by 440bps to 22.6%
110 175 220
Color scheme
0 140 210
235 195 20
255 153 51
150 160 170
160 20 50
0 115 50
30 188 130
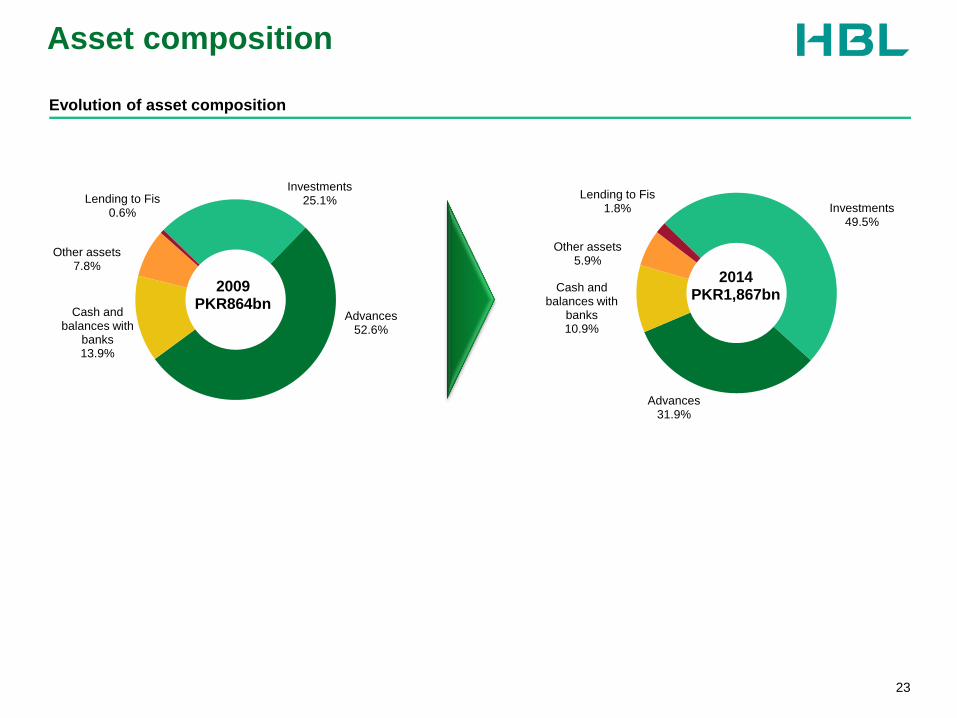
Asset composition
23
Evolution of asset composition
Investments 49.5%
Advances 31.9%
Cash and balances with
banks 10.9%
Other assets 5.9%
Lending to Fis 1.8%
2009 PKR864bn
2014 PKR1,867bn
Investments 25.1%
Advances 52.6%
Cash and balances with
banks 13.9%
Other assets 7.8%
Lending to Fis 0.6%
110 175 220
Color scheme
0 140 210
235 195 20
255 153 51
150 160 170
160 20 50
0 115 50
30 188 130
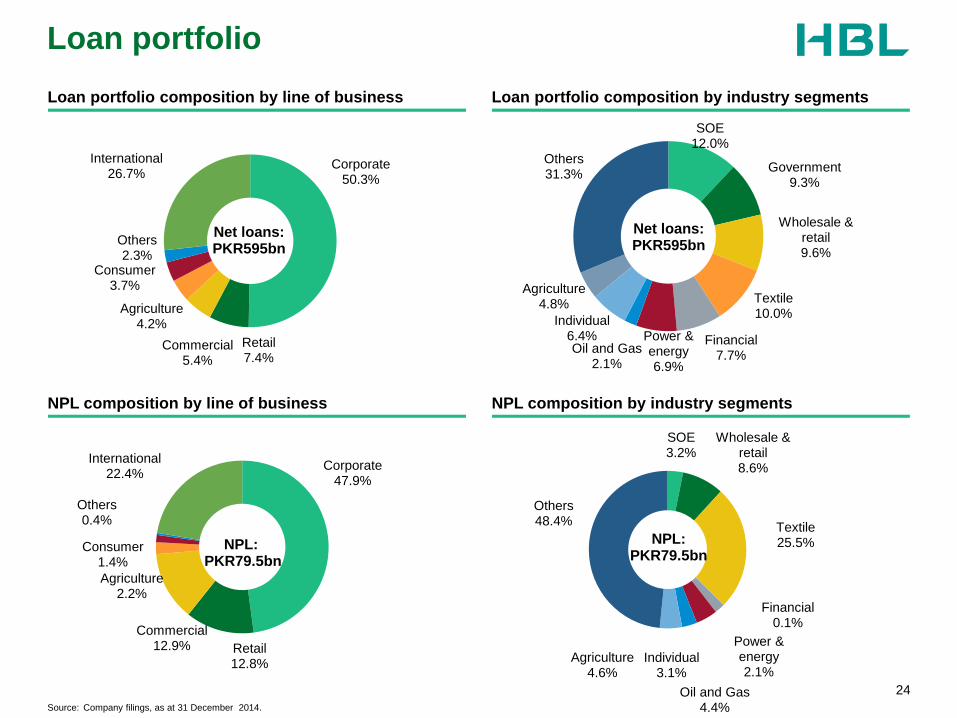
SOE 3.2%
Wholesale & retail 8.6%
Textile 25.5%
Financial 0.1%
Power & energy 2.1%
Oil and Gas 4.4%
Individual 3.1%
Agriculture 4.6%
Others 48.4%
Loan portfolio
24
Corporate 50.3%
Retail 7.4%
Commercial 5.4%
Agriculture 4.2%
Consumer 3.7%
Others 2.3%
International 26.7%
Net loans: PKR595bn
Loan portfolio composition by line of business
Source: Company filings, as at 31 December 2014.
Loan portfolio composition by industry segments
SOE 12.0%
Government 9.3%
Wholesale & retail 9.6%
Textile 10.0%
Financial 7.7%
Power & energy 6.9%
Oil and Gas 2.1%
Individual 6.4%
Agriculture 4.8%
Others 31.3%
Corporate 47.9%
Retail 12.8%
Commercial 12.9%
Agriculture 2.2%
Consumer 1.4%
Others 0.4%
International 22.4%
NPL: PKR79.5bn
NPL: PKR79.5bn
NPL composition by line of business NPL composition by industry segments
Net loans: PKR595bn

110 175 220
Color scheme
0 140 210
235 195 20
255 153 51
150 160 170
160 20 50
0 115 50
30 188 130
Deposits composition and rates
25
Key rates
Deposit composition
Cost of deposits
Growth in low cost current account deposits
23.2% 26.0% 26.7% 26.2% 29.4% 34.2%
46.0% 45.6% 42.3% 40.8% 43.9%
43.9%
30.8% 28.4% 31.0% 33.0% 26.7% 21.9%
2009 2010 2011 2012 2013 2014
Fixed Deposits Savings Accounts Current Accounts
0.00%
1.00%
2.00%
3.00%
4.00%
5.00%
6.00%
1Q
09
1Q
09
3Q
09
4Q
09
1Q
10
2Q
10
3Q
10
4Q
10
1Q
11
2Q
11
3Q
11
4Q
11
1Q
12
2Q
12
3Q
12
4Q
12
1Q
13
2Q
13
3Q
13
4Q
13
1Q
14
2Q
14
3Q
14
4Q
14
Cost of Deposits -Domestic
Cost of Deposits -International
Total Cost of Deposits
0.0%
3.0%
6.0%
9.0%
12.0%
15.0%
Jan-0
9
Ma
y-0
9
Sep-0
9
Jan-1
0
Ma
y-1
0
Sep-1
0
Jan-1
1
Ma
y-1
1
Sep-1
1
Jan-1
2
Ma
y-1
2
Sep-1
2
Jan-1
3
Ma
y-1
3
Sep-1
3
Jan-1
4
Ma
y-1
4
Sep-1
4
KIBOR PLS rates
9.8%
6.5%
159 194
249
317
411
522
2009 2010 2011 2012 2013 2014
(PKRbn)
Update 2014 numbers
Dec-1
4

110 175 220
Color scheme
0 140 210
235 195 20
255 153 51
150 160 170
160 20 50
0 115 50
30 188 130
Appendix - Additional information
26
110 175 220
Color scheme
0 140 210
235 195 20
255 153 51
150 160 170
160 20 50
0 115 50
30 188 130
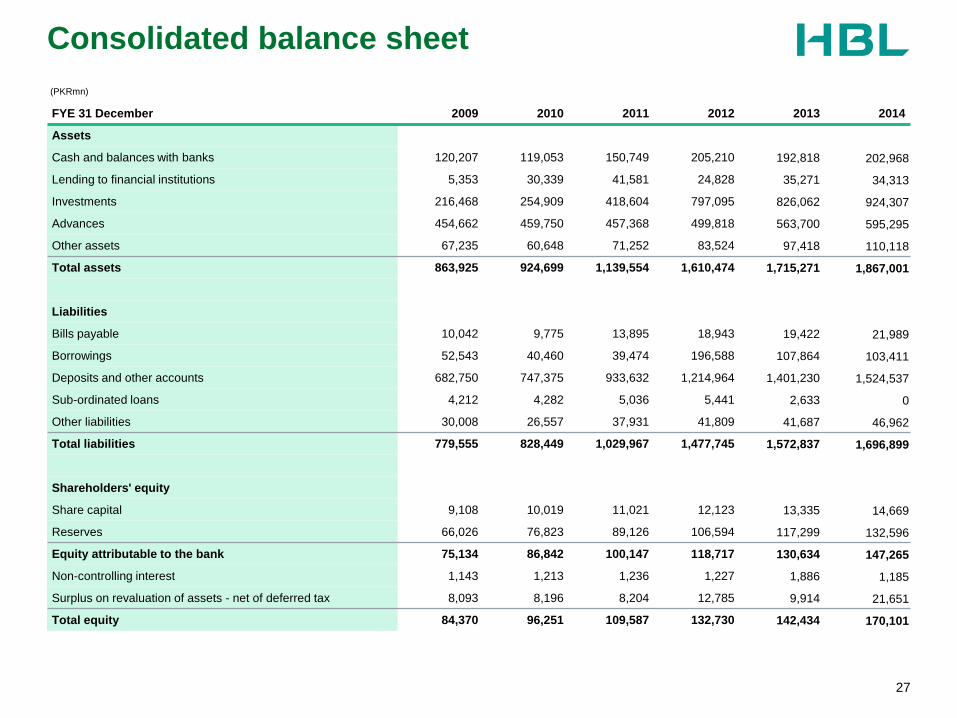
Consolidated balance sheet
27
FYE 31 December 2009 2010 2011 2012 2013 2014
Assets
Cash and balances with banks 120,207 119,053 150,749 205,210 192,818 202,968
Lending to financial institutions 5,353 30,339 41,581 24,828 35,271 34,313
Investments 216,468 254,909 418,604 797,095 826,062 924,307
Advances 454,662 459,750 457,368 499,818 563,700 595,295
Other assets 67,235 60,648 71,252 83,524 97,418 110,118
Total assets 863,925 924,699 1,139,554 1,610,474 1,715,271 1,867,001
Liabilities
Bills payable 10,042 9,775 13,895 18,943 19,422 21,989
Borrowings 52,543 40,460 39,474 196,588 107,864 103,411
Deposits and other accounts 682,750 747,375 933,632 1,214,964 1,401,230 1,524,537
Sub-ordinated loans 4,212 4,282 5,036 5,441 2,633 0
Other liabilities 30,008 26,557 37,931 41,809 41,687 46,962
Total liabilities 779,555 828,449 1,029,967 1,477,745 1,572,837 1,696,899
Shareholders' equity
Share capital 9,108 10,019 11,021 12,123 13,335 14,669
Reserves 66,026 76,823 89,126 106,594 117,299 132,596
Equity attributable to the bank 75,134 86,842 100,147 118,717 130,634 147,265
Non-controlling interest 1,143 1,213 1,236 1,227 1,886 1,185
Surplus on revaluation of assets - net of deferred tax 8,093 8,196 8,204 12,785 9,914 21,651
Total equity 84,370 96,251 109,587 132,730 142,434 170,101
(PKRmn)
110 175 220
Color scheme
0 140 210
235 195 20
255 153 51
150 160 170
160 20 50
0 115 50
30 188 130
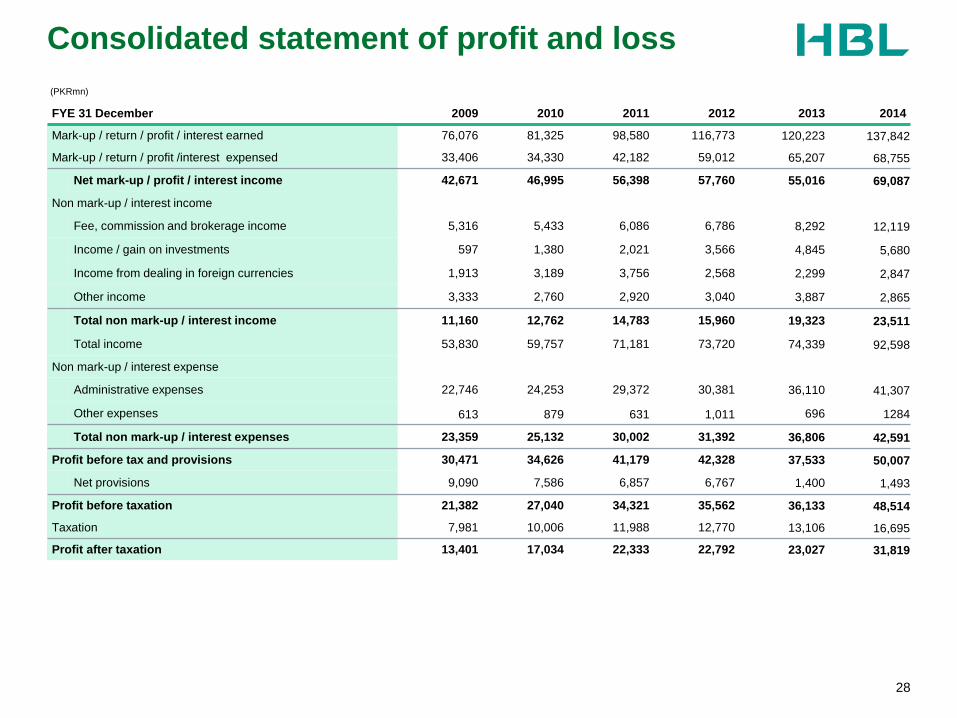
Consolidated statement of profit and loss
28
FYE 31 December 2009 2010 2011 2012 2013 2014
Mark-up / return / profit / interest earned 76,076 81,325 98,580 116,773 120,223 137,842
Mark-up / return / profit /interest expensed 33,406 34,330 42,182 59,012 65,207 68,755
Net mark-up / profit / interest income 42,671 46,995 56,398 57,760 55,016 69,087
Non mark-up / interest income
Fee, commission and brokerage income 5,316 5,433 6,086 6,786 8,292 12,119
Income / gain on investments 597 1,380 2,021 3,566 4,845 5,680
Income from dealing in foreign currencies 1,913 3,189 3,756 2,568 2,299 2,847
Other income 3,333 2,760 2,920 3,040 3,887 2,865
Total non mark-up / interest income 11,160 12,762 14,783 15,960 19,323 23,511
Total income 53,830 59,757 71,181 73,720 74,339 92,598
Non mark-up / interest expense
Administrative expenses 22,746 24,253 29,372 30,381 36,110 41,307
Other expenses 613 879 631 1,011 696 1284
Total non mark-up / interest expenses 23,359 25,132 30,002 31,392 36,806 42,591
Profit before tax and provisions 30,471 34,626 41,179 42,328 37,533 50,007
Net provisions 9,090 7,586 6,857 6,767 1,400 1,493
Profit before taxation 21,382 27,040 34,321 35,562 36,133 48,514
Taxation 7,981 10,006 11,988 12,770 13,106 16,695
Profit after taxation 13,401 17,034 22,333 22,792 23,027 31,819
(PKRmn)
110 175 220
Color scheme
0 140 210
235 195 20
255 153 51
150 160 170
160 20 50
0 115 50
30 188 130
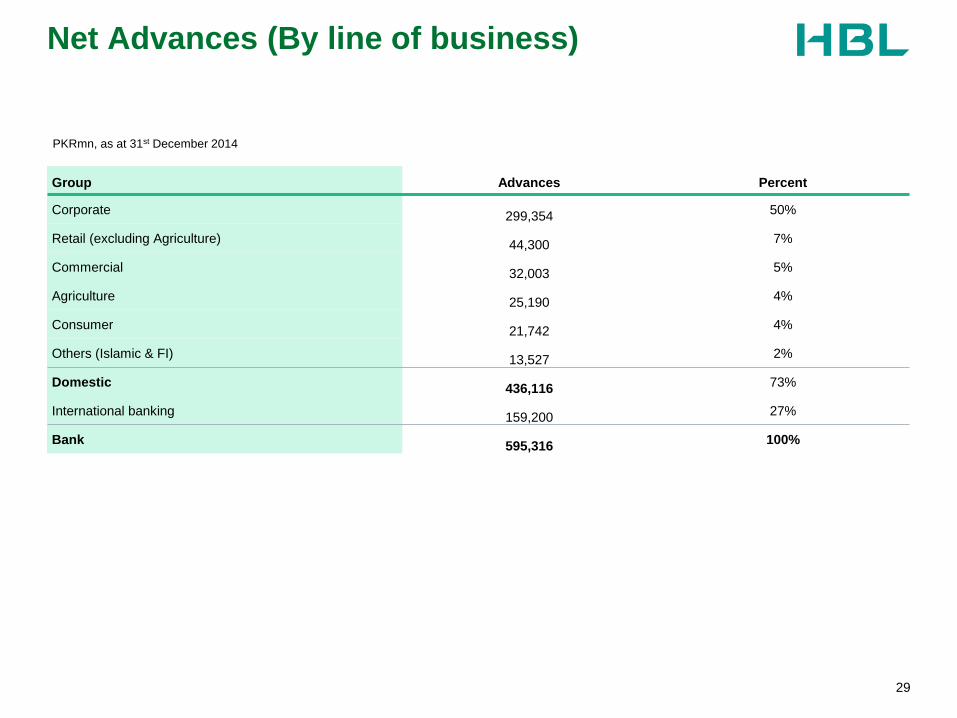
Net Advances (By line of business)
29
Group Advances Percent
Corporate 299,354
50%
Retail (excluding Agriculture) 44,300
7%
Commercial 32,003
5%
Agriculture 25,190
4%
Consumer 21,742
4%
Others (Islamic & FI) 13,527
2%
Domestic 436,116
73%
International banking 159,200
27%
Bank 595,316
100%
PKRmn, as at 31st December 2014
110 175 220
Color scheme
0 140 210
235 195 20
255 153 51
150 160 170
160 20 50
0 115 50
30 188 130
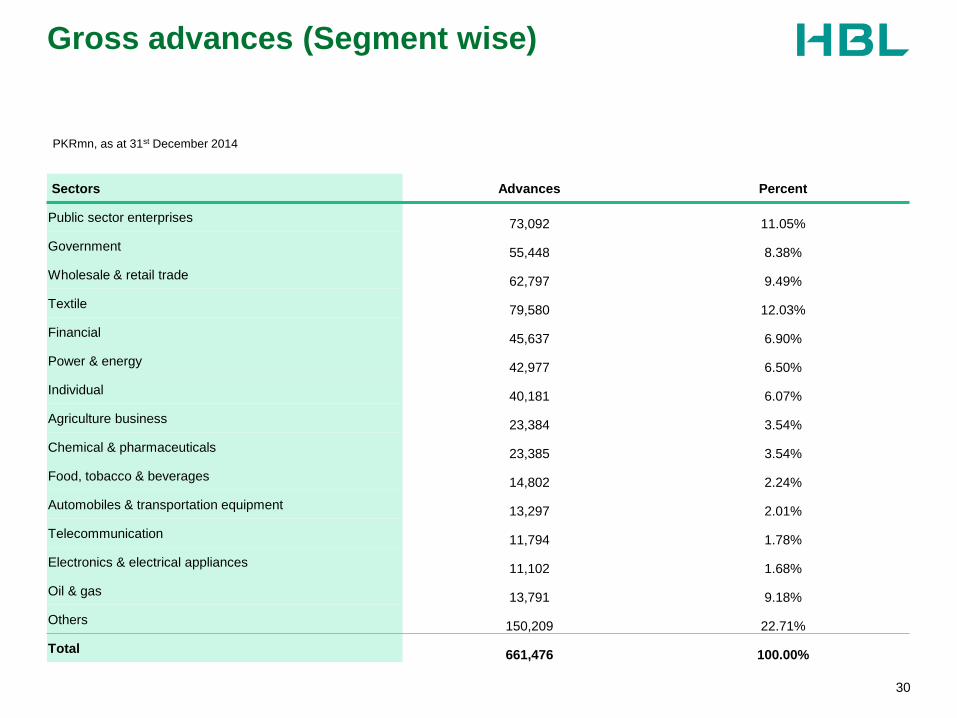
Gross advances (Segment wise)
30
Sectors Advances Percent
Public sector enterprises 73,092 11.05%
Government 55,448 8.38%
Wholesale & retail trade 62,797 9.49%
Textile 79,580 12.03%
Financial 45,637 6.90%
Power & energy 42,977 6.50%
Individual 40,181 6.07%
Agriculture business 23,384 3.54%
Chemical & pharmaceuticals 23,385 3.54%
Food, tobacco & beverages 14,802 2.24%
Automobiles & transportation equipment 13,297 2.01%
Telecommunication 11,794 1.78%
Electronics & electrical appliances 11,102 1.68%
Oil & gas 13,791 9.18%
Others 150,209 22.71%
Total 661,476 100.00%
PKRmn, as at 31st December 2014