pwc holdings ltd and its subsidiaries additional ... · illustrative annual report 2011 247 pwc...
TRANSCRIPT

Illustrative Annual Report 2011 247
PwC Holdings Ltd and its Subsidiaries
Additional Illustrative Disclosures
Appendix 1 Areas not relevant to PwC Holdings Ltd Group 1. Alternative presentations for statement of comprehensive income
2. Revenue recognition: multiple-element arrangements 3. Provision for dismantlement, removal and restoration 4. Post-employment benefits – pension and medical benefits 5. Defaults and breaches of loans payable 6. Convertible foreign currency bonds – classify as liability in entirety 7. Properties under development for sale 8. Third balance sheet disclosures under FRS 1R on reclassification 9. Related party disclosures under FRS 24 (Revised)
(for annual periods beginning on or after 1 January 2011) Appendix 2 Critical accounting estimates, assumptions and judgements not relevant or material to PwC Holdings Ltd Group
Pages
248254255256263265267271273
274
Add
ition
al Il
lust
ratio
ns

248
PwC Holdings Ltd and its Subsidiaries
Additional Illustrative Disclosures
Appendix 1 – Areas not relevant to PwC Holdings Ltd Group
Example 1: Alternative presentations for statement of comprehensive income
Scenario 1: One-statement presentation of statement of comprehensive income based on a classification of expenses by nature
Reference
Note 20113 20103
$’000 $’000 Continuing operations4
Sales 4 210,214 112,360 Other income 7 3,898 1,166 Other losses – net 8 (1,383) (1,611) Expenses - Purchases of inventories (59,401) (23,688) - Amortisation, depreciation and impairment 5 (23,100) (10,097) - Employee compensation 6 (40,090) (15,500) - Sub-contractors charges (12,400) (7,700) - Advertising (10,871) (6,952) - Rental on operating leases (10,588) (8,697) - Research (473) (200) - Transportation (7,763) (5,876) - Reversal of inventory write-down/(inventory write-down) 200 (350) - Finance 9 (7,073) (9,060) - Other (1,478) (672)Changes in inventories and construction contract work-in-progress 7,279 2,950Total expenses (165,758) (85,842) Share of (loss)/profit of associated companies5 (174) 145Profit before income tax 46,797 26,218Income tax expense 10(a) (14,897) (7,718)Profit from continuing operations4 31,900 18,500 Discontinued operations4 Profit/(loss) from discontinued operations 11 100 (480) Total profit4 32,000 18,020 Other comprehensive income7: Financial assets, available-for-sale - Fair value gains 582 67 - Reclassification8 (164) –Cash flow hedges - Fair value gains 342 328 - Reclassification8 (279) (315)Currency translation differences arising on consolidation 2,334 (118)Reclassification8 of currency translation reserves on disposal of a subsidiary (1,200) –Revaluation gains on property, plant and equipment9 207 852Share of other comprehensive income of associated companies 27 –Change in tax rate – 50Other comprehensive income for the year, net of tax 1,849 864 Total comprehensive income 33,849 18,884
FRS 1(82)(a)
FRS 1(102)
FRS 1(102)
FRS 1(102)
FRS 1(102)
FRS 17 (35)(c)
FRS 38 (126)
FRS 2(36)(e,f)
FRS 1(82)(b)
FRS 1(102)
FRS 1(82)(c)
FRS 1(82)(d)
FRS 1(82)(e)
FRS 105(33)(a)
FRS 1(82)(f)
FRS 1(82)(g)
Add
ition
al Il
lust
ratio
ns

Illustrative Annual Report 2011 249
Add
ition
al Il
lust
ratio
ns
PwC Holdings Ltd and its Subsidiaries
Additional Illustrative Disclosures
Appendix 1 – Areas not relevant to PwC Holdings Ltd Group
Example 1: Alternative presentations for statement of comprehensive income (continued)
Scenario 1: One-statement presentation of statement of comprehensive income based on a classification of expenses by nature (continued)
Reference
Note 20113 20103
$’000 $’000 Profit attributable to: Equity holders of the Company 29,450 17,096Non-controlling interest 2,550 924 32,000 18,020 Total comprehensive income attributable to: Equity holders of the Company 30,742 17,847Non-controlling interest 3,107 1,037 33,849 18,884 Earnings per share6 for profit from continuing and discontinued operations attributable to equity holders of the Company ($ per share)
Basic earnings per share 12 - From continuing operations 1.31 0.90 - From discontinued operations * (0.02) Diluted earnings per share 12 - From continuing operations 1.16 0.87 - From discontinued operations * (0.02) *Lessthan$0.01
FRS 1(83)(a)
FRS 1(83)(b)
FRS 33(66)
FRS 33(68)

250
PwC Holdings Ltd and its Subsidiaries
Additional Illustrative Disclosures
Appendix 1 – Areas not relevant to PwC Holdings Ltd Group
Example 1: Alternative presentations for statement of comprehensive income (continued)
Scenario 2: Two-statement presentation of statement of comprehensive income based on a classification of expenses by function
Reference
Consolidated Income Statement: Note 20113 20103
$’000 $’000 Continuing operations4
Sales 4 210,214 112,360Cost of sales (77,366) (46,682)Gross profit 132,848 65,678 Other income 7 3,898 1,166 Other losses - net 8 (1,383) (1,611) Expenses - Distribution and marketing (52,140) (19,993) - Administrative (29,179) (10,107) - Finance 9 (7,073) (9,060) Share of (loss)/profit of associated companies5 (174) 145 Profit before income tax 46,797 26,218 Income tax expense 10(a) (14,897) (7,718) Profit from continuing operations4 31,900 18,500 Discontinued operations4 Profit/(loss) from discontinued operations 11 100 (480) Total profit4 32,000 18,020 Attributable to: Equity holders of the Company 29,450 17,096Non-controlling interests 2,550 924 32,000 18,020 Earnings per share6 for profit from continuing and discontinued operations attributable to equity holders of the Company ($ per share)
Basic earnings per share 12 - From continuing operations 1.31 0.90 - From discontinued operations * (0.02) Diluted earnings per share 12 - From continuing operations 1.16 0.87 - From discontinued operations * (0.02) *Lessthan$0.01
FRS 1(82)(a)
FRS 1(103)
FRS 1(103)
FRS 1(103)
FRS 1(103)
FRS 1(103)
FRS 1(82)(b)
FRS 1(82)(c)
FRS 1(82)(d)
FRS 1(82)(e)
FRS 105(33)(a)
FRS 1(82)(f)
FRS 1(83)(a)
FRS 33(66)
FRS 33(68)
Add
ition
al Il
lust
ratio
ns

Illustrative Annual Report 2011 251
PwC Holdings Ltd and its Subsidiaries
Additional Illustrative Disclosures
Appendix 1 – Areas not relevant to PwC Holdings Ltd Group
Example 1: Alternative presentations for statement of comprehensive income (continued)
Scenario 2: Two-statement presentation of statement of comprehensive income based on a classification of expenses by function (continued)
Consolidated statement of comprehensive income:
Reference
Note 20113 20103
$’000 $’000
Profit for the year 32,000 18,020 Other comprehensive income7: Financial assets, available-for-sale - Fair value gains 582 67 - Reclassification8 (164) –Cash flow hedges - Fair value gains 342 328 - Reclassification8 (279) (315)Currency translation differences arising on consolidation 2,334 (118)Reclassification8 of currency translation reserves on disposal of a subsidiary (1,200) –Revaluation gains on property, plant and equipment9 207 852Share of other comprehensive income of associated companies 27 –Change in tax rate – 50Other comprehensive income, net of tax 1,849 864 Total comprehensive income 33,849 18,884 Total comprehensive income attributable to: Equity holders of the Company 30,742 17,847Non-controlling interest 3,107 1,037 33,849 18,884
FRS 1(82)(g)
FRS 1(83)(b)
Add
ition
al Il
lust
ratio
ns

252
PwC Holdings Ltd and its Subsidiaries
Additional Illustrative Disclosures
Appendix 1 – Areas not relevant to PwC Holdings Ltd Group
Example 1: Alternative presentations for statement of comprehensive income (continued)
Scenario 3: Two-statement presentation of statement of comprehensive income based on a classification of expenses by nature
Reference
Consolidated income statement: Note 20113 20103
$’000 $’000 Continuing operations4
Sales 4 210,214 112,360 Other income 7 3,898 1,166 Other losses – net 8 (1,383) (1,611) Expenses - Purchases of inventories (59,401) (23,688) - Amortisation, depreciation and impairment 5 (23,100) (10,097) - Employee compensation 6 (40,090) (15,500) - Sub-contractors charges (12,400) (7,700) - Advertising (10,871) (6,952) - Rental on operating leases (10,588) (8,697) - Research (473) (200) - Transportation (7,763) (5,876) - Reversal of inventory write-down/(inventory write-down) 200 (350) - Finance 9 (7,073) (9,060) - Other (1,478) (672)Changes in inventories and construction contract work-in-progress 7,279 2,950Total expenses (165,758) (85,842) Share of (loss)/profit of associated companies5 (174) 145Profit before income tax 46,797 26,218Income tax expense 10(a) (14,897) (7,718)Profit from continuing operations4 31,900 18,500 Discontinued operations4 Profit/(loss) from discontinued operations 11 100 (480) Total profit4 32,000 18,020 Attributable to: Equity holders of the Company 29,450 17,096Non-controlling interests 2,550 924 32,000 18,020Earnings per share6 for profit from continuing and discontinued operations attributable to equity holders of the Company ($ per share)
Basic earnings per share 12 - From continuing operations 1.31 0.90 - From discontinued operations * (0.02) Diluted earnings per share 12 - From continuing operations 1.16 0.87 - From discontinued operations * (0.02) *Lessthan$0.01
FRS 1(82)(a)
FRS 1(102)
FRS 1(102)
FRS 1(102)
FRS 1(102)
FRS 17 (35)(c)
FRS 38 (126)
FRS 2(36)(e,f)
FRS 1(82)(b)
FRS 1(102)
FRS 1(82)(c)
FRS 1(82)(d)
FRS 1(82)(e)
FRS 105(33)(a)
FRS 1(82)(f)
FRS 1(83)(a)
FRS 33(66)
FRS 33(68)
Add
ition
al Il
lust
ratio
ns

Illustrative Annual Report 2011 253
PwC Holdings Ltd and its Subsidiaries
Additional Illustrative Disclosures
Appendix 1 – Areas not relevant to PwC Holdings Ltd Group
Example 1: Alternative presentations for statement of comprehensive income (continued)
Scenario 3: Two-statement presentation of statement of comprehensive income based on a classification of expenses by nature (continued)
Statement of comprehensive income:
Reference
Note 2011 2010 $’000 $’000
Profit for the year 32,000 18,020 Other comprehensive income: Financial assets, available-for-sale - Fair value gains 582 67 - Reclassification8 (164) –Cash flow hedges - Fair value gains 342 328 - Reclassification8 (279) (315)Currency translation differences arising on consolidation 2,334 (118)Reclassification8 of currency translation reserves on disposal of a subsidiary (1,200) –Revaluation gains on property, plant and equipment9 207 852Share of other comprehensive income of associated companies 27 –Change in tax rate – 50Other comprehensive income, net of tax 1,849 864 Total comprehensive income 33,849 18,884 Total comprehensive income attributable to: Equity holders of the Company 30,742 17,847Non-controlling interest 3,107 1,037 33,849 18,884
FRS 1(82)(g)
FRS 1(83)(b)
Add
ition
al Il
lust
ratio
ns

254
PwC Holdings Ltd and its Subsidiaries
Additional Illustrative Disclosures
Appendix 1 – Areas not relevant to PwC Holdings Ltd Group
Example 2: Revenue recognition – multi-element arrangements
Extractsofsignificantaccountingpolicies:
Revenue recognition
Multiple-element arrangements
The Group offers certain arrangements where a customer can purchase certain electronic equipment, together with a two-year maintenance contract. When such multiple-element arrangements exist, the amount recognised as revenue upon the sale of the equipment is the fair value of the equipment in relation to the fair value of the arrangement taken as a whole and is recognised when the equipment is delivered and the customer accepted the delivery. The revenue relating to the service element, which represents the fair value of the maintenance arrangement in relation to the fair value of the arrangement taken as a whole, is recognised over the maintenance period evenly. The fair value of each element is determined based on the current market price when the elements are sold separately.
Where the Group is unable to determine the fair value of each of the elements in an arrangement, it uses the residual value method. Under this method, the Group determines the fair value of the delivered element by deducting the fair value of the undelivered element from the total contract consideration. To the extent that there is a discount on the arrangement, such discount is allocated between the elements of the contract in such a manner as to reflect the fair value of the elements.
Reference
FRS 18(13)
Add
ition
al Il
lust
ratio
ns
Illustrative Annual Report 2011 255
PwC Holdings Ltd and its Subsidiaries
Additional Illustrative Disclosures
Appendix 1 – Areas not relevant to PwC Holdings Ltd Group
Example 3: Provision for dismantlement, removal and restoration
Extractsofsignificantaccountingpolicies:
Property, plant and equipment
Measurement
Components of costs
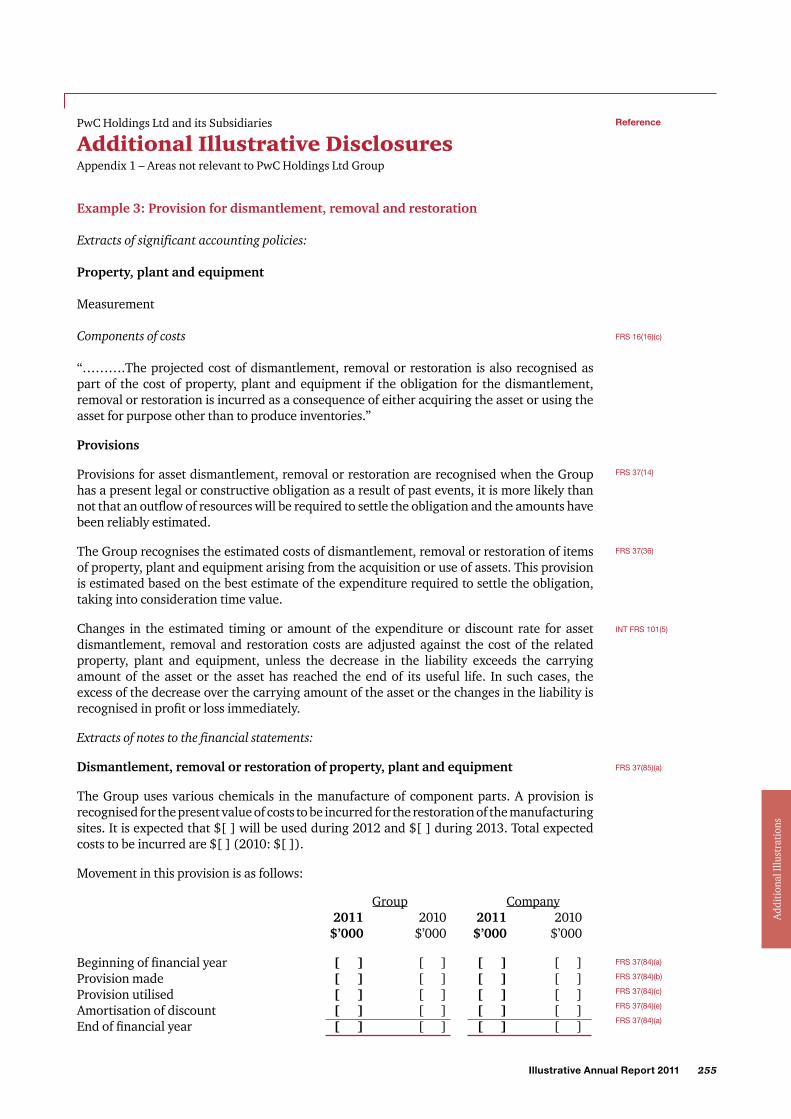
“……….The projected cost of dismantlement, removal or restoration is also recognised as part of the cost of property, plant and equipment if the obligation for the dismantlement, removal or restoration is incurred as a consequence of either acquiring the asset or using the asset for purpose other than to produce inventories.”
Provisions
Provisions for asset dismantlement, removal or restoration are recognised when the Group has a present legal or constructive obligation as a result of past events, it is more likely than not that an outflow of resources will be required to settle the obligation and the amounts have been reliably estimated.
The Group recognises the estimated costs of dismantlement, removal or restoration of items of property, plant and equipment arising from the acquisition or use of assets. This provision is estimated based on the best estimate of the expenditure required to settle the obligation, taking into consideration time value.
Changes in the estimated timing or amount of the expenditure or discount rate for asset dismantlement, removal and restoration costs are adjusted against the cost of the related property, plant and equipment, unless the decrease in the liability exceeds the carrying amount of the asset or the asset has reached the end of its useful life. In such cases, the excess of the decrease over the carrying amount of the asset or the changes in the liability is recognised in profit or loss immediately.
Extractsofnotestothefinancialstatements:
Dismantlement, removal or restoration of property, plant and equipment
The Group uses various chemicals in the manufacture of component parts. A provision is recognised for the present value of costs to be incurred for the restoration of the manufacturing sites. It is expected that $[ ] will be used during 2012 and $[ ] during 2013. Total expected costs to be incurred are $[ ] (2010: $[ ]).
Movement in this provision is as follows:
Reference
FRS 16(16)(c)
FRS 37(14)
FRS 37(36)
INT FRS 101(5)
FRS 37(85)(a)
Group Company 2011 2010 2011 2010 $’000 $’000 $’000 $’000
Beginning of financial year [ ] [ ] [ ] [ ]Provision made [ ] [ ] [ ] [ ]Provision utilised [ ] [ ] [ ] [ ]Amortisation of discount [ ] [ ] [ ] [ ]End of financial year [ ] [ ] [ ] [ ]
FRS 37(84)(a)
FRS 37(84)(b)
FRS 37(84)(c)
FRS 37(84)(e)
FRS 37(84)(a)
Add
ition
al Il
lust
ratio
ns

256
PwC Holdings Ltd and its Subsidiaries
Additional Illustrative Disclosures
Appendix 1 – Areas not relevant to PwC Holdings Ltd Group
Example 4: Post-employment benefits – pension and medical benefits
Extractsofsignificantaccountingpolicies:
Employee compensation
(a) Pension benefits
The Group operates both defined benefit and defined contribution post-employment benefit plans.
Defined contribution plans are post-employment benefit plans under which the Group pays fixed contributions into separate entities such as the Central Provident Fund on a mandatory, contractual or voluntary basis. The Group has no further payment obligations once the contributions have been paid. The Group’s contributions are recognised as employee compensation expense when they are due.
Defined benefit plans are post-employment benefit pension plans other than defined contribution plans. Defined benefit plans typically define the amount of benefit that an employee will receive on or after retirement, usually dependent on one or more factors such as age, years of service and compensation.
The liability recognised in the balance sheet in respect of a defined benefit pension plan is the present value of the defined benefit obligation at the reporting date less the fair value of plan assets, together with adjustments for unrecognised past-service costs. The defined benefit obligation is calculated annually by independent actuaries using the projected unit credit method. The present value of the defined benefit obligation is determined by discounting the estimated future cash outflows using market yields of high quality corporate bonds that are denominated in the currency in which the benefits will be paid, and have tenures approximating to that of the related post-employment benefit obligations.
Actuarial gains and losses1 are recognised in other comprehensive income in the period when they arise.
Past service costs are recognised immediately in profit or loss, unless the changes to the pension plan are conditional on the employees remaining in service for a specified period of time (the vesting period). In this case, the past-service costs are amortised on a straight-line basis over the vesting period.
Reference
FRS 19(7)
FRS 19(44)
FRS 19(7)
FRS 19(54)
FRS 19(64)
FRS 19(78)
FRS 19(93-93D)
FRS 19(120A)(a)
FRS 19(96)
Add
ition
al Il
lust
ratio
ns

Illustrative Annual Report 2011 257
PwC Holdings Ltd and its Subsidiaries
Additional Illustrative Disclosures
Appendix 1 – Areas not relevant to PwC Holdings Ltd Group
Example 4: Post-employment benefits – pension and medical benefits (continued)
Extractsofsignificantaccountingpolicies(continued):
(b) Post-employment medical benefits
Some Group companies provide post-employment healthcare benefits to their retirees. The entitlement to these benefits is usually conditional on the employee remaining in service up to retirement age and the completion of a minimum service period. The expected costs of these benefits are accrued over the period of employment using the same accounting methodology as used for defined benefit plans. Actuarial gains and losses1 are recognised in other comprehensive income in the period when they arise. These obligations are valued annually by independent qualified actuaries.
Reference
FRS 19(120A)(b)
FRS 19(120A)(a)
Guidance notes
Post-employment benefits1. There are three approaches to account for actuarial gains and losses, namely:
(a) corridor approach – in which actuarial gains and losses outside the corridor
threshold are recognised in profit or loss over the expected average remaining working lives of the participants of the plan;
(b) recognising all actuarial gains and losses in the period in which they occur, in other comprehensive income, provided that the entity does so for all of its defined benefit plans and all of its actuarial gains and losses. Such actuarial gains and losses should be presented in the statement of comprehensive income; and
(c) any systematic method that results in faster recognition of actuarial gains and losses than the corridor approach. Such permitted methods include immediate recognition of all actuarial gains and losses to profit or loss. Although this method introduces significant volatility to profit or loss, it is easy to implement.
2. When an entity has more than one defined benefit plan, disclosures may be made in total, separately for each plan, or in such groupings as are considered to be more useful. It may be useful to distinguish groupings by criteria such as follows:
(a) the geographical location of the plans, e.g. by distinguishing domestic plans from
foreign plans; or (b) whether plans are subject to materially different risks, e.g. by distinguishing flat
salary pension plans from final salary pension plans and from post-employment medical plans.
When an entity provides disclosures in total for a grouping of plans, such disclosures are provided in the form of weighted averages or of relatively narrow ranges.
FRS 19(92-93)
FRS 19(93A)
FRS 19(93)
FRS 19(122)
Add
ition
al Il
lust
ratio
ns

258
PwC Holdings Ltd and its Subsidiaries
Additional Illustrative Disclosures
Appendix 1 – Areas not relevant to PwC Holdings Ltd Group
Example 4: Post-employment benefits – pension and medical benefits (continued)
Extracts of notes to the financial statements (continued): Group 2011 2010 $’000 $’000
Obligations recognised in the balance sheet for:
Pension benefits 3,225 1,532Post-employment medical benefits 1,410 701 4,635 2,233
Expenses charged to profit or loss: Pension benefits 755 488Post-employment medical benefits 149 107
904 595
Reference
(a) Pension benefits Group 2011 2010 $’000 $’000
The amount recognised in the balance sheet is determined as follows:
Present value of funded obligations 6,155 2,943Fair value of plan assets (5,991) (2,797) 164 146Present value of unfunded obligations 3,206 1,549Unrecognised past service cost (145) (163)Liability recognised in the balance sheet 3,225 1,532
Group 2011 2010 $’000 $’000
The amounts recognised in profit or loss are as follows: Current service cost 751 498Interest cost 431 214Expected return on plan assets (510) (240)Past service cost 18 16Curtailment 65 – 755 488 Included in: Cost of goods sold 516 319Administrative expenses 239 169 755 488
Actual return on plan assets 495 235
FRS 19(120A)(d,f)
FRS 19(120A)(g)
FRS 19(120A)(g)
FRS 19(120A)(m)
Add
ition
al Il
lust
ratio
ns
Illustrative Annual Report 2011 259
PwC Holdings Ltd and its Subsidiaries
Additional Illustrative Disclosures
Appendix 1 – Areas not relevant to PwC Holdings Ltd Group
Example 4: Post-employment benefits – pension and medical benefits (continued)
Extractsofnotestothefinancialstatements(continued):
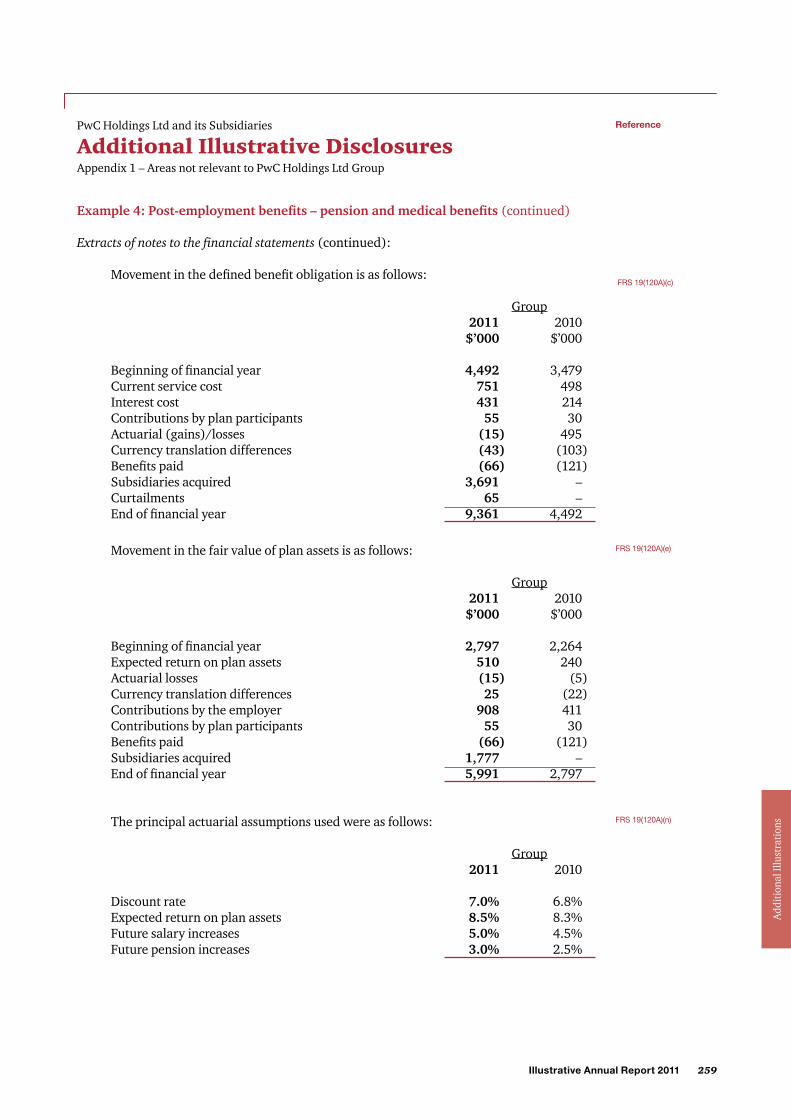
Movement in the defined benefit obligation is as follows:
Group 2011 2010 $’000 $’000
Beginning of financial year 4,492 3,479 Current service cost 751 498 Interest cost 431 214 Contributions by plan participants 55 30Actuarial (gains)/losses (15) 495Currency translation differences (43) (103) Benefits paid (66) (121)Subsidiaries acquired 3,691 – Curtailments 65 – End of financial year 9,361 4,492
Reference
FRS 19(120A)(c)
Movement in the fair value of plan assets is as follows:
Group 2011 2010 $’000 $’000
Beginning of financial year 2,797 2,264 Expected return on plan assets 510 240Actuarial losses (15) (5)Currency translation differences 25 (22)Contributions by the employer 908 411 Contributions by plan participants 55 30Benefits paid (66) (121)Subsidiaries acquired 1,777 – End of financial year 5,991 2,797
The principal actuarial assumptions used were as follows:
Group 2011 2010
Discount rate 7.0% 6.8% Expected return on plan assets 8.5% 8.3% Future salary increases 5.0% 4.5% Future pension increases 3.0% 2.5%
FRS 19(120A)(e)
FRS 19(120A)(n)
Add
ition
al Il
lust
ratio
ns

260
PwC Holdings Ltd and its Subsidiaries
Additional Illustrative Disclosures
Appendix 1 – Areas not relevant to PwC Holdings Ltd Group
Example 4: Post-employment benefits – pension and medical benefits (continued)
ExtractsofNotestotheFinancialStatements(continued):
Assumptions regarding future mortality experience are set based on advice in accordance with published statistics and experience in each territory.
The average remaining life expectancy in years of a pensioner retiring at age 65 is as follows:
2011 2010
Male 18.5 18.5 Female 22.0 22.0
(b) Post-employment medical benefits
The Group operates a number of post-employment medical benefit schemes, principally in the Philippines. The method of accounting, assumptions and the frequency of valuations are similar to those used for defined benefit pension schemes.
In addition to the assumptions set out above, the main actuarial assumption is a long-term increase in health costs of 8.0% a year (2010: 7.6%).
The amount recognised in the balance sheet is determined as follows:
Reference
FRS 19(120A)(a,b)
FRS 19(120A)(n)
FRS 19(120A)(d,f)
Group 2011 2010 $’000 $’000
Present value of funded obligations 705 340Fair value of plan assets (620) (302) 85 38 Present value of unfunded obligations 1,325 663Liability recognised in the balance sheet 1,410 701 The amounts recognised in profit or loss are as follows: Group 2011 2010 $’000 $’000 Current service cost 153 107Interest cost 49 25Expected return on plan assets (53) (25) 149 107 Included in: Cost of goods sold 102 71Administrative expenses 47 36 149 107 Actual return on plan assets 51 24
FRS 19(120A)(g)
FRS 19(120A)(g)
FRS 19(120A)(m)
Add
ition
al Il
lust
ratio
ns

Illustrative Annual Report 2011 261
PwC Holdings Ltd and its Subsidiaries
Additional Illustrative Disclosures
Appendix 1 – Areas not relevant to PwC Holdings Ltd Group
Example 4: Post-employment benefits – pension and medical benefits (continued)
Extracts of notes to the financial statements (continued):
Movement in the defined benefit obligation for post-employment medical plan is as follows:
Group 2011 2010 $’000 $’000
Beginning of financial year 1,003 708Current service cost 153 107Interest cost 49 25Actuarial (gains)/losses (2) 204Currency translation differences 25 (41)Subsidiaries acquired 802 –End of financial year 2,030 1,003
Movement in the fair value of plan assets for post-employment medical plan is as follows:
Reference
FRS 19(120A)(c)
FRS 19(120A)(e)
Group 2011 2010 $’000 $’000
Beginning of financial year 302 207 Expected return on plan assets 53 25Actuarial losses (2) (1)Currency translation differences 5 (2)Contributions by the employer 185 73 Subsidiaries acquired 77 – End of financial year 620 302
The effect of a 1% change in the assumed medical cost trend rate is as follows:
Group Increase Decrease $’000 $’000
Effect on the aggregate of the current servicecost and interest cost 24 (20)
Effect on the defined benefit obligation 366 (313)
FRS 19(120A)(o)
Add
ition
al Il
lust
ratio
ns

262
PwC Holdings Ltd and its Subsidiaries
Additional Illustrative Disclosures
Appendix 1 – Areas not relevant to PwC Holdings Ltd Group
Example 4: Post-employment benefits – pension and medical benefits (continued)
Extractsofnotestothefinancialstatements(continued):
The amounts recognised in other comprehensive income for pension and post-employment medical benefits were as follows:
2011 2010 $’000 $’000
Actuarial losses recognised during financial year – 705 Cumulative actuarial losses recognised 705 705
Plan assets of pension and post-employment medical benefits comprise the following:
Reference
FRS 19(120A)(h)
FRS 19(120A)(i)
FRS 19(120A)(j)
Group 2011 2010 $’000 % $’000 % Equity securities 3,256 49 1,595 51Debt securities 2,571 39 855 28Other 784 12 649 21 6,611 100 3,099 100
Plan assets include the Company’s ordinary shares with a fair value of $136,000 (2010: $126,000) and a building occupied by the Group with a fair value of $612,000 (2010: $609,000).
The expected return on plan assets is determined by considering the expected returns available on the assets underlying the current investment policy. Expected yields on fixed interest investments are based on gross redemption yields as at the reporting date. Expected returns on equity and property investments reflect long-term real rates of return experienced in the respective markets.
Expected contributions to pension post employment medical benefit plans for the financial year ending 31 December 2011 are $1,150,000.
Group 2011 2010 2009 2008 $’000 $’000 $’000 $’000Beginning of financial yearPresent value of defined benefit obligation 11.391 5.495 4,187 3,937Fair value of plan assets (6,611) (3,099) (2,471) (2,222)Deficit 4,780 2,396 1,716 1,715
Experience adjustments (326) 125 55 – on plan liabilitiesExperience adjustments on plan assets (17) (6) (197) –
FRS 19(120A)(k)
FRS 19(120A)(l)
FRS 19(120A)(q)
FRS 19(120A)(p)
Add
ition
al Il
lust
ratio
ns

Illustrative Annual Report 2011 263
PwC Holdings Ltd and its Subsidiaries
Additional Illustrative Disclosures
Appendix 1 – Areas not relevant to PwC Holdings Ltd Group
Example 5: Defaults and breaches of loans payable
Defaults of loan payments
Extractsofnotestothefinancialstatementsonborrowing:
Scenario 1: Defaults of loan payments – classification of loan as “current” at reporting date
The Company has experienced a temporary shortage of funding because cash outflows in the second quarter for business expansion in [countries] were higher than anticipated. As a result, interest payables of $[ ] on the Company’s loan with Bank A due by [date] remained unpaid as at 31 December 2011. The carrying amount of the loan payable in default as at 31 December 2011 is $[ ].
In January 2012, the Company obtained a new loan with Bank B having a maturity of three years to settle its existing debt with Bank A. The loan with Bank A was settled on 27 January 2012.
The loan with Bank A is presented as current liability as at 31 December 2011.
Scenario 2: Breaches of loan payments and classification of loan as “non-current” at reporting date
Interest payments of $[ ] on the Company’s bank borrowings with a carrying amount of $[ ] was overdue as at 30 September 2011. The Company experienced a temporary shortage of funding because cash outflows in the second and third quarters for business expansion in [countries] were higher than anticipated. As a result, interest payables of $[ ] due by [date] remained unpaid.
Subsequently during the fourth quarter the Company has paid all overdue amounts (including additional interest and penalties for the late payment). As a result, the outstanding balance is presented as a non-current liability as at 31 December 2011.
Management expects that the Company will be able to meet all contractual obligations from borrowings on a timely basis going forward.
Reference
FRS 107(18)
FRS 1(73)
FRS 107(18)
FRS 1(73,74)
Add
ition
al Il
lust
ratio
ns

264
PwC Holdings Ltd and its Subsidiaries
Additional Illustrative Disclosures
Appendix 1 – Areas not relevant to PwC Holdings Ltd Group
Example 5: Defaults and breaches of loans payable
Breaches of loan covenants
ExtractsofNotestothefinancialstatementsonborrowings:
Reference
Scenario 1: Breaches of loan covenants – classification of loan as “current” at reporting date
Some of the Company’s loan agreements (classified as non-current during the year) are subjected to covenant clauses, whereby the Company is required to meet certain key financial ratios. The Company did not fulfil the debt/equity ratio as required in the contract for a credit line of $[ ], of which the Company has currently drawn an amount of $[ ].
Due to this breach of the covenant clause, the bank is contractually entitled to request for immediate repayment of the outstanding loan amount of $[ ]. The outstanding balance is presented as a current liability as at 31 December 2011.
The bank had not requested early repayment of the loan as of the date when these financial statements were approved by the Board of Directors. Management is in the process of renegotiating the terms of the loan agreement with the bank and expects that a revised loan agreement will be in place in the second quarter of 2012.
Scenario 2: Breaches of loan covenants – classification of loan as “non-current” at reporting date Some of the Company’s loan agreements are subject to covenant clauses, whereby the Company is required to meet certain key financial ratios. The Company did not fulfil the debt/equity ratio as required in the contract for a credit line of $[ ], of which the Company has currently drawn an amount of $[ ].
Due to this breach of the covenant clause, the bank is contractually entitled to request for immediate repayment of the outstanding loan amount of $[ ].
However, prior to the end of the financial year, the bank has agreed to a period of grace ending in first quarter of 2012.
The outstanding balance is presented as a non-current liability as at 31 December 2011. Note: If the breach occurs after the end of the reporting period, then the liability would still be shown as non-current, unless the breach was so serious that the financial statements could not be presented on a going concern basis.
FRS 107(19)
FRS 1 (73),(74)
FRS 1(135)(e)
FRS 107(19)
FRS 1(75)
FRS 1(135)(e)
Add
ition
al Il
lust
ratio
ns

Illustrative Annual Report 2011 265
PwC Holdings Ltd and its Subsidiaries
Additional Illustrative Disclosures
Appendix 1 – Areas not relevant to PwC Holdings Ltd Group
Example 6: Convertible foreign currency bonds – classify as liability in entirety
Extractsofsignificantaccountingpolicies: Convertible foreign currency bonds On issuance of convertible foreign currency bonds, the proceeds are allocated between the embedded equity conversion option and the liability component. The embedded option is recognised at its fair value. The liability component is recognised as the difference between total proceeds and the fair value of the equity conversion option.
The equity conversion option is subsequently carried at its fair value with fair value changes recognised in profit or loss. The liability component is carried at amortised cost until the liability is extinguished on conversion or redemption.
When an equity conversion option is exercised, the carrying amounts of the liability component and the equity conversion option are derecognised with a corresponding recognition of share capital. Extractsofnotestothefinancialstatements: Other losses - net
Group 2011 2010 $’000 $’000
Fair value gains on equity conversion option in convertible bonds 4,083 – Finance expenses
Group 2011 2010 $’000 $’000
Interest expense: - Convertible bonds 16,966 –
Reference
FRS 39 AG28
FRS 107(20)(a)(v)
FRS 107(20)(b)
Add
ition
al Il
lust
ratio
ns

266
PwC Holdings Ltd and its Subsidiaries
Additional Illustrative Disclosures
Appendix 1 – Areas not relevant to PwC Holdings Ltd Group
Example 6: Convertible foreign currency bonds – classify as liability in entirety (continued)
Extractsofnotestothefinancialstatements(continued): Convertible foreign currency bonds On 1 October 2011, the Group issued zero coupon convertible bonds at a nominal value of US$500 million (equivalent to $720 million) due on 4 October 2015. The bonds will be redeemed on 4 October 2015 at their nominal value or can be converted into shares of the Company (the “conversion option”) at the holder’s option at a conversion price of US$2.20 per share at any time on and after 14 November 2011 up to the close of business on 24 September 2015 if not called for redemption. On full conversion, up to 320,000,000 conversion shares (“Conversion Ratio”) are expected to be issued and allotted to the holders of the bonds.
The convertible bonds recognised in the balance sheet are analysed as follows:
$’000 Face value of convertible bonds issued,
net of transaction costs 700,000Embedded equity conversion option (4,083)Liability component at initial recognition 695,917
Accumulated amortisation of interest expense 16,966Currency translation differences (5,898)Liability component at end of financial year 706,985 The fair value of the liability component of the convertible bonds at 31 December 2011 is $706,985,000. The fair value is calculated using cash flows discounted at a borrowing rate of 6.48%.
Reference
FRS 107(17,34)
FRS 107(25,27)
Add
ition
al Il
lust
ratio
ns

Illustrative Annual Report 2011 267
PwC Holdings Ltd and its Subsidiaries
Additional Illustrative Disclosures
Appendix 1 – Areas not relevant to PwC Holdings Ltd Group
Example 7: Properties under development sale
Extractsofsignificantaccountingpolicies:
Development properties
Development properties refer to properties developed for sale.
Development properties that are unsold are carried at the lower of cost and net realisable value. Net realisable value is the estimated selling price in the ordinary course of business less cost to complete the development and selling expenses.
Sales of development properties under construction in respect of sale and purchase agreements are entered into prior to completion of construction are recognised when the properties are delivered to the buyers, except for in cases where the control and risk and rewards of the property are transferred to the buyers as construction progresses.
For sales of development properties of the Group that are within the scope1 as described in paragraph 2 of the Accompanying Note to INT FRS 115 - Agreements for the Construction of Real Estate, the Group recognises revenue for sales of such development properties by reference to the stage of completion of the properties.
The stage of completion is measured by reference to the physical surveys of construction work completed. When it is probable that the total development costs will exceed the total revenue, the expected loss is recognised as expense immediately.
The aggregated costs incurred and the profit/loss recognised in each development property that has been sold are compared against progress billings up to the financial year-end. Where the costs incurred and recognised profits (less recognised losses) exceed progress billings, the balance is shown as unbilled revenue under “trade and other receivables”. Where progress billings exceed costs incurred plus recognised profits (less recognised losses), the balance is shown as due to customers on development projects, under “trade and other payables”.
Reference
FRS 2(9)
FRS 2(6)
INT FRS 115(20)(a)
INT FRS 115(20)(b)
INT FRS 115(20)(c)
FRS 11(43)
FRS 11(44)
Add
ition
al Il
lust
ratio
ns

268
PwC Holdings Ltd and its Subsidiaries
Additional Illustrative Disclosures
Appendix 1 – Areas not relevant to PwC Holdings Ltd Group
Example 7: Properties under development sale (continued)
Extractsofnotestothefinancialstatements(continued):
Development properties 2011 2010 2009 $’000 $’000 $’000
Completed properties 1,144 1,300 1,255Properties under construction 304 206 405
1,448 1,506 1,660
Sale and purchase agreements on certain properties under construction have been signed. Deposits and progress billings amounting to $[xx] on these agreements are presented within “trade and other liabilities”.
Development properties under construction where revenue is recognised as construction progresses:
2011 2010 2009 $’000 $’000 $’000
Aggregate costs incurred and profits recognised (less losses recognised) onsold development properties in progress 4,466 2,222 3,145
Less: Progress billings (3,400) (1,212) (2,456)Unbilled revenue included in trade and
the receivables 1,066 1,010 689
Reference
DV
DV
FRS 2(36)(b)
INT FRS 115 ( 21)(a,b)
Add
ition
al Il
lust
ratio
ns

Illustrative Annual Report 2011 269
PwC Holdings Ltd and its Subsidiaries
Additional Illustrative Disclosures
Appendix 1 – Areas not relevant to PwC Holdings Ltd Group
Example 7: Properties under development sale (continued)
Extracts of significant accounting policies:
Note 2.1 Basis of Preparation
Interpretation to published standards effective in 2011:
On 1 January 2011, the Group adopted the new or amended FRS and Interpretations to FRS (“INT FRS”) that are mandatory for application from that date. Changes to the Group’s accounting policies have been made as required, in accordance with the transitional provisions in the respective FRS and INT FRS.
The adoption of these new or amended FRS and INT FRS did not result in substantial changes to the Group’s and Company’s accounting policies and had no material effect on the amounts reported for the current or prior financial years except as disclosed below:
INT FRS 115 Agreements for the Construction of Real Estate, with an Accompanying Note (“AN”) to be read in conjunction with INT FRS 115. (Effective for annual periods beginning on or after 1 January 2011)
INT FRS 115 applies retrospectively for annual periods beginning on or after 1 January 2011. Prior to the adoption of INT FRS 115, revenue from sales of properties held-for-sale (both Singapore and overseas properties) was recognised using the percentage-of-completion method.
Upon adoption of INT FRS 115, revenue from sale of Singapore residential properties that are within the scope1 as described in paragraph 2 of the AN continues to be recognised on a percentage-of-completion method. However, for the sale of overseas properties, revenue is recognised only upon completion of construction.
The effects on adoption are as follows:
Reference
FRS 8 (28)
FRS 8 (28)(c)
FRS 8 (28)(f,g)
FRS 8 (28)(f)(ii)
Add
ition
al Il
lust
ratio
ns
Consolidated balance sheet At 31 December At 31 December At 1 January 2011 2010 2010 Increase/(Decrease) $’000 $’000 $’000
Development properties 30,000) 44,118) 36,000)Trade and other payables-current 26,000) 45,790) 28,000)Retained profits (900) (1,276) (1,000)Non-controlling interests (100) (396) (200)
Consolidated income statement for year ended 31 December Increase/(Decrease) 2011 2010 $’000 $’000
Revenue (45,790) (32,000)Cost of sales (44,118) (31,040)Non-controlling interests (396) (200)
Profit attributable to: Equity holders of the Company 1,472) 874)Non-controlling interests 200) 86)
Basic and diluted earnings per share forthe financial year ended (cents per share) (0.10) (0.07)

270
PwC Holdings Ltd and its Subsidiaries
Additional Illustrative Disclosures
Appendix 1 – Areas not relevant to PwC Holdings Ltd Group
Guidance notes
Scope of the Accompanying Note to INT FRS 115 Agreements for the Construction of Real Estate1. The scope deals with the accounting treatment for revenue and associated expenses
by housing developers who develop more than 4 units of private residential properties in Singapore for sale prior to completion1 of the properties. These developers are regulated under the Singapore Housing Developers (Control and Licensing) Act (Chapter 130) (the “Act”) and use the standard form of the sale and purchase agreement (the “SPA”) prescribed in Form D for landed properties and Form E for strata-titled properties of the schedule to the Housing Developers Rules, with each unit sold intended to comprise a lot in a land title plan for landed properties and strata title plan for strata-titled properties. Such a unit sold is referred to as “uncompleted property unit”. Such sales are referred to as “standard residential property sales”.
Comparatives2. An entity shall apply INT FRS 115 Interpretation for annual periods beginning on or
after 1 January 2011 and changes in accounting policy of the company upon adoption of this interpretation shall be accounted for retrospectively in accordance with FRS 8.
Accordingly, the entity shall present, as a minimum, three statements of financial position (or balance sheets), two of each of the other statements, and related notes. an entity presents statements of financial position (or balance sheets) as at:
(a) the end of the current period,(b) the end of the previous period (which is the same as the beginning of the current
period), and (c) the beginning of the earliest comparative period.
Reference
FRS 1(39)
Add
ition
al Il
lust
ratio
ns

Illustrative Annual Report 2011 271
PwC Holdings Ltd and its Subsidiaries
Additional Illustrative Disclosures
Appendix 1 – Areas not relevant to PwC Holdings Ltd Group
Reference
FRS 1(54,77)
SGX 1207(5)(a)
SGX 1207(5)(b)
FRS 1(60)
FRS 1(54)(i)
FRS 1(54)(d)
FRS 1(54)(d)
FRS 1(54)(d)
FRS 1(54)(h)
FRS 1(54)(g)
FRS 105(38)
FRS 1(54)(j)
FRS 1(60)
FRS 1(54)(d)
FRS 1(54)(d)
FRS 1(54)(h)
FRS 1(54)(e)
FRS 1(54)(b)
FRS 1(54)(d)
FRS 1(54)(a)
FRS 1(54)(c)
FRS 1(54)(o)
FRS 1(60)
FRS 1(54)(k)
FRS 1(54)(n)
FRS 1(54)(m)
FRS 1(54)(m)
FRS 1(54)(l)
FRS 105(38)
FRS 1(54)(p)
FRS 1(60)
FRS 1(54)(k)
FRS 1(54)(m)
FRS 1(54)(m)
FRS 1(54)(o)
FRS 1(54)(l)
FRS 1(78)(e)
FRS 1(78)(e)
FRS 1(78)(e)
FRS 1(78)(e)
FRS 1(54)(r)
FRS 1(54)(q)
Example 8: Third balance sheet disclosure under FRS 1R on reclassification
When an entity reclassifies items in its financial statements, three balance sheets should be shown as follows:
Note 2011 2010 2009 (restated) (restated) $’000 $’000 $’000ASSETSCurrent assets Cash and cash equivalents 13 22,010 36,212 31,221Financial assets, at fair value through profit or loss 14 10,785 8,326 9,571Derivative financial instruments 15 1,069 452 410Financial assets, available-for-sale 16 1,950 646 1,125Trade and other receivables 17 19,510 16,399 17,305Inventories 18 24,258 17,094 19,250Construction contract work-in-progress 19 262 147 347 79,844 79,276 79,229Disposal group classified as held-for-sale 11 3,333 – – 83,177 79,276 79,229 Non-current assets Derivative financial instruments 15 395 112 215Financial assets, available-for-sale 16 15,298 12,291 11,958Trade and other receivables 20 3,322 1,990 2,512Investments in associated companies 23 8,208 8,569 8,133Investment properties 26 5,550 5,455 3,365Financial assets, held-to-maturity 27 2,122 1,593 –Property, plant and equipment 28 153,611 97,890 104,328Intangible assets 29 24,930 19,600 19,966Deferred income tax assets 36 3,319 3,228 1,995 216,755 150,728 152,472Total assets 299,932 230,004 231,701 LIABILITIESCurrent liabilities Trade and other payables 30 16,441 10,556 5,767Current income tax liabilities 10 2,942 3,833 9,595Derivative financial instruments 15 440 240 300Borrowings 31 9,524 15,670 12,131Provisions 35 2,126 2,300 1,129 31,473 32,599 28,922Liabilities directly associated with disposal group classified as held-for-sale 11 220 – – 31,693 32,599 28,922Non-current liabilities Trade and other payables 30 350 – 91Derivative financial instruments 15 135 44 2,320Borrowings 31 118,300 89,214 100,145Deferred income tax liabilities 36 11,646 8,406 5,040Provisions 35 1,655 1,585 1,250 132,086 99,249 108,846Total liabilities 163,779 131,848 137,768NET ASSETS 136,153 98,156 93,933 EQUITYCapital and reserves attributable to equity holders of the Company Share capital 37 41,495 32,024 32,024Treasury shares 37 (1,418) (900) –Other reserves 38 9,628 6,419 5,046Retained profits 39 78,200 58,852 55,589 127,905 96,395 92,659Non-controlling interests 8,248 1,761 1,274Total equity 136,153 98,156 93,933
Add
ition
al Il
lust
ratio
ns

272
PwC Holdings Ltd and its Subsidiaries
Additional Illustrative Disclosures
Appendix 1 – Areas not relevant to PwC Holdings Ltd Group
Example 8: Third balance sheet disclosure under FRS 1R on reclassification (continued)
Extracts of notes to accounts1:
The following reclassifications have been made to the prior year’s financial statements so as to remove offsets in the balance sheet.
The restatement is as below:
GROUP 2011 2010 2009 (restated) (restated) $’000 $’000 $’000
ASSETS Trade and other receivables (428) (345) (499)
LIABILITIES Trade and other payables - Advances from Customers 428 345 499
Guidance notes
Reference
Presentation of a third balance sheet and related notes1. FRS 1 (revised) Presentation of Financial Statements requires an additional balance
sheet to be presented as at the beginning of the earliest comparative period following a change in accounting policy, the correction of an error, or the reclassification of items in the financial statements. Paragraph 39 refers to the presentation of “related notes” when a third balance sheet is presented. The standard provides no further guidance in terms of how the above requirement should be interpreted.
In our view, in such cases, it is sufficient for an entity to present only the notes to that additional statement that have been impacted by the restatement or reclassification, provided that the entity states in its financial statements that the other notes have not been impacted by the restatement or reclassification.
The materiality of an omission is measured against its ability to influence the economic decisions of the users of the financial statement and the omission of the unaffected notes to the additional statement is in our view, not material nor relevant for an understanding of the financial statements and hence is permitted.
Accordingly for the above illustration, we would need to show the balances at the beginning of the earliest comparative period for the following notes to accounts only: Trade and other receivables, Trade and other payables and Financial risk management.
FRS1(10)(f)
FRS 1(39)
Add
ition
al Il
lust
ratio
ns

Illustrative Annual Report 2011 273
PwC Holdings Ltd and its Subsidiaries
Additional Illustrative Disclosures
Appendix 1 – Areas not relevant to PwC Holdings Ltd Group
Example 9: Related party disclosures under FRS 24 (Revised) (for annual periods beginning on or after 1 January 2011)
Extractsofnotestoaccounts1:
Government S, indirectly, owns 75% of Company’s outstanding shares. In addition to the related party information and transactions disclosed elsewhere in the financial statements, the Company’s significant transactions with Government S and other entities controlled, jointly controlled or significantly influenced by Government S include approximately 90% of power supply is derived from […..], a government controlled entity.
In addition, during the year ended December 2011 Government S has sold a piece of land to the Company for a total consideration of 400,000, settled partly in cash and partly on credit terms.
Loan equivalent to 60% of its purchase price is repayable in quarterly instalments over the next two years. Interest is charged on the loan at a rate of 2.15%, which is comparable to that charged on Company’s bank loans.
Guidance notes
Related party disclosures1. The disclosure is relevant for transactions among government related entities and the
Government.
Reference
Add
ition
al Il
lust
ratio
ns

274
PwC Holdings Ltd and its Subsidiaries
Additional Illustrative Disclosures
Appendix 2 – Critical accounting estimates, assumptions and judgements not relevant or material to PwC Holdings Ltd Group
Critical accounting estimates, assumptions and judgements
The following critical accounting estimates, assumptions and judgements may be applicable, among many other possible areas not presented in PwC Holdings Limited Group’s financial statements.
a) Useful lives of electrical component division’s plant and equipment
The costs of plant and equipment for the manufacture of electronic component parts are depreciated on a straight-line basis over the machineries’ useful lives. Management estimates the useful lives to be between 5 to 7 years, based on the estimated useful lives for similar machineries in the same industry and the projected life-cycles for its products. These estimates can change significantly as a result of expected usage or abandonment, technological innovations and competitors’ actions, leading to potential changes in future depreciation charges, impairment losses and/or write-offs.
If the actual useful lives of the technology division plant and equipment differ by 10% from management’s estimates, the carrying amount of the plant and equipment will be an estimated $1,000,000 higher or $970,000 lower.
(b) Post-employment pension obligations
The present value of the post-employment pension obligations depends on a number of factors that are determined on an actuarial basis using a number of assumptions. The assumptions used in determining the net cost (income) for pensions include the discount rate. Any changes in these assumptions will impact the carrying amount of pension obligations.
The Group determines the appropriate discount rate at the end of each year. This is the interest rate that should be used to determine the present value of estimated future cash outflows expected to be required to settle the pension obligations. In determining the appropriate discount rate, the Group considers the interest rates of high quality corporate bonds that are denominated in the currency in which the benefits will be paid, and have a tenure approximating the tenure of the related pension liability.
Other key assumptions for pension obligations are based in part on current market conditions.
If the discount rate used differs by 1% from management’s estimates, the carrying amount of pension obligations will be an estimated $425,000 lower or $450,000 higher.
Reference
FRS 1 (122,125)
Add
ition
al Il
lust
ratio
ns

Illustrative Annual Report 2011 275
PwC Holdings Ltd and its Subsidiaries
Additional Illustrative Disclosures
Appendix 2 – Critical accounting estimates, assumptions and judgements not relevant or material to PwC Holdings Ltd Group
Critical accounting estimates, assumptions and judgements (continued)
(c) Warranty claims
The Group gives two-year warranties for its personal computer products. Management estimates the related provision for future warranty claims based on historical warranty claim information, as well as recent trends that suggest that past cost information may differ from future claims.
Factors that could impact the estimated claim information include the success of the Group’s productivity and quality initiatives, as well as parts and labour costs.
If claims costs differ by 10% from management’s estimates, the warranty provisions will be an estimated $2,000,000 higher or $1,875,000 lower.
(d) Property, plant and equipment
The Group’s business is capital intensive and the annual depreciation of property, plant and equipment forms a significant component of total costs charged to profit or loss. The Group reviews the residual values and useful lives of property, plant and equipment at each reporting date in accordance with the accounting policy in Note 2.5. The estimation of the residual values and useful lives involves significant judgment. The net book value of property, plant and equipment at 31 December 2011 is $153.6 million and the annual depreciation charge for the financial year ended 31 December 2011 is $17.7 million.
If the actual useful lives of the property, plant and equipment are longer or shorter than the management’s estimate by one year on average, the Group’s annual depreciation charge will be reduced by $4.0 million and increased by $6.0 million respectively.
Reference
FRS 1 (122,125))
(e) Share-based compensation
The Group’s equity-settled, share-based compensation plan is significant and the amount of the employee services received in exchange for the grant of options recognised as an expense forms a significant component of total expenses charged to profit or loss. At each balance sheet date, the Group reviews and revises its estimates of the number of shares under options that are expected to become exercisable on the vesting date and recognises the impact of the revision of the estimates in profit or loss, with a corresponding adjustment to the share option reserve over the remaining vesting period.
If the actual number of shares under options that are expected to become exercisable on the vesting date differs by 10% from management’s estimates, total profit will be approximately $70,000 higher or lower.
Add
ition
al Il
lust
ratio
ns