adaptive traffic control
TRANSCRIPT
Table of Contents 1. Introduction .................................................................................................................................................... 2
2. Step-by-step guide to using the Optimizer spreadsheet ............................................................................... 2
2.1 Install the Program ................................................................................................................................... 2
2.2 Open the Optimizer Template .................................................................................................................. 2
2.3 Enter the Amino Acid Sequence of your Peptide ..................................................................................... 2
2.4 Generate the Peptide Product ................................................................................................................. 3
2.5 Perform the Viscosity/Mobility Measurement Experiment ....................................................................... 3
2.6 Analyze the Data ...................................................................................................................................... 5
2.7 Select the Best Operating Parameters .................................................................................................... 7
2.8 Test the Separation Conditions ................................................................................................................ 8
3. More about Measuring the Mobility and Viscosity ......................................................................................... 9
3.1 Troubleshooting Analysis of the Data .................................................................................................... 10
3.2 Example using only 4-sippers of a 12-sipper chip. ................................................................................ 12
3.3 Review the Viscosity/Mobility Measurement Results ............................................................................. 13
Appendix A: Mobility-Shift Assay Predictions Worksheet ................................................................................ 15
A.1 Selecting the Resolution ........................................................................................................................ 15
A.2 Troubleshooting Resolution Errors ........................................................................................................ 18
A.3 Interpreting the Input Data Table ........................................................................................................... 20
A.4 Interpreting the Output Data Table ........................................................................................................ 21
Appendix B: Mobility-Shift Calculator Worksheet ............................................................................................ 23
B.1 Definition of Output Values .................................................................................................................... 23
User Guide LabChip® EZ Reader
Optimizer tool for mobility shift assays
Determining the optimal separation conditions (voltage, pressure, and buffer sip time) for a mobility-shift assay
www.perkinelmer.com 2/24
1. Introduction
The Optimizer for mobility-shift assays is used to systematically determine the optimal separation conditions (of voltage, pressure, and buffer sip time) for a Mobility-Shift Assay. The Optimizer uses a mathematical model of the electrokinetic and pressure driven transport in the LabChip
® microfluidic devices to predict the
resolution of product and substrate peaks for any applied voltage and pressure.
You will use the follow steps to determine the best separation conditions:
1. Install the Optimizer spreadsheet. 2. Open the Optimizer_Template Microsoft
® Excel
® workbook.
3. Enter the amino acid sequence of your peptides. 4. Generate the product peptide. 5. Perform the parameter measuring experiment (to measure the peptide mobility, electroosmotic
flow, and buffer viscosity). 6. Use the Optimizer spreadsheet to determine the best separation conditions (pressure, voltage, and
sip times) required to achieve your desired throughput, data quality, and unattended run time. 7. Test the separation conditions.
Each step is described in more detail in the following section.
2. Step-by-step guide to using the Optimizer spreadsheet
2.1 Install the Program
To use the Optimizer Spreadsheet, you must have a computer with Windows® XP, Windows
® Vista, or
Windows® 7, and Microsoft
® Excel
® 2003 or higher (Security Level: Medium or Low) installed. Install the
Optimizer Spreadsheet by running ―Setup.exe‖ from the installation disk. Most of the program resides in a Microsoft
® Excel
® Add-in module that will be loaded and configured by the installer. See the Optimizer
Release Notes for more details.
2.2 Open the Optimizer Template
On the Windows Start menu, select ProgramsCaliper Life SciencesOptimizer.
Microsoft® Excel
® starts and a new workbook is created based on the Optimizer Template.
It is best to start with a new instance of the template workbook for each new assay and/or measurement, rather than reusing a workbook that has been used before. It is especially important to avoid reusing a workbook that has been modified.
2.3 Enter the Amino Acid Sequence of your Peptide
In the Microsoft® Excel
® spreadsheet, select the A Priori Estimates worksheet and describe the substrate
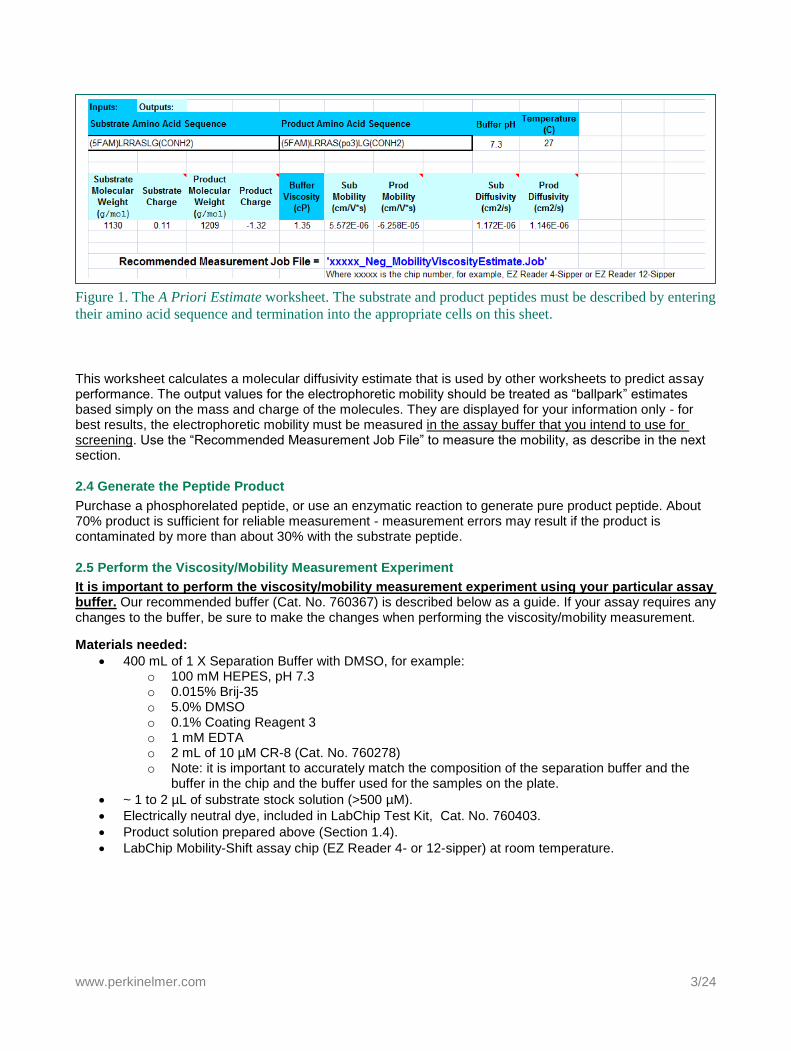
and product peptides by entering their amino acid sequence and termination method in the appropriate cells (see Error! Reference source not found.). To enter the sequence, use the single letter abbreviation for each amino acid. To enter a phosphate, enclose PO3 in parentheses, (PO3), as shown in the illustration in Figure 1.
www.perkinelmer.com 3/24
Figure 1. The A Priori Estimate worksheet. The substrate and product peptides must be described by entering
their amino acid sequence and termination into the appropriate cells on this sheet.
This worksheet calculates a molecular diffusivity estimate that is used by other worksheets to predict assay performance. The output values for the electrophoretic mobility should be treated as ―ballpark‖ estimates based simply on the mass and charge of the molecules. They are displayed for your information only - for best results, the electrophoretic mobility must be measured in the assay buffer that you intend to use for screening. Use the ―Recommended Measurement Job File‖ to measure the mobility, as describe in the next section.
2.4 Generate the Peptide Product
Purchase a phosphorelated peptide, or use an enzymatic reaction to generate pure product peptide. About 70% product is sufficient for reliable measurement - measurement errors may result if the product is contaminated by more than about 30% with the substrate peptide.
2.5 Perform the Viscosity/Mobility Measurement Experiment
It is important to perform the viscosity/mobility measurement experiment using your particular assay buffer. Our recommended buffer (Cat. No. 760367) is described below as a guide. If your assay requires any changes to the buffer, be sure to make the changes when performing the viscosity/mobility measurement.
Materials needed:
400 mL of 1 X Separation Buffer with DMSO, for example: o 100 mM HEPES, pH 7.3 o 0.015% Brij-35 o 5.0% DMSO o 0.1% Coating Reagent 3 o 1 mM EDTA o 2 mL of 10 µM CR-8 (Cat. No. 760278) o Note: it is important to accurately match the composition of the separation buffer and the
buffer in the chip and the buffer used for the samples on the plate.
~ 1 to 2 µL of substrate stock solution (>500 µM).
Electrically neutral dye, included in LabChip Test Kit, Cat. No. 760403.
Product solution prepared above (Section 1.4).
LabChip Mobility-Shift assay chip (EZ Reader 4- or 12-sipper) at room temperature.
www.perkinelmer.com 4/24
Procedure:
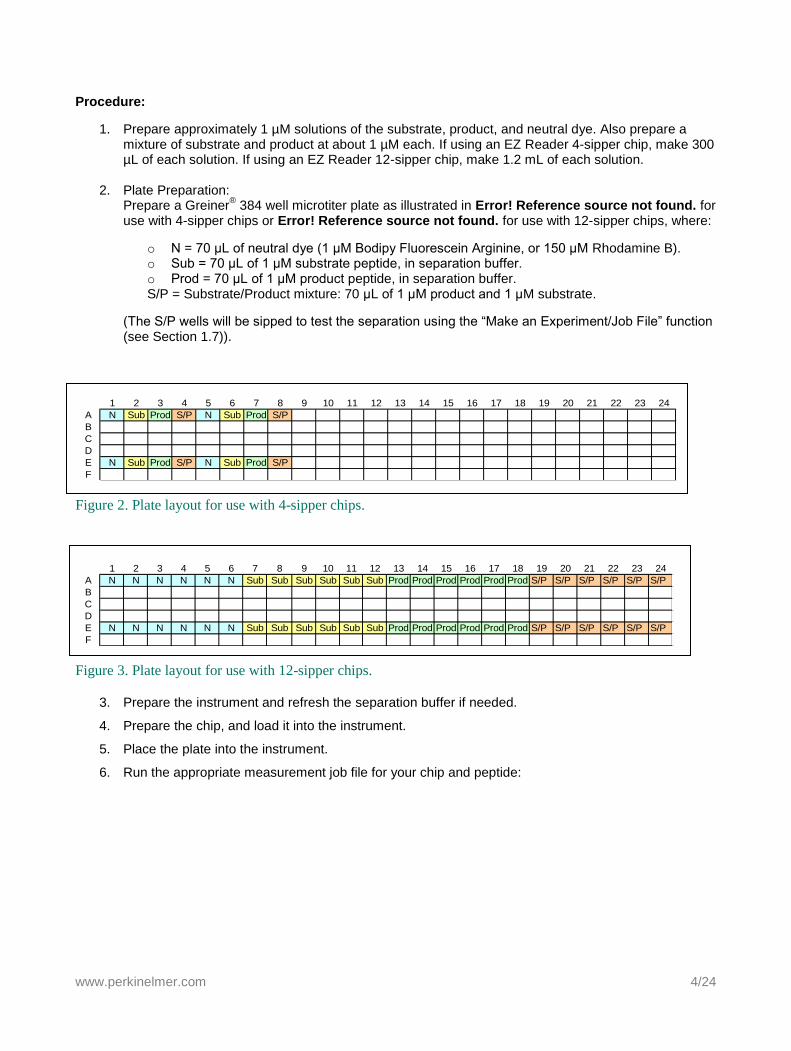
1. Prepare approximately 1 µM solutions of the substrate, product, and neutral dye. Also prepare a mixture of substrate and product at about 1 µM each. If using an EZ Reader 4-sipper chip, make 300 µL of each solution. If using an EZ Reader 12-sipper chip, make 1.2 mL of each solution.
2. Plate Preparation: Prepare a Greiner
® 384 well microtiter plate as illustrated in Error! Reference source not found. for
use with 4-sipper chips or Error! Reference source not found. for use with 12-sipper chips, where:
o N = 70 μL of neutral dye (1 μM Bodipy Fluorescein Arginine, or 150 μM Rhodamine B). o Sub = 70 μL of 1 μM substrate peptide, in separation buffer. o Prod = 70 μL of 1 μM product peptide, in separation buffer. S/P = Substrate/Product mixture: 70 μL of 1 μM product and 1 μM substrate.
(The S/P wells will be sipped to test the separation using the ―Make an Experiment/Job File‖ function (see Section 1.7)).
1 2 3 4 5 6 7 8 9 10 11 12 13 14 15 16 17 18 19 20 21 22 23 24
A N Sub Prod S/P N Sub Prod S/P
B
C
D
E N Sub Prod S/P N Sub Prod S/P
F
Figure 2. Plate layout for use with 4-sipper chips.
1 2 3 4 5 6 7 8 9 10 11 12 13 14 15 16 17 18 19 20 21 22 23 24
A N N N N N N Sub Sub Sub Sub Sub Sub Prod Prod Prod Prod Prod Prod S/P S/P S/P S/P S/P S/P
B
C
D
E N N N N N N Sub Sub Sub Sub Sub Sub Prod Prod Prod Prod Prod Prod S/P S/P S/P S/P S/P S/P
F
Figure 3. Plate layout for use with 12-sipper chips.
3. Prepare the instrument and refresh the separation buffer if needed.
4. Prepare the chip, and load it into the instrument.
5. Place the plate into the instrument.
6. Run the appropriate measurement job file for your chip and peptide:
www.perkinelmer.com 5/24
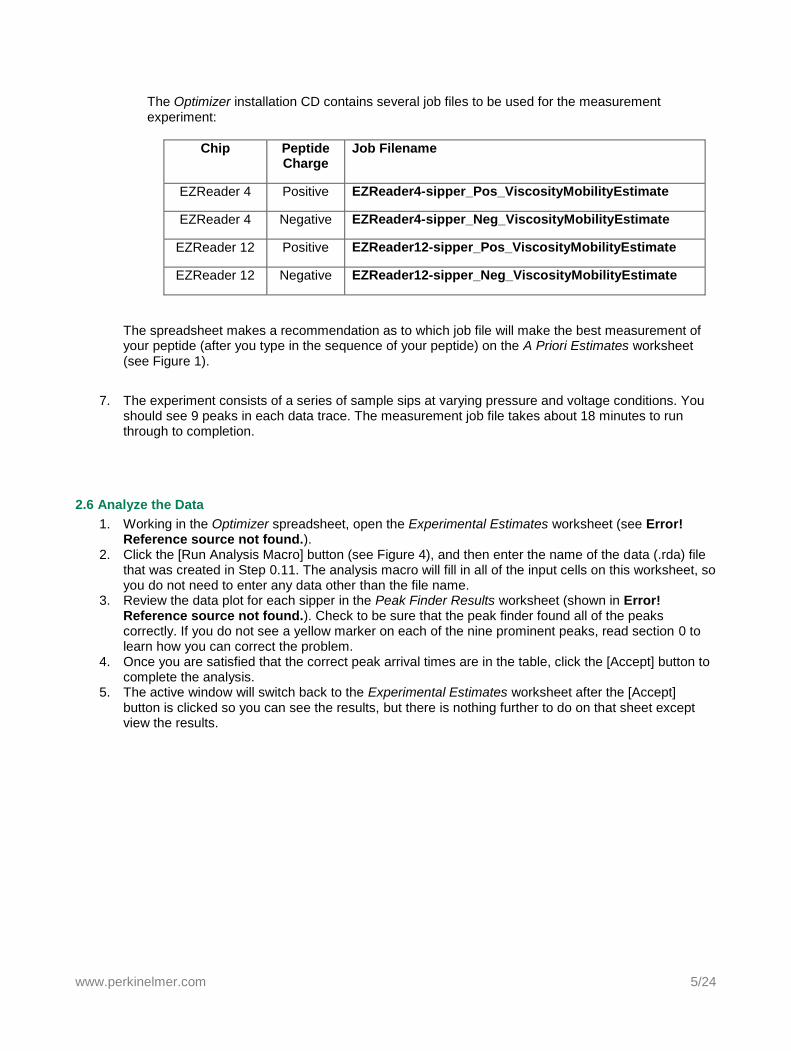
The Optimizer installation CD contains several job files to be used for the measurement experiment:
Chip Peptide Charge
Job Filename
EZReader 4 Positive EZReader4-sipper_Pos_ViscosityMobilityEstimate
EZReader 4 Negative EZReader4-sipper_Neg_ViscosityMobilityEstimate
EZReader 12 Positive EZReader12-sipper_Pos_ViscosityMobilityEstimate
EZReader 12 Negative EZReader12-sipper_Neg_ViscosityMobilityEstimate
The spreadsheet makes a recommendation as to which job file will make the best measurement of your peptide (after you type in the sequence of your peptide) on the A Priori Estimates worksheet (see Figure 1).
7. The experiment consists of a series of sample sips at varying pressure and voltage conditions. You should see 9 peaks in each data trace. The measurement job file takes about 18 minutes to run through to completion.
2.6 Analyze the Data
1. Working in the Optimizer spreadsheet, open the Experimental Estimates worksheet (see Error! Reference source not found.).
2. Click the [Run Analysis Macro] button (see Figure 4), and then enter the name of the data (.rda) file that was created in Step 0.11. The analysis macro will fill in all of the input cells on this worksheet, so you do not need to enter any data other than the file name.
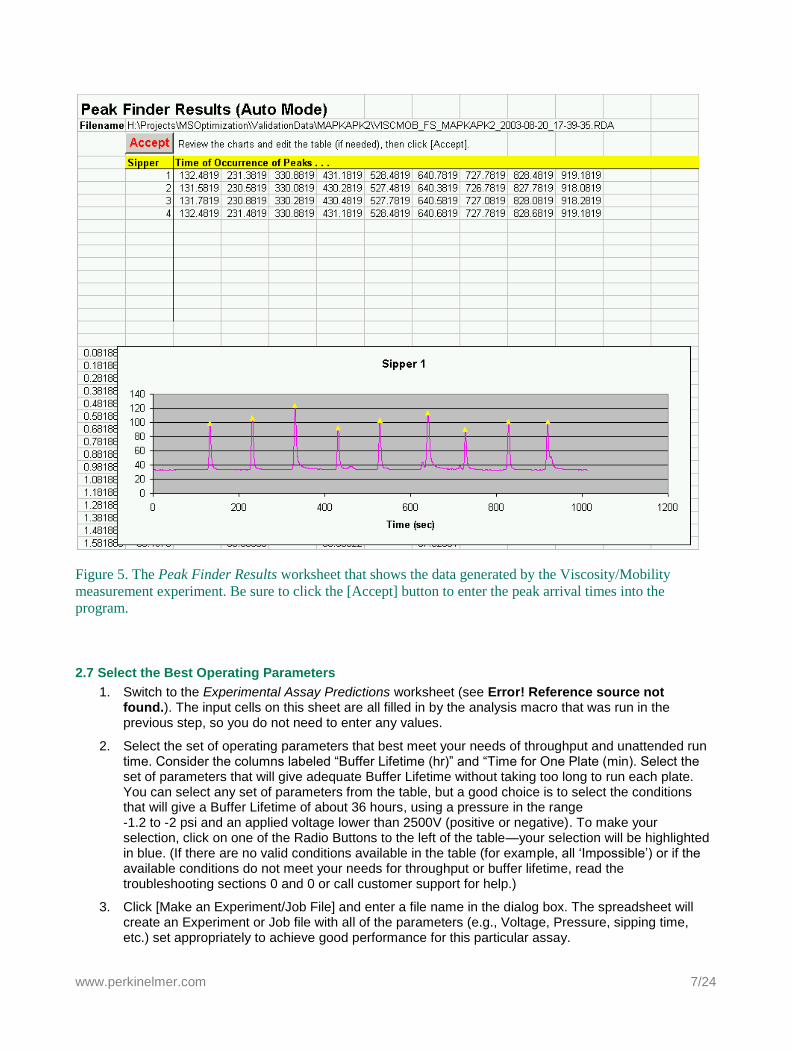
3. Review the data plot for each sipper in the Peak Finder Results worksheet (shown in Error! Reference source not found.). Check to be sure that the peak finder found all of the peaks correctly. If you do not see a yellow marker on each of the nine prominent peaks, read section 0 to learn how you can correct the problem.
4. Once you are satisfied that the correct peak arrival times are in the table, click the [Accept] button to complete the analysis.
5. The active window will switch back to the Experimental Estimates worksheet after the [Accept] button is clicked so you can see the results, but there is nothing further to do on that sheet except view the results.
www.perkinelmer.com 6/24
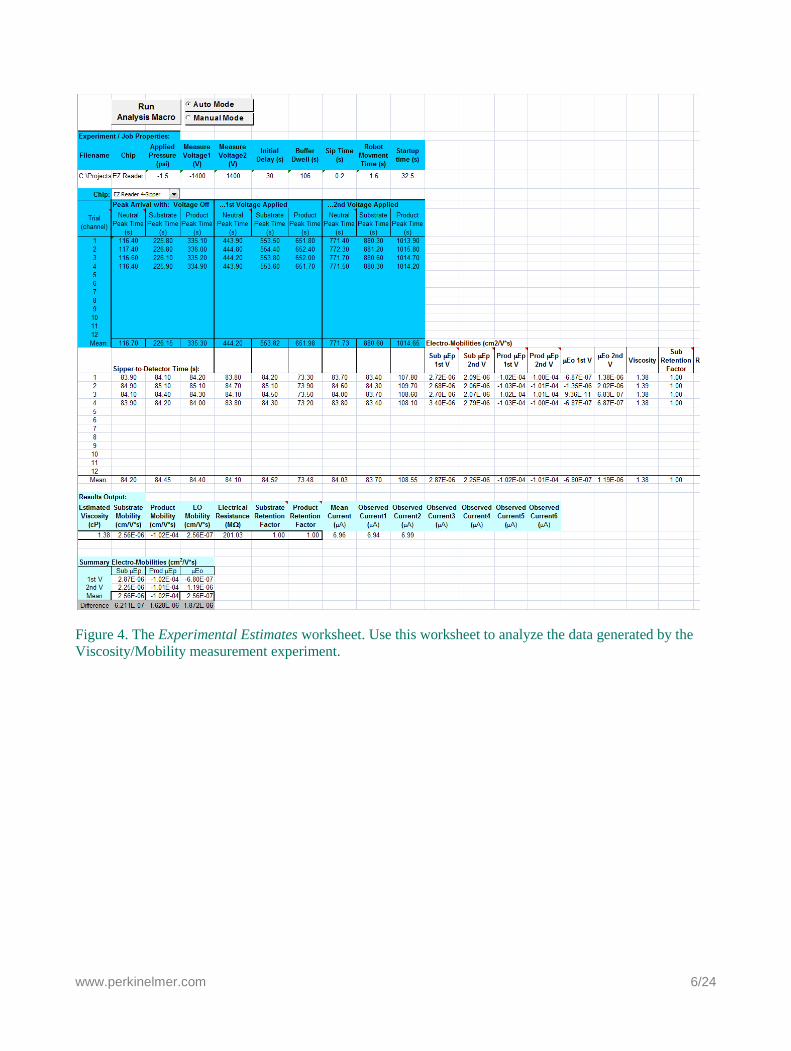
Figure 4. The Experimental Estimates worksheet. Use this worksheet to analyze the data generated by the
Viscosity/Mobility measurement experiment.
www.perkinelmer.com 7/24
Figure 5. The Peak Finder Results worksheet that shows the data generated by the Viscosity/Mobility
measurement experiment. Be sure to click the [Accept] button to enter the peak arrival times into the
program.
2.7 Select the Best Operating Parameters
1. Switch to the Experimental Assay Predictions worksheet (see Error! Reference source not found.). The input cells on this sheet are all filled in by the analysis macro that was run in the previous step, so you do not need to enter any values.
2. Select the set of operating parameters that best meet your needs of throughput and unattended run time. Consider the columns labeled ―Buffer Lifetime (hr)‖ and ―Time for One Plate (min). Select the set of parameters that will give adequate Buffer Lifetime without taking too long to run each plate. You can select any set of parameters from the table, but a good choice is to select the conditions that will give a Buffer Lifetime of about 36 hours, using a pressure in the range -1.2 to -2 psi and an applied voltage lower than 2500V (positive or negative). To make your selection, click on one of the Radio Buttons to the left of the table—your selection will be highlighted in blue. (If there are no valid conditions available in the table (for example, all ‗Impossible‘) or if the available conditions do not meet your needs for throughput or buffer lifetime, read the troubleshooting sections 0 and 0 or call customer support for help.)
3. Click [Make an Experiment/Job File] and enter a file name in the dialog box. The spreadsheet will create an Experiment or Job file with all of the parameters (e.g., Voltage, Pressure, sipping time, etc.) set appropriately to achieve good performance for this particular assay.

www.perkinelmer.com 8/24
Figure 6. A Typical Mobility-Shift Assay Prediction worksheet. Click the “radio button” at the left to select
the set of parameters that will give acceptable throughput (Time for One Plate) and Buffer Lifetime, and then
click [Make an Experiment/Job File].
2.8 Test the Separation Conditions
This step uses the mixture of product and substrate that was put on the plate during the measurement experiment setup (―S/P‖ in Figures 2 and 3), to test the separation conditions.
1. At the instrument, open the Job or Experiment file that was created in the previous step.
2. Set the Data Location and file naming convention as appropriate for your application, and save the file.
www.perkinelmer.com 9/24
3. With the same plate (previously used for the measurement experiment) on the plate tray, start the run. You can skip the preparation steps in the start wizard (or Setup wizard on EZ Reader instruments) since you have already completed them during the first part of the experiment.
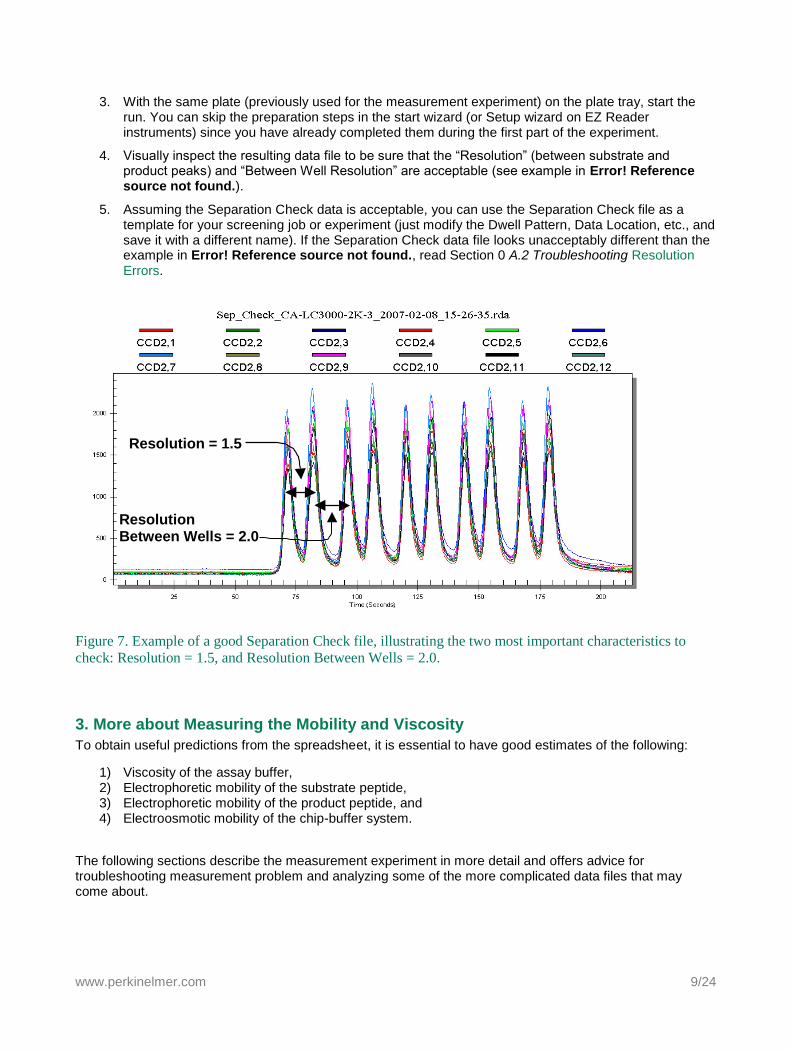
4. Visually inspect the resulting data file to be sure that the ―Resolution‖ (between substrate and product peaks) and ―Between Well Resolution‖ are acceptable (see example in Error! Reference source not found.).
5. Assuming the Separation Check data is acceptable, you can use the Separation Check file as a template for your screening job or experiment (just modify the Dwell Pattern, Data Location, etc., and save it with a different name). If the Separation Check data file looks unacceptably different than the example in Error! Reference source not found., read Section 0 A.2 Troubleshooting Resolution Errors.
Resolution = 1.5
Resolution Between Wells = 2.0
Figure 7. Example of a good Separation Check file, illustrating the two most important characteristics to
check: Resolution = 1.5, and Resolution Between Wells = 2.0.
3. More about Measuring the Mobility and Viscosity
To obtain useful predictions from the spreadsheet, it is essential to have good estimates of the following:
1) Viscosity of the assay buffer, 2) Electrophoretic mobility of the substrate peptide, 3) Electrophoretic mobility of the product peptide, and 4) Electroosmotic mobility of the chip-buffer system.
The following sections describe the measurement experiment in more detail and offers advice for troubleshooting measurement problem and analyzing some of the more complicated data files that may come about.
www.perkinelmer.com 10/24
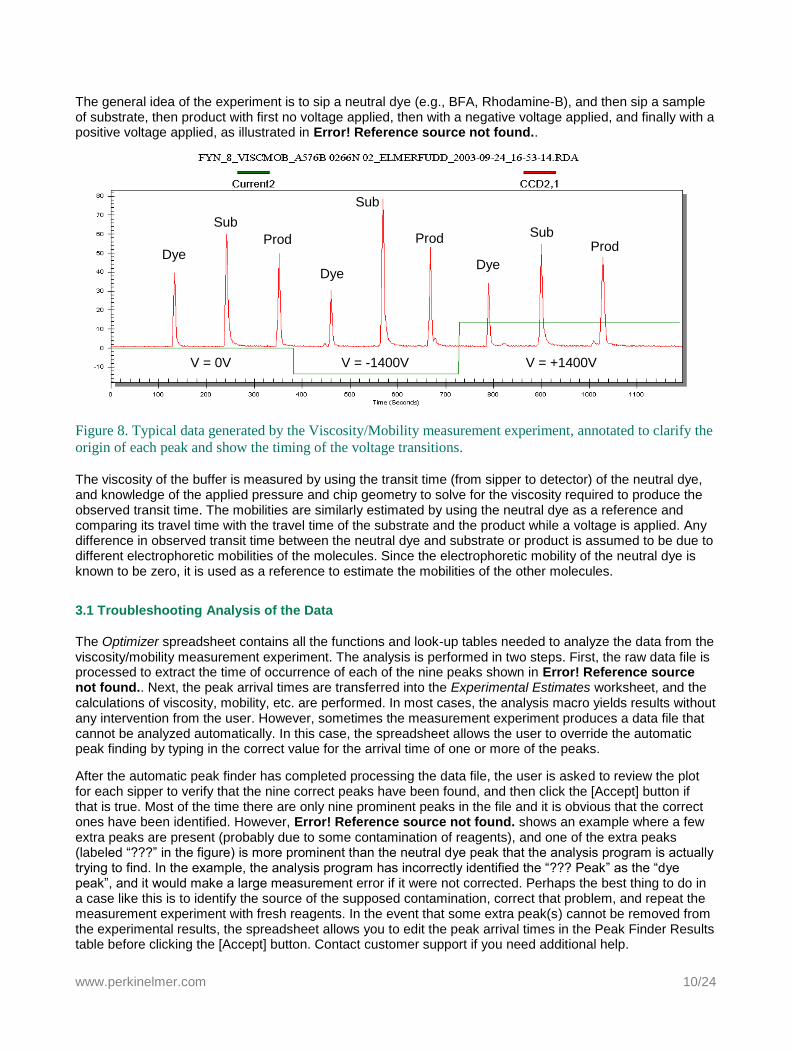
The general idea of the experiment is to sip a neutral dye (e.g., BFA, Rhodamine-B), and then sip a sample of substrate, then product with first no voltage applied, then with a negative voltage applied, and finally with a positive voltage applied, as illustrated in Error! Reference source not found..
Figure 8. Typical data generated by the Viscosity/Mobility measurement experiment, annotated to clarify the
origin of each peak and show the timing of the voltage transitions.
The viscosity of the buffer is measured by using the transit time (from sipper to detector) of the neutral dye, and knowledge of the applied pressure and chip geometry to solve for the viscosity required to produce the observed transit time. The mobilities are similarly estimated by using the neutral dye as a reference and comparing its travel time with the travel time of the substrate and the product while a voltage is applied. Any difference in observed transit time between the neutral dye and substrate or product is assumed to be due to different electrophoretic mobilities of the molecules. Since the electrophoretic mobility of the neutral dye is known to be zero, it is used as a reference to estimate the mobilities of the other molecules.
3.1 Troubleshooting Analysis of the Data
The Optimizer spreadsheet contains all the functions and look-up tables needed to analyze the data from the viscosity/mobility measurement experiment. The analysis is performed in two steps. First, the raw data file is processed to extract the time of occurrence of each of the nine peaks shown in Error! Reference source not found.. Next, the peak arrival times are transferred into the Experimental Estimates worksheet, and the calculations of viscosity, mobility, etc. are performed. In most cases, the analysis macro yields results without any intervention from the user. However, sometimes the measurement experiment produces a data file that cannot be analyzed automatically. In this case, the spreadsheet allows the user to override the automatic peak finding by typing in the correct value for the arrival time of one or more of the peaks.
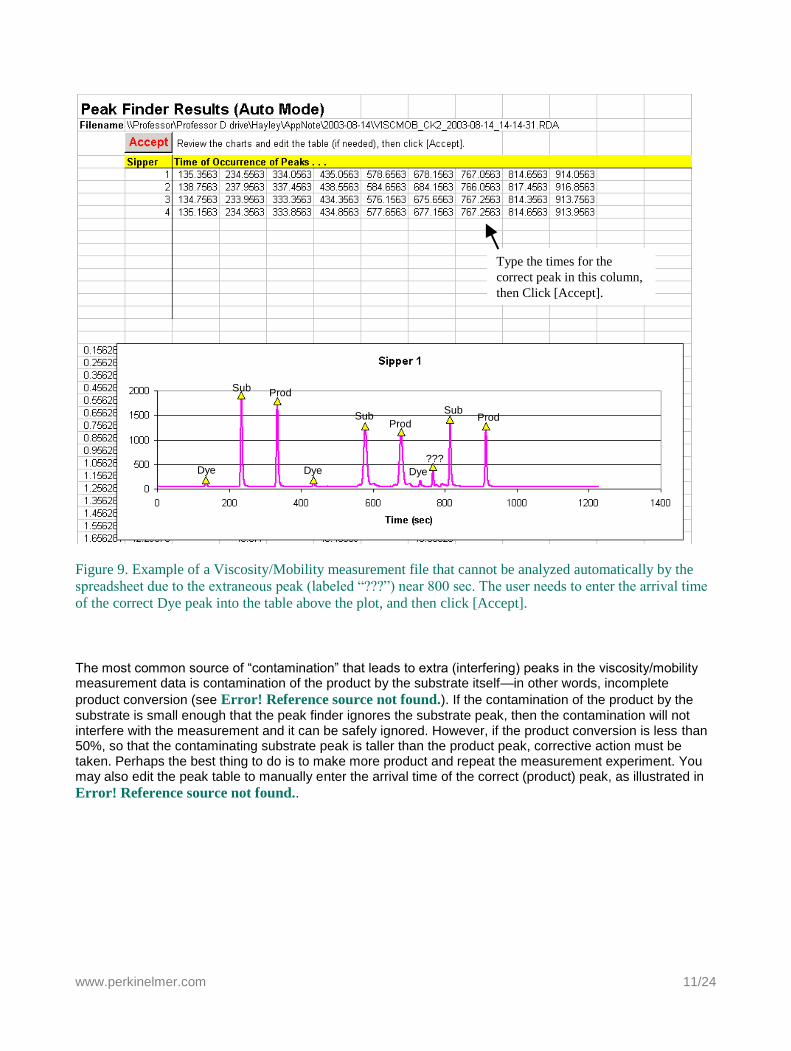
After the automatic peak finder has completed processing the data file, the user is asked to review the plot for each sipper to verify that the nine correct peaks have been found, and then click the [Accept] button if that is true. Most of the time there are only nine prominent peaks in the file and it is obvious that the correct ones have been identified. However, Error! Reference source not found. shows an example where a few extra peaks are present (probably due to some contamination of reagents), and one of the extra peaks (labeled ―???‖ in the figure) is more prominent than the neutral dye peak that the analysis program is actually trying to find. In the example, the analysis program has incorrectly identified the ―??? Peak‖ as the ―dye peak‖, and it would make a large measurement error if it were not corrected. Perhaps the best thing to do in a case like this is to identify the source of the supposed contamination, correct that problem, and repeat the measurement experiment with fresh reagents. In the event that some extra peak(s) cannot be removed from the experimental results, the spreadsheet allows you to edit the peak arrival times in the Peak Finder Results table before clicking the [Accept] button. Contact customer support if you need additional help.
V = 0V V = -1400V V = +1400V
Dye
Sub
Prod
Dye
Sub
Prod
Dye
SubProd
www.perkinelmer.com 11/24
Figure 9. Example of a Viscosity/Mobility measurement file that cannot be analyzed automatically by the
spreadsheet due to the extraneous peak (labeled “???”) near 800 sec. The user needs to enter the arrival time
of the correct Dye peak into the table above the plot, and then click [Accept].
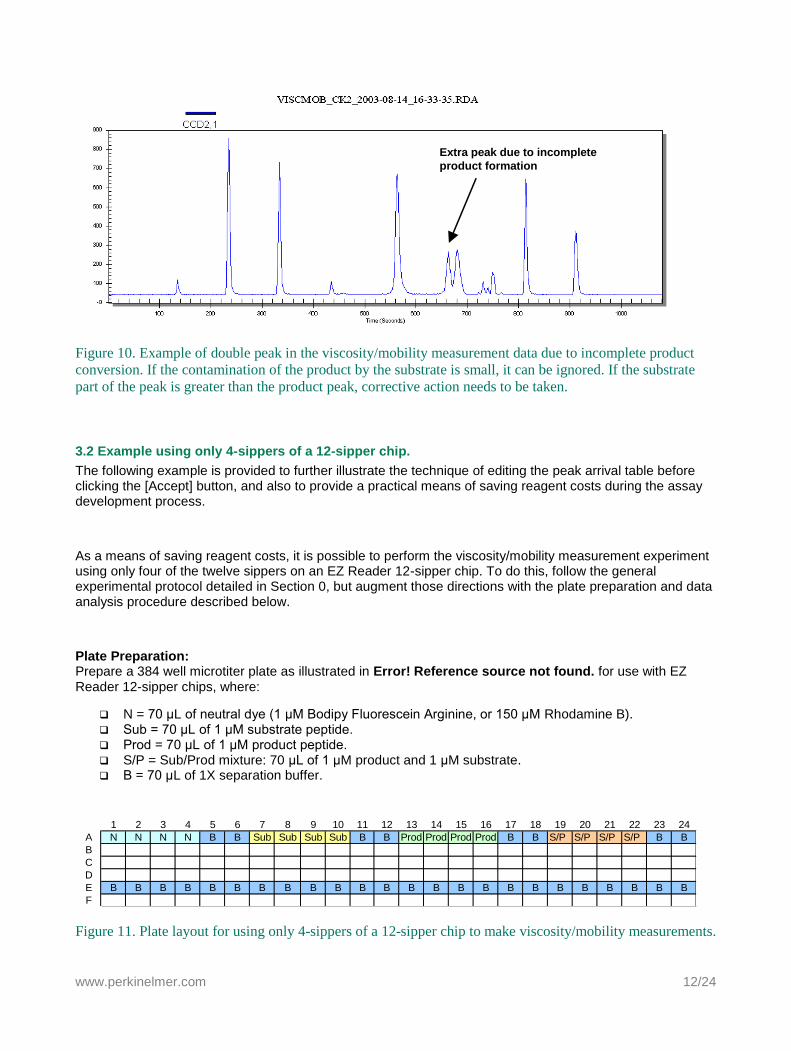
The most common source of ―contamination‖ that leads to extra (interfering) peaks in the viscosity/mobility measurement data is contamination of the product by the substrate itself—in other words, incomplete
product conversion (see Error! Reference source not found.). If the contamination of the product by the
substrate is small enough that the peak finder ignores the substrate peak, then the contamination will not interfere with the measurement and it can be safely ignored. However, if the product conversion is less than 50%, so that the contaminating substrate peak is taller than the product peak, corrective action must be taken. Perhaps the best thing to do is to make more product and repeat the measurement experiment. You may also edit the peak table to manually enter the arrival time of the correct (product) peak, as illustrated in
Error! Reference source not found..
Dye
Sub Prod
Dye
SubProd
Dye
SubProd
???
Type the times for the
correct peak in this column,
then Click [Accept].
www.perkinelmer.com 12/24
Figure 10. Example of double peak in the viscosity/mobility measurement data due to incomplete product
conversion. If the contamination of the product by the substrate is small, it can be ignored. If the substrate
part of the peak is greater than the product peak, corrective action needs to be taken.
3.2 Example using only 4-sippers of a 12-sipper chip.
The following example is provided to further illustrate the technique of editing the peak arrival table before clicking the [Accept] button, and also to provide a practical means of saving reagent costs during the assay development process.
As a means of saving reagent costs, it is possible to perform the viscosity/mobility measurement experiment using only four of the twelve sippers on an EZ Reader 12-sipper chip. To do this, follow the general experimental protocol detailed in Section 0, but augment those directions with the plate preparation and data analysis procedure described below.
Plate Preparation: Prepare a 384 well microtiter plate as illustrated in Error! Reference source not found. for use with EZ Reader 12-sipper chips, where:
N = 70 μL of neutral dye (1 μM Bodipy Fluorescein Arginine, or 150 μM Rhodamine B). Sub = 70 μL of 1 μM substrate peptide. Prod = 70 μL of 1 μM product peptide. S/P = Sub/Prod mixture: 70 μL of 1 μM product and 1 μM substrate. B = 70 μL of 1X separation buffer.
1 2 3 4 5 6 7 8 9 10 11 12 13 14 15 16 17 18 19 20 21 22 23 24
A N N N N B B Sub Sub Sub Sub B B Prod Prod Prod Prod B B S/P S/P S/P S/P B B
B
C
D
E B B B B B B B B B B B B B B B B B B B B B B B B
F
Figure 11. Plate layout for using only 4-sippers of a 12-sipper chip to make viscosity/mobility measurements.
Extra peak due to incomplete
product formation
www.perkinelmer.com 13/24
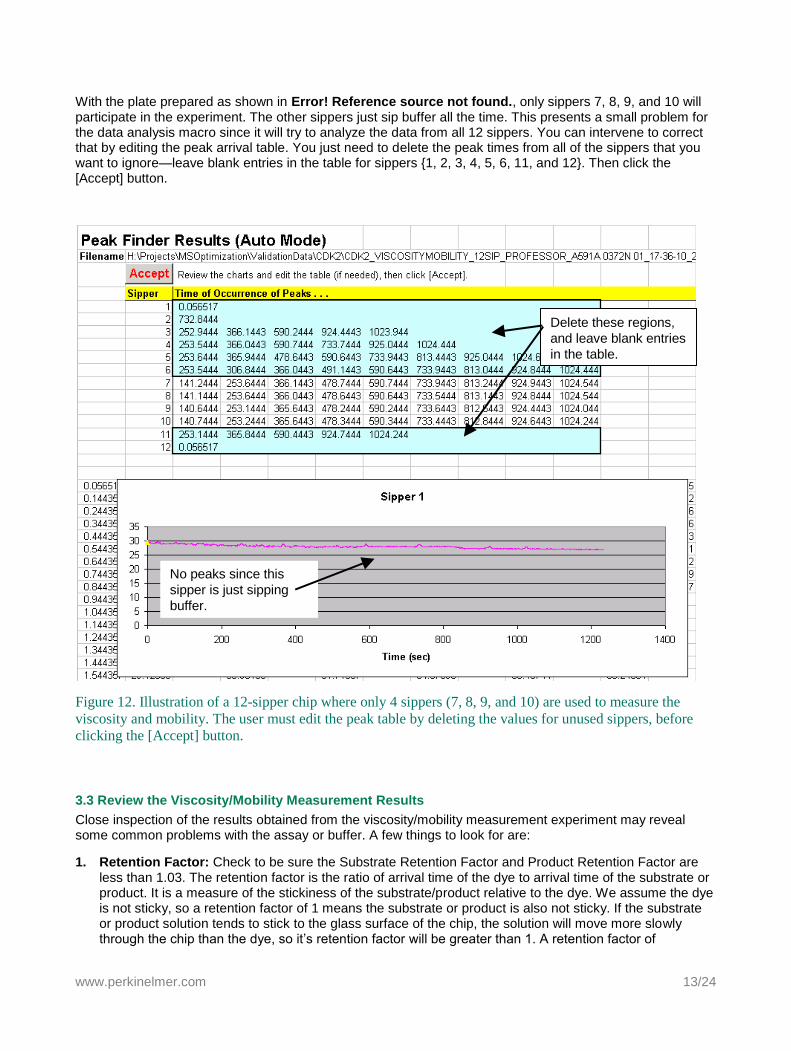
With the plate prepared as shown in Error! Reference source not found., only sippers 7, 8, 9, and 10 will participate in the experiment. The other sippers just sip buffer all the time. This presents a small problem for the data analysis macro since it will try to analyze the data from all 12 sippers. You can intervene to correct that by editing the peak arrival table. You just need to delete the peak times from all of the sippers that you want to ignore—leave blank entries in the table for sippers {1, 2, 3, 4, 5, 6, 11, and 12}. Then click the [Accept] button.
Figure 12. Illustration of a 12-sipper chip where only 4 sippers (7, 8, 9, and 10) are used to measure the
viscosity and mobility. The user must edit the peak table by deleting the values for unused sippers, before
clicking the [Accept] button.
3.3 Review the Viscosity/Mobility Measurement Results
Close inspection of the results obtained from the viscosity/mobility measurement experiment may reveal some common problems with the assay or buffer. A few things to look for are:
1. Retention Factor: Check to be sure the Substrate Retention Factor and Product Retention Factor are less than 1.03. The retention factor is the ratio of arrival time of the dye to arrival time of the substrate or product. It is a measure of the stickiness of the substrate/product relative to the dye. We assume the dye is not sticky, so a retention factor of 1 means the substrate or product is also not sticky. If the substrate or product solution tends to stick to the glass surface of the chip, the solution will move more slowly through the chip than the dye, so it‘s retention factor will be greater than 1. A retention factor of
No peaks since this
sipper is just sipping
buffer.
Delete these regions,
and leave blank entries
in the table.
www.perkinelmer.com 14/24
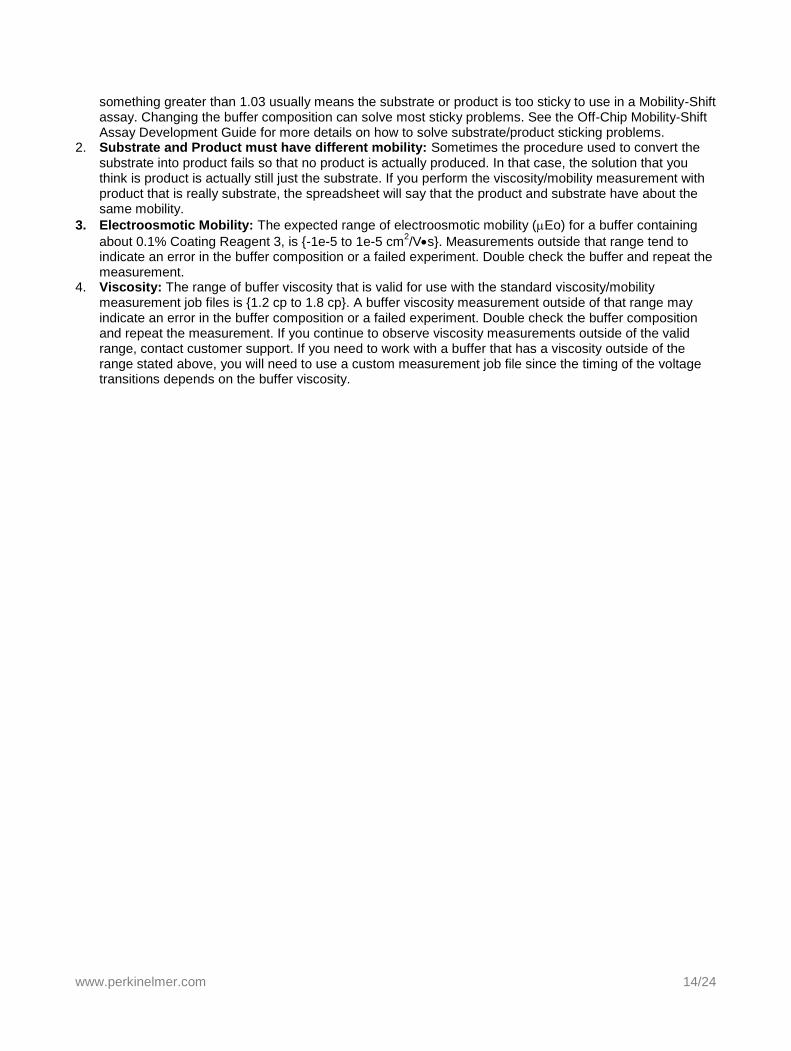
something greater than 1.03 usually means the substrate or product is too sticky to use in a Mobility-Shift assay. Changing the buffer composition can solve most sticky problems. See the Off-Chip Mobility-Shift Assay Development Guide for more details on how to solve substrate/product sticking problems.
2. Substrate and Product must have different mobility: Sometimes the procedure used to convert the substrate into product fails so that no product is actually produced. In that case, the solution that you think is product is actually still just the substrate. If you perform the viscosity/mobility measurement with product that is really substrate, the spreadsheet will say that the product and substrate have about the same mobility.
3. Electroosmotic Mobility: The expected range of electroosmotic mobility (Eo) for a buffer containing
about 0.1% Coating Reagent 3, is {-1e-5 to 1e-5 cm2/Vs}. Measurements outside that range tend to
indicate an error in the buffer composition or a failed experiment. Double check the buffer and repeat the measurement.
4. Viscosity: The range of buffer viscosity that is valid for use with the standard viscosity/mobility measurement job files is {1.2 cp to 1.8 cp}. A buffer viscosity measurement outside of that range may indicate an error in the buffer composition or a failed experiment. Double check the buffer composition and repeat the measurement. If you continue to observe viscosity measurements outside of the valid range, contact customer support. If you need to work with a buffer that has a viscosity outside of the range stated above, you will need to use a custom measurement job file since the timing of the voltage transitions depends on the buffer viscosity.
www.perkinelmer.com 15/24
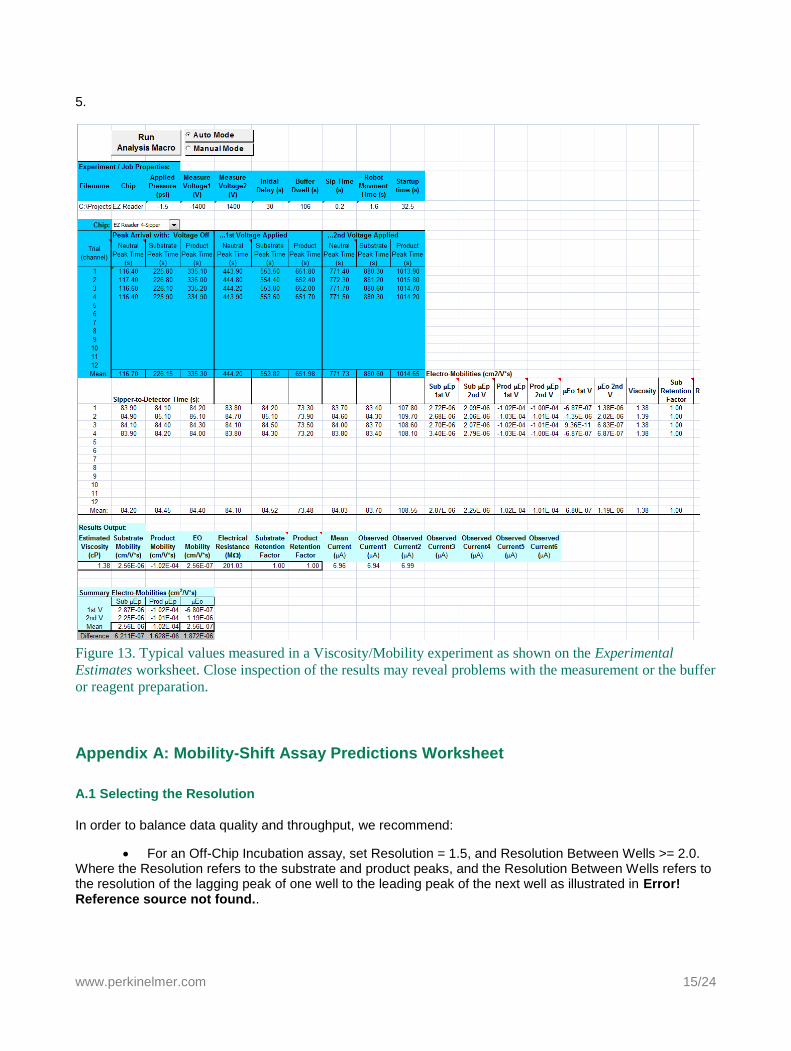
5.
Figure 13. Typical values measured in a Viscosity/Mobility experiment as shown on the Experimental
Estimates worksheet. Close inspection of the results may reveal problems with the measurement or the buffer
or reagent preparation.
Appendix A: Mobility-Shift Assay Predictions Worksheet
A.1 Selecting the Resolution
In order to balance data quality and throughput, we recommend:
For an Off-Chip Incubation assay, set Resolution = 1.5, and Resolution Between Wells >= 2.0. Where the Resolution refers to the substrate and product peaks, and the Resolution Between Wells refers to the resolution of the lagging peak of one well to the leading peak of the next well as illustrated in Error! Reference source not found..
www.perkinelmer.com 16/24
Resolution = 1.5
Resolution Between Wells = 2.0
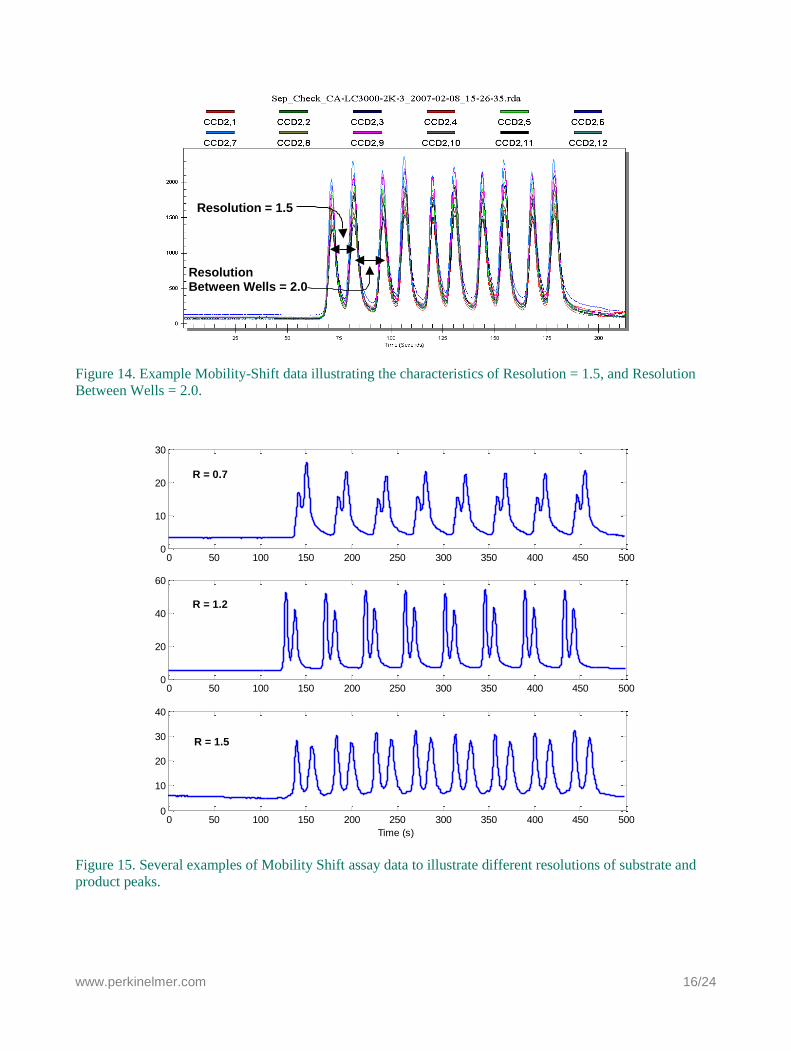
Figure 14. Example Mobility-Shift data illustrating the characteristics of Resolution = 1.5, and Resolution
Between Wells = 2.0.
Figure 15. Several examples of Mobility Shift assay data to illustrate different resolutions of substrate and
product peaks.
0 50 100 150 200 250 300 350 400 450 5000
10
20
30
0 50 100 150 200 250 300 350 400 450 5000
10
20
30
40
Time (s)
0 50 100 150 200 250 300 350 400 450 5000
20
40
60
R = 1.5
R = 0.7
R = 1.2
www.perkinelmer.com 17/24
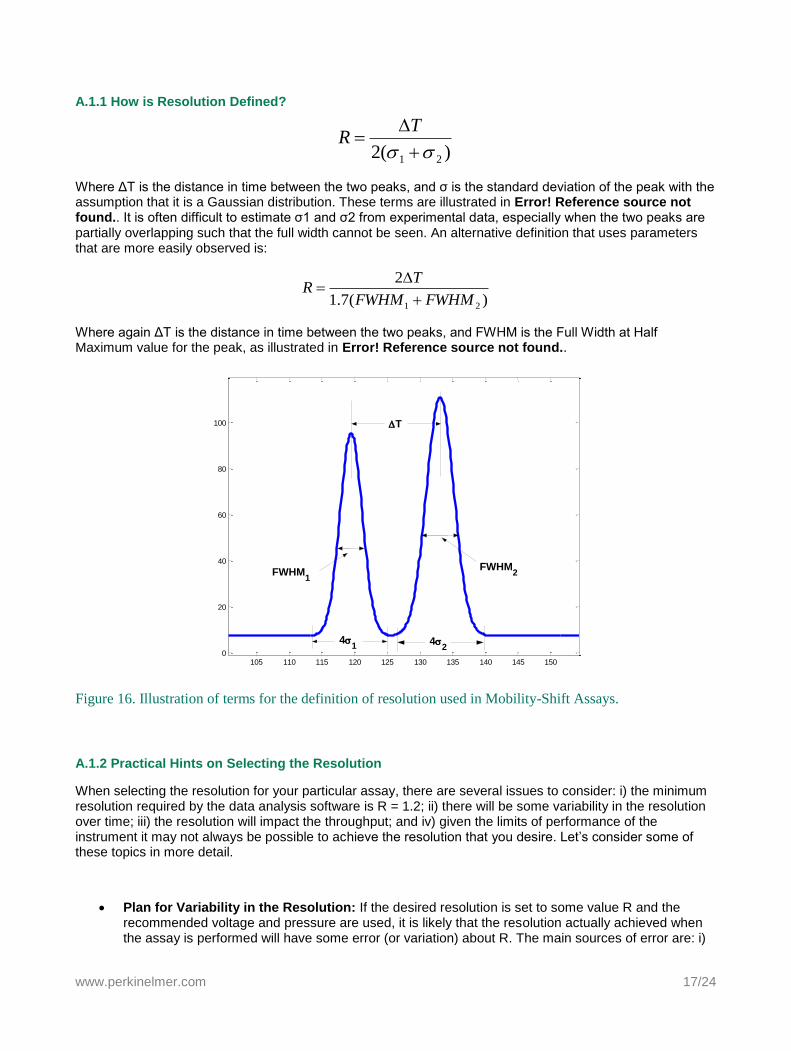
A.1.1 How is Resolution Defined?
Where ΔT is the distance in time between the two peaks, and σ is the standard deviation of the peak with the assumption that it is a Gaussian distribution. These terms are illustrated in Error! Reference source not found.. It is often difficult to estimate σ1 and σ2 from experimental data, especially when the two peaks are partially overlapping such that the full width cannot be seen. An alternative definition that uses parameters that are more easily observed is:
)(7.1
2
21 FWHMFWHM
TR
Where again ΔT is the distance in time between the two peaks, and FWHM is the Full Width at Half Maximum value for the peak, as illustrated in Error! Reference source not found..
Figure 16. Illustration of terms for the definition of resolution used in Mobility-Shift Assays.
A.1.2 Practical Hints on Selecting the Resolution
When selecting the resolution for your particular assay, there are several issues to consider: i) the minimum resolution required by the data analysis software is R = 1.2; ii) there will be some variability in the resolution over time; iii) the resolution will impact the throughput; and iv) given the limits of performance of the instrument it may not always be possible to achieve the resolution that you desire. Let‘s consider some of these topics in more detail.
Plan for Variability in the Resolution: If the desired resolution is set to some value R and the recommended voltage and pressure are used, it is likely that the resolution actually achieved when the assay is performed will have some error (or variation) about R. The main sources of error are: i)
)(2 21
TR
105 110 115 120 125 130 135 140 145 1500
20
40
60
80
100
41 4
2
T
FWHM1
FWHM2
www.perkinelmer.com 18/24
Variation in temperature (which will change the buffer viscosity); ii) Preparation of the reagents, iii) Change in pH of the buffer over time; iv) Normal manufacturing tolerances of the chips, and v) Measurement error when measuring the viscosity and mobility of the reagents. The assay developer should anticipate ±10% to ±20% variation in the resolution, depending on the degree of control that is placed on the sources of error. To make a robust assay that is insensitive to changes in the variables listed above, it is best to factor in some margin of safety when selecting the resolution. The assay developers here follow the convention of setting the Desired Resolution = 1.5 and the Resolution Between Wells >= 2.0. These values have been chosen since the lower limit on the resolution that our data analysis software can reliably process is R=1.2, and we want to allow for a ±20% worst case variation in the resolution from day-to-day (due to the combination of all error sources). By setting the desired Resolution =1.5, and the Resolution Between Wells >= 2.0, we allow the resolution to vary a little bit from day-to-day without affecting the results obtained from the data analysis software.
Choice of Resolution will Affect Throughput: Since the substrate and product are spatially separated inside the chip, we are required to sip buffer for some period of time between each sample, to ensure that adjacent samples do not interfere with each other. If the resolution of the substrate and product is small, their peaks will be close together so the required inter-sample buffer sipping time can be small. However, if the resolution is large, the substrate and product will be farther apart so the required buffer sipping time will be larger. In short, the price that must be paid for higher resolution is lower throughput, so it usually does not make sense to run an assay at a resolution greater than 1.5 unless you expect more than about +/-20% variation from run-to-run.
A.2 Troubleshooting Resolution Errors
Error! Reference source not found. shows several examples of Separation Check files produced by different assays (i.e., different peptides). Although the plots look somewhat different from each other, they are all considered acceptable, and the assays have all been used in successful screens. The differences in the plots are mainly due to the different mass and charge of the peptides, which causes more or less dispersion of the peaks, and, to a lesser extent due to small differences in the resolution of the peaks. If you produce a Separation Check file that is unacceptably different than the examples shown here, follow the steps listed below, to try to correct the problem.

www.perkinelmer.com 19/24
Figure 17. Examples of acceptable Separation Check files for several different assays: a = Fyn, b = CK2, c =
PRAK. The assays each have different shaped peaks due to differences in the mass and charge of the
peptides used. Even though they look somewhat different, they are all considered acceptable, and the assays
have given good performance.
What if I do not actually achieve the resolution that the spreadsheet predicts?
The most likely reason for errors in the predicted resolution is a poor estimate of the viscosity or mobility. Try some of the following things to improve the measurements:
1. Double check the Peak Finder Results worksheet looking for anomalies like extra peaks in the data signal that might have interfered with the analysis of the data (see Section 0 and Error! Reference source not found.).
2. Review the viscosity/mobility measurement results on the Experimental Estimates worksheet as described in Section 0 and Error! Reference source not found.. Look for things like incomplete product formation, sticky substrate/product, or viscosity outside of the expected range.
3. Be sure that the buffer you used for the viscosity/mobility measurement experiment is actually the same buffer that you are running the assay in. If you change any of the ingredients in the buffer, you must repeat the viscosity/mobility measurement experiment using the new buffer.
4. Control the Temperature: Viscosity and mobility are temperature dependent. Be sure that you perform the viscosity/mobility experiment at the same temperature as you run the assay. Be sure to allow the chip and buffer to reach the ambient temperature before performing the viscosity/mobility measurement.
5. Double check the Chip Type: Be sure that you perform the viscosity/mobility experiment using the same type of chip as you will use to run your assay. For example, if you want to run your assay using an EZ Reader 12-sipper chip, you must use an EZ Reader 12-sipper chip to perform the viscosity/mobility measurement experiment.
6. Just repeat the viscosity/mobility measurement experiment.
0 50 100 150 200 250 300 350 4000
20
40
0 50 100 150 200 2500
20
40
0 50 100 150 200 250 3000
200
400
Time (sec)
a)
b)
c)
www.perkinelmer.com 20/24
7. If after considering the things listed above, you still observe poor separation of peaks in the Separation Check file, contact customer support for advice. Be prepared to email us a copy of the spreadsheet you are using and the data file produced by your viscosity/mobility measurement experiment.
A.3 Interpreting the Input Data Table
Definitions of the input data table on the Experimental Assay Predictions worksheet:
Chip – Use the drop down menu to select the type of chip that you will use for your assay. For any particular assay, the best operating conditions of voltage, pressure, and Buffer Dwell will, in general, be different for each chip type.
Viscosity – The viscosity of the assay buffer in centi-poise (cp). The user may type in any value for a hypothetical simulation; however, to obtain useful predictions of operating parameters for a particular assay, the viscosity must be measured using the viscosity/mobility experiment described in Section 1.5
Substrate/Product Electrophoretic Mobility – When placed within an electric field, an electrically charged solute will migrate through a buffer with an electrophoretic velocity UEP = μEPE (cm/s). Where μEP is the electrophoretic mobility and E is the applied electric field. Separation is achieved because the substrate and product migrate through the chip at different velocities. The user may type in any value for the substrate and product electrophoretic mobility to perform a hypothetical simulation, however, for best results when developing an assay for a particular substrate and product peptide, the electrophoretic mobility must be measured using the viscosity/mobility estimate experiment described in Section 0.
Electroosmotic mobility – When an electric field is applied across the LabChip‘s separation channel, the buffer will be set in motion with a velocity UEo = μEoE (cm/s). Where μEo is the electroosmotic mobility and E is the applied electric field. The user may type in any value for a hypothetical simulation, however, to obtain useful predictions of operating parameters for a particular assay, the electroosmotic mobility must be measured using the viscosity/mobility experiment described in Section 0.
Substrate/Product Molecular Diffusivity – The molecular diffusivity coefficient is used by the spreadsheet to predict the amount of spreading (or widening) the sipped samples will experience as they pass through the chip. Short peptides typically have a molecular diffusivity value of about 1x10
-6 cm
2/s. The user may type in
any value for the substrate and product molecular diffusivity, however, for best results when developing an assay for a particular substrate and product peptide use the ―A Priori Estimates‖ worksheet to estimate the values based on the amino acid sequence as described in Section Error! Reference source not found..
pH – pH of the buffer. This information is needed for the buffer lifetime calculation.
[Buffer1,2,3] – Concentration of buffering species (needed for the buffer lifetime calculation). The user may provide values for up to three buffering components in the buffer.
www.perkinelmer.com 21/24
pK1,2,3 – pK values for up to three buffering components (needed for the buffer lifetime calculation).
Resistance of Separation Circuit –The electrical resistance of the chip‘s separation circuit. The resistance is a function of the chip geometry as well as the conductivity of the buffer. This value is measured as part of the viscosity/mobility measurement experiment.
Robot Movement Time – This is the "Travel Time" stated in the RDA file divided by 2 (since the RDA file states the "round trip robot travel time). The Robot Movement Time is measured as part of the viscosity/mobility measurement experiment. It is typically about 1.5 seconds.
Sample Sip Time – The ―Sample Dwell‖ time as set in the instrument Experiment/Job file (typically 0.2 sec. for a Mobility-Shift assay).
A.4 Interpreting the Output Data Table
Definitions of the output data table on the Experimental Assay Predictions worksheet:
Voltage - The voltage values listed in the output table are the difference of potential to be applied between the upstream electrode well and the downstream electrode well. Where the positive voltage is defined as the one that will propel a positive charge from the entrance of the separation channel toward the detector. Therefore, with a positive voltage applied, the upstream electrode will be positive with respect to the downstream electrode.
If the desired resolution cannot be achieved by applying a voltage within its search range, the function that solves for the voltage returns ―Impossible‖, meaning it is impossible to achieve to desired resolution. The function that solves for the voltage searches within the range of 200V to POSITIVE_VMAX and –200V to NEGATIVE_VMAX. Where, POSITIVE_VMAX is equal to the highest voltage that can be applied without producing a total loss of the charged species to the Upstream Electrode, or ABSOLUTE_VMAX whichever is smaller. NEGATIVE_VMAX is equal to the largest negative voltage that can be applied without producing a total loss of the charged species to the Upstream Electrode, or - ABSOLUTE_VMAX whichever has the smaller magnitude. Where ABSOLUTE_VMAX is the maximum value that can be produced by the power supply. By limiting the search range in this way, the spreadsheet avoids recommending a voltage that is outside the limits of performance of the instrument or that would produce a loss of the substrate or product to the upstream electrode well.
Post Sample Buffer Sip Time - The length of time required for the instrument to sip buffer between each sample to produce desired "Resolution Between Wells". The Resolution Between Wells is defined as the resolution of the lagging peak of one well to the leading peak of the next well. You need to consider the Resolution Between Wells to ensure that adjacent samples will not interfere with each other. The Post Sample Buffer Sip Time is a parameter that must be set in the instrument Experiment/Job file.
www.perkinelmer.com 22/24
Post Dye Buffer Sip Time – The length of time required for the instrument to sip buffer after each row marker (dye) so that the row marker does not interfere with the first sample of the row. This is another parameter that must be set in the instrument Experiment/Job file.
Final Delay – The length of time required for the instrument to sip buffer at the end of a plate, so that the last sample sipped (usually a row marker) has enough time to flow through the chip, past the detector and allow the signal to return to baseline before the instrument stops recording data. The Final Delay is a parameter that must be set in the instrument Experiment/Job File.
Time for One Plate – Approximate time required to run one 384 well plate. This calculation accounts for the Sample Sipping Time; Post Sample Buffer Sipping Time, Robot Movement Time, Row Marker Sipping Time, and the Final Delay; and it adjusts the time appropriately depending on the type of chip (4-sipper, 12-sipper, etc).
Peak Order – The order in which the substrate and product peaks will appear in the output data file from the instrument: Product First or Substrate First. This information is provided to make it more convenient for the user to set the Peak Order in the data analysis software.
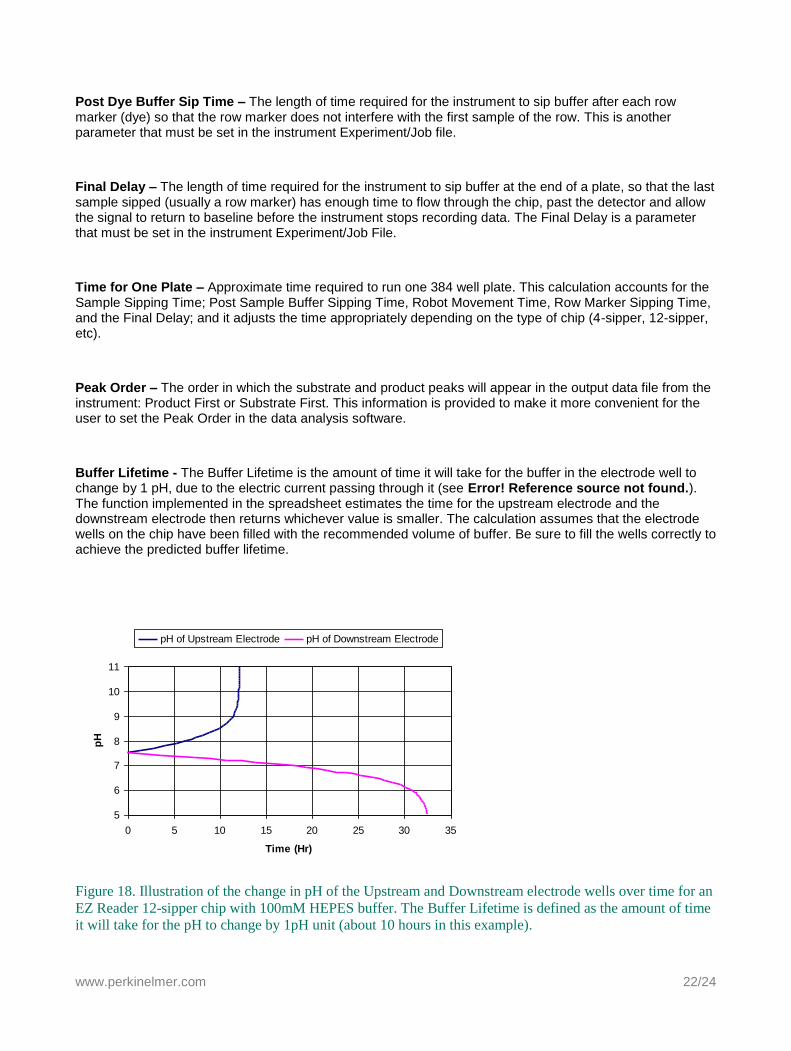
Buffer Lifetime - The Buffer Lifetime is the amount of time it will take for the buffer in the electrode well to change by 1 pH, due to the electric current passing through it (see Error! Reference source not found.). The function implemented in the spreadsheet estimates the time for the upstream electrode and the downstream electrode then returns whichever value is smaller. The calculation assumes that the electrode wells on the chip have been filled with the recommended volume of buffer. Be sure to fill the wells correctly to achieve the predicted buffer lifetime.
Figure 18. Illustration of the change in pH of the Upstream and Downstream electrode wells over time for an
EZ Reader 12-sipper chip with 100mM HEPES buffer. The Buffer Lifetime is defined as the amount of time
it will take for the pH to change by 1pH unit (about 10 hours in this example).
5
6
7
8
9
10
11
0 5 10 15 20 25 30 35
Time (Hr)
pH
pH of Upstream Electrode pH of Downstream Electrode
www.perkinelmer.com 23/24
Appendix B: Mobility-Shift Calculator Worksheet
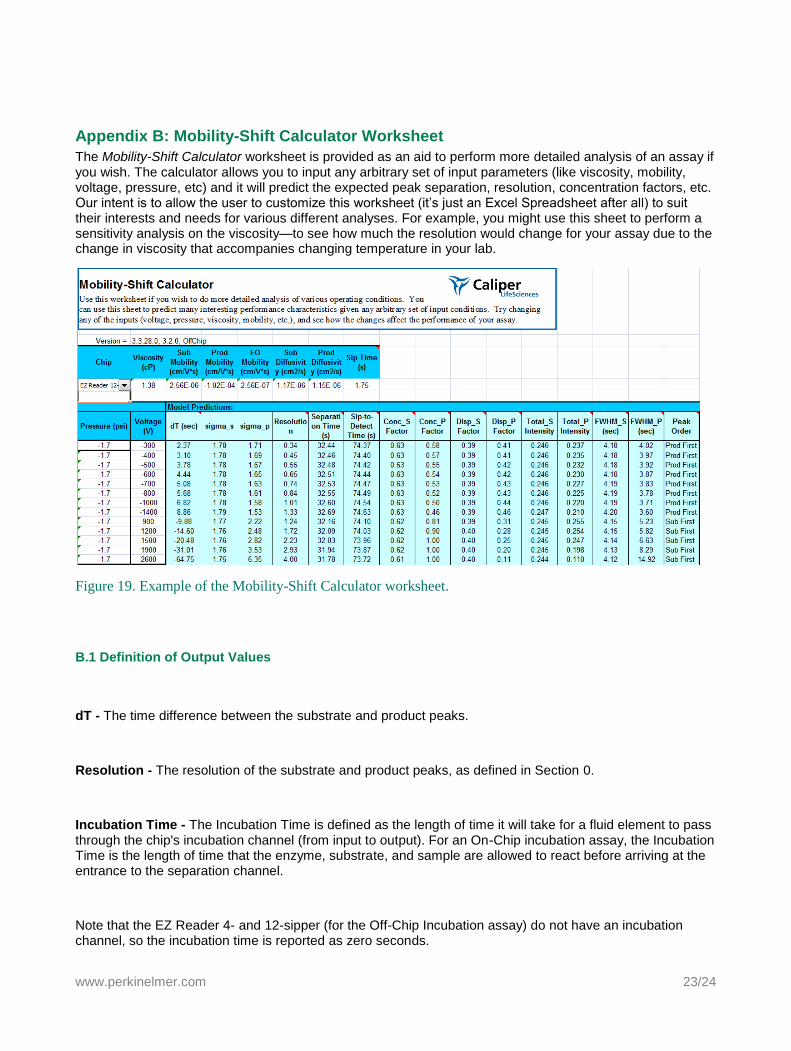
The Mobility-Shift Calculator worksheet is provided as an aid to perform more detailed analysis of an assay if you wish. The calculator allows you to input any arbitrary set of input parameters (like viscosity, mobility, voltage, pressure, etc) and it will predict the expected peak separation, resolution, concentration factors, etc. Our intent is to allow the user to customize this worksheet (it‘s just an Excel Spreadsheet after all) to suit their interests and needs for various different analyses. For example, you might use this sheet to perform a sensitivity analysis on the viscosity—to see how much the resolution would change for your assay due to the change in viscosity that accompanies changing temperature in your lab.
Figure 19. Example of the Mobility-Shift Calculator worksheet.
B.1 Definition of Output Values
dT - The time difference between the substrate and product peaks.
Resolution - The resolution of the substrate and product peaks, as defined in Section 0.
Incubation Time - The Incubation Time is defined as the length of time it will take for a fluid element to pass through the chip's incubation channel (from input to output). For an On-Chip incubation assay, the Incubation Time is the length of time that the enzyme, substrate, and sample are allowed to react before arriving at the entrance to the separation channel.
Note that the EZ Reader 4- and 12-sipper (for the Off-Chip Incubation assay) do not have an incubation channel, so the incubation time is reported as zero seconds.
www.perkinelmer.com 24/24
Separation Time - The Separation Time is defined as the average length of time it will take for a Substrate molecule to travel the length of the separation channel, at the given voltage and pressure. This calculation includes the effects of the pressure driven flow, electroosmotic flow, and electrophoretic mobility of the substrate molecules.
Sip-toDetect Time - The average length of time it will take for a Substrate molecule to travel from the tip of the sipper to the detector, at the given voltage and pressure.
Substrate (Product) Concentration Factor - If the concentration of substrate is 1 just before entering the separation channel, the concentration will be Conc_S (Conc_P) at the detector.
A change of concentration may occur due to dilution by Electroosmotic Flow entering from the Upstream Electrode channel and/or due to a change in velocity of the species as it enters the separation channel (recall that velocity and concentration are inversely related by the principle of conservation of mass flux).
Substrate (Product) Dispersion Factor: Disp_S (Disp_P) - Predicts the normalized peak magnitude of a short sipped slug which has been spread by dispersion due to the pressure driven flow, as the slug has travels through the chip from sipper-to-detector. If there were no dispersion, the dispersion factor would be 1.
Full Width at Half Maximum - The width of the substrate (product) peak at half of its maximum height.
Peak Order - The order in which the substrate and product peaks will appear in the output data file when the assay is run: Product First or Substrate First. This will help identify which peak is the product and which peak is the substrate as observed in the data file.
PerkinElmer, Inc. 940 Winter Street Waltham, MA 02451 USA P: (800) 762-4000 or (+1) 203-925-4602 www.perkinelmer.com
For a complete listing of our global offices, visit www.perkinelmer.com/ContactUs Copyright ©2012, PerkinElmer, Inc. All rights reserved. PerkinElmer® is a registered trademark of PerkinElmer, Inc. All other trademarks are the property of their respective owners. Version created 26 June 2012.