2010 updated adaptive traffic control systems in the united...
TRANSCRIPT
MATT SELINGER, P.E., PTOE
LUKE SCHMIDT
SEPTEMBER 2010
Adaptive Traffic Control Systems in the United States:
Updated Summary and Comparison
The number of adaptive traffic control systems installed and operating in the U.S. has exploded in the last two years. Prior to 2008 there were only 38 adaptive systems known to have ever been in operation. Of these, almost half have been abandoned or removed from operation. Since 2008-2009, there has been a renewed interest in adaptive traffic control. HDR conducted a survey in 2009 to assess the historical experience in the U.S. with regards adaptive traffic control systems. Based on the significant changes occurring in 2009, HDR conducted a follow up survey in the summer of 2010 to assess the technologies that had seen rapid deployment. This paper is a summary of the findings from this updated survey. It also examines the operational benefits of these systems based on the latest before- and after-studies.

TABLE OF CONTENTSIntroduction . . . . . . . . . . . . . . . . . . . . . . . . . . . . . . . . . . . . . . . . . . . . . . . . . . . . . . . . . . . . . . . . . . . . . . . 1
2009 RESEARCH AND REPORT � � � � � � � � � � � � � � � � � � � � � � � � � � � � � � � � � � � � � � � � � � � � � � � � � � � � � � � � � � � � � � � � � 1
NEW SYSTEMS SURVEYED � � � � � � � � � � � � � � � � � � � � � � � � � � � � � � � � � � � � � � � � � � � � � � � � � � � � � � � � � � � � � � � � � � � � � 1
OPERATIONS � � � � � � � � � � � � � � � � � � � � � � � � � � � � � � � � � � � � � � � � � � � � � � � � � � � � � � � � � � � � � � � � � � � � � � � � � � � � � � � � � � 2
REFINED SYSTEMS COMPARISON � � � � � � � � � � � � � � � � � � � � � � � � � � � � � � � � � � � � � � � � � � � � � � � � � � � � � � � � � � � � � � 2
REFINED DEFINITION OF ADAPTIVE � � � � � � � � � � � � � � � � � � � � � � � � � � � � � � � � � � � � � � � � � � � � � � � � � � � � � � � � � � � � 3
2010 Survey . . . . . . . . . . . . . . . . . . . . . . . . . . . . . . . . . . . . . . . . . . . . . . . . . . . . . . . . . . . . . . . . . . . . . . . 3
LA ATCS and InSync . . . . . . . . . . . . . . . . . . . . . . . . . . . . . . . . . . . . . . . . . . . . . . . . . . . . . . . . . . . . . . . . . 5COST � � � � � � � � � � � � � � � � � � � � � � � � � � � � � � � � � � � � � � � � � � � � � � � � � � � � � � � � � � � � � � � � � � � � � � � � � � � � � � � � � � � � � � � � � � 5
DOWNTIME AND RELIABILITY � � � � � � � � � � � � � � � � � � � � � � � � � � � � � � � � � � � � � � � � � � � � � � � � � � � � � � � � � � � � � � � � � � 6
OPERATIONAL OBJECTIVES � � � � � � � � � � � � � � � � � � � � � � � � � � � � � � � � � � � � � � � � � � � � � � � � � � � � � � � � � � � � � � � � � � � � 7
MAINTENANCE � � � � � � � � � � � � � � � � � � � � � � � � � � � � � � � � � � � � � � � � � � � � � � � � � � � � � � � � � � � � � � � � � � � � � � � � � � � � � � � � 9
OTHER SURVEY QUESTIONS � � � � � � � � � � � � � � � � � � � � � � � � � � � � � � � � � � � � � � � � � � � � � � � � � � � � � � � � � � � � � � � � � � � 9
ACS-Lite Update . . . . . . . . . . . . . . . . . . . . . . . . . . . . . . . . . . . . . . . . . . . . . . . . . . . . . . . . . . . . . . . . . . 10
Operations . . . . . . . . . . . . . . . . . . . . . . . . . . . . . . . . . . . . . . . . . . . . . . . . . . . . . . . . . . . . . . . . . . . . . . . 12CONCURRENCE � � � � � � � � � � � � � � � � � � � � � � � � � � � � � � � � � � � � � � � � � � � � � � � � � � � � � � � � � � � � � � � � � � � � � � � � � � � � � � � 13
Refined Systems Comparison . . . . . . . . . . . . . . . . . . . . . . . . . . . . . . . . . . . . . . . . . . . . . . . . . . . . . . . 15COST � � � � � � � � � � � � � � � � � � � � � � � � � � � � � � � � � � � � � � � � � � � � � � � � � � � � � � � � � � � � � � � � � � � � � � � � � � � � � � � � � � � � � � � � � 15
INSTALLATION AND FINE TUNING � � � � � � � � � � � � � � � � � � � � � � � � � � � � � � � � � � � � � � � � � � � � � � � � � � � � � � � � � � � � � 16
MAINTENANCE, DOWNTIME, AND RELIABILITY ISSUES � � � � � � � � � � � � � � � � � � � � � � � � � � � � � � � � � � � � � � � � 17
HINDSIGHT QUESTION � � � � � � � � � � � � � � � � � � � � � � � � � � � � � � � � � � � � � � � � � � � � � � � � � � � � � � � � � � � � � � � � � � � � � � � 18
REFINED SYSTEM COMPARISON CONCLUSION � � � � � � � � � � � � � � � � � � � � � � � � � � � � � � � � � � � � � � � � � � � � � � � � 18
The Future of Adaptive Technology . . . . . . . . . . . . . . . . . . . . . . . . . . . . . . . . . . . . . . . . . . . . . . . . . . . 19
Special Thanks . . . . . . . . . . . . . . . . . . . . . . . . . . . . . . . . . . . . . . . . . . . . . . . . . . . . . . . . . . . . . . . . . . . . 20
References . . . . . . . . . . . . . . . . . . . . . . . . . . . . . . . . . . . . . . . . . . . . . . . . . . . . . . . . . . . . . . . . . . . . . . . 22
Appendix . . . . . . . . . . . . . . . . . . . . . . . . . . . . . . . . . . . . . . . . . . . . . . . . . . . . . . . . . . . . . . . . . . . . . . . A-1
i
ADAPTIVE TRAFFIC CONTROL SYSTEMS IN THE UNITED STATES:
Updated Summary and Comparison

FIGURESLA ATCS and InSyncFIGURE 1: SURVEY COMPLETION� � � � � � � � � � � � � � � � � � � � � � � � � � � � � � � � � � � � � � � � � � � � � � � � � � � � � � � � � � � � � � � � � � � 4
FIGURE 2: SYSTEM DEPLOYMENT SIZE� � � � � � � � � � � � � � � � � � � � � � � � � � � � � � � � � � � � � � � � � � � � � � � � � � � � � � � � � � � � � 4
FIGURE 3: SYSTEM COST� � � � � � � � � � � � � � � � � � � � � � � � � � � � � � � � � � � � � � � � � � � � � � � � � � � � � � � � � � � � � � � � � � � � � � � � � � � 5
FIGURE 4: PERCENT OFFLINE� � � � � � � � � � � � � � � � � � � � � � � � � � � � � � � � � � � � � � � � � � � � � � � � � � � � � � � � � � � � � � � � � � � � � � � 6
FIGURE 5: RELIABILITY ISSUES� � � � � � � � � � � � � � � � � � � � � � � � � � � � � � � � � � � � � � � � � � � � � � � � � � � � � � � � � � � � � � � � � � � � � 7
FIGURE 6: OPERATIONAL OBJECTIVES� � � � � � � � � � � � � � � � � � � � � � � � � � � � � � � � � � � � � � � � � � � � � � � � � � � � � � � � � � � � � � 7
FIGURE 7: OPERATIONAL OBJECTIVE EXPECTATIONS� � � � � � � � � � � � � � � � � � � � � � � � � � � � � � � � � � � � � � � � � � � � � � � 8
FIGURE 8: MAINTENANCE EXPECTATIONS� � � � � � � � � � � � � � � � � � � � � � � � � � � � � � � � � � � � � � � � � � � � � � � � � � � � � � � � � � 9
FIGURE 9: EFFORT AND TRAINING EXPECTATIONS� � � � � � � � � � � � � � � � � � � � � � � � � � � � � � � � � � � � � � � � � � � � � � � � � 10
ACS-Lite UpdateFIGURE 10: RELIABILITY ISSUES� � � � � � � � � � � � � � � � � � � � � � � � � � � � � � � � � � � � � � � � � � � � � � � � � � � � � � � � � � � � � � � � � � � 11
FIGURE 11: ACS-LITE PERCENT OFFLINE� � � � � � � � � � � � � � � � � � � � � � � � � � � � � � � � � � � � � � � � � � � � � � � � � � � � � � � � � � � 11
OperationsFIGURE 12: OPERATIONAL BENEFITS� � � � � � � � � � � � � � � � � � � � � � � � � � � � � � � � � � � � � � � � � � � � � � � � � � � � � � � � � � � � � � 14
Refined Systems ComparisonFIGURE 13: OVERALL COST� � � � � � � � � � � � � � � � � � � � � � � � � � � � � � � � � � � � � � � � � � � � � � � � � � � � � � � � � � � � � � � � � � � � � � � � 15
FIGURE 14: TOTAL HOURS OF INSTALLATION� � � � � � � � � � � � � � � � � � � � � � � � � � � � � � � � � � � � � � � � � � � � � � � � � � � � � � 16
FIGURE 15: INSTALLATION HOURS PER INTERSECTION� � � � � � � � � � � � � � � � � � � � � � � � � � � � � � � � � � � � � � � � � � � � 16
FIGURE 16: HOURS OF MAINTENANCE PER WEEK� � � � � � � � � � � � � � � � � � � � � � � � � � � � � � � � � � � � � � � � � � � � � � � � � 17
FIGURE 17: PERCENT OF TIME OFFLINE�� � � � � � � � � � � � � � � � � � � � � � � � � � � � � � � � � � � � � � � � � � � � � � � � � � � � � � � � � � � 17
FIGURE 18: HINDSIGHT QUESTION� � � � � � � � � � � � � � � � � � � � � � � � � � � � � � � � � � � � � � � � � � � � � � � � � � � � � � � � � � � � � � � � 18
TABLESTABLE 1: SUMMARY OF EXISTING STUDIES� � � � � � � � � � � � � � � � � � � � � � � � � � � � � � � � � � � � � � � � � � � � � � � � � � � � � � � � 12
TABLE 2: OVERVIEW OF THE STRENGTHS AND WEAKNESSES OF ACS-LITE, INSYNC AND SCATS� � � � � � � � � � � � � � � � � � � � � � � � � � � � � � � � � � � � � � � � � � � � � � � � � � � � � � � � � � � � � � � � � 19
ii
ADAPTIVE TRAFFIC CONTROL SYSTEMS IN THE UNITED STATES:
Updated Summary and Comparison

INTRODUCTION The number of adaptive traffic control (ATC) systems installed and operating in the U�S� has exploded in the last two years� Prior to 2008 there were only 38 adaptive systems known to have ever been in operation� Of these 38 systems, almost half have been abandoned or shut down� But, since 2009, there has been a renewed interest in and implementation of adaptive traffic control�
In 2009, HDR conducted a survey to assess the historical experience in the U�S� with regards to adaptive traffic control systems� The survey findings were published in September 2009� Since that time there has been significant activity with regards to adaptive traffic control that compelled us to conduct a follow up survey in 2010�
The most recent survey assesses the technologies that have been the most rapidily deployed over the last two years� It also examines the operational benefits of the more popular adaptive systems based on the latest before and after studies� The overall goal of this research effort is to aid practitioners in their decision making when considering advanced traffic control technologies to support transportation system improvements�
2009 Research and Report The intent of our previous research was to examine the cost, reliability and maintenance of adaptive traffic control systems in the U�S� The research did not include an evaluation of operational benefits due to the widely accepted views that adaptive systems provide operational benefits� The research
data was gathered from first person accounts of identified systems in the form of user surveys� The survey responses provided information to develop general cost factors for procurement, as well as estimates for installation and maintenance efforts� It was clear from the data that the “experience” with ATC systems in the U�S� has left practitioners with a generally negative view of the technology� To reach the 2009 research in full, go to www�hdrinc�com/atc�
New Systems SurveyedAfter completing the 2009 survey it was clear that practitioners needed a clearer picture of adaptive technology� The 2009 report set thresholds that excluded certain newer technologies that either did not have enough systems installed to be reasonably surveyed, or the product was not yet available in the marketplace for widespread use� In an effort to gain a greater understanding of current adaptive technology we reviewed the systems excluded from the 2009 research effort� Also, in the past year additional deployments of previously surveyed technologies were identified� These deployments
1
ADAPTIVE TRAFFIC CONTROL SYSTEMS IN THE UNITED STATES:
Updated Summary and Comparison
SEPTEMBER 2010
were included in the 2010 survey to provide an updated look at the state of the practice in the U�S� The systems identified for the 2010 survey included:
• ACS-Lite – three new deployments identified
• InSync – 12 deployments identified
• Los Angeles ATCS – three deployments identified
InSync is one of the newest adaptive systems on the market with the first full deployment being launched within the last five years� The LA ATCS system was developed and implemented about 10 years ago and is operating in Los Angeles and its surrounding area� Currently there are only two jurisdictions that operate the LA ATCS system� ACS-Lite was surveyed for the 2009 report, but in the last few years more systems have been deployed providing additional information to consider� Synchro Green was investigated; however, the technology still appears to be in the developmental stage� An effort was made to gather details on the system including a timeline for development and deployment� A response was not returned from Trafficware�
The LA ATCS and InSync survey findings will be summarized in a format similar to the 2009 report allowing easy comparisons between cost, maintenance, and reliability with the previously surveyed technologies� The report section is titled, “LA ATCS and InSync”� ACS-Lite will be addressed in a separate section titled “ACS-Lite Update”� The update will include both the previous and most current survey data on the system and will provide new results averages as well as discuss the improvements seen in the more recent surveys�
OperationsAn evaluation of operational benefits was not included in the 2009 survey paper; however, given the availability of numerous before and after studies with the most recent adaptive deployments it was decided operational data should be included in this paper� Recently completed before and after studies were used for the analytical comparison� Reduction in travel time, change in percent stops and changes in average travel speed were some of the measures used to compare operations� There was also an objective comparison of operations prepared based upon user opinion and experience with how well the adaptive system performed based on their expectations and perceptions� The objective operational review will be covered in the “LA ATCS and InSync” section and the analytical review will be covered in the “Operations” section�
Refined Systems Comparison The 2009 and 2010 research resulted in the survey of seven specific adaptive technologies� The survey data was aggregated, allowing for an updated comparison of all the systems� A refined review of cost, installation effort, maintenance experience and reliability was used to identify a “short list” of adaptive technologies that show greater promise for application in the U�S� These systems were then compared from an operational perspective based on the available operational studies for each system�
2
ADAPTIVE TRAFFIC CONTROL SYSTEMS IN THE UNITED STATES:
Updated Summary and Comparison
SEPTEMBER 2010
Refined Definition of AdaptiveThe term “adaptive” has been used since the first generation technology was developed in the 1960s and 1970s� Over the past 30 years, technology has made great advances while the term “adaptive” has remained unchanged� Essentially transportation professionals view the term “adaptive traffic control” to mean “an advanced traffic signal control system that updates traffic signal timing in some automated way� “
In our opinion this definition presents a problem� The term “adaptive” should not be used as an all encompassing term that reflects a generalized meaning for many generations of technology� Instead, the terminology for adaptive traffic control should also be refined to accurately depict the system operation or architecture� Today there are really two distinct types of adaptive systems: responsive adaptive systems and real-time adaptive systems.
Most adaptive systems in operation today collect information over several cycles or minutes, sending the information to a central processing location where automated decisions are made for signal timing adjustments� Then new timing plans or adjustments are sent back to the intersection controllers for implementation� This process is similar to the traffic responsive systems that have been available for decades� By their very operation these adaptive systems would be termed “responsive adaptive” because they take several cycles to respond with updated timing� A newer architecture has been developed and deployed in recent years� This new system makes decisions in real-time based upon data gathered and evaluated every second along the corridor� Signal timing adjustments are not made every few cycles, but instead decisions are made every second on the current signal status and how to best serve current, real-time demand� This type of system, by its operation, would be termed “real-time adaptive�”
A recent publication on adaptive technology suggests there is no reason to provide a distinction between adaptive architectures (i�e� responsive versus real-time)� However, based upon the data that is presented in this paper, we believe there is a clear difference in the results that can be gained with real-time adaptive technology�
2010 SURVEYThe 2010 survey data for the ACS-Lite, InSync and LA ATCS systems was gathered through a web- and phone-based survey� The 2010 survey was identical to the 2009 survey except for the addition of a series of operational questions� The surveys were conducted this way so a comparison could be made between all systems surveyed during 2009 and 2010� With the added questions, the 2010 survey ranged from 40 to 60 questions depending on responses� The survey questions are included in the Appendix�
A total of 18 adaptive deployments were identified for the 2010 survey� At the completion of the survey period, 17 of the 18 participants provided full survey responses� Two of the 17 locations identified had not yet been turned on so the information provided was only applicable for certain
3
ADAPTIVE TRAFFIC CONTROL SYSTEMS IN THE UNITED STATES:
Updated Summary and Comparison
SEPTEMBER 2010

portions of the survey� The completion rates for the surveyed systems are shown in Figure 1�
Of the three LA ATCS systems identified, one of the three systems was actually the LA Automatic Traffic Surveillance and Control (ATSAC) system - not the ATCS system� The LA ATSAC is an older traffic responsive system that is missing the adaptive elements of the LA ATCS system� Although the LA ATSAC survey response was beneficial to the research, it was not applicable to all of the adaptive survey questions� Note that based on the limited number of deployments and the single LA ATCS survey response, the information presented in this paper should be thoughtfully considered since there is no comparative or corroborating data from other LA ATCS deployments�
A summary of deployed system size is shown in Figure 2� The three newer ACS-Lite deployments include five, six and 16 intersections� InSync deployments include systems with as few as three intersections to as many as 17 intersections, and the single LA ATCS system operates 180 intersections�
Figure 1: Survey responses were received from 17 of the 18 participants – a 94 percent completion rate .
Figure 2: ACS-Lite and InSync systems are all below 20 intersections per deployment, whereas the LA system deployments are 100 intersections or larger .
SURVEY COMPLETION
LocationsIdentified
CompletedSurveyed
New ACS Lite
InSync LA ATCS and ATSAC
Num
ber o
f Sur
veys
141210
86420
SYSTEM DEPLOYMENT SIZE
New ACS Lite InSync LA ATCS and ATSAC
Inte
rsecti
ons
180
160
140
120
100
80
60
40
20
0
4
ADAPTIVE TRAFFIC CONTROL SYSTEMS IN THE UNITED STATES:
Updated Summary and Comparison
SEPTEMBER 2010

LA ATCS AND INSYNCThe LA ATCS and InSync survey findings are summarized in a format similar to the 2009 report allowing comparisons between cost, maintenance and reliability with the previously surveyed systems�
CostThe survey was designed to identify system procurement and installation costs, while including other “hidden” costs such as detection, communication or the need for equipment replacement� The costs were aggregated to develop a cost per intersection that relates to installing an adaptive system in an existing corridor� Some deployments included other installation items not directly related to installing the adaptive system (i�e� new traffic signals at each intersection)� Based on the 2009 research, the costs were expected to have a wide range; however, InSync showed a fairly uniform cost per intersection with the exception of one outlier� The costs are shown in Figure 3�
The LA ATCS deployment cost is estimated at $78,000 per intersection� The system installation included many features such as CCTV cameras, communication and detection� Today the LA ATCS7
system can be purchased through McTrans at a cost of $30,000 for area wide use by a jurisdiction� This cost is for the adaptive software component only and does not include the system computers, communication, detection, compatible intersection controllers, etc� that would be required to deploy the LA ATCS system�
InSync appears to be unique in regards to detection� Based on the 2009 and 2010 research, InSync is the only adaptive system that includes detection as part of the system� InSync utilizes its own video detection which is included in the advertised price of $25,000 per intersection� Based on the survey
responses, the average per intersection cost for InSync was $35,200� However, this average contains one response that included full signalization of each intersection as part of the deployment ($100,000 per intersection data point)� We believe this response should be removed from the average cost calculation in order to identify a more representative estimate for InSync implementation� Removing this outlier provides an average per intersection cost of $28,700 for InSync� Note that this average cost includes detection, communication and all other hidden costs necessary to make the system operational at a typical existing signalized intersection�
Figure 3: InSync averaged a cost per intersection of $28,700, excluding the $100,000 outlier .
SYSTEM COST
InSync LA ATCS
Cost
per I
nter
secti
on
$100,000
$80,000
$60,000
$40,000
$20,000
$0
5
ADAPTIVE TRAFFIC CONTROL SYSTEMS IN THE UNITED STATES:
Updated Summary and Comparison
SEPTEMBER 2010
Downtime and ReliabilityOne key issue with regards to reliability is system downtime� In the 2009 research it was clear that the older systems had a higher percentage of downtime with an average of around 10 percent after removing the systems that were offline nearly all the time� In looking at the more recent installations, it was determined that 5 percent downtime was the average�
The estimated offline time for the LA ATCS and InSync systems is shown in Figure 4� All of the systems were at or below 5 percent� The LA ATCS system showed an average downtime of 1 percent, while InSync averaged a downtime of 2�2 percent� Note that the LA system only includes one data point for reference� It is also noted that one InSync response was not included in the data� One respondent noted a 20 percent downtime; however, the participant provided additional follow up comments that the system was currently functioning properly with less than 20 percent time offline, though he could not provide an updated estimate� Given the uncertainty in this data point we decided to remove it with the understanding that there were 9 other responses from which to determine the average InSync system downtime�
When comparing the 2009 and 2010 surveys, it is interesting to note that most survey respondents identified communications and detection as their most common reliability issues� The 2010 survey responses are shown in Figure 5�
The only reliability concern noted by the LA ATCS respondent was communication� The LA ATCS system includes 180 intersections which are tied together with a fiber communication network� The individual intersections have a fiber interconnect that connects to the main fiber backbone� Communication for the ATCS fails when the fiber backbone is disrupted� The respondent noted they maintain communication reliably with only 1 percent downtime�
Figure 4: The LA ATCS single response noted an average of 1 percent downtime; InSync averaged 2 .2 percent .
PERCENT OFFLINE
LA ATCS InSync InSync Average
Perce
nt O
ffline
20
15
10
5
0
6
ADAPTIVE TRAFFIC CONTROL SYSTEMS IN THE UNITED STATES:
Updated Summary and Comparison
SEPTEMBER 2010

InSync respondents noted detection and communication as more likely to impact reliability� When considering communication, it is interesting to note that InSync is a distributed system that operates with continued local optimization in the event communication between intersections is lost�
Several comments were provided by respondents regarding video detection� It was noted that the detection system at times registers false positives and occasionally misses calls as well� One respondent also commented that a contractor installed the video cameras improperly on his deployment which led to detection reliability issues�
Operational ObjectivesThe survey included a multiple response question asking what operational objectives were desired when an adaptive traffic control system is installed� Some of the answers included reducing overall delay, decreasing the number of stops, or improving the overall travel time on the corridor or road system� There was wide range of responses; however, the most common responses were improving arterial travel time and decreasing the number of stops�
The LA ATCS system respondent prioritized arterial travel time as the higher objective but also mentioned delay, number of stops and progression as other priorities� InSync respondents prioritized the operational objectives in a similar fashion where arterial travel times and number of stops were more commonly the higher
Figure 5: Similar to the 2009 survey, detection and communication are noted as the items most likely to cause issues .
Figure 6: Improved arterial travel time was the goal of 64 percent of the respondents, followed by 57 percent answering a decrease in stops .
RELIABILITY ISSUES
Installation and setup
Interface between detection and ATCS
Detection problems
ATCS software
Communication
LA ATCS InSync Overall
Parti
cipan
t Res
pons
es
Arterial Travel Time
Decrease in Arterial Delay
Number of Stops
Intersection Delay
Minimizing Queue Lengths
Increasing Average Speed
Other
OPERATIONAL OBJECTIVES
LA ATCS and ATSAC
InSync Overall
Parti
cipan
t Res
pons
es
109876543210
9
8
7
6
5
4
3
2
1
0
7
ADAPTIVE TRAFFIC CONTROL SYSTEMS IN THE UNITED STATES:
Updated Summary and Comparison
SEPTEMBER 2010
priority� A summary of the survey responses is shown in Figure 6�
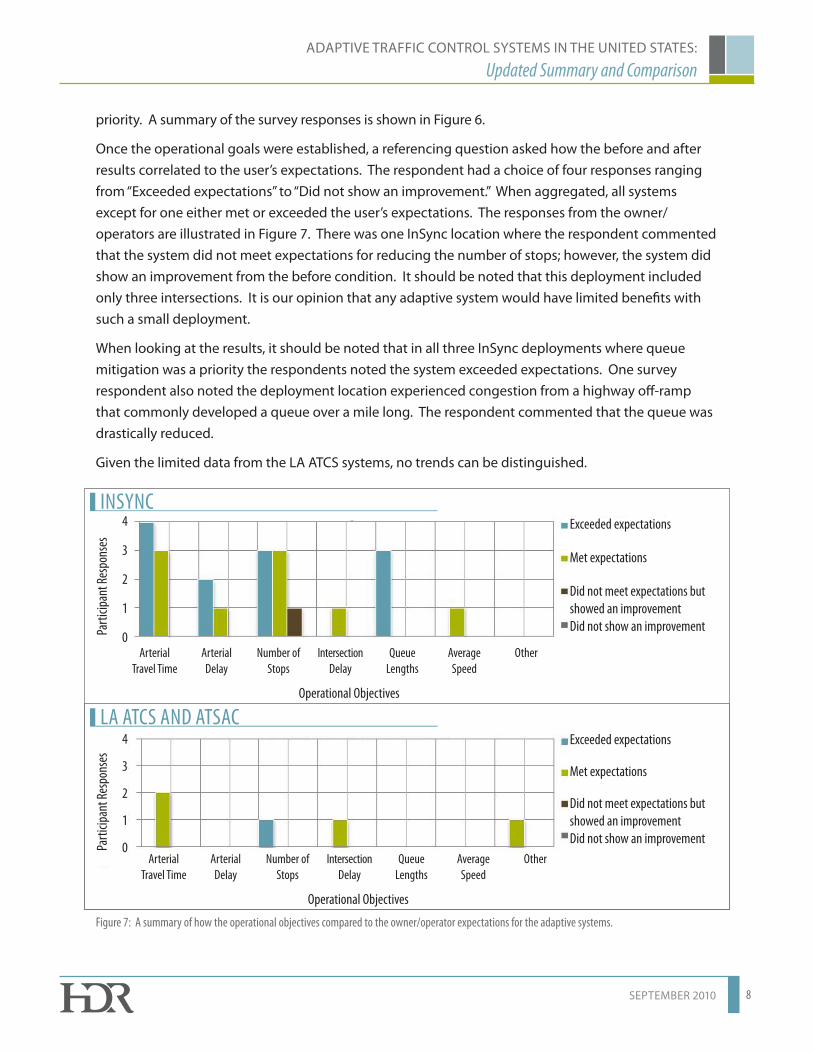
Once the operational goals were established, a referencing question asked how the before and after results correlated to the user’s expectations� The respondent had a choice of four responses ranging from “Exceeded expectations” to “Did not show an improvement�” When aggregated, all systems except for one either met or exceeded the user’s expectations� The responses from the owner/operators are illustrated in Figure 7� There was one InSync location where the respondent commented that the system did not meet expectations for reducing the number of stops; however, the system did show an improvement from the before condition� It should be noted that this deployment included only three intersections� It is our opinion that any adaptive system would have limited benefits with such a small deployment�
When looking at the results, it should be noted that in all three InSync deployments where queue mitigation was a priority the respondents noted the system exceeded expectations� One survey respondent also noted the deployment location experienced congestion from a highway off-ramp that commonly developed a queue over a mile long� The respondent commented that the queue was drastically reduced�
Given the limited data from the LA ATCS systems, no trends can be distinguished�
Figure 7: A summary of how the operational objectives compared to the owner/operator expectations for the adaptive systems .
Exceeded expectations
Met expectations
Did not meet expectations but showed an improvementDid not show an improvement
INSYNC
Arterial Travel Time
Arterial Delay
Number of Stops
IntersectionDelay
QueueLengths
Average Speed
Other
Parti
cipan
t Res
pons
es
4
3
2
1
0
Operational Objectives
Exceeded expectations
Met expectations
Did not meet expectations but showed an improvementDid not show an improvement
LA ATCS AND ATSAC
Arterial Travel Time
Arterial Delay
Number of Stops
IntersectionDelay
QueueLengths
Average Speed
Other
Parti
cipan
t Res
pons
es
4
3
2
1
0
Operational Objectives
8
ADAPTIVE TRAFFIC CONTROL SYSTEMS IN THE UNITED STATES:
Updated Summary and Comparison
SEPTEMBER 2010

Maintenance The survey collected information in the form of average maintenance hours required per week to maintain the system� This allowed the development of an overall average of maintenance time per deployment and average maintenance time per intersection�
The results are shown in Figure 8� InSync system averages 18 minutes of maintenance per intersection per week� When looking at LA ATCS the total weekly maintenance was noted to be 2 hours per week� When divided by 180 intersections, the maintenance per intersection is less than one minute� The 2009 research concluded a value of roughly 28 minutes of maintenance per intersection per week� The general trend with these technologies is a reduction in average maintenance time compared to the systems surveyed in 2009�
Other Survey Questions
Which time period showed the biggest improvement from the ATCS? There is a common opinion in the industry that adaptive technology works well in unpredictable traffic patterns (i�e� special events)� Also, it seems to be an opinion of practitioners that not much can be gained during peak traffic periods, especially when a corridor is at or near capacity� In answering the above question, the respondents unanimously indicated that the systems showed the greatest improvements during the peak periods�
Figure 8: This figure displays a summary of the weekly maintenance per intersection for the deployments . The overall average maintenance was 18 minutes per intersection . This is less than the 2009 survey findings which showed an average of 28 minutes per intersection .
MAINTENANCE/INTERSECTION
LA ATCS InSync
Wee
kly Av
erag
e Main
tena
nce
Per I
nter
secti
on (M
in .)
40
30
20
10
0
TOTAL MAINTENANCE
LA ATCS InSync
Wee
kly Av
erag
e Main
tena
nce
Per S
yste
m (H
r .)
6
5
4
3
2
1
0
9
ADAPTIVE TRAFFIC CONTROL SYSTEMS IN THE UNITED STATES:
Updated Summary and Comparison
SEPTEMBER 2010
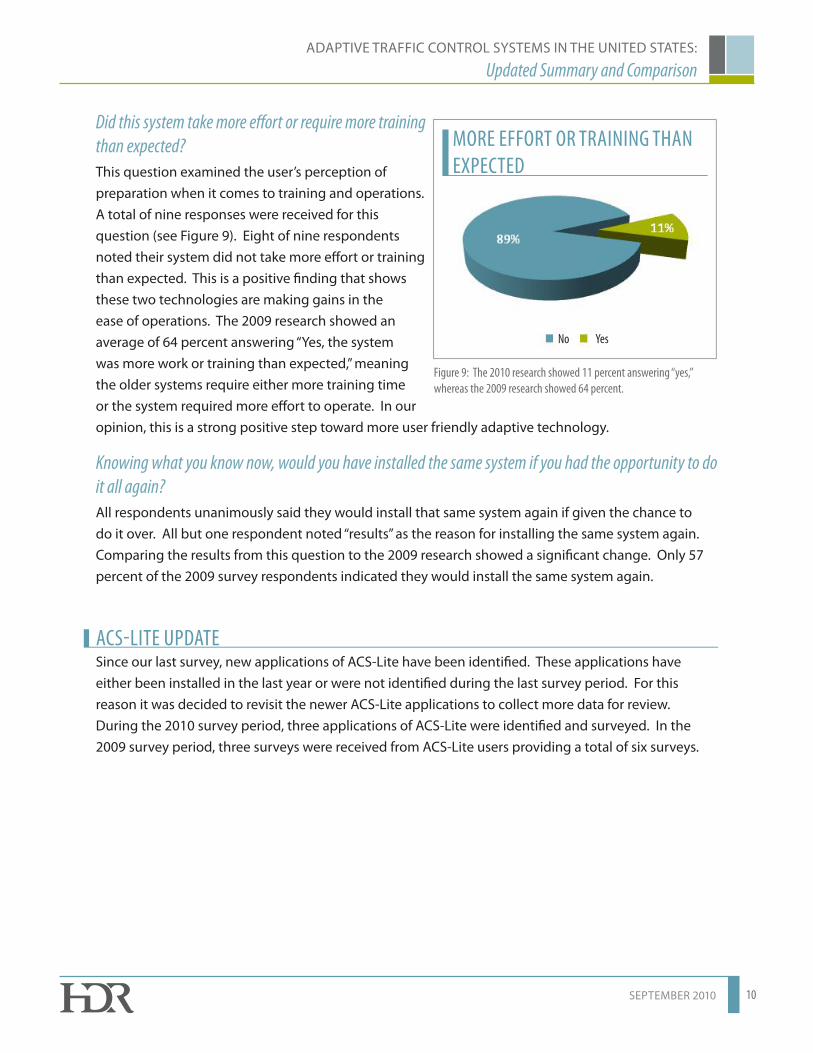
Did this system take more effort or require more training than expected? This question examined the user’s perception of preparation when it comes to training and operations� A total of nine responses were received for this question (see Figure 9)� Eight of nine respondents noted their system did not take more effort or training than expected� This is a positive finding that shows these two technologies are making gains in the ease of operations� The 2009 research showed an average of 64 percent answering “Yes, the system was more work or training than expected,” meaning the older systems require either more training time or the system required more effort to operate� In our opinion, this is a strong positive step toward more user friendly adaptive technology�
Knowing what you know now, would you have installed the same system if you had the opportunity to do it all again?All respondents unanimously said they would install that same system again if given the chance to do it over� All but one respondent noted “results” as the reason for installing the same system again� Comparing the results from this question to the 2009 research showed a significant change� Only 57 percent of the 2009 survey respondents indicated they would install the same system again�
ACS-LITE UPDATE Since our last survey, new applications of ACS-Lite have been identified� These applications have either been installed in the last year or were not identified during the last survey period� For this reason it was decided to revisit the newer ACS-Lite applications to collect more data for review� During the 2010 survey period, three applications of ACS-Lite were identified and surveyed� In the 2009 survey period, three surveys were received from ACS-Lite users providing a total of six surveys�
Figure 9: The 2010 research showed 11 percent answering “yes,” whereas the 2009 research showed 64 percent .
MORE EFFORT OR TRAINING THAN EXPECTED
No Yes
10
ADAPTIVE TRAFFIC CONTROL SYSTEMS IN THE UNITED STATES:
Updated Summary and Comparison
SEPTEMBER 2010

When gathering cost information for ACS-Lite systems, it was difficult to obtain solid cost numbers� Four of the six locations surveyed in 2009 and 2010 were either partially or fully federally funded, leaving only two systems with procurement cost information�
The survey yielded costs of $43,750 and $33,700 per intersection for these two systems� The average of these costs is $38,700 per intersection�
Communication was again the primary concern in regards to reliability among the 2010 respondents, and detection was mentioned by two of the three 2010 respondents as an area of concern� Another item was the issue of downtime� One of the 2009 surveys indicated a system had 100 percent downtime while another ACS-Lite system in another location showed a downtime of 2 percent� The comparison of the downtimes from the
different surveys can be seen in Figure 11� Note that the system with 100 percent downtime skews the averages and could be considered an outlier� If the outlier is excluded, the ACS-Lite systems average about 9 percent downtime� This amounts to about 17 hours per week the system is not operational�
The last survey topic to summarize for the ACS-Lite update includes how the system met the participants’ operational objectives� This was a new section added to the 2010 survey� The purpose of these questions was to identify
Figure 10: The 2010 research indicates communication was the key reliability issue for ACS-Lite .
COMMUNICATION WAS A COMMON CONCERN AMOUNG THE 2010
SURVEY RESPONDENTS.
Figure 11: Excluding the 2009 response that noted 100 percent downtime, ACS-Lite has an average system downtime of 9 percent .
RELIABILITY ISSUES Installation and setup
Interface between detection and ATCS
Detection problems
Adaptive Software
Communication
OtherACS-Lite 2009 Respondents
ACS-Lite 2010 Respondents
Total
Parti
cipan
t Res
pons
es
3
2
1
0
ACS-LITE PERCENT OFFLINE
2009 Survey Participants
2010 Survey Participants
Total Average Average w/o 100% Down
System
Perce
nt D
ownt
ime P
er W
eek
100
80
60
40
20
0
11
ADAPTIVE TRAFFIC CONTROL SYSTEMS IN THE UNITED STATES:
Updated Summary and Comparison
SEPTEMBER 2010

how the before and after results matched up with the survey respondents’ expectations� The respondents noted the ACS-Lite system either met or exceeded their expectations in four categories� The categories mentioned were decreasing arterial delay, decreasing the number of stops, reducing intersection delay, and one respondent noted ACS-Lite increased “car throughput volume�”
Overall there are improvements from the 2009 survey to the 2010 survey, but some comments should be noted� One location installed in 2009 commented that the system does not have the ability to change the cycle length� This is currently the case; however, according to the Federal Highway Administration (FHWA) the ability to include cycle length adjustments is being developed� Another respondent stated that the ACS-Lite system does not work well in a grid pattern� Another comment was that the system does not work well in areas with short duration high volume peaks; for example, when schools or special events get out� On the other hand it was commented that ACS-Lite was user friendly to configure and the ease of operation was desirable�
OPERATIONSThus far, our research has only covered operations from an objective viewpoint – meaning we have reported the owner or respondent’s opinion on how well the system performed based on their observations� Through our research we have been able to gather numerous before and after studies of the adaptive systems� Altogether, there were 15 studies gathered from a variety of sources� The systems and number of studies include:
System Name Number of StudiesACS-Lite 4LADOT ATCS 1SCOOT 2InSync 4SCATS 4
Table 1: Summary of existing studies - A total of 15 were reviewed in order to make operational comparisons .
After reviewing the before- and after-studies, it is clear there were a variety of evaluation methods employed to study the benefits of the adaptive systems� Due to the limited data and vagueness of some of the studies, it was decided that two of the adaptive systems did not have sufficient information to include them in the operational comparison (SCOOT and LADOT ATCS)� Based on the data available it was deemed appropriate to compare ACS-Lite, InSync and SCATS� Again, note that
ONE RESPONDENT COMMENTED THAT HE LIKED THE EASE OF
OPERATION AND CONFIGURATION OF ACS-LITE.
ONE RESPONDENT NOTED “ACS-LITE DOES NOT HAVE
THE ABILITY TO ADJUST CYCLE LENGTHS.”
12
ADAPTIVE TRAFFIC CONTROL SYSTEMS IN THE UNITED STATES:
Updated Summary and Comparison
SEPTEMBER 2010
the before- and after-study methods varied� In order to provide the most reasonable comparison, we looked for data that was consistent in each study� All of the validation studies for ACS-Lite, InSync and SCATS included measures for:
• Travel Time Reduction
• Reduction in Stops
• Reduction in Delay
The systems were compared using these three categories� The study data was aggregated to identify AM and PM period results by adaptive system�
ConcurrenceDuring the 2009 survey, several validation studies were provided by survey respondents� On a few occasions the respondents noted the studies were done; however, they did not necessarily believe the results� In these specific instances the respondent noted the report results seemed to show better results than what was observed� This is an important factor that we incorporated into the 2010 survey� All of the survey respondents were asked if they concurred with the findings in their specific validation reports� This was done to provide a simple check into the validity of the reports as viewed by the system owner/operator�
The validation reports included in this operations evaluation all received positive comments from the survey participants – meaning they concurred with the findings of the validation report done for their adaptive system� This check adds a level of confidence with the operational evaluation� Essentially, the owner/operator has commented that the before and after study results match up with what they have observed�
Operational ComparisonThe data presented in Figure 12 indicates improvements are achieved with all three adaptive systems� It is notable that InSync achieves the highest gains in all categories and time periods� Generally, SCATS and ACS-Lite provide about the same level of operational improvement, with SCATS average benefits being slightly better�
We believe it is important to note that of these three systems, InSync is the only system that operates and optimizes in “real–time” as defined in this paper� ACS-Lite and SCATS operate based on a “responsive adaptive” architecture that results in signal timing changes several minutes or cycles after data is gathered by the system�
A recent publication on adaptive traffic control providess some inaccurate information regarding real-time adaptive traffic control and InSync� The publication makes a general statement that real-time adaptive traffic control could cause negative impacts on traffic due to the need for the system to continually adjust cycle lengths, resulting in signal timing plans that would always be in transition and therefore not in coordination�
13
ADAPTIVE TRAFFIC CONTROL SYSTEMS IN THE UNITED STATES:
Updated Summary and Comparison
SEPTEMBER 2010

It was reported in this publication that InSync operates by transitioning from one signal timing to another, thus creating delay� This is an inaccurate statement� The correct explanation regarding InSync is that the optimization strategy does not depend on a fixed cycle length which allows the system to make second-by-second adjustments of signal timing parameters to meet literal real-time traffic demand on the corridor�
Based upon the results from our summary of before- and after-studies, we believe there is sufficient evidence to show that real-time adaptive technology provides greater benefit than responsive adaptive approaches� Note that in the review of the validation studies there was not a system or single validation report that could compare to the results documented with the real time adaptive technology , InSync�
Figure 12: InSync shows the highest operational benefits in all categories by a significant margin .
ARTERIAL TRAVEL TIME REDUCTION
AM Peak PM Peak
Perce
nt Re
ducti
on
30%25%20%15%10%
5%0%
ACS-Lite
InSync
SCATS
Time Period
REDUCTION IN STOPS
AM Peak PM Peak
Perce
nt Re
ducti
on
80%
60%
40%
20%
0%
ACS-Lite
InSync
SCATS
Time Period
REDUCTION IN DELAY
AM Peak PM Peak
Perce
nt Re
ducti
on
70%60%50%40%30%20%10%
0%
ACS-Lite
InSync
SCATS
Time Period
14
ADAPTIVE TRAFFIC CONTROL SYSTEMS IN THE UNITED STATES:
Updated Summary and Comparison
SEPTEMBER 2010

REFINED SYSTEMS COMPARISONIn this section, the survey data will be used to compare the seven technologies surveyed with the goal of identifying the systems that show the most promise for near term application� The systems included in the comparison are:
• ACS-Lite
• InSync
• Los Angeles ATCS
• OPAC
• RHODES
• SCATS
• SCOOT
CostCost was a key milestone addressed in both reports� Overall we received 29 data sets, including information regarding intersection upgrade costs necessary to implement the specific systems� We did not receive a reliable cost estimate for RHODES in the 2009 survey, so the system is excluded from the cost summary� The average costs of the systems can be seen in Figure 13� InSync showed the lowest average cost per intersection with an average of $28,700 per intersection� Based on the available data, ACS-Lite and InSync are the lowest cost systems�
Comparatively, SCATS, OPAC and LA ATCS systems are on the higher end of installation cost spectrum� When all of the 29 data sets are aggregated, an overall average cost of $46,000 per intersection is identified�
From this initial comparison the LA ATCS is removed from further comparison due to its high implementation cost� Note, the LA ATCS system shows promise and obviously works, but due to the lack of redundant survey data it was difficult to compare the system to other systems in the survey� RHODES and OPAC systems are removed from
Figure 13: InSync shows the lowest average cost per intersection .
OVERALL COST
ACS-Lite InSync SCATS SCOOT OPAC LA ATCS
Aver
age C
ost P
er In
terse
ction
$80,000
$60,000
$40,000
$20,000
$0
15
ADAPTIVE TRAFFIC CONTROL SYSTEMS IN THE UNITED STATES:
Updated Summary and Comparison
SEPTEMBER 2010

further comparison due to limited deployments and lack of available information� This condenses the list to four systems�
Installation and Fine TuningIt important to procure a system that is user friendly, as well as efficient to install and fine tune� This section compares the installation and fine tuning time from the context of both total hours and hours per intersection�
In Figure 14 the overall installation and fine tuning time is summarized� From this figure it would appear that SCOOT requires the greatest effort to install and fine tune while ACS-Lite, InSync and SCATS all show significantly lower effort requirements� Note, however, that this summary does not account for system size� When the installation time and fine tuning effort is normalized with regard to number of intersections the findings show a closer grouping for the effort�
The normalized data can be seen in Figure 15� This data represents the overall hours of installation per intersection� Note that SCOOT is still shown to take more effort than the other systems; however, not by such a large margin� Overall the effort per intersection ranges from eight hours per intersection for ACS-Lite to 24 hours per intersection for SCOOT�
It is interesting to note that InSync installation efficiency decreased once the time was normalized on a per intersection basis� One item to understand when comparing
Figure 14: Overall installation and fine tuning hours required (total time) .
Figure 15: Per intersection installation and fine tuning hours (normalized time) .
TOTAL HOURS OF INSTALLATION
ACS-Lite InSync SCATS SCOOT
Tota
l Hou
rs
600 hrs
500 hrs
400 hrs
300 hrs
200 hrs
100 hrs
0 hrs
INSTALLATION HOURS PER INTERSECTION
ACS-Lite InSync SCATS SCOOT
Tota
l Hou
rs Pe
r Int
erse
ction
30 hrs
25 hrs
20 hrs
15 hrs
10 hrs
5 hrs
0 hrs
16
ADAPTIVE TRAFFIC CONTROL SYSTEMS IN THE UNITED STATES:
Updated Summary and Comparison
SEPTEMBER 2010
the installation time is what the respondents considered as part of the installation and fine tuning� ACS-Lite, for example, tries to utilize existing detection with the deployments, whereas SCOOT and SCATS can utilize existing detection but require certain additional detection to function at full capacity� InSync, on the other hand, utilizes its own video detection that comes with the system� The installation of the detection is therefore included in all InSync respondent time estimates, whereas with the other systems, detection installation time is not necessarily included as part of their estimate� Overall, ACS-Lite is the least labor intensive for installation and fine tuning�
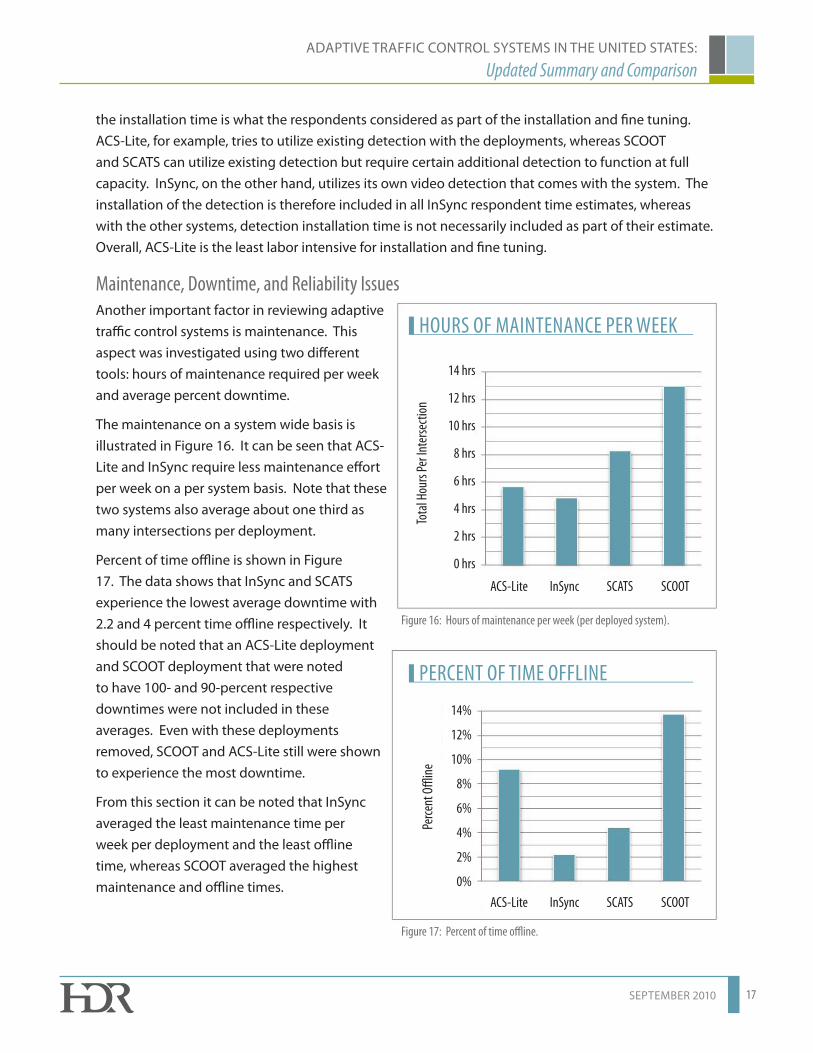
Maintenance, Downtime, and Reliability IssuesAnother important factor in reviewing adaptive traffic control systems is maintenance� This aspect was investigated using two different tools: hours of maintenance required per week and average percent downtime�
The maintenance on a system wide basis is illustrated in Figure 16� It can be seen that ACS-Lite and InSync require less maintenance effort per week on a per system basis� Note that these two systems also average about one third as many intersections per deployment�
Percent of time offline is shown in Figure 17� The data shows that InSync and SCATS experience the lowest average downtime with 2�2 and 4 percent time offline respectively� It should be noted that an ACS-Lite deployment and SCOOT deployment that were noted to have 100- and 90-percent respective downtimes were not included in these averages� Even with these deployments removed, SCOOT and ACS-Lite still were shown to experience the most downtime�
From this section it can be noted that InSync averaged the least maintenance time per week per deployment and the least offline time, whereas SCOOT averaged the highest maintenance and offline times�
Figure 16: Hours of maintenance per week (per deployed system) .
Figure 17: Percent of time offline .
HOURS OF MAINTENANCE PER WEEK
ACS-Lite InSync SCATS SCOOT
Tota
l Hou
rs Pe
r Int
erse
ction
14 hrs
12 hrs
10 hrs
8 hrs
6 hrs
4 hrs
2 hrs
0 hrs
PERCENT OF TIME OFFLINE
ACS-Lite InSync SCATS SCOOT
Perce
nt O
ffline
14%
12%
10%
8%
6%
4%
2%
0%
17
ADAPTIVE TRAFFIC CONTROL SYSTEMS IN THE UNITED STATES:
Updated Summary and Comparison
SEPTEMBER 2010
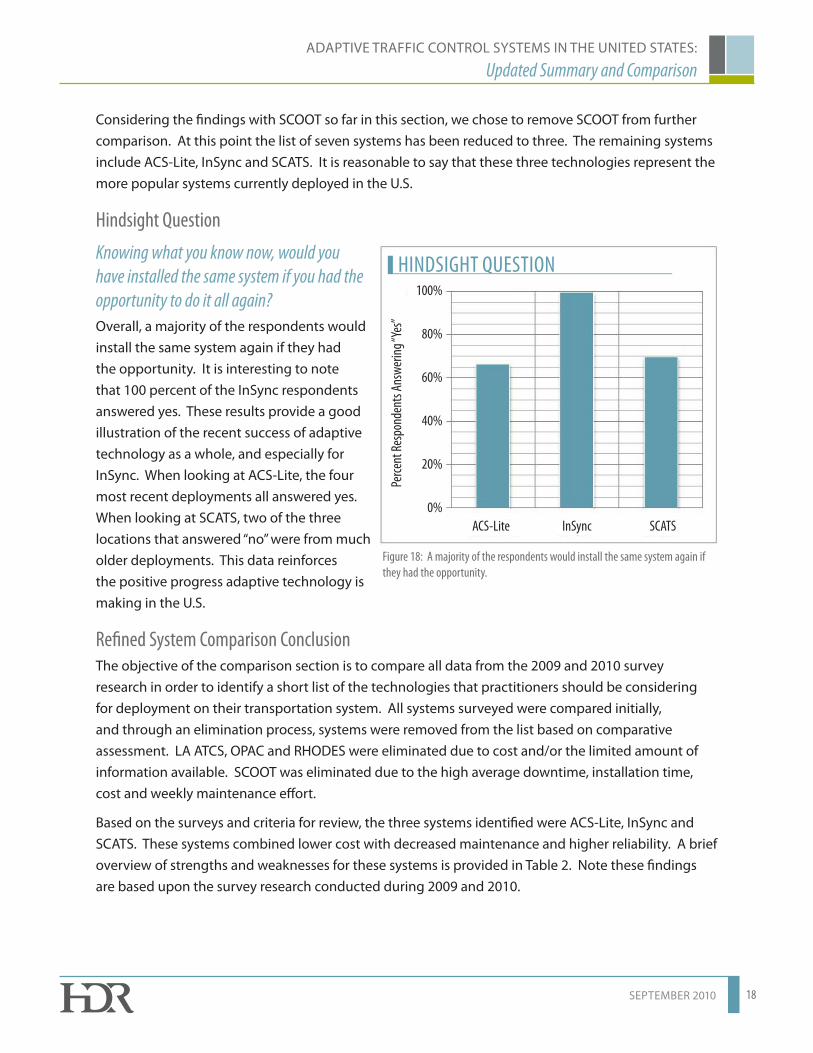
Considering the findings with SCOOT so far in this section, we chose to remove SCOOT from further comparison� At this point the list of seven systems has been reduced to three� The remaining systems include ACS-Lite, InSync and SCATS� It is reasonable to say that these three technologies represent the more popular systems currently deployed in the U�S�
Hindsight Question
Knowing what you know now, would you have installed the same system if you had the opportunity to do it all again? Overall, a majority of the respondents would install the same system again if they had the opportunity� It is interesting to note that 100 percent of the InSync respondents answered yes� These results provide a good illustration of the recent success of adaptive technology as a whole, and especially for InSync� When looking at ACS-Lite, the four most recent deployments all answered yes� When looking at SCATS, two of the three locations that answered “no” were from much older deployments� This data reinforces the positive progress adaptive technology is making in the U�S�
Refined System Comparison ConclusionThe objective of the comparison section is to compare all data from the 2009 and 2010 survey research in order to identify a short list of the technologies that practitioners should be considering for deployment on their transportation system� All systems surveyed were compared initially, and through an elimination process, systems were removed from the list based on comparative assessment� LA ATCS, OPAC and RHODES were eliminated due to cost and/or the limited amount of information available� SCOOT was eliminated due to the high average downtime, installation time, cost and weekly maintenance effort�
Based on the surveys and criteria for review, the three systems identified were ACS-Lite, InSync and SCATS� These systems combined lower cost with decreased maintenance and higher reliability� A brief overview of strengths and weaknesses for these systems is provided in Table 2� Note these findings are based upon the survey research conducted during 2009 and 2010�
HINDSIGHT QUESTION
ACS-Lite InSync SCATS
Perce
nt Re
spon
dent
s Ans
werin
g “Ye
s”
100%
80%
60%
40%
20%
0%
Figure 18: A majority of the respondents would install the same system again if they had the opportunity .
18
ADAPTIVE TRAFFIC CONTROL SYSTEMS IN THE UNITED STATES:
Updated Summary and Comparison
SEPTEMBER 2010

System Strengths WeaknessesACS-Lite Fastest installation and fine tuning time of
the three systemsHigh downtime associated with communication
Second Lowest cost of the three systems The Least operational benefits of the three systems
Ease of use and configurations Adaptive software cannot change the cycle lengthShort high volume periods are missed by the system
InSync Lowest cost of the three system Video detection was commonly noted as a concern
Lowest overall weekly maintenance of the three systems
Communication was commonly noted as a concern
Lowest percent offline of three systems Highest operational benefits by a large margin
SCATS Second Highest operational benefits Highest cost of the three systemsSecond Lowest installation and fine tuning hours per intersection
Highest average maintenance per week of the three systems
Second Lowest percent offline Table 2: An overview of the strengths and weaknesses of ACS-Lite, InSync and SCATS�
THE FUTURE OF ADAPTIVE TECHNOLOGYThe information gathered through HDR’s 2009 and 2010 survey efforts provides insight into the future of adaptive traffic control� It is clear from the survey respondent comments and the before- and after-studies that greater arterial management can be achieved with adaptive technology� It is also clear that the newer, more innovative technologies provide significantly better operational efficiency than the more traditional responsive adaptive systems� In the recent past, some adaptive technology experts have downplayed the differences between real-time adaptive architecture and responsive adaptive system architectures� Based on the findings from the recent studies compared in this paper, it is clear there is a significant difference that true real-time technology can provide�
So where is adaptive technology heading? It will continue to change and get better, and practitioners will be deploying more and more systems that will operate with limited need for maintenance and oversight� The systems will be largely autonomous, and more importantly, they will be adapting to traffic in real-time on a second by second basis� Broad implementation of “next generation” adaptive traffic control will significantly enhance transportation in the U�S� It will allow the transportation
19
ADAPTIVE TRAFFIC CONTROL SYSTEMS IN THE UNITED STATES:
Updated Summary and Comparison
SEPTEMBER 2010

engineering community to better serve current and future mobility needs with less physical construction, while reducing fuel consumption and vehicle emissions, increasing average arterial speeds and enhancing safety� This future is not far away�
SPECIAL THANKSWe would like to extend a special thank you to all of the survey respondents. Your time and effort in responding to the survey is greatly appreciated.
2010 Survey ParticipantsName Title AgencyGlen Bollinger Traffic Engineer Columbia County, GeorgiaGarry Cash Traffic Signal Technician Rogers, ArkansasThomas Evans District Traffic Engineer Missouri Department of Transportation, Kansas
City DistrictWayne Gisler Assistant Deputy Director of
Traffic EngineeringHarris County, Texas Public Infrastructure Department
Bill Henry Traffic Engineering Manager City of Little Rock, ArkansasDave Hunt Transportation Engineer City of Joplin, MissouriDub Janczys Signalization Supervisor City of Springdale Public Works Department
Signalization DivisionMax Paetzold Traffic Engineer Culver City, CA Ashwin Patel Civil Engineer Manager Pennsylvania Department of TransportationBen Robinson ITS Traffic Project Manager ARCADIS Robert Saylor Traffic Engineer and Operations City of Richardson, TexasSteve Schooley Transportation Manager City of Lenexa, KansasJustin Smith Associate Traffic Engineer City of Tyler, TexasJason Sommerer Senior Traffic Studies Specialist Missouri Department of Transportation, Central
District, TrafficAli Zaghari Chief, Office of Traffic Design Caltrans
20
ADAPTIVE TRAFFIC CONTROL SYSTEMS IN THE UNITED STATES:
Updated Summary and Comparison
SEPTEMBER 2010

2009 Survey ParticipantsName Title AgencyMichael Andrako Assistant City Engineer City of Gahanna, OH Rene Baile Transportation Engineer City of Menlo Park, CARon Chandler Engineering Associate Santa Barbara, CA Cecil Chau Signal Systems Engineer City of Chula Vista, CAJim Clacher Manager, Transportation
Management CenterDelaware DOT
Laura Cove Traffic and Transportation Manager
Town of Cary, NC
Hazem El-Assar Chief Engineer Orange County, FLKevin Eppley TMC Project Engineer City of Chesapeake, VA Jim Gelhar Civil Engineer City of Gresham, ORTrev Holman City Traffic Engineer City of El Cajon, CADuncan Hughes Senior Traffic Engineer City of San Diego, CAJerry Kotzemacher Senior Engineering Specialist Minnesota DOTBrook Martin Traffic Signal Engineer Cobb County DOT, GAAdam Moser Senior ITS Engineer Pinellas County Public Works, FLGary Piotrowicz Director of Traffic-Safety Road Commission for Oakland County, MIRobert W� Reck Traffic Operations Manager Pasco County Traffic Operations Division, FLLes Sipowski Senior Project Manager City of Ann Arbor, MICarmen Talavera Senior Transportation Engineer City of Sunnyvale-Public Works, CAJohn Thai Principal Traffic Engineer City of Anaheim, CABob Tipton Director Collier County Traffic Operations, FLBrenda VanCleave Staff Engineer Pickerington, OHNickolas VanGunst Professional Engineer City of Minneapolis, MN
Note: Some respondents did not wish to be listed; therefore, this is not a full listing of all survey participants�
21
ADAPTIVE TRAFFIC CONTROL SYSTEMS IN THE UNITED STATES:
Updated Summary and Comparison
SEPTEMBER 2010

REFERENCES • Matt Selinger, Luke Schmidt, ”Adaptive Traffic Control Systems in the United States”, HDR
Engineering White Paper, 2009, www�hdrinc�com/atc
• Gresham, OR – http://www�its�pdx�edu/upload_docs/1248894238mPTJ0AxnYW�pdf : Gresham, OR SCATS Evaluation by Portland State University (accessed July 2010)
• http://www�mountain-plains�org/pubs/pdf/MPC08-200�pdf : Park City, Utah SCATS Evaluation by the University of Utah (accessed July 2010)
• http://mioh-utc�udmercy�edu Oakland County, MI Validation Study by the Michigan-Ohio (MIOH) University Transportation Center (accessed July 2010)
• http://rhythmtraffic�com/index�php/projects/validation-studies/ : InSync Validation Studies (accessed July 2010)
• Sabra, Wang & Associates, Inc, ”Adaptive Control Software-LITE Before and After Traffic Analysis Report Main Street-El Cajon, California”, Office of Operations Research and Development FHWA, April 2007
• Koustubh Jain, Paul Silberman and Ziad A� Sabra, ”Adaptive Control Software-LITE Before and After Traffic Analysis Report State highway 70-City of Bradenton, Florida”, Office of Operations Research and Development FHWA, September 2006
• Sabra, Wang & Associates, Inc, ”Adaptive Control Software-LITE Before and After Traffic Analysis Hamilton Road City of Gahanna, Ohio”, Office of Operations Research and Development FHWA, April 2007
• Cox, Robinson, Shelby, Townsend, and Wang, “Evaluation of ACS Lite Adaptive Control using Sensys Arterial Travel Time Data”, Office of Operations Research and Development FHWA(accessed July 2010)
• Bullock, Gettman, Ghaman, Sabra, Shelby, and Soyke, “An Overview and Performance Evaluation of ACS Lite – A Low Cost Adaptive Signal Control System”, Office of Operations Research and Development FHWA (accessed July 2010)
• http://www�fhwa�dot�gov/search�html: ACS-Lite Overview (accessed July 2009)
• www�peek�co�uk: SCOOT Overview (accessed July 2009)
• Betsy Williams, “The Technology Side of the Sydney Coordinated Adaptive Traffic Systems (SCATS)”, Georgia’s Intelligent Transportation Society
• David Gibson, Alan Hansen, and Pitu Mirchandani , “Center for Excellence in Advanced Traffic and Logistical Algorithms and Systems(Atlas)”, Turner-Fairbank Highway, 2001
• Lawrence C� Liao, “A Review of the Optimization Policies for Adaptive Control Strategy (OPAC)”, California Path (Partners for Advanced Transit and Highway), 1998
• Bernhard Friedrich, “Adaptive Signal Control: An Overview”, 9th Meeting of EWGT (Euro Working Group of Transportation), 2002
• Kevin Fehon, “Adaptive Traffic Signals: Are we missing the boat?”, ITE District 6 Annual Meeting, 2004
22
ADAPTIVE TRAFFIC CONTROL SYSTEMS IN THE UNITED STATES:
Updated Summary and Comparison
SEPTEMBER 2010

APPENDIXSurvey QuestionsInitial Questions (2009 and 2010)• How many types of adaptive systems do or did you work with? (number answer)• Please identify the first Adaptive System you have worked with?
o ACS-Liteo OPAC o RHODESo SCOOTo SCATSo Other
Before and After Conditions (2009 and 2010)• What year was the system installed?• What year was the system last in operation?• To implement the ATCS did you need to upgrade or implement new detection?
o Loop, Video, Other• What kind of traffic control system do you use currently instead of ATCS?
Geographical Questions (2009 and 2010)• Does the ATCS extend through multiple jurisdictions?• If coordination issues existed, what did the issue relate to?
o Different policieso Different Detectiono Connecting the Systems
• How many intersections use/used the ATCS?• How many arterials use/used the ATCS?
o Grid or Arterial application�
Capital Questions (2009 and 2010)• What was the cost for the ATCS all together?• What did the system include?• What was not included with the system but required for the system to operate?• How was the cost for the ATCS broken down?
o Cost per intersectiono Cost for the systemo Cost per intersection and cost for the system
• What was the cost for upgrading intersection detection or other intersection necessities for the system?
o Is this a cost per intersection or an overall cost?
A-1
ADAPTIVE TRAFFIC CONTROL SYSTEMS IN THE UNITED STATES:
Updated Summary and Comparison
SEPTEMBER 2010

• Were there initial startup costs just to have the system itself?o Trainingo Licensing and Legalo System Expenseso Other
• Please list the number and percent utilization of the employees working on the system?o Ex: Employee 1: 15%, Employee 2: 10% etc�
Performance Questions (2009 and 2010)• What percentage of the time would you estimate the system is down for any reason?• What are some of the reasons that the system would not be in operation?
o Installation and setupo Interface between detection and ATCSo Detection problems (loop, video or other)o ATCS software itselfo Other
• What is the biggest problem that hinders the system from 100% up time?• Was a validation report created for this ATCS?
Operations Questions (New Section in the 2010 Survey)• What method was used to evaluate the performance of ATCS?
o Personal Observation in the fieldo Traffic simulation or comparable softwareo Before and after studyo On/Off study reverting back to a Time-of-Day plan
• Do you concur with the findings of the evaluation?• Which of the options listed was an objective for optimization of the ATCS?
o Arterial travel timeo Decrease in arterial delayo Number of stopso Intersection delay o Minimizing queue lengthso Increasing average speed o Other
• Did the ATCS meet expectations for the (____) optimization objective?o Exceeded expectationso Met expectationso Did not meet expectations but showed an improvemento Did not show an improvement
• What time period showed the biggest improvement from ATCS?
A-2
ADAPTIVE TRAFFIC CONTROL SYSTEMS IN THE UNITED STATES:
Updated Summary and Comparison
SEPTEMBER 2010

o Saturated periodso Peak periodso Time before and after peak periodso Off peak periodso Special event traffico Other
• Have the operational objective been sustained over the life of the system?
Training Questions (2009 and 2010)• Was there a formal training process from a vendor or consultant?• How many people were trained?• How many hours of training were needed per person?• What did the training entail?
Maintenance Questions (2009 and 2010)• Did this system take more effort or require more training than expected?• Do you feel there is/was enough staff time allotted to make the system successful?• How many staff hours did it take to install and fine-tune the system?• How many hours per week does/did it take to maintain the system on average?• Was ample time allowed to fine tune the system parameters?
SCOOT Questions (2009 and 2010)• Where were the loops located for the SCOOT system?
SCATS Questions (2009 and 2010)• Was Fallback Mode always successfully engaged when a problem or error occurred?• What was the percent of success that the system converted to Fallback Mode?• What was the main reason for automatic activation of Fallback Mode?• How many times did Fallback Mode activate per year?• How fast was the transition to Fallback Mode?• How long did it take to fix the problem causing Fallback Mode on average?
Hindsight Questions (2009 and 2010)• Are you optimistic about the use of adaptive traffic control systems to address congestion?• Knowing what you know now, would you have installed the same system if you had the
opportunity to do it all again?o What is the reasoning why?
- Results- Cost- Maintenance- Installation- Other
• Is there another system you would have rather installed in hindsight?
A-3
ADAPTIVE TRAFFIC CONTROL SYSTEMS IN THE UNITED STATES:
Updated Summary and Comparison
SEPTEMBER 2010