adaptive dynamics of competition for nutritionally
TRANSCRIPT

vol. 178, no. 4 the american naturalist october 2011
Adaptive Dynamics of Competition for NutritionallyComplementary Resources: Character Convergence,
Displacement, and Parallelism
David A. Vasseur1,* and Jeremy W. Fox2
1. Department of Ecology and Evolutionary Biology, Yale University, New Haven, Connecticut 06520; 2. Department of BiologicalSciences, University of Calgary, 2500 University Drive NW, Calgary, Alberta T2N 1N4, Canada
Submitted February 23, 2011; Accepted May 11, 2011; Electronically published August 23, 2011
Online enhancements: appendixes.
abstract: Consumers acquire essential nutrients by ingesting thetissues of resource species. When these tissues contain essential nu-trients in a suboptimal ratio, consumers may benefit from ingestinga mixture of nutritionally complementary resource species. We in-vestigate the joint ecological and evolutionary consequences of com-petition for complementary resources, using an adaptive dynamicsmodel of two consumers and two resources that differ in their relativecontent of two essential nutrients. In the absence of competition, anutritionally balanced diet rarely maximizes fitness because of thedynamic feedbacks between uptake rate and resource density, whereasin sympatry, nutritionally balanced diets maximize fitness becausecompeting consumers with different nutritional requirements tendto equalize the relative abundances of the two resources. Adaptationfrom allopatric to sympatric fitness optima can generate characterconvergence, divergence, and parallel shifts, depending not on thedegree of diet overlap but on the match between resource nutrientcontent and consumer nutrient requirements. Contrary to previousverbal arguments that suggest that character convergence leads toneutral stability, coadaptation of competing consumers always leadsto stable coexistence. Furthermore, we show that incorporating costsof consuming or excreting excess nonlimiting nutrients selects fornutritionally balanced diets and so promotes character convergence.This article demonstrates that resource-use overlap has little bearingon coexistence when resources are nutritionally complementary, andit highlights the importance of using mathematical models to inferthe stability of ecoevolutionary dynamics.
Keywords: adaptive dynamics, character convergence, complementaryresources, stoichiometry, competition, coexistence.
Introduction
Consumers obtain essential nutrients such as N and P fromthe tissues of the resource species they consume. Differentresource species often differ greatly in the ratios of nu-
* Corresponding author; e-mail: [email protected].
Am. Nat. 2011. Vol. 178, pp. 501–514. � 2011 by The University of Chicago.
0003-0147/2011/17804-52840$15.00. All rights reserved.
DOI: 10.1086/661896
trients bound in their biomass (Geider and LaRoche 2002),and typically no one resource species will supply essentialnutrients in the precise ratio required by a consumer. Pro-vided that resources bracket a consumer’s demand ratio,a consumer can obtain a nutritionally balanced diet (onein which the ratio of required essential nutrients ismatched in the diet) by eating a mixture of different re-source species (Simpson et al. 2009). Resources thatbracket a consumer’s required ratio of essential nutrientsare known as nutritionally complementary or partiallysubstitutable resources (Leon and Tumpson 1975; Tilman1982; Abrams 1987c).
When complementary resources are provided ad libi-dum, empirical work has shown that individuals will mod-ify their feeding behavior to obtain a nutritionally balanceddiet (Behmer et al. 2001, 2003). However, if one resourcetype is rare or driven to rarity by preferential feeding,eating a balanced diet might oblige a consumer to eat onlya small amount of food (all of the rare resource, plus justenough of the common resource to balance the diet). Inthis case it may be optimal (fitness maximizing) for aconsumer to eat a large amount of nutritionally unbal-anced food and then excrete excess nutrients (postinges-tion balancing; Anderson et al. 2005; Simpson et al. 2009).For example, zooplankton release a greater fraction of Nrelative to P when they are fed food with an N/P ratiothat is higher than that of their own tissue (Elser and Urabe1999). Grasshoppers when stressed by predators shift tomore carbon-rich food in order to fuel increased metab-olism and then excrete excess nitrogen (Hawlena andSchmitz 2010).
The fact that the abundances of complementary re-sources affect optimal diet choice creates feedbacks be-tween consumer diet and consumer-resource populationdynamics. Changes in consumer diet will alter resourceabundances, which will then feed back to alter the optimal

502 The American Naturalist
diet. Although nutrient balancing through optimal dietchoice has been investigated empirically (Mayntz et al.2005; Behmer and Joern 2008; Hawlena and Schmitz2010), the feedbacks generated through resource popu-lation dynamics have not. Theoretical work including suchfeedbacks is limited to two-resource, one-consumer sys-tems (Schreiber and Tobiason 2003).
Optimal diet choice also matters for coexistence. Theoryhas identified coexistence conditions when consumerscompete for complementary resources and consumer dietchoices are taken as fixed (Leon and Tumpson 1975; Hsuet al. 1981). But it seems implausible that coexistence thatrelies on maladaptive behavior could be sustainable in thelong run. Previous models of competition for both nu-tritionally substitutable resources (e.g., different, nutri-tionally equivalent prey species) and nutritionally essentialresources (e.g., N, water, light) have found that adaptivediet choice by competing consumers promotes ecologicallystable coexistence (Lawlor and Maynard Smith 1976; Foxand Vasseur 2008).
Furthermore, even if adaptive diet choice does promotestable coexistence, will it do so via character displacementor convergence? Competition for substitutable resourcesgenerally selects for divergence in the optimal diets ofcompeting consumers (character displacement; Lawlorand Maynard Smith 1976; Taper and Case 1992; Schluter2000). Consumers of substitutable resources can increasetheir fitness by dropping some resources from their dietin order to feed on alternative resources for which thereis less competition. In contrast, competition for essentialresources selects for character convergence because con-sumers cannot increase their fitness by dropping someresources from their diet in favor of (nonexistent) alter-natives (Abrams 1987b; Fox and Vasseur 2008). Comple-mentary resources are an intermediate case, one that pro-vides the potential for both character displacement andconvergence.
Here we develop a simple model of two adaptive con-sumers competing for two complementary resources. Ourmodel builds on the competition model of Hsu et al.(1981) by incorporating adaptive adjustment of diet choiceon the part of both consumers. Using a combination ofanalytical and numerical approaches, we identify the con-ditions under which the two consumers coexist, both withand without adaptive diet choice. We go on to identify theconditions under which interspecific competition gener-ates character convergence, divergence, or parallel shiftsin consumer diets, but we argue that these are epiphe-nomena. Effects of interspecific competition on consumerdiets are better understood as depending on the matchbetween consumer nutrient demand and the availabilityof nutrients in the resource species. The ways in whichinterspecific competition alters the equilibrium nutrient
availability, and thus optimal consumer diets, are inde-pendent of the diet overlap of the competing consumers.
The Model
In this section we develop a simple model incorporatingthe essential features of competition for complementaryresources and adaptive diet choice, and we highlight em-pirical support for our key assumptions. Even this simplemodel has rich and complex dynamics, so we rely on acombination of analytical and numerical analyses.
Competition for complementary resources requires thateach competitor be able to persist when consuming onlyone resource type (in the absence of competition). How-ever, each competitor should also be able to increase itsfitness by consuming a mixture of different resource types.To meet this constraint, we assume that different resourcetypes contain different ratios of chemical nutrients (as hasbeen reported by Geider and LaRoche 2002) that are nu-tritionally essential for the growth of each consumer. Con-sumers also differ in their chemical compositions (An-dersen and Hessen 1991) and therefore their requirementsfor these chemical nutrients. Thus, the nutritional re-quirements of any consumer can be met by one resourcetype alone, but a mixed diet can increase fitness by im-proving nutrient balance. Figure 1 provides a schematicrepresentation of the model.
Ecological Dynamics
Building on the work of Hsu et al. (1981) and Abrams(1987c), we consider competition between two consumers(Cj where ) for two resources (Ri where ).j p 1, 2 i p 1, 2The resources Ri each contain two chemical nutrients, aand b, that are essential for consumer growth. Consistentwith previous work on adaptive diet choice (Abrams 1987c;Fox and Vasseur 2008), we assume that each unit of re-source i contains nutrient b relative to nutrient a in thefixed composition ratio
1 � kia p , (1)i k i
where ki is the proportion of each unit of resource i com-posed of nutrient a. In nature, many resource species haveflexible stoichiometry (Sterner and Elser 2002) and dem-onstrate seasonal variation in their nutrient content. Weassume fixed stoichiometry as a first step to allow evo-lutionarily stable strategies (ESSs) to emerge. Two re-sources with identical ai values would be nutritionally sub-stitutable because of their identical stoichiometry; wetherefore require that .a ( a1 2
We assume that each unit of consumer j contains the

Character Displacement and Resource Use 503
Figure 1: Schematic representation of the ecoevolutionary model of competition for complementary resources. Two nutrients (a and b)are essential for two consumers (C1 and C2), but they are available only through the uptake of resources (R1 and R2) that differ in theirrelative compositions of the two nutrients. When the ratio in which a consumer demands nutrients (bj) is bracketed by the ratios in whichthey are supplied by the two resources (ai), resources are complementary. Using an adaptive dynamics model, we investigate how uptakerates (uj) evolve when two consumers compete for complementary resources.
two essential nutrients in the fixed ratio bj, which we referto as the demand ratio. We assume that the two consumershave nonidentical stoichiometry ( ), because pre-b ( b1 2
cisely identical stoichiometries are both empirically im-plausible and would make stable coexistence of both con-sumers impossible (Leon and Tumpson 1975; Hsu et al.1981). The elemental stoichiometry of many heterotrophsis homeostatic (Sterner and Elser 2002; Persson et al.2010), and our model applies best to species such as these.Other heterotrophs exhibit stoichiometric differenceslinked to sex, life stage, season of the year, and othervariables. To focus on adaptation of uptake rates, we as-sume that the demand ratios are evolutionarily inflexibleso that consumers cannot reduce their requirements forwhatever nutrient is limiting. Although there is some evi-dence of evolved changes in nutrient demands (e.g., VanMooy et al. 2009; Vieira-Silva et al. 2010) and geneticvariation among individuals for elemental homeostasis(Jeyasingh et al. 2009), fixed-demand ratios have beendemonstrated in long-term evolution experiments (God-dard and Bradford 2003; Warbrick-Smith et al. 2006). In-corporating adaptive change in nutrient demand or otherphysiological complexities such as interactions among nu-trients would require more explicit description of physi-ology and biochemistry (Andersen et al. 2004; Klausmeieret al. 2007, 2008; Behmer 2009), but it is a plausible avenuefor further research.
We assume without loss of generality that R1 is relatively
rich in nutrient a and R2 is relatively rich in nutrient b(i.e., ). We focus on complementary resources,a ! a1 2
which means that consumer demand ratios are bracketedby the resource composition ratios such that a ! b !1 j
. It is therefore possible for each consumer to eat aa2
nutritionally balanced diet (intake ratio of nutrientsmatching its value) by consuming an appropriate mixbj
of R1 and R2.The dynamics of consumer and resource abundances
are described by chemostat dynamics and linear functionalresponses for simplicity and compatibility with previousmodels (Hsu et al. 1981; Fox and Vasseur 2008):
dR1 p D(S � R ) � R u C , (2a)�1 1 1 j jdt j
dR 2 p D(S � R ) � R (1 � u )C , (2b)�2 2 2 j jdt j
dCj p C [(1 � d )(g � g ) � d ]. (2c)j j aj bj jdt
Resources are supplied in chemostat fashion, where Si isthe supply concentration and D is the dilution rate. Con-sumers are washed out of the system at a rate dj, whichwe assume for generality to be independent of the che-mostat dilution rate D. The total per capita uptake rateof each consumer is fixed at unity, so that neither con-sumer is intrinsically better than the other at resource

504 The American Naturalist
consumption. We implicitly assume that other rate param-eters are scaled relative to the total per capita uptake rate.Consumer j allocates its total per capita uptake effort onR1 and R2 according to a linear trade-off, so that uptakerates are uj and , respectively. Such a trade-off could1 � uj
occur for many reasons, and in assuming such a trade-off, we follow previous theoretical work on the evolutionof resource use under resource competition (e.g., Lawlorand Maynard Smith 1976; Abrams 1987b; Fox and Vasseur2008).
Consumer dynamics depend on the rates at which nu-trients a and b are ingested. These rates in turn are givenby the functional responses of consumers on their re-sources. The rates at which nutrients a and b are ingestedby consumer j (gaj and gbj) are therefore a combination ofthose gained from R1 and R2, given the nutrient compo-sition (ki) and the uptake rates of resources (uj):
g p k u R � k (1 � u )R , (3a)aj 1 j 1 2 j 2
g p (1 � k )u R � (1 � k )(1 � u )R . (3b)bj 1 j 1 2 j 2
Consumers instantaneously balance their nutrient in-take with their nutrient composition by excreting any ex-cess nutrient that cannot be assimilated (due to a paucityof the other nutrient). Herbivores and carnivores areknown to engage in such postingestion nutrient balancing(Simpson and Raubenheimer 1996; Rubio et al. 2005; Clis-sold et al. 2010). The assimilation fraction ( ) is equal1 � dj
to 1 when consumer j ingests nutrients in a ratio thatmatches its demand, . However, wheng /g p bbj aj j
, there is an excess of nutrient b in the diet, equalg /g 1 bbj aj j
to , that is excreted in a nonusable form at nog � g bbj aj j
cost to the consumer. Similarly, when , the excessg /g ! bbj aj j
of nutrient a is excreted in a nonusable form and at nocost. Modeled in this way, the assimilation fraction,
�1g � g b g � g bbj aj j aj bj j1 � d p 1 � max , , (4)j ( )g � g g � gaj bj aj bj
allows consumers to maintain fixed stoichiometry. We as-sume cost-free excretion of excess nutrients in a nonusableform for tractability, recognizing that in reality, processingand excretion of excess nutrients may not be cost free(Mertz 1981; Raubenheimer et al. 2005) and excreted nu-trients typically become available to resource speciesthrough decomposition. We evaluate the potential forcostly ingestion and excretion of excess nutrients to alterour results in appendix C in the online edition of theAmerican Naturalist by incorporating a Type II functionalresponse in our model.
Because nutrients are embedded in different resourcetypes, the ratio of available nutrients (b/a) depends onboth the abundances and the compositions of the two
resources. At equilibrium, the ratio of available essentialnutrients, which we refer to as the “nutrient supply ratio,”is given by
∗ ∗(1 � k )R � (1 � k )R1 1 2 2a p . (5)S ∗ ∗k R � k R1 1 2 2
The nutrient supply ratio is necessarily bounded by thecomposition ratios of the two resources, . Ifa ≤ a ≤ a1 s 2
the composition ratios of resources are reciprocal (a p1
) and resources are equally dense at equilibrium1/a2
( ), then the nutrient supply ratio equals 1. Re-∗ ∗R p R1 2
source densities are affected by consumer feeding, and sothe equilibrium nutrient supply ratio can be affected byan adaptive change in the uptake rates uj, a central issuewe explore below.
An important feature of the ecology of each consumeris its zero-net-growth isocline (ZNGI), which is definedby those combinations of R1 and R2 at which the per capitagrowth rate of consumer j is 0, given its current uj value.The consumers’ ZNGIs are convex intersections of twostraight lines in the R1, R2 plane. As both are expressed asfunctions of R1, the ZNGI’s are given by
�1 �1d (1 � b ) � k u R d b (1 � b ) � (1 � k )u Rj j 1 j 1 j j j 1 j 1R p max , ,2 [ ]k (1 � u ) (1 � k )(1 � u )2 j 2 j
j � (1, 2).
(6)
Each line segment denotes limitation by a different nu-trient. At the intersection of these lines, nutrient uptakeoccurs in the same ratio as that demanded by the con-sumer, and so the consumer is colimited by both nutrients(fig. 2). Adjusting the consumer’s uptake rate shifts theresource levels at which colimitation occurs (fig. 2).
Leon and Tumpson (1975) and Abrams (1987b) statethat a consumer feeding on two complementary resourceswill have a ZNGI that is convex in the R1, R2 plane andthat crosses both resource axes at positive values. OurZNGIs satisfy these criteria, using curves that are piecewiselinear rather than the smooth curves that are illustratedin standard graphical models of resource competition (e.g.,Tilman 1982). Exploring which alternative assumptionswould give rise to smooth ZNGIs is beyond the scope ofthis article.
Evolutionary Dynamics
As in previous work (Fox and Vasseur 2008), we treat theper capita resource uptake rate of consumer j, uj, as aphenotypic trait that can change adaptively over time. Weassume that consumers can adapt to nutrient limitation

Character Displacement and Resource Use 505
Figure 2: Consumer’s zero-net-growth isocline is formed by a con-vex intersection of two line segments in the R1, R2 phase plane givenby equation (5). For comparison, the isocline is shown for two valuesof uj ( , solid black line; , gray line). The intersectionu p 0.4 u p 0.3j j
of the segments denotes the point where consumers are colimited;this point follows a path through the R1, R2 phase space, which canbe found analytically by equating cases of equation (6) (dashed line)and isolating the uptake rate u. Here , , anda p 0.25 b p 0.5 d p
.0.1
only by shifting their diets, and not, for example, by dis-persing to seek better food elsewhere (Behmer 2009) orby altering their nutrient requirements. We model traitchange using “adaptive dynamics” (Taper and Case 1992;Dieckmann and Law 1996; Abrams 2005):
du �[(1/C )(dC /dt)]j j jp n . (7)jdt �uj
The rate parameter nj scales the rate of trait change de-termined by the selection differential (the slope of thefitness gradient in uj, where fitness is measured as theinstantaneous per capita growth rate of consumer j). Equa-tion (7) can be derived in several ways, including as anapproximation of a quantitative genetics model (Iwasa etal. 1991; Taper and Case 1992; Abrams et al. 1993; Dieck-mann and Law 1996; Taylor and Day 1997; Abrams 2005).This fact suggests that equation (7) provides a robust,widely applicable description of adaptive trait change. Thebiological interpretation of the rate parameter nj and therange of biologically reasonable values of nj relative to theother rate parameters in the model depend on the deri-vation (Dieckmann and Law 1996; Taper and Case 1992;Abrams et al. 1993; Taylor and Day 1997). We rely mainly
on equilibrium solutions of our model, where uj has nobearing on our results. We discuss its effect on transientdynamics in appendix B in the online edition of the Amer-ican Naturalist.
Equation (7) is difficult to use in numerical integrationbecause the partial derivative of fitness with respect to thetrait uj is discontinuous. We provide a continuous ap-proximation to equation (7) in appendix B, which is usedto integrate the full ecoevolutionary model.
Numerical and Analytical Methods
When necessary, we numerically integrated the model(eqq. [2]–[4] and [B2] in the online edition of the Amer-ican Naturalist) with a fifth-order Runge-Kutta algorithmimplemented in the IMSL Math/Stat library, using IntelFortran, version 10.1. In order to determine the ecologicalstability of the system at different points in the trait space,we integrated the model in the absence of trait adaptationfor 5,000 time steps, initialized at two different vectors ofpopulation densities (R1, R2, C1, C2) p (0.2, 0.2, 0.1, 1.0)and (0.2, 0.2, 1.0, 0.1), and we assumed extinction to haveoccurred when . Visual inspection of the timeC ! 0.0001j
series ensured that a quantity of 5,000 time steps wassufficient to reach equilibrium (except along bifurcationsand in the case of neutrally stable dynamics). We sampledthe trait space, using a discrete grid and an adaptive al-gorithm that improved resolution at the boundaries be-tween different stability regimes. We used Mathematica,version 7, to symbolically compute or verify the trait valuesgenerating nutrient colimitation for consumers in allo-patry and in sympatry.
Results
Ecological Dynamics in the Absence ofAdaptive Trait Change
To interpret the effects of adaptive trait change, it is usefulto first consider the ecological dynamics (eqq. [2]–[4]) inthe absence of trait change (uj fixed). These dynamics arerich. Assuming that both resources are available (i.e.,
), as many as six equilibria can exist for a givenS 1 0i
parameter set. These correspond to a trivial equilibriumwhere both consumers are absent, two equilibria whereone of the consumers is absent, and between one and threeequilibria for which both consumers coexist (fig. 3). Inaddition, there is a unique set of uptake rates that causesboth branches of the consumer ZNGIs to be overlaid inthe phase space, leading to neutrally stable dynamics.These uptake rates occur only when both consumers arestrongly maladapted (outside the range we discuss below),

506 The American Naturalist
Figure 3: Equilibrium resource densities occur at the intersection between the zero-net-growth isoclines of consumer 1 (black lines) andconsumer 2 (gray lines). In a, there is only a single intersection (circle); however, varying uptake rates (uj) can generate two (b), three (c),or a linear set of equilibria (d; diagonal line) in the positive-valued resource phase space. Dashed lines trace the set of colimitation pointsfor each consumer. Here , , , , and , and , , , anda p 0.25 a p 4.0 b p 0.5 b p 2.0 d p 0.1 (u , u ) p (0.25, 0.25) (0.25, 0.6) (0.25, 0.75)1 2 1 2 1 2
in a–d, respectively.(0.2, 0.8)
and we therefore do not further examine cases of neutralstability arising from overlaid ZNGIs.
The feasibility of an equilibrium at which consumerscoexist requires only that the consumer ZNGIs intersectin the R1, R2 plane. The conditions determining stabilityof this equilibrium are complex, as stable coexistence canarise when consumers are limited by the same nutrientbut are specialized on different resources, or when theyare limited by different nutrients but are specialized onthe same resource. Given this complexity and that theeigenvalues of this system are not analytically solvable, wedetermined the outcome of competition as a function ofper capita resource uptake rates u1 and u2, using numericalmethods and holding other parameters fixed.
Figure 4 shows the outcome of ecological competitionfor a pair of consumers whose nutrient demand ratios aresimilar but reciprocal about the nutrient supply ratio suchthat (we consider this symmetric case1/b p b ! a ! b2 1 s 2
purely for clarity of illustration). We show an extensionof this figure in appendix B, which includes representativeZNGIs for each of the distinct regions.
There are three distinct regions of the trait space inwhich consumers always coexist at equilibrium. In theupper-left and lower-right areas of the u1, u2 plane, con-sumers coexist because they differ in their resource use;each is relatively specialized on a different resource. In theupper-left region, consumers specialize on the resourcewith the nutrient composition that least reflects their de-mand, resulting in strong nutrient limitation (C1 is a lim-ited and C2 is b limited). In the lower-right region, con-sumers specialize on the resource with the compositionthat most reflects their demand, so that C1 is b limitedand C2 is a limited. In the central coexistence region, con-sumers do not strongly differentiate their resource use butare limited by different nutrients for most (but not all)combinations of u1 and u2.
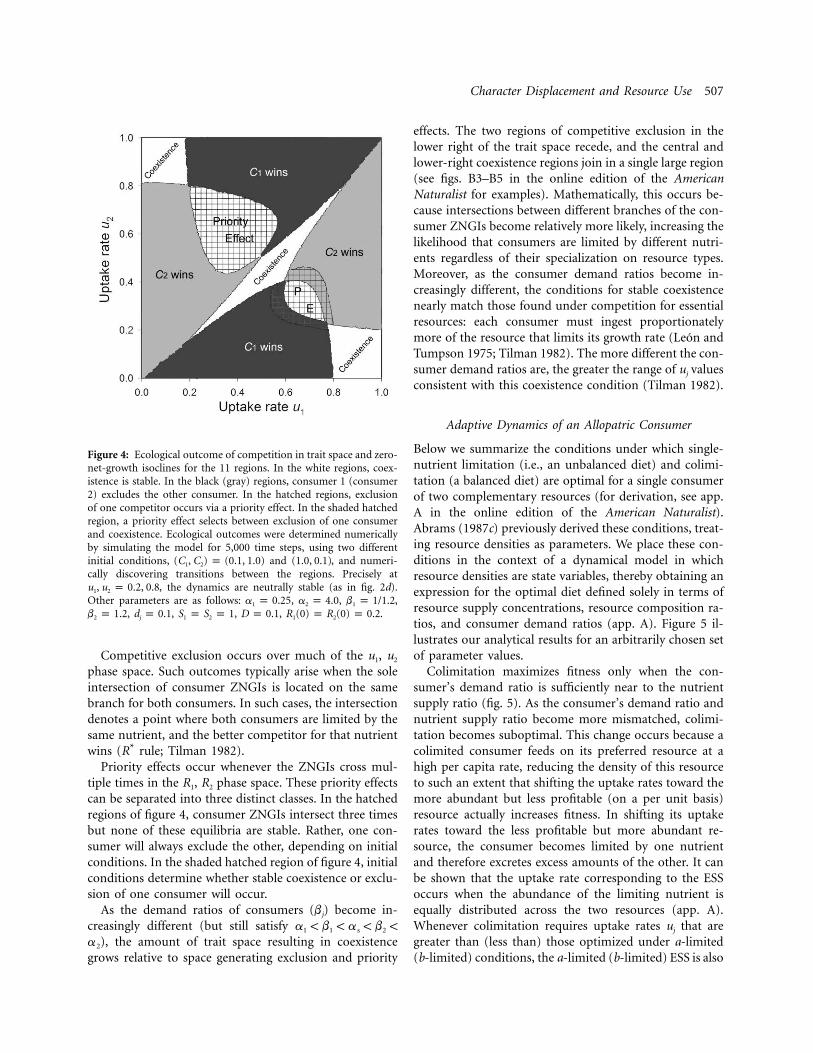
Character Displacement and Resource Use 507
Figure 4: Ecological outcome of competition in trait space and zero-net-growth isoclines for the 11 regions. In the white regions, coex-istence is stable. In the black (gray) regions, consumer 1 (consumer2) excludes the other consumer. In the hatched regions, exclusionof one competitor occurs via a priority effect. In the shaded hatchedregion, a priority effect selects between exclusion of one consumerand coexistence. Ecological outcomes were determined numericallyby simulating the model for 5,000 time steps, using two differentinitial conditions, and , and numeri-(C , C ) p (0.1, 1.0) (1.0, 0.1)1 2
cally discovering transitions between the regions. Precisely at, the dynamics are neutrally stable (as in fig. 2d).u , u p 0.2, 0.81 2
Other parameters are as follows: , , ,a p 0.25 a p 4.0 b p 1/1.21 2 1
, , , , .b p 1.2 d p 0.1 S p S p 1 D p 0.1 R (0) p R (0) p 0.22 j 1 2 1 2
Competitive exclusion occurs over much of the u1, u2
phase space. Such outcomes typically arise when the soleintersection of consumer ZNGIs is located on the samebranch for both consumers. In such cases, the intersectiondenotes a point where both consumers are limited by thesame nutrient, and the better competitor for that nutrientwins (R* rule; Tilman 1982).
Priority effects occur whenever the ZNGIs cross mul-tiple times in the R1, R2 phase space. These priority effectscan be separated into three distinct classes. In the hatchedregions of figure 4, consumer ZNGIs intersect three timesbut none of these equilibria are stable. Rather, one con-sumer will always exclude the other, depending on initialconditions. In the shaded hatched region of figure 4, initialconditions determine whether stable coexistence or exclu-sion of one consumer will occur.
As the demand ratios of consumers (bj) become in-creasingly different (but still satisfy a ! b ! a ! b !1 1 s 2
), the amount of trait space resulting in coexistencea2
grows relative to space generating exclusion and priority
effects. The two regions of competitive exclusion in thelower right of the trait space recede, and the central andlower-right coexistence regions join in a single large region(see figs. B3–B5 in the online edition of the AmericanNaturalist for examples). Mathematically, this occurs be-cause intersections between different branches of the con-sumer ZNGIs become relatively more likely, increasing thelikelihood that consumers are limited by different nutri-ents regardless of their specialization on resource types.Moreover, as the consumer demand ratios become in-creasingly different, the conditions for stable coexistencenearly match those found under competition for essentialresources: each consumer must ingest proportionatelymore of the resource that limits its growth rate (Leon andTumpson 1975; Tilman 1982). The more different the con-sumer demand ratios are, the greater the range of uj valuesconsistent with this coexistence condition (Tilman 1982).
Adaptive Dynamics of an Allopatric Consumer
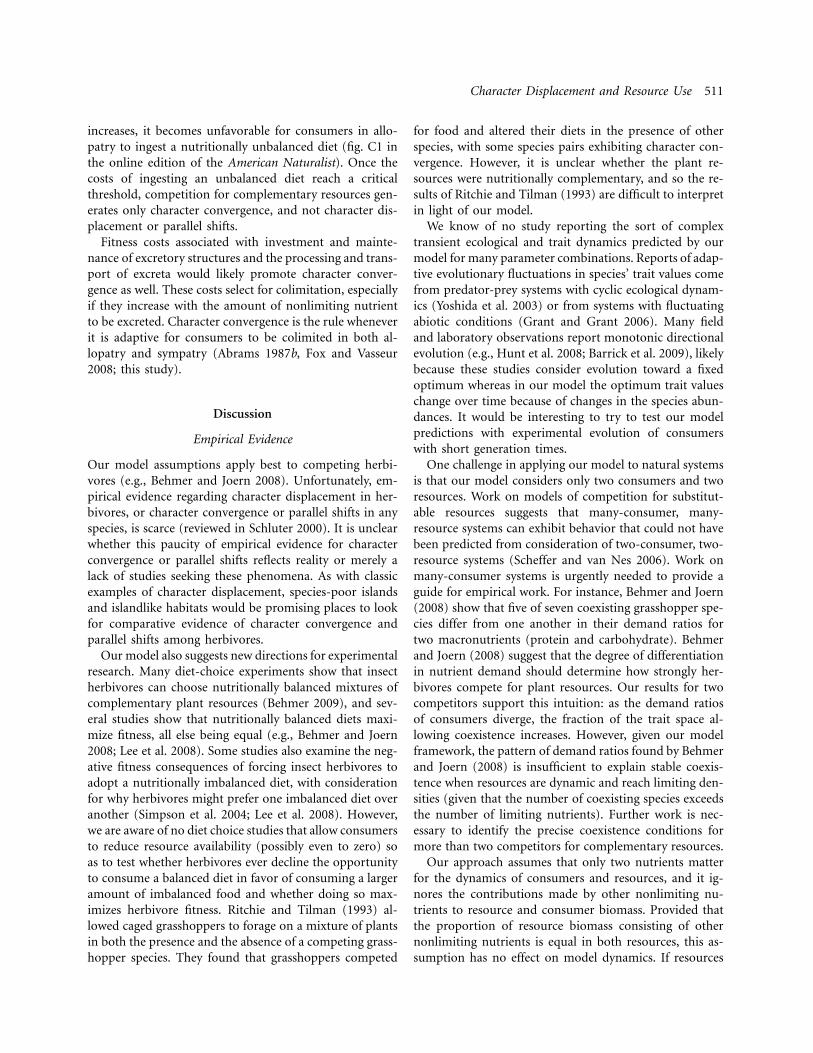
Below we summarize the conditions under which single-nutrient limitation (i.e., an unbalanced diet) and colimi-tation (a balanced diet) are optimal for a single consumerof two complementary resources (for derivation, see app.A in the online edition of the American Naturalist).Abrams (1987c) previously derived these conditions, treat-ing resource densities as parameters. We place these con-ditions in the context of a dynamical model in whichresource densities are state variables, thereby obtaining anexpression for the optimal diet defined solely in terms ofresource supply concentrations, resource composition ra-tios, and consumer demand ratios (app. A). Figure 5 il-lustrates our analytical results for an arbitrarily chosen setof parameter values.
Colimitation maximizes fitness only when the con-sumer’s demand ratio is sufficiently near to the nutrientsupply ratio (fig. 5). As the consumer’s demand ratio andnutrient supply ratio become more mismatched, colimi-tation becomes suboptimal. This change occurs because acolimited consumer feeds on its preferred resource at ahigh per capita rate, reducing the density of this resourceto such an extent that shifting the uptake rates toward themore abundant but less profitable (on a per unit basis)resource actually increases fitness. In shifting its uptakerates toward the less profitable but more abundant re-source, the consumer becomes limited by one nutrientand therefore excretes excess amounts of the other. It canbe shown that the uptake rate corresponding to the ESSoccurs when the abundance of the limiting nutrient isequally distributed across the two resources (app. A).Whenever colimitation requires uptake rates uj that aregreater than (less than) those optimized under a-limited(b-limited) conditions, the a-limited (b-limited) ESS is also

508 The American Naturalist
Figure 5: Trait values leading to the evolutionarily stable strategy (ESS) for a single consumer (allopatry) are given as a function of thedemand ratio (b) by the solid black line. The allopatric ESS follows the curve defining nutrient colimitation only when the demand ratiois sufficiently near to the supply ratio (as). When colimitation requires a more extreme uptake rate than an a-limited or b-limited state,adaptation selects a nutrient-limited ESS. Nutrient-limited states are favored over colimitation because of the dynamic renewal of resources;colimitation by extreme specialization on a single resource leads to reduced density of that resource and release of the other resource fromconsumption pressure. Parameter values are as follows: , , , , .a p 0.25 a p 4.0 d p 0.1 S p S p 1 D p 0.11 2 j 1 2
the convergent stable strategy for a single consumer grow-ing in allopatry. Whenever colimitation requires uptakerates which are intermediate between the a-limited and b-limited ESSs, the colimited state is the convergent stablestrategy for a single consumer growing in allopatry (fig.5).
Interestingly, adaptation in allopatry always “preadapts”consumers of complementary resources to coexist in sym-patry (e.g., fig. 4; app. B). This result reflects the fact thatthe conditions for coexistence are relatively loose undercompetition for complementary resources. Coexistencecan occur independently of the relative rates at which theconsumers take up the two resources, because of the com-plex interplay of nutrient limitation and resource special-ization. In contrast, adaptation in allopatry never pre-adapts consumers of essential resources to coexist insympatry (Fox and Vasseur 2008).
Adaptive Dynamics of Two Consumers in Sympatry:ESS Diets and Coexistence
In sympatry, resource densities and therefore nutrientavailabilities are set by the densities and traits of bothconsumers. Considering only ecological dynamics, it ispossible for two consumers with any combination of non-
identical demand ratios to coexist stably, given an appro-priate choice of uptake rates (e.g., fig. 4; app. B). However,when two consumers have demand ratios that fall eitherboth above or both below the nutrient supply ratio (as),the ESS will always exclude the consumer whose demandratio is most different from the nutrient supply ratio. Com-petitive exclusion occurs because both consumers becomelimited by a single nutrient as their uptake rates adapt.The consumer that can make the best use of the nonlim-iting nutrient will reduce the availability of the limitingnutrient to the greatest extent, thereby excluding its com-petitor in a manner consistent with R* theory (Tilman1982).
Coexistence in sympatry at an ESS therefore requiresthat consumers’ demand ratios fall on opposite sides ofthe nutrient supply ratio (as), and so we assume withoutloss of generality that . In contrasta ! b ! a ! b ! a1 1 s 2 2
to the allopatric case, adaptive consumers coexisting insympatry are always nutrient colimited at equilibrium. Tounderstand why, recall that in allopatry, each consumer’suptake rates adapt so as to achieve colimitation, unlessdoing so would drive the preferred resource to low densityrelative to the other resource. In sympatry, two consumerswith demand ratios that bracket the nutrient supply ratiocomplement one another. Each consumer prefers a dif-

Character Displacement and Resource Use 509
ferent resource, so that neither resource is driven to verylow density relative to the other at equilibrium.
The trait values yielding colimitation of adaptive con-sumers in sympatry can be solved for analytically (app.A). Although it is not necessary to assume equal deathrates, this assumption ( ) simplifies the solutiond p d1 2
for uptake rates at the sympatric nutrient-colimited equi-librium to
1 � k (1 � b )2 ju p . (8)j(S) (k � k )(1 � b )1 2 j
Numerical simulation demonstrates that this trait value isthe evolutionarily and convergent stable strategy when
(app. B).a ! b ! a ! b ! a1 1 s 2 2
For the parameters used herein, the sympatric ESS al-ways falls inside a region of parameter space permittingstable ecological coexistence (fig. 4; app. B). Although ananalytical solution is not feasible, numerical analysis of thedominant eigenvalue of the community matrix suggeststhat this result is robust for all parameterizations whereboth consumers can persist in allopatry (results notshown). This contrasts somewhat with the case of com-petition for essential resources, in which the sympatricoptimum trait values always fall on the boundary of theregion of parameter space permitting ecologically stablecoexistence (although coadaptation stabilizes the resultingdynamics; Fox and Vasseur 2008). Coadaptation of com-petitors for complementary resources (e.g., herbivores)therefore seems more likely to promote stable coexistencethan does coadaptation of competitors for essential re-sources (e.g., primary producers; Abrams 1987b).
Our model predicts that the consumers’ relative abun-dances in sympatry reflect their relative proximity to thenutrient supply ratio (app. B). A consumer whose demandratio more closely reflects the nutrient supply ratio willreach a higher equilibrium density than one whose de-mand ratio is more different, yet the two will coexist. Thissuggests that competitive dominance among herbivores innature may reflect a closer association between the demandand supply of nutrients in common herbivores relative torare ones. Our model provides a scenario in which rarespecies can coexist with common species in an ecologicallystable fashion. This prediction could be tested with dataon the relative abundances and stoichiometries of coex-isting herbivores and plants (e.g., Behmer and Joern 2008).
Adaptive Dynamics of Two Consumers in Sympatry:Character Displacement, Convergence,
and Parallel Shifts
Character displacement, convergence, and parallel shiftsall arise naturally in the context of our simple model under
different demand ratios of the consumers when consumersadapted to allopatric conditions are forced into sympatry.Notably, these situations do not depend on additional bi-ological complexities such as consumer density depen-dence (Abrams 1987a).
When consumer demand ratios are both close to thenutrient supply ratio, and therefore close to one another,adaptive trait change in sympatry leads to character con-vergence (fig. 6). Convergence occurs because consumersmust balance their uptake rates to cope with the reductionin the density of the resource that least matches their de-mand but that best matches and is preferred by the otherconsumer. Each must adapt to gain a larger share of theircompetitor’s preferred resource, and so adaptation yieldscharacter convergence. Of course, the transient ecologicaland evolutionary dynamics can be complex and can in-clude temporary changes in the direction of selection (seeapp. B), but the ultimate equilibrium outcome is characterconvergence. In this case, competition for complementaryresources has the same effect on consumer traits as com-petition for nutritionally essential resources (Abrams1987b; Fox and Vasseur 2008). Resource competition leadsto character convergence when it is adaptive for consumersto be colimited in both allopatry and sympatry.
When consumers’ demand ratios are far from the supplyratio and each is closely matched to the composition of aparticular resource, coadaptation in sympatry generatescharacter displacement (fig. 6). The pattern arises becausethe allopatric optima represent nutrient-limited stateswhere consumers ingest their preferred resource at a lowerrate than is required to achieve colimitation because lesspreferred resources are abundant. In sympatry, consumersdrive down the abundance of these less preferred resources,and the benefit of ingesting a nutrient-limited diet is lost.Fitness increases when ingestion rates diverge toward co-limited states (fig. 6). In this case, competition for com-plementary resources has the same effect on consumertraits as competition for nutritionally substitutable re-sources (Lawlor and Maynard Smith 1976). However,character displacement in the case considered here arisesfor different reasons. Under competition for substitutableresources, nutrient limitation or colimitation is nonexist-ent; instead, consumers diverge to gain access to resourcesthat are underutilized on a per capita basis, thereby in-creasing their total resource uptake rate.
In the case where the nutrient demands of consumersare sufficiently asymmetric about the nutrient supply ratio(one is close to the nutrient supply ratio, and the otheris far from it), coadaptation in sympatry causes both con-sumers’ uptake rates to change in the same direction (fig.6). For brevity, we refer to this as “parallel” adaptation,even though the uptake rates generally do not change instrictly parallel fashion. Such parallel character shifts do

510 The American Naturalist
Figure 6: Trait values at the sympatric and allopatric evolutionarily stable strategies (ESSs), as a function of the demand ratio (b), are givenby the solid black line and the gray line, respectively. Preadaptation to allopatric conditions leads to three possible relative directions oftrait adaptation in sympatry: consumers with demand ratios corresponding to A and B demonstrate trait convergence, C and D representtrait divergence, and A and D (and C and B) represent parallel trait shifts. Pairings A and C and B and D are ecologically unstable at theirevolutionary optimum because both consumers have demand ratios on the same side of the supply ratio (as); the more proximate consumerto the supply ratio will exclude the other as adaptation occurs. Exemplary transient dynamics are shown in appendix B in the online editionof the American Naturalist. Parameter values are as follows: , , , , .a p 0.25 a p 4.0 d p d p 0.1 S p S p 1 D p 0.11 2 1 2 1 2
not occur in otherwise similar models of competition foressential or substitutable resources (Lawlor and MaynardSmith 1976; Abrams 1987b; Fox and Vasseur 2008).
Transient Ecoevolutionary Dynamics
The results presented so far describe stable equilibriumbehavior. However, recent empirical studies reveal the abil-ity of sufficiently rapid adaptive evolution to alter ecolog-ical dynamics (Yoshida et al. 2003; Carroll et al. 2007; Duffyand Sivars-Becker 2007), suggesting that transient dynam-ics may be complicated by ecoevolutionary feedbacks. Inappendix B, we illustrate the transient dynamics of the fullmodel for cases of convergent, divergent, and parallel evo-lution of competitors from their allopatric optima.
Two key points emerge from our numerical explorationsof transient dynamics. First, adaptive trait change oftenexhibits temporary reversals in direction for one or bothconsumers (similar to models of competition for essentialresources; Fox and Vasseur 2008). Second, even thoughadaptation ultimately favors stable coexistence in ourmodel, the transient dynamics can be characterized by longperiods of near extinction in one or both consumers (app.B). In nature, demographic and environmental stochas-
ticity would likely convert these near extinctions to actualextinctions. Rapid adaptation reduces or eliminates nearextinctions by causing the system to quickly adapt throughregions to trait space leading to priority effects or com-petitive exclusion. This suggests that rapid trait changesvia behavioral shifts or mediated by substantial geneticvariation may be more conducive to ecological coexistence.
Including Costly Ingestion of an Unbalanced Diet
Ingesting an unbalanced diet and excreting excess nutri-ents without cost is an unlikely assumption in nature.Costs may be associated with investment and maintenanceof excretory structures, the energy required to process andtransport excreta, or the opportunity cost of time spentingesting nutrients that have no benefit to growth. In ap-pendix C we explore the third effect by incorporating asaturating Type II functional response in our model. Wesummarize the main results here.
Assuming that handling times are equal for allconsumer-resource pairs, increasing handling time influ-ences only the ESS of consumers in allopatry; becauseconsumers ingest a nutritionally balanced diet in sympatry,there is no opportunity cost to be paid. As handling time
Character Displacement and Resource Use 511
increases, it becomes unfavorable for consumers in allo-patry to ingest a nutritionally unbalanced diet (fig. C1 inthe online edition of the American Naturalist). Once thecosts of ingesting an unbalanced diet reach a criticalthreshold, competition for complementary resources gen-erates only character convergence, and not character dis-placement or parallel shifts.
Fitness costs associated with investment and mainte-nance of excretory structures and the processing and trans-port of excreta would likely promote character conver-gence as well. These costs select for colimitation, especiallyif they increase with the amount of nonlimiting nutrientto be excreted. Character convergence is the rule wheneverit is adaptive for consumers to be colimited in both al-lopatry and sympatry (Abrams 1987b, Fox and Vasseur2008; this study).
Discussion
Empirical Evidence
Our model assumptions apply best to competing herbi-vores (e.g., Behmer and Joern 2008). Unfortunately, em-pirical evidence regarding character displacement in her-bivores, or character convergence or parallel shifts in anyspecies, is scarce (reviewed in Schluter 2000). It is unclearwhether this paucity of empirical evidence for characterconvergence or parallel shifts reflects reality or merely alack of studies seeking these phenomena. As with classicexamples of character displacement, species-poor islandsand islandlike habitats would be promising places to lookfor comparative evidence of character convergence andparallel shifts among herbivores.
Our model also suggests new directions for experimentalresearch. Many diet-choice experiments show that insectherbivores can choose nutritionally balanced mixtures ofcomplementary plant resources (Behmer 2009), and sev-eral studies show that nutritionally balanced diets maxi-mize fitness, all else being equal (e.g., Behmer and Joern2008; Lee et al. 2008). Some studies also examine the neg-ative fitness consequences of forcing insect herbivores toadopt a nutritionally imbalanced diet, with considerationfor why herbivores might prefer one imbalanced diet overanother (Simpson et al. 2004; Lee et al. 2008). However,we are aware of no diet choice studies that allow consumersto reduce resource availability (possibly even to zero) soas to test whether herbivores ever decline the opportunityto consume a balanced diet in favor of consuming a largeramount of imbalanced food and whether doing so max-imizes herbivore fitness. Ritchie and Tilman (1993) al-lowed caged grasshoppers to forage on a mixture of plantsin both the presence and the absence of a competing grass-hopper species. They found that grasshoppers competed
for food and altered their diets in the presence of otherspecies, with some species pairs exhibiting character con-vergence. However, it is unclear whether the plant re-sources were nutritionally complementary, and so the re-sults of Ritchie and Tilman (1993) are difficult to interpretin light of our model.
We know of no study reporting the sort of complextransient ecological and trait dynamics predicted by ourmodel for many parameter combinations. Reports of adap-tive evolutionary fluctuations in species’ trait values comefrom predator-prey systems with cyclic ecological dynam-ics (Yoshida et al. 2003) or from systems with fluctuatingabiotic conditions (Grant and Grant 2006). Many fieldand laboratory observations report monotonic directionalevolution (e.g., Hunt et al. 2008; Barrick et al. 2009), likelybecause these studies consider evolution toward a fixedoptimum whereas in our model the optimum trait valueschange over time because of changes in the species abun-dances. It would be interesting to try to test our modelpredictions with experimental evolution of consumerswith short generation times.
One challenge in applying our model to natural systemsis that our model considers only two consumers and tworesources. Work on models of competition for substitut-able resources suggests that many-consumer, many-resource systems can exhibit behavior that could not havebeen predicted from consideration of two-consumer, two-resource systems (Scheffer and van Nes 2006). Work onmany-consumer systems is urgently needed to provide aguide for empirical work. For instance, Behmer and Joern(2008) show that five of seven coexisting grasshopper spe-cies differ from one another in their demand ratios fortwo macronutrients (protein and carbohydrate). Behmerand Joern (2008) suggest that the degree of differentiationin nutrient demand should determine how strongly her-bivores compete for plant resources. Our results for twocompetitors support this intuition: as the demand ratiosof consumers diverge, the fraction of the trait space al-lowing coexistence increases. However, given our modelframework, the pattern of demand ratios found by Behmerand Joern (2008) is insufficient to explain stable coexis-tence when resources are dynamic and reach limiting den-sities (given that the number of coexisting species exceedsthe number of limiting nutrients). Further work is nec-essary to identify the precise coexistence conditions formore than two competitors for complementary resources.
Our approach assumes that only two nutrients matterfor the dynamics of consumers and resources, and it ig-nores the contributions made by other nonlimiting nu-trients to resource and consumer biomass. Provided thatthe proportion of resource biomass consisting of othernonlimiting nutrients is equal in both resources, this as-sumption has no effect on model dynamics. If resources

512 The American Naturalist
differ in their proportions of other nonlimiting resources,optimal uptake rates will shift to reflect the absolute avail-ability of limiting nutrients in the two resources. Explicitlyconsidering the contribution of more than two nutrienttypes provides the potential for additional consumers tocoexist at equilibrium. One complication that arises in thecontext of many-consumer, many-resource models is thatresources that are complementary for one consumer canbe substitutable for another consumer. In the two-consumer, two-resource case, this situation leads to com-petitive exclusion with or without adaptive trait change,but we suspect that it might not do so in a multiple-consumer, multiple-resource system.
Conclusion: Character Shifts as Epiphenomena
Our results, together with those of others (Abrams 1987b;Fox and Vasseur 2008), show that the whole concept of“resource-use overlap” is useful only in the context ofcompetition for substitutable resources. In the case of sub-stitutable resources, an individual consumer that reducesits resource-use overlap with other individuals gains fitnessbecause it focuses its foraging effort on resources for whichthere is little competition (i.e., resources that are in highabundance on a per consumer basis). However, in the casesof complementary or essential resources, limitation bytheir nutrient content must be taken into account (Abrams1987b; Fox and Vasseur 2008; this study). For example,we have shown that when nutrients limit growth (as op-posed to limiting resource densities themselves), reducingresource overlap via character divergence rarely providesaccess to more of the limiting nutrient. Fitness is thereforedisconnected from resource-use overlap and depends in-stead on gaining access to the limiting nutrients containedin resources (see also Abrams 1990). When competitionis for complementary or essential resources, resource-useoverlap between consumers is an epiphenomenon, andconsidering resource-use overlap does not aid in under-standing how resource competition translates into selec-tion pressure on resource-use traits.
A further reason for regarding character displacement,convergence, and parallel shifts as epiphenomena whencompetition is for nonsubstitutable resources is the factthat they have no effect on the stability of coexistence.The simplest theoretical models predict that coadaptationof competitors always leads to stable coexistence, evenwhen coadaptation leads to character convergence (Lawlorand Maynard Smith 1976; Fox and Vasseur 2008; thisstudy). This conclusion contrasts with previous verbal ar-guments claiming that character convergence leads to neu-trally stable dynamics (Hubbell and Foster 1986), as wellas with “competition” models, where selection is actuallyimposed by external abiotic conditions rather than by re-
source levels (Hubbell 2006). It is essential to explicitlymodel consumer and resource dynamics and the feedbacksbetween trait change and ecological change in order tocorrectly derive the effects of resource competition oncompetitor traits and system stability.
Acknowledgments
S. Behmer and an anonymous reviewer provided valuablecomments on this manuscript. D.A.V. acknowledges thesupport of Yale University.
Literature Cited
Abrams, P. A. 1987a. Alternative models for character displacement.II. Displacement when there is competition for a single resource.American Naturalist 130:271–282.
———. 1987b. Alternative models of character displacement andniche shift. I. Adaptive shifts in resource use when there is com-petition for nutritionally nonsubstitutable resources. Evolution 41:651–661.
———. 1987c. The functional responses of adaptive consumers oftwo resources. Theoretical Population Biology 32:262–288.
———. 1990. Mixed responses to resource densities and their im-plications for character displacement. Evolutionary Ecology 4: 93–102.
———. 1996. Evolution and the consequences of species introduc-tions and deletions. Ecology 77:1321–1328.
———. 2005. “Adaptive Dynamics” vs. “adaptive dynamics.” Journalof Evolutionary Biology 18:1162–1165.
Abrams, P. A., H. Matsuda, and Y. Harada. 1993. Evolutionarilyunstable fitness maxima and stable fitness minima of continuoustraits. Evolutionary Ecology 7:465–487.
Andersen, T., and D. O. Hessen. 1991. Carbon, nitrogen and phos-phorus content of freshwater zooplankton. Limnology and Ocean-ography 36:807–814.
Andersen, T., J. J. Elser, and D. O. Hessen. 2004. Stoichiometry andpopulation dynamics. Ecology Letters 7:884–900.
Anderson, T. R., D. O. Hessen, J. J. Elser, and J. Urabe. 2005. Met-abolic stoichiometry and the fate of excess carbon and nutrientsin consumers. American Naturalist 165:1–15.
Barrick, J. E., D. S. Yu, S. H. Yoon, H. Jeong, T. K. Oh, D. Schneider,R. E. Lenski, and J. F. Kim. 2009. Genome evolution and adaptationin a long-term experiment with Escherichia coli. Nature 461:1243–1247.
Behmer, S. T. 2009. Insect herbivore nutrient regulation. AnnualReview of Entomology 54:165–187.
Behmer, S. T., and A. Joern. 2008. Coexisting generalist herbivoresoccupy unique nutritional feeding niches. Proceedings of the Na-tional Academy of Sciences of the USA 105:1977–1982.
Behmer, S. T., D. Raubenheimer, and S. J. Simpson. 2001. Frequency-dependent food selection in locusts: a geometric analysis of therole of nutrient balancing. Animal Behaviour 61:995–1005.
Behmer, S. T., E. Cox, D. Raubenheimer, and S. J. Simpson. 2003.Food distance and its effect on nutrient balancing in a mobileinsect herbivore. Animal Behaviour 66:665–675.

Character Displacement and Resource Use 513
Carroll, S. P., A. P. Hendry, D. N. Reznick, and C. W. Fox. 2007.Evolution on ecological time-scales. Functional Ecology 21:387–393.
Clissold, F. J., B. J. Tedder, A. D. Conigrave, and S. J. Simpson. 2010.The gastrointestinal tract as a nutrient-balancing organ. Proceed-ings of the Royal Society B: Biological Sciences 277:1751–1759.
Dieckmann, U., and R. Law. 1996. The dynamical theory of coevo-lution: a derivation from stochastic ecological processes. Journalof Mathematical Biology 34:579–612.
Duffy, M., and L. Sivars-Becker. 2007. Rapid evolution and ecologicalhost–parasite dynamics. Ecology Letters 10:44–53.
Elser, J. J. and J. Urabe. 1999. The stoichiometry of consumer-drivennutrient cycling: theory, observations, and consequences. Ecology80:735–751.
Fox, J. F., and D. A. Vasseur. 2008. Character convergence undercompetition for nutritionally essential resources. American Nat-uralist 172:667–680.
Geider, R. J., and J. LaRoche. 2002. Redfield revisited: variability ofC : N : P in marine macroalgae and its biochemical basis. EuropeanJournal of Phycology 37:1–17.
Goddard, M. R., and M. A. Bradford. 2003. The adaptive responseof a natural microbial population to carbon- and nitrogen-limi-tation. Ecology Letters 6:594–598.
Grant, P. R., and B. R. Grant. 2006. Evolution of character displace-ment in Darwin’s finches. Science 313:224–226.
Grover, J. 2002. Stoichiometry, herbivory and competition for nu-trients: simple models based on planktonic ecosystems. Journal ofTheoretical Biology 214:599–618.
Hawlena, D., and O. J. Schmitz. 2010. Herbivore physiological re-sponse to predation risk and implications for ecosystem nutrientdynamics. Proceedings of the National Academy of Sciences of theUSA 107:15503–15507.
Hsu, S.-B., K.-S. Cheng, and S. P. Hubbell. 1981. Exploitative com-petition of microorganisms for two complementary nutrients incontinuous cultures. SIAM Journal of Applied Mathematics 41:422–444.
Hubbell, S. P. 2006. Neutral theory and the evolution of ecologicalequivalence. Ecology 87:1387–1398.
Hubbell, S. P., and R. B. Foster. 1986. Biology, chance, history andthe structure of tropical rainforest communities. Pages 314–329in J. Diamond and T. J. Case, eds. Community ecology. Harper& Row, New York.
Hunt, G., M. A. Bell, and M. P. Travis. 2008. Evolution toward anew adaptive optimum: phenotypic evolution in a fossil sticklebacklineage. Evolution 62:700–710.
Iwasa, Y., A. Pomiankowski, and S. Nee. 1991. The evolution of costlymate preferences. II. The “handicap” principle. Evolution 45:1431–1442.
Jeyasingh, P. D, L. J. Weider, and R. W. Sterner. 2009. Genetically-based trade-offs in response to stoichiometric food quality influ-ence competition in a keystone aquatic herbivore. Ecology Letters12:1229–1237.
Klausmeier, C. A., E. Litchman, and S. A. Levin. 2007. A model offlexible uptake of two essential resources. Journal of TheoreticalBiology 246:278–289.
Klausmeier, C. A., E. Litchman, T. Daufresne, and S. A. Levin. 2008.Phytoplankton stoichiometry. Ecological Research 23:479–485.
Lawlor, L. R., and J. Maynard Smith. 1976. The coevolution andstability of competing species. American Naturalist 110:79–99.
Lee, K. P., S. J. Simpson, F. J. Clissold, R. Brooks, J. W. O. Ballard,
P. W. Taylor, N. Soran, and D. Raubenheimer. 2008. Lifespan andreproduction in Drosophila: new insights from nutritional geom-etry. Proceedings of the National Academy of Sciences of the USA105:2498–2503.
Leon, J. A., and D. B. Tumpson. 1975. Competition between twospecies for two complementary or substitutable resources. Journalof Theoretical Biology 50:185–201.
Mayntz, D., D. Raubenheimer, M. Salomon, S. Toft, and S. J. Simp-son. 2005. Nutrient-specific foraging in invertebrate predators. Sci-ence 307:111–113.
Mertz, W. 1981. The essential trace elements. Science 213:1332–1338.Persson, J., P. Fink, A. Goto, J. M. Hood, J. Jonas, and S. Kato. 2010.
To be or not to be what you eat: regulation of stoichiometrichomeostasis among autotrophs and heterotrophs. Oikos 119:737–740.
Raubenheimer, D., K. P. Lee, and S. J. Simpson. 2005. Does Bertrand’sRule apply to macronutrients? Proceedings of the Royal SocietyB: Biological Sciences 272:2429–2434.
Rhoades, D. F. 1985. Offensive-defensive interactions between her-bivores and plants: their relevance in herbivore population dy-namics and ecological theory. American Naturalist 125:205–238.
Ritchie, M. E., and D. Tilman. 1993. Predictions of species inter-actions from consumer-resource theory: experimental tests withgrasshoppers and plants. Oecologia (Berlin) 94: 516–527.
Rubio, V. C., F. J. Sanchez-Vazquez, and J. A Madrid. 2005. Fishmacronutrient selection through post-ingestive signals: effect ofselective macronutrient deprivation. Physiology and Behavior 84:651–657.
Scheffer, M., and E. van Nes. 2006. Self-organized similarity, theevolutionary emergence of groups of similar species. Proceedingsof the National Academy of Sciences of the USA 103:6230–6235.
Schluter, D. 2000. Ecological character displacement in adaptive ra-diation. American Naturalist 156(suppl.):S4–S16.
Schreiber, S. J., and G. A. Tobiason. 2003. The evolution of resourceuse. Mathematical Biology 47:56–78.
Simpson, S. J., and D. Raubenheimer. 1996. Feeding behaviour, sen-sory physiology and nutrient feedback: a unifying model. Ento-mologia Experimentalis et Applicata 80:55–64.
Simpson, S. J., R. M. Sibly, K. P. Lee, S. T. Behmer, and D. Rauben-heimer. 2004. Optimal foraging when regulating intake of multiplenutrients. Animal Behaviour 68:1299–1311.
Simpson, S. J., D. Raubenheimer, M. A. Charleston, and F. J. Clissold.2009. Modelling nutritional interactions: from individuals to com-munities. Trends in Ecology & Evolution 25:53–60.
Sterner, R. W., and J. J. Elser. 2002. Ecological stoichiometry: thebiology of elements from molecules to the biosphere. PrincetonUniversity Press, Princeton, NJ.
Taper, M. L., and T. J. Case. 1992. Models of character displacementand the theoretical robustness of taxon cycles. Evolution 46:317–333.
Taylor, P., and T. Day. 1997. Evolutionary stability under the repli-cator and the gradient dynamics. Evolutionary Ecology 11:579–590.
Tilman, D. 1982. Resource competition and community structure.Princeton University Press, Princeton, NJ.
Van Mooy, B. A. S., H. F. Fredricks, B. E. Pedler, S. T. Dyhrman, D.M. Karl, M. Koblizek, M. W. Lomas, et al. 2009. Phytoplanktonin the ocean use non-phosphorus lipids in response to phosphorusscarcity. Nature 458:69–72.
Vieira-Silva, S., M. Touchon, and E. P. C. Rocha. 2010. No evidence

514 The American Naturalist
for elemental-based streamlining of prokaryotic genomes. Trendsin Ecology & Evolution 25:319–320.
Warbrick-Smith, J., S. T. Behmer, K. P. Lee, D. Raubenheimer, andS. J. Simpson. 2006. Evolving resistance to obesity in an insect.Proceedings of the National Academy of Sciences of the USA 103:14045–14049.
Yoshida, T., L. E. Jones, S. P. Ellner, G. F. Fussmann, and N. G.
Hairston Jr. 2003. Rapid evolution drives ecological dynamics ina predator-prey system. Nature 424:303–306.
York, H. A., and S. Billings. 2009. Stable isotope analysis of diets ofshort-tailed fruit bats (Chiroptera: Phyllostomidae: Carollia). Jour-nal of Mammalogy 90:1469–1477.
Associate Editor: Frederick R. AdlerEditor: Mark A. McPeek
Lycosa. “The holes were from six to eight inches deep and lined with a delicate web.... Before opening the holes we sounded them withstraws and tried to provoke the spiders to come out, but they took no notice of it.” From “The Lycosa at Home” by J. H. Emerton (AmericanNaturalist, 1871, 4:664–665).

1
� 2011 by The University of Chicago. All rights reserved. DOI: 10.1086/661896
Appendix A from D. A. Vasseur and J. W. Fox, “Adaptive Dynamicsof Competition for Nutritionally Complementary Resources: CharacterConvergence, Displacement, and Parallelism”(Am. Nat., vol. 178, no. 4, p. 000)
Derivations of the Allopatric and Sympatric Evolutionarily Stable StrategiesThe Single-Species Evolutionarily Stable Strategy
Abrams (1987c) derived the conditions at which a single consumer will evolve to be colimited, or single-nutrientlimited, when growing on two complementary resources (what he called “complementarily substitutable”). Wereiterate those conditions here, using the formalism of our model (eqq. [1]–[3]).
Under limitation by nutrienta, the rate of ingestion of nutrientb relative to that ofa exceeds the demand suchthat . Then the optimal uptake rate occurs when the total amount of nutrienta is equally distributedg /g 1 bb a
across resources (Abrams 1987c) such that
k R � k R p 0. (A1)1 1 2 2
In the opposing case, where nutrientb is limiting such that ,g /g ! bb a
(1 � k )R � (1 � k )R p 0 (A2)1 1 2 2
yields the optimal uptake rate. Substituting these equations respectively into thea- andb-limited branches of theconsumer isoclines (eq. [6]) yields expressions for the equilibrium density of resourcesR1 andR2 under nutrienta and nutrientb limitation, which we denote with additional subscripts:
dR p ,1(a) k (1 � b)1
dbR p ,1(b) (1 � k )(1 � b)1 (A3)
dR p ,2(a) k (1 � b)2
dbR p .2(b) (1 � k )(1 � b)2
From equation (2), we also find that at equilibrium, and (for theR p DS /(uC � D) R p DS /[(1 � u)C � D]1 1 2 2
sake of simplicity we have dropped the subscripts from the consumer’s parameters in the allopatric calculations).Equating these expressions with those in equation (A3) under nutrienta limitation yields two expressions for theequilibrium consumer density, which can be combined to solve for the optimal uptake rate under limitation ofa:
S k (1 � b) � d1 1u p . (A4a)(a) S k (1 � b) � S k (1 � b) � 2d1 1 2 2
Similar logic yields the optimal uptake rate underb limitation:
S (1 � k )(1 � b) � db1 1u p . (A4b)(b) S (1 � k )(1 � b) � S (1 � k )(1 � b) � 2db1 1 2 2
In addition to the single-nutrient-limited states, colimitation by both nutrients can occur. Arbitrarily assuming

Appendix A from D. A. Vasseur and J. W. Fox, Character Displacement and Resource Use
2
that each unit of resource 1 has an excess of nutrienta and each unit of resource 2 has an excess of nutrientbrelative to the requirements of the consumer (such that ) yields the following requirements fora ! b ! a1 2
colimitation of a single consumer (Abrams 1987c):
k R � k R ! 0,1 1 2 2 (A5)
(1 � k )R � (1 � k )R 1 0.1 1 2 2
Simply stated, colimitation will occur when there is a relatively larger total amount of nutrienta bound inR2 anda relatively larger amount of nutrientb bound inR1. Colimitation implies that the ratio of ingested nutrientsmatches the demand , which can be expanded with equation (3) to yieldg /g p bb a
b[k uR � k (1 � u)R ] p (1 � k )uR � (1 � k )(1 � u)R , (A6)1 1 2 2 1 1 2 2
and that assimilation efficiency is unity ( ), which yields the expression (from eq. [2a])d p 0 g � g � d p 0a b
whenC is at equilibrium. As above, this expression and equation (A6) can be used to solve the equilibriumconsumer density. When equated, and after some rearrangement, these yield an expression of the optimal uptakerate under nutrient colimitation:
2 2 2 2 2 2�2dh h � (1 � b)(k � k )(S h � S h ) � 4d h h � (1 � b) (k � k ) (S h � S h )1 2 1 2 1 1 2 2 1 2 1 2 1 1 2 2
u p , (A7)(C) 2(1� b)(k � k )(S h � S h )2 1 1 1 2 2
where and . This expression produces theS-shaped function of log(b)h p bk � k � 1 h p bk � k � 11 1 1 2 2 2
shown in figures 5 and 6. Note that the domain of this function is bounded by the resource composition ratio.When the consumer demand ratio equals the composition ratio of one of the two resources, colimitation requiresthat the other resource be dropped from the diet.
The Evolutionarily Stable Strategy for Two Consumers and Two Resources
Numerical simulation of the model shows that whenever consumer demand ratiosbj fall on opposite sides of thesupply ratioas (eq. [5]) and within the range of resource composition ratios (a1, a2), adaptation of the uptakerates leads to an ecologically stable equilibrium where both consumers are colimited by uptake of nutrientsa andb. The trait values yielding colimitation can be solved analytically because of a notable invariance in the loci ofthe colimitation points in theu1, u2 phase space. We can show this clearly by assuming colimitation of bothconsumers and setting and . This yields a linear system of two equations and twodN /dt p 0 dN /dt p 01 2
unknowns (R1, R2):
u R � (1 � u )R p d , (A8)j 1 j 2 j
where . Solving forR1 andR2, we find the following equilibrium resource densities:j p 1, 2
d (1 � u ) � d (1 � u )1 2 2 1*R p ,1(S) u � u1 2 (A9)
d u � d u1 2 2 1*R p .2(S) u � u2 1
When equal rates of consumer death are assumed, that is, , the solution simplifies tod p d p d R p R p1 2 1(S) 2(S)
. Equation (A9) shows that when both consumers are colimited, their demand ratios (bj) have no impact ondequilibrium resource densities. This notable invariance arises because demand ratios and equilibrium consumerdensities are compensatory; consumers that have demand ratios that are nearer to the supply ratio obtain higherequilibrium densities than do those with demand ratios further from the supply ratio (see app. B; fig. B5).
Given these constraints on the equilibrium resource densities, we can solve for the values of uptake ratesuj
that occur at the sympatric optimum by substitutingR1(S) andR2(S) into the equations for colimitation (g /g p bbj aj j
for ). When consumer death rates are nonidentical, the solutions for the optimum uptake rates inj p 1, 2sympatryuj(S) are obtainable but so complicated that they are analytically uninformative. However, assuming

Appendix A from D. A. Vasseur and J. W. Fox, Character Displacement and Resource Use
3
equal rates of consumer death ( ), the solution for optimal uptake rates at the sympatric colimitedd p d1 2
equilibrium simplify to
1 � k (1 � b )2 ju p . (A10)j(S) (k � k )(1 � b )1 2 j

1
� 2011 by The University of Chicago. All rights reserved. DOI: 10.1086/661896
Appendix B from D. A. Vasseur and J. W. Fox, “Adaptive Dynamicsof Competition for Nutritionally Complementary Resources: CharacterConvergence, Displacement, and Parallelism”(Am. Nat., vol. 178, no. 4, p. 000)
Transient Dynamics of the Coupled Ecoevolutionary ModelIn order to integrate the full ecoevolutionary model, we must first replace equation (7), which is difficult to usein numerical integration because of the discontinuity in the selection differential, with a continuousapproximation. First, by expanding the selection differential from equation (7), we find
⎧(1� b )�g gj aj bj, 1 b when nutrient a is limiting,j�u gj aj⎪�[(1/C )(dC /dt)] (1� 1/b )�g gj j j bj bjp , ! b when nutrient b is limiting, (B1)⎨ j
�u �u gj j aj
gbj⎪0, p b when colimited.jg⎩ aj
As has been done in previous work (Klausmeier et al. 2007; Fox and Vasseur 2008), we approximate thediscontinuous function (8), using a steep continuous sigmoid function:
du (1� b )�g [1� (1/b )]�g [1� (1/b )]�gj j aj j bj j bjp n f(x , h) � � , (B2)j j( ){ }dt �u �u �uj j j
where , , ,�1 �1f(x , h) p 0.5� p tan (h# x ) x p g � g b �g /�u p k R � k R �g /�u p (1� k )R � (1�j j j bj aj j aj j 1 1 2 2 bj j 1 1
, and . Given this large value of h, the function resolves to a value of 1 for nearly allk )R h p 1,000,000 f(7)2 2
positive values of xj and 0 for nearly all negative values of xj. This makes equation (B2) a very closeapproximation of the discontinuous equation (B1).With this modified version of the trait-change model, we conduct a series of in silico common garden
experiments by initiating numerical simulations of the two-consumer, two-resource model at the optimal traitvalues derived for single consumers (allopatry). Traits (consumer uptake rates) vary according to equation (B2),which in turn generates feedback between the ecological and the evolutionary dynamics. This feedback dependsin large part on the stability of the underlying ecological system. Figure B1 shows the ecological outcome ofcompetition in the trait space, along with representative consumer zero-net-growth isoclines for each region.Figures B2–B5 show the results of these experiments for the different combinations of consumer demand ratios(bj) noted in figure 6 of the main text. Each of these figures consists of two parts. In part a, the temporaldynamics of the consumer uptake rates in the u1, u2 trait space are superimposed over the trait space, whereshaded regions indicate different outcomes of ecological competition (in the absence of trait change). In part b,the temporal dynamics of resources and consumers are shown. Because the rate of evolutionary change is slowrelative to the rate of ecological change, competitive outcomes are important for determining the direction andrates of trait changes. In each of these experiments, consumer C1 is afforded a slight advantage in initial density(�1%) so that priority effects can be observed.Figure B1 shows the ecoevolutionary trajectory of the system when two consumers evolve from the allopatric
conditions labeled A and B in figure 6. These conditions correspond to consumers that have nutrient demandratios that are reciprocal and near to the nutrient supply ratio (as). Initially, the two consumers coexist throughstrong partitioning of their resource use. Adaptation causes their uptake rates to converge, and they enter a

Appendix B from D. A. Vasseur and J. W. Fox, Character Displacement and Resource Use
2
region of trait space where priority effects occur (fig. B2, gray area). The initial advantage afforded to C1 allowsit to grow while C2 declines. However, as C2 is gradually excluded from the system, C1 adapts toward itsallopatric optimum while the rare consumer C2 adapts to the resource densities set by C1. This change indirection in the trait space forces the system across another region of coexistence and eventually into a regionwhere C1 is gradually excluded. These adaptive transitions continue until the system becomes sufficiently near tothe adaptive fixed point (fig. B1). Increasing rates of adaptation (nj) lessen the amplitude and number of theseadaptive transitions encountered along the evolutionary transient, whereas slowing the rates of adaptationincreases their amplitude and number (results not shown). Surprisingly, in the transient approach to the sympatricoptimum, it is the consumer whose initial density is higher (C1) that reaches the lowest density along theecoevolutionary transient (fig. B2).As the consumer demand ratios move further from the supply ratio, the evolutionary transient leading from the
allopatric optimum to the sympatric optimum becomes more stable. This occurs because of changes in theecological stability of the trait space; the regions of competitive exclusion in the lower-right triangular area offigure B1 recede toward the axes, eventually bridging the central and lower regions of ecologically stable traitspace. This allows character convergence to occur along an ecologically stable evolutionary transient (fig. B3).When each consumer’s demand ratio more closely reflects the composition ratio of a particular resource,
adaptation from allopatric conditions generates trait divergence (fig. B4). Trait divergence leads to increasedspecialization of both consumers at the sympatric optimum. Single-nutrient limitation is not, favored as it is inallopatry under strongly skewed demand ratios due to exploitation of the second resource by the secondconsumer. The adaptive transient generated by combining consumers with demand ratios corresponding to pointsC and D in figure 6 is stable over the entire range of traits encountered during adaptation. Furthermore, all casesof trait divergence in this model produce adaptive transients that are ecologically stable (results not shown).In the case where the nutrient demands of consumers are not reciprocal but are opposed in value relative to
the nutrient supply ratio, there is potential for parallel trait evolution from allopatric conditions and combinationsof consumers that may match a “well-adapted” consumer to a “maladapted” consumer (as measured by thedifference between the allopatric and sympatric optima in trait space). Formulating the experiment in such amanner removes the symmetry from the competitive outcomes in trait space; however, the ecoevolutionarytransient dynamics for parallel trait adaptation from allopatric conditions (corresponding to points A and D in fig.6) are again confined within ecologically stable trait space (fig. B5). Because of the lack of symmetry inconsumer nutrient-demand ratios, the equilibrium consumer densities obtained at the sympatric optimum reflectthe suitability of consumers’ nutrient demands to that supplied by the resources.

Appendix B from D. A. Vasseur and J. W. Fox, Character Displacement and Resource Use
3
Figure B1: Ecological outcome of competition in trait space and zero-net-growth isoclines (ZNGIs) for the 11 regions. In thewhite regions, coexistence is stable. In the blue (red) regions, consumer 1 (2) excludes the other consumer. In the gray regions,exclusion of one competitor occurs via a priority effect. In the orange (green) region, a priority effect selects between exclusionof consumer 2 (1) and coexistence. The inset panels show the orientation of consumer ZNGIs for each of the 11 regions.Ecological outcomes were determined numerically by simulating the model for 5,000 time steps, using two different initial

Appendix B from D. A. Vasseur and J. W. Fox, Character Displacement and Resource Use
4
conditions, and . Precisely at , the dynamics are neutrally stable (as in fig. 3d).(C ,C )p (0.1, 1.0) (1.0, 0.1) u , u p 0.2, 0.81 2 1 2
Other parameters were , , , , , , , .a p 0.25 a p 4.0 b p 1/1.2 b p 1.2 d p 0.1 S p B1p 1 Dp 0.1 R (0)p R (0)p 0.21 2 1 2 j 1 1 2
Figure B2: Adaptation of two consumers from their allopatric optima generates trait convergence but leads the system throughtrait space that is ecologically unstable. A, Outcome of competition in the trait space: in blue (red) regions, C1 (C2) excludesthe other consumer; in the gray region, exclusion of one competitor occurs via a priority effect; in the orange (green) region, apriority effect selects between exclusion of C2 (C1) and coexistence; and in the white region, stable coexistence occurs. Preciselyat , the dynamics are neutrally stable (as in fig. 3d). The blue (red) lines trace the points in phase space whereu , u p 0.2, 0.81 2
C1 (C2) is colimited. The temporal dynamics of traits (overlaid on A, beginning from the solid black point) and populationdensities (B) are shown, with the background color corresponding to the region of trait space occupied at each time (C1 isindicated by a solid blue line; C2, a solid red line; R1, a dashed blue line; R2, a dashed red line). Initial densities were
; ; . Other parameters are , , , , ,R (0)p R (0)p 0.2 C (0)p 1.0 C (0)p 0.99 a p 0.25 a p 4.0 b p 1/1.2 b p 1.2 d p 0.11 2 1 2 1 2 1 2 j
, , and .S p B1p 1 Dp 0.1 n p 0.00021

Appendix B from D. A. Vasseur and J. W. Fox, Character Displacement and Resource Use
5
Figure B3: Adaptation of two consumers from their allopatric optima generating trait convergence. Here consumer demandratios are less proximate to the supply ratio than in figure B1. A, Outcome of competition in the trait space (color coding isdescribed in fig. B1). The temporal dynamics of traits (overlaid on A, beginning from the solid point at ) and populationtp 0densities (B) are shown, with the background color corresponding to the region of trait space occupied at each time. Initialdensities were ; ; . Other parameters are , , ,R (0)p R (0)p 0.2 C (0)p 1.0 C (0)p 0.99 a p 0.25 a p 4.0 b p 1/2 b p1 2 1 2 1 2 1 2
, , , , .2 d p 0.1 S p B1p 1 Dp 0.1 n p 0.0002j 1

Appendix B from D. A. Vasseur and J. W. Fox, Character Displacement and Resource Use
6
Figure B4: Adaptation of two consumers from their allopatric optima generating trait divergence. A, Outcome of competitionin the trait space (color coding is described in fig. B1). The temporal dynamics of traits (overlaid on A, beginning from the solidpoint at ) and population densities (B) are shown, with the background color corresponding to the region of trait spacetp 0occupied at each time. Initial densities were ; ; . Other parameters areR (0)p R (0)p 0.2 C (0)p 1.0 C (0)p 0.99 a p1 2 1 2 1
, , , , , , , .0.25 a p 4.0 b p 1/3.3 b p 3.3 d p 0.1 S p B1p 1 Dp 0.1 n p 0.00022 1 2 j 1

Appendix B from D. A. Vasseur and J. W. Fox, Character Displacement and Resource Use
7
Figure B5: Adaptation of two consumers from their allopatric optima generating parallel trait evolution. A, Outcome ofcompetition in the trait space (color coding is described in fig. B1). The temporal dynamics of traits (overlaid on A, beginningfrom the solid point at ) and population densities (B) are shown, with the background color corresponding to the regiontp 0of trait space occupied at each time. Initial densities were ; ; . Other parametersR (0)p R (0)p 0.2 C (0)p 1.0 C (0)p 0.991 2 1 2
are , , , , , , , .a p 0.25 a p 4.0 b p 1/1.2 b p 3.3 d p 0.1 S p B1p 1 Dp 0.1 n p 0.00021 2 1 2 j 1

1
� 2011 by The University of Chicago. All rights reserved. DOI: 10.1086/661896
Appendix C from D. A. Vasseur and J. W. Fox, “Adaptive Dynamicsof Competition for Nutritionally Complementary Resources: CharacterConvergence, Displacement, and Parallelism”(Am. Nat., vol. 178, no. 4, p. 000)
Costly Ingestion of Excess NutrientsHere we evaluate the effect of costly ingestion and excretion of excess nutrients in the diets of consumers. Suchcosts can be incurred in multiple ways. For example, the costs of excreting excess nutrients can directly impact aspecies’ growth rate because of the expenditure of energy and resources for the transport, packaging, andultimate excretion of excess nutrients. Alternatively, ingestion of excess nutrients can incur an opportunity cost;time spent handling nutrients that will later be excreted, with no extracted benefit, reduces the amount of time inwhich an individual can spend handling those nutrients that are limiting growth. We investigate such anopportunity cost but argue that the ultimate effect it has on character shifts is likely similar for all such costs.
When we reformulate our model of competition for complementary resources to include a multispecies Type IIfunctional response, the model becomes
dR u R C1 j 1 jp D(S � R ) � ,�1 1dt 1 � u t R � (1 � u )t Rj j h 1 j h 2
dR (1 � u )R C2 j 2 jp D(S � R ) � , (C1)�2 2dt 1 � u t R � (1 � u )t Rj j h 1 j h 2
dCj p C [(1 � d )(g � g ) � d ],j j aj bj jdt
where
k u R � k (1 � u )R1 j 1 2 j 2g p ,aj 1 � u t R � (1 � u )t Rj h 1 j h 2 (C2)
(1 � k )u R � (1 � k )(1 � u )R1 j 1 2 j 2g p .bj 1 � u t R � (1 � u )t Rj h 1 j h 2
This model adds one parameter to the original formulation, the handling timeth, which we assume is equivalentfor all combinations of consumer and resource pairs. Notably, when , the model reverts to the version int p 0h
the main text.The solution for the evolutionarily stable strategy (ESS) in sympatry can be found using the same process
outlined above for the model with a linear functional response. Again, provided that consumers’ demands lie onopposite sides of the nutrient supply ratio (as), two consumers should evolve to be nutrient colimited; therefore,
. Setting and assuming that , we find the steady-state densities:d p 0 dN /dt p 0 d p d p dj j 1 2
d*R p . (C3)j 1 � u t d � u t d1 h 2 h
Substituting these expressions into from equation (C2) yields the solution for uptake rates at theg /g p bbj aj j
sympatric ESS:
1 � k (1 � b )2 ju p , (C4)j(S) (k � k )(1 � b )1 2 j

Appendix C from D. A. Vasseur and J. W. Fox, Character Displacement and Resource Use
2
which is identical to those rates for the model with linear functional responses. Although the uptake rates thatconsumers evolve in sympatry is independent of handling time, their equilibrium densities are altered. Ashandling time increases, consumer densities decrease because of the reduction in their ability to captureresources.
The opportunity cost of handling time is most important in allopatry, where we have shown that it can beoptimal for consumers to ingest a nutritionally unbalanced diet when there is no cost of doing so. Unfortunately,solving the allopatric ESS is not analytically possible, so we resort to numerical simulation of this problem.Figure C1 shows the allopatric ESSs for four different handling times, determined by integrating the model for5,000 time steps in the presence of one consumer. As handling time increases, the “flat” areas of the allopatricESS corresponding to limitation by a single nutrient disappear because the costs of ingesting an unbalanced dietare too high. Asth increases further, the allopatric ESS approaches the sympatric ESS because consumer densitiesdecline and resources are no longer driven to low densities by consumer foraging. Most notably, characterconvergence becomes the only possibility as the costs of ingesting excess nutrients increase; when the costs ofhandling time are large enough ( ), the allopatric ESS will always produce more extreme uptake rates thant ≥ 2h
the sympatric ESS, leading to character convergence in sympatry.
Figure C1: Trait values at the sympatric and allopatric evolutionarily stable strategies (ESSs), as a function of the demand ratio(b), across a gradient of handling times (th) using a Type II multispecies functional response. When the handling time equals 0,the result is equivalent to that shown in the main text for a linear functional response. As handling time increases, the “flat”areas of the allopatric ESS, which correspond to limitation by a single nutrient, disappear because the costs of ingesting anunbalanced diet are too high. Asth increases further, the allopatric ESS approaches the sympatric ESS because consumer densitiesdecline and resources are no longer driven to low densities by consumer foraging. Most notably, character convergence becomesthe only possibility as the costs of ingesting excess nutrients grow. Parameter values are , , ,a p 0.25 a p 4.0 d p d p 0.11 2 1 2
, .S p B1 p 1 D p 0.11