“adaptive deep brain stimulation in advanced...
TRANSCRIPT
ALMA MATER STUDIORUM - UNIVERSITÀ DI BOLOGNA
DOTTORATO IN BIOINGEGNERIA
29th CYCLE
Settore Concorsuale di afferenza: 09/G2
Settore Scientifico disciplinare: ING-INF/06
“Adaptive deep brain stimulation in advanced Parkinson’s disease: Bridging the gap between concept and clinical application”
Presentata da: Mattia Arlotti
Coordinatore Dottorato: Relatore:
Prof.ssa Elisa Magosso Prof. Stefano Severi
Correlatore:
Prof. Alberto Priori
Esame finale anno 2017

1
Abstract
Parkinson’s disease (PD) is a common neurodegenerative disorder. Recent evidence points towards
increased synchronous neuronal oscillations of the cortico-thalamic-basal ganglia circuits in the
beta band (12–30 Hz) as the main pathophysiological abnormality associated with PD. Deep brain
stimulation (DBS) of the subthalamic nucleus (STN) is an effective treatment for improving PD
motor symptoms. However, the current DBS systems have several limitations, mainly related to the
fixed and continuous application of stimulation. Especially in the long-term, DBS can only partially
control clinical fluctuations and can exacerbate undesirable adverse effects often reversible with a
change of stimulation parameters. A new strategy called adaptive DBS (aDBS) allows for
continuous adaptation of STN stimulation to the patient’s clinical state by directly harnessing the
recordings of the STN pathological oscillatory activity or local field potentials (LFPs).
At present, however, the lack of understanding of DBS and PD pathophysiological mechanisms,
represents a challenge to the realization of aDBS devices. Despite the evidence that LFPs
(especially beta oscillations) correlate with a wide spectrum of PD motor and non-motor symptoms,
whether or not the statistical correlation is enough for controlling DBS remains unclear.
With this project, we aimed to accelerate the clinical translational process by suggesting a pathway
to the clinical practice. To do so, we developed an external portable LFPs-based aDBS device for
clinical investigations in acute experimental sessions, which we validated in vitro and in vivo
(Chapter 2). We then conducted a proof of concept study investigating the functioning of the device
and comparing aDBS and conventional DBS (cDBS) and how they interacted with the concurrent
pharmacological treatment (Chapter 3). Then, in a second proof of concept study, we monitored the
clinical and neurophysiological fluctuations over a period of eight hours with and without aDBS.
We thus investigated the preservation of LFPs-clinical state correlation and the aDBS management
of motor fluctuations during daily activities (Chapter 4). Because in the clinical practice the DBS
therapy is provided by means of implantable pulse generators (IPGs), we evaluated whether the
proposed aDBS approach, based on real-time LFPs processing, fits the power constraints of
implantable devices (Chapter 5). Finally, we contextualized our results and proposed an overview
of the possible pathways toward the clinical practice (Chapter 6).

2
3
Table of contents
1 Introduction ............................................................................................................................................... 7
1.1 Parkinson’s disease ............................................................................................................................ 7
1.2 Functional anatomy and physiology of the basal ganglia .................................................................. 8
1.3 Deep brain stimulation..................................................................................................................... 11
1.3.1 Deep brain stimulation mechanisms ........................................................................................ 11
1.4 Adaptive deep brain stimulation ...................................................................................................... 11
1.4.1 The concept and rationale of adaptive deep brain stimulation ................................................ 11
1.4.2 Control variables...................................................................................................................... 14
2 Design and implementation of an external portable device for clinical research of adaptive deep brain
stimulation ....................................................................................................................................................... 18
2.1 Introduction ..................................................................................................................................... 18
2.2 Design and implementation ............................................................................................................. 18
2.2.1 Requirements for sensing local field potentials during deep brain stimulation ....................... 18
2.2.2 Hardware for sensing local field potentials ............................................................................. 20
2.2.3 Requirements for processing ................................................................................................... 21
2.2.4 Firmware implementation ........................................................................................................ 21
2.3 Validation ........................................................................................................................................ 22
2.3.1 Methods ................................................................................................................................... 22
2.3.1.1 In vitro experimental set-up ................................................................................................. 22
2.3.1.2 In vitro testing ...................................................................................................................... 23
2.3.1.3 In vivo testing ...................................................................................................................... 24
2.4 Results ............................................................................................................................................. 26
2.4.1 In vitro results .......................................................................................................................... 26
2.4.2 In vivo results .......................................................................................................................... 29
3 Adaptive deep brain stimulation vs conventional deep brain stimulation: A proof of concept study ..... 31
3.1 Introduction ..................................................................................................................................... 31
3.2 Feedback algorithm design .............................................................................................................. 31
3.2.1 Parametrization method ........................................................................................................... 33
3.3 Proof of concept study ..................................................................................................................... 34
3.3.1 Methods ................................................................................................................................... 34
3.3.1.1 Patient recruitment ............................................................................................................... 34
3.3.1.2 Study design ........................................................................................................................ 34
3.3.1.3 Experimental procedure ....................................................................................................... 35
3.3.1.4 Technical and clinical outcomes .......................................................................................... 37
3.3.1.5 Statistical analysis................................................................................................................ 37
3.4 Results ............................................................................................................................................. 38

4
3.4.1 Technical results ...................................................................................................................... 38
3.4.2 Clinical results ......................................................................................................................... 39
4 Exploring local field potential-based adaptive deep brain stimulation feasibility: Eight hours of
monitoring ....................................................................................................................................................... 41
4.1 Rationale for the study and objectives ............................................................................................. 41
4.2 Methods ........................................................................................................................................... 41
4.2.1 Patients’ inclusion criteria ....................................................................................................... 41
4.2.2 Experimental protocol ............................................................................................................. 42
4.2.3 Signal processing and statistical analysis ................................................................................ 44
4.3 Results ............................................................................................................................................. 46
4.3.1 Local field potentials analysis ................................................................................................. 46
4.3.2 Local field potentials and clinical state correlation ................................................................. 47
4.3.3 Clinical data ............................................................................................................................. 48
5 Low Power Algorithm design.................................................................................................................. 50
5.1 System Requirements ...................................................................................................................... 50
5.2 Methods ........................................................................................................................................... 50
5.2.1 Low-power algorithm design workflow .................................................................................. 50
5.2.2 Optimum algorithm and complexity reduction ........................................................................ 51
5.2.3 Benchmarking hardware architectures .................................................................................... 51
5.2.3.1 Number of instructions ........................................................................................................ 51
5.2.3.2 Number of architectural resources and field-programmable gate arrays’ performances ..... 53
5.2.3.3 Microcontroller units’ performances ................................................................................... 55
5.2.3.4 5.2.3.4 Firmware development and current measurement ................................................... 57
5.3 Application-specific algorithm design: Real-time local field potentials spectral analysis .............. 58
5.3.1 Real-time frequency analysis ................................................................................................... 58
5.3.2 Technical constraints and complexity reduction ..................................................................... 58
5.3.3 Algorithm implementation and power consumption ............................................................... 60
6 Discussion ................................................................................................................................................ 62
6.1 Technological considerations and further steps ............................................................................... 62
6.2 Experimental and clinical considerations ........................................................................................ 63
6.3 The role of beta oscillations and deep brain stimulation mechanisms ............................................ 65
References .................................................................................................................................................. 71
5
List of Figures
Figure 1.1 The anatomy of basal ganglia (image source: JA Obeso et al.2014) ................................................ 9
Figure 1.2 Functional basal ganglia model (image source: Herrington et al.2016) ......................................... 10
Figure 1.3 Technological innovations .............................................................................................................. 12
Figure 1.4 Adaptive DBS model (image source: Priori et al.2012) .................................................................. 13
Figure 1.5 Proposed control variables for aDBS .............................................................................................. 14
Figure 2.1 a) Schematic block of the analog front-end, b) Schematic representation of the differential pre-
amplification stage .......................................................................................................................................... 20
Figure 2.2 In Vitro ............................................................................................................................................ 23
Figure 2.3 In vivo experimental setup ............................................................................................................. 26
Figure 2.4 Comparison between online and offline fast Fourier transform (FFT) output............................... 27
Figure 2.5 In vitro testing................................................................................................................................. 28
Figure 2.6 Functioning of the switching algorithm .......................................................................................... 29
Figure 2.7 Invivo testing .................................................................................................................................. 30
Figure 3.1 Schematic representation of the parametrization problem .......................................................... 33
Figure 3.2 Experimental sessions .................................................................................................................... 35
Figure 3.3 Stimulation amplitude course (left) in one patient, total electrical energy delivered (TEED)
comparison (right) ........................................................................................................................................... 39
Figure 3.4 UPDRS III score under conventional deep brain stimulation (cDBS) and adaptive DBS (aDBS) ..... 40
Figure 3.5 . UPDRS III score percentage improvement, adaptive deep brain stimulation (aDBS) vs
conventional DBS (cDBS) (left); UDysRS score improvement, aDBS vs cDBS (right) ....................................... 40
Figure 4.1 Experimental protocol .................................................................................................................... 42
Figure 4.2 Data collection ................................................................................................................................ 43
Figure 4.3 Power spectrum of raw local field potentialLFPs data (gray) and background noise (black) ........ 46
Figure 4.4 %UPDRSIIIUPDRS III change to- %Beta Power change correlation ................................................ 47
Figure 4.5 Time-frequency Patient 4 ............................................................................................................... 48
Figure 4.6 % UPDRS III change ......................................................................................................................... 49
Figure 4.7 Stimulation Amplitude value - to % UPDRS III change ................................................................... 49
Figure 5.1 Low-power algorithm design workflow .......................................................................................... 51
Figure 5.2 Radix 2 DIT fast Fourier transform (FFT)......................................................................................... 52
Figure 5.3 Butterfly operation ......................................................................................................................... 52
Figure 5.4 b ...................................................................................................................................................... 56
Figure 5.5 Spectrogram (periodogram) ........................................................................................................... 60
Figure 5.6 Spectrogram (multitaper method) ................................................................................................. 60
Figure 6.1 Pathways for local field potentials (LFPs)-based adaptive deep brain stimulation (aDBS)
clintranslation .................................................................................................................................................. 68

6
List of Tables
Table 1.1 Advantages and drawbacks of proposed control variables for adaptive deep brain stimulation
(aDBS). ............................................................................................................................................................. 17
Table 5.1 Number of instructions for one complex butterfly ......................................................................... 52
Table 5.2 Xilinx field-programmable gate arrays (FPGAs) (De La Piedra et al., 2012)..................................... 54
Table 5.3 Altera field-programmable gate arrays (FPGAs) (De La Piedra et al., 2012) ................................... 54
Table 5.4 Actel field-programmable gate arrays (FPGAs) (De La Piedra et al., 2012) ..................................... 54
7
1 Introduction
1.1 Parkinson’s disease
Parkinson’s disease (PD) is a progressive neurodegenerative disorder caused by the death of the
cells in the substantia nigra (SN) (Lang & Lozano, 1998). After Alzheimer’s disease, PD is the
second most common neurodegenerative disorder for diffusion. Globally there are almost 5 million
people effected by PD (Muangpaisan et al., 2011), and a projection study reported that between
2007 and 2030 the number of cases will double (Dorsey et al., 2007). The etiology of PD remains
unclear. Both environmental and genetic factors contribute to the onset of the disease.
Parkinson’s disease is mainly characterized by three cardinal symptoms: bradykinesia, rigidity and
tremors (Lang & Lozano, 1998). However, it is a complex disease that presents a wide spectrum of
motor and non-motor symptoms. Bradykinesia refers to a slowing of movement and a prolonged
time between a movement’s initiation and completion. The term is sometimes used as a synonym of
hypokinesia, and its more severe form akinesia, although bradykinesia emphasizes delayed
execution time and akinesia delayed reaction time (Berardelli et al., 2011). Rigidity refers to an
alteration of the tone of muscles even when the patient is in a relaxed condition. Tremor is a
rhythmic movement, with a frequency ranging between 4 and 6 Hz, generally involves hands, and
occurs when the patient is at rest. When motor symptoms appear, the SN has already lost 60–80%
of dopaminergic neurons.
At present, the neurodegenerative process of PD patients cannot be reversed or stopped, and
existing treatments can only manage the disease and relieve the symptoms. The most effective
treatment is the pharmacological treatment based on levodopa administration
(L‑ dihydrophenylalanine). Levodopa can ameliorate motor symptoms, but has a few side effects.
This treatment is valid in the short term, because, in the long term, motor fluctuations and
dyskinesias occur in association with levodopa therapy (Del Sorbo & Albanese, 2008).
Antiparkinsonian medication guarantees good motor control for an average interval of four to six
years, after that the benefit induced by dopaminergic treatment starts wearing off after four to five
hours. This window of time becomes progressively shorter with the progression of the disease, and
the state of the patient begins to fluctuates (motor fluctuations) between the “on” time (when the
medication attenuates symptoms) and “off” time (when the mediation has no effects). After months
or years, the patients start to experience peak-dose levodopa dyskinesias, which consists of
involuntary movements occurring during peak levels of dopamine concentration. The management
of motor fluctuations at this stage of the disease requires a trade-off between the levodopa dose

8
needed to effectively improve motor symptoms and the dose that will avoid peak dose dyskinesias.
The ideal therapy should therefore minimize “off” time and avoid peak dose dyskinesias during
“on” time; however, the therapeutic window narrows over time. Finally, when the motor
fluctuations cannot be adequately controlled by medication, surgery for deep brain stimulation
(DBS) is considered.
Deep brain stimulation is an invasive treatment based on high-frequency electrical stimulation of
deep brain areas. It is considered for the clinical treatment of PD, dystonia and essential tremor
(ET), and experimental studies are ongoing for its use in treating a wide range of other neurological
disorders. The DBS electrodes are surgically implanted, and they deliver electrical stimulation
generated by an implantable pulse generator (IPG). A more detailed description of the DBS is
presented in the following sections.
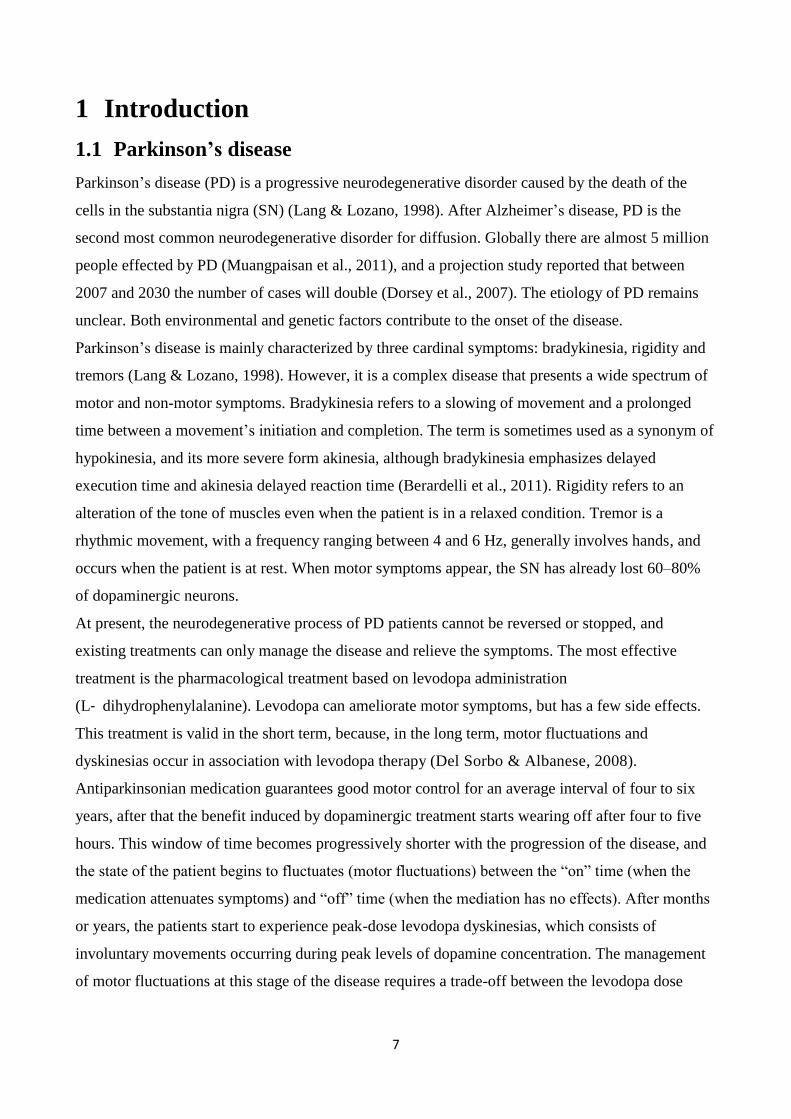
1.2 Functional anatomy and physiology of the basal ganglia
The basal ganglia (BG) are a part of the motor system consisting of a group of subcortical nuclei
including the subthalamic nucleus (STN), striatum (dorsal striatum: caudate nucleus, putamen;
ventral striatum: nucleus accumbens), globus pallidus and subtantia nigra pars reticulata (SNr)
(Albin et al., 1989). The globus pallidus is divided into the internal (GPi) and the external (GPe),
and the SN is divided into the substantia nigra pars compacta (SNc), dopaminergic neurons, and
SNr, along with neurons related to gamma-aminobutyric acid (GABA) receptors (i.e. GABAergic
neurons) (Fig. 1.1).
9
Figure 1.1 The anatomy of basal ganglia (image source: JA Obeso et al.2014)
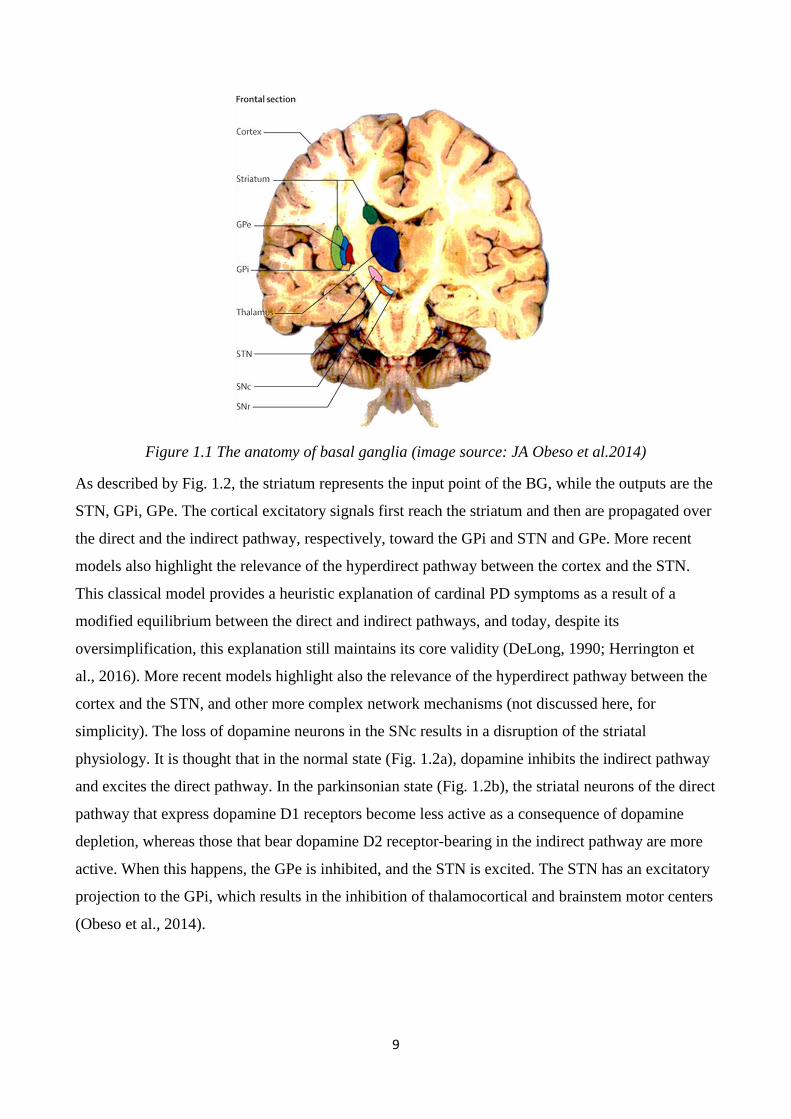
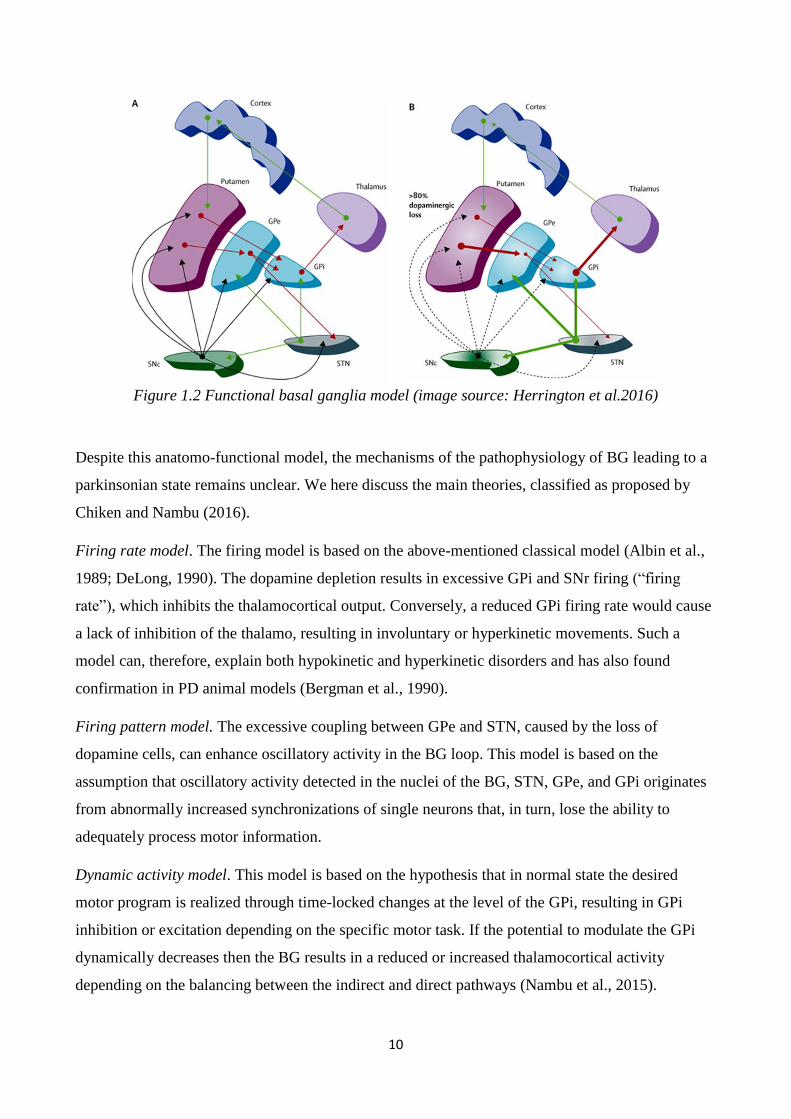
As described by Fig. 1.2, the striatum represents the input point of the BG, while the outputs are the
STN, GPi, GPe. The cortical excitatory signals first reach the striatum and then are propagated over
the direct and the indirect pathway, respectively, toward the GPi and STN and GPe. More recent
models also highlight the relevance of the hyperdirect pathway between the cortex and the STN.
This classical model provides a heuristic explanation of cardinal PD symptoms as a result of a
modified equilibrium between the direct and indirect pathways, and today, despite its
oversimplification, this explanation still maintains its core validity (DeLong, 1990; Herrington et
al., 2016). More recent models highlight also the relevance of the hyperdirect pathway between the
cortex and the STN, and other more complex network mechanisms (not discussed here, for
simplicity). The loss of dopamine neurons in the SNc results in a disruption of the striatal
physiology. It is thought that in the normal state (Fig. 1.2a), dopamine inhibits the indirect pathway
and excites the direct pathway. In the parkinsonian state (Fig. 1.2b), the striatal neurons of the direct
pathway that express dopamine D1 receptors become less active as a consequence of dopamine
depletion, whereas those that bear dopamine D2 receptor-bearing in the indirect pathway are more
active. When this happens, the GPe is inhibited, and the STN is excited. The STN has an excitatory
projection to the GPi, which results in the inhibition of thalamocortical and brainstem motor centers
(Obeso et al., 2014).
10
Figure 1.2 Functional basal ganglia model (image source: Herrington et al.2016)
Despite this anatomo-functional model, the mechanisms of the pathophysiology of BG leading to a
parkinsonian state remains unclear. We here discuss the main theories, classified as proposed by
Chiken and Nambu (2016).
Firing rate model. The firing model is based on the above-mentioned classical model (Albin et al.,
1989; DeLong, 1990). The dopamine depletion results in excessive GPi and SNr firing (“firing
rate”), which inhibits the thalamocortical output. Conversely, a reduced GPi firing rate would cause
a lack of inhibition of the thalamo, resulting in involuntary or hyperkinetic movements. Such a
model can, therefore, explain both hypokinetic and hyperkinetic disorders and has also found
confirmation in PD animal models (Bergman et al., 1990).
Firing pattern model. The excessive coupling between GPe and STN, caused by the loss of
dopamine cells, can enhance oscillatory activity in the BG loop. This model is based on the
assumption that oscillatory activity detected in the nuclei of the BG, STN, GPe, and GPi originates
from abnormally increased synchronizations of single neurons that, in turn, lose the ability to
adequately process motor information.
Dynamic activity model. This model is based on the hypothesis that in normal state the desired
motor program is realized through time-locked changes at the level of the GPi, resulting in GPi
inhibition or excitation depending on the specific motor task. If the potential to modulate the GPi
dynamically decreases then the BG results in a reduced or increased thalamocortical activity
depending on the balancing between the indirect and direct pathways (Nambu et al., 2015).
11
1.3 Deep brain stimulation
1.3.1 Deep brain stimulation mechanisms
Although deep brain stimulation (DBS) has proven to be an effective treatment for hypokinetic and
hyperkinetic movement disorders, the mechanisms by which it achieves results are still under
debate. In PD, the prevalent sites of implant are the STN and the GPi, which provide the best motor
outcomes. Here, we present the three cardinal hypotheses concerning DBS mechanisms, but a
deeper discussion, including recent findings, is offered in the final chapter.
Inhibition hypothesis. Because DBS and lesion therapy have been shown to induce similar
improvements in the motor symptoms (Benabid et al., 1994), it has been suggested that the
mechanism of action of DBS was the inhibition of the neurons around the electrode. A reduction of
the output of the site of implant was found in human recordings (Dostrovsky et al., 2000; Welter et
al., 2004) and in animal models (Benazzouz et al., 2000). Mechanisms that might explain the
inhibitory effect of DBS include depolarization block, inactivation of voltage-gated currents, and
activation of inhibitory afferents (Chicken & Nambu, 2016).
Excitation hypothesis. Successive studies have shown that DBS also has an excitatory effect,
resulting in increased activity of the downstream nuclei. In a parkinsonian monkey, the activity of
the GPi was increased by means of STN stimulation (Hashimoto et al., 2003). This effect, despite
sounding paradoxical, finds an explanation in that DBS, while inhibiting local cells body, excites
efferent and afferent fibers. Modeling studies confirmed that axons are sensitive to DBS (McIntyre
et al., 2004), and spikes are locked in time with stimulus.
Informational lesion and prokinetic oscillation enhancement. These theories are grounded in the
hypothesis that abnormal oscillatory activity diffused over the entire BG network can be disrupted
(informational lesion) or substituted with a more physiological effect (prokinetic oscillation
enhancement) by high-frequency stimulation, thus preventing the spread of the pathological
rhythmic and information contents.
1.4 Adaptive deep brain stimulation
1.4.1 The concept and rationale of adaptive deep brain stimulation
Despite the evidenced clinical outcomes of DBS, this treatment still suffers from adverse motor
symptoms and suboptimal clinical fluctuations control. For instance, the adjustment of stimulation
parameters can help to avoid motor symptoms induced by STN-DBS (Bronstein et al., 2011; Yu
and Neimat, 2008; Frankemolle et al., 2010) stimulation-induced hemiballism (Limousin et al.,
12
1996; Limousin et al., 1998), and motor side effects such as dyskinesias (Hamani et al., 2005),
speech and gait (Bronstein et al., 2011). Moreover, it was noted in a long-term follow-up study that
the higher the number of follow-up visits for DBS parameters adjustment is, the more positive the
DBS clinical outcomes are (Moro et al., 2006). For all these reasons, DBS needs further
improvement. The recent research and technological innovations in the field of neurophysiology,
neuroimaging, and neural engineering are providing new opportunities to explore the PD
pathophysiology and DBS mechanisms, and they are moving toward a process of DBS therapy
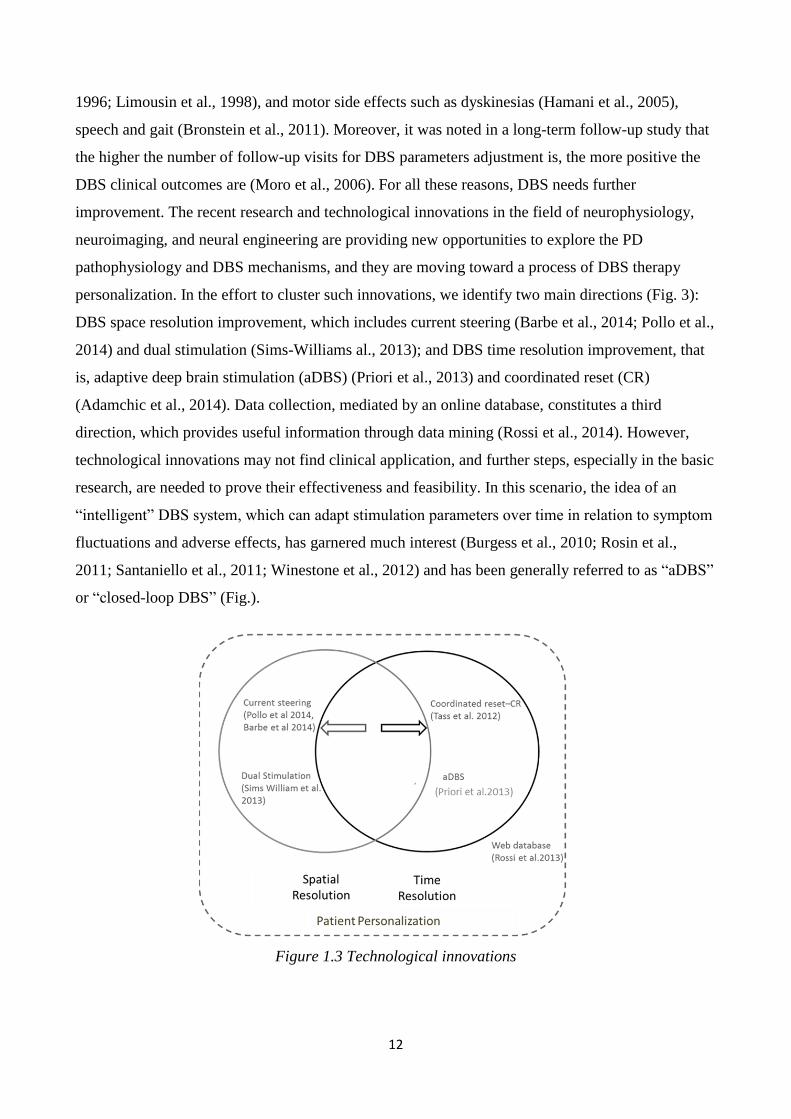
personalization. In the effort to cluster such innovations, we identify two main directions (Fig. 3):
DBS space resolution improvement, which includes current steering (Barbe et al., 2014; Pollo et al.,
2014) and dual stimulation (Sims-Williams al., 2013); and DBS time resolution improvement, that
is, adaptive deep brain stimulation (aDBS) (Priori et al., 2013) and coordinated reset (CR)
(Adamchic et al., 2014). Data collection, mediated by an online database, constitutes a third
direction, which provides useful information through data mining (Rossi et al., 2014). However,
technological innovations may not find clinical application, and further steps, especially in the basic
research, are needed to prove their effectiveness and feasibility. In this scenario, the idea of an
“intelligent” DBS system, which can adapt stimulation parameters over time in relation to symptom
fluctuations and adverse effects, has garnered much interest (Burgess et al., 2010; Rosin et al.,
2011; Santaniello et al., 2011; Winestone et al., 2012) and has been generally referred to as “aDBS”
or “closed-loop DBS” (Fig.).
Figure 1.3 Technological innovations
13
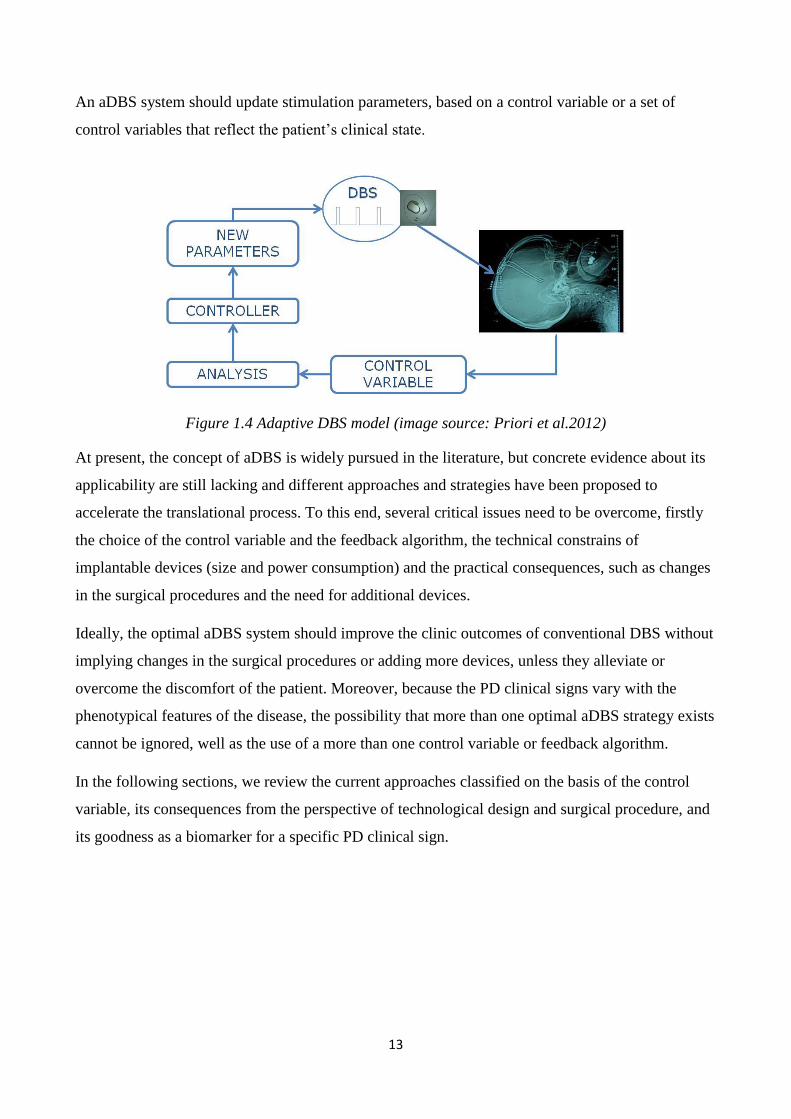
An aDBS system should update stimulation parameters, based on a control variable or a set of
control variables that reflect the patient’s clinical state.
Figure 1.4 Adaptive DBS model (image source: Priori et al.2012)
At present, the concept of aDBS is widely pursued in the literature, but concrete evidence about its
applicability are still lacking and different approaches and strategies have been proposed to
accelerate the translational process. To this end, several critical issues need to be overcome, firstly
the choice of the control variable and the feedback algorithm, the technical constrains of
implantable devices (size and power consumption) and the practical consequences, such as changes
in the surgical procedures and the need for additional devices.
Ideally, the optimal aDBS system should improve the clinic outcomes of conventional DBS without
implying changes in the surgical procedures or adding more devices, unless they alleviate or
overcome the discomfort of the patient. Moreover, because the PD clinical signs vary with the
phenotypical features of the disease, the possibility that more than one optimal aDBS strategy exists
cannot be ignored, well as the use of a more than one control variable or feedback algorithm.
In the following sections, we review the current approaches classified on the basis of the control
variable, its consequences from the perspective of technological design and surgical procedure, and
its goodness as a biomarker for a specific PD clinical sign.
14
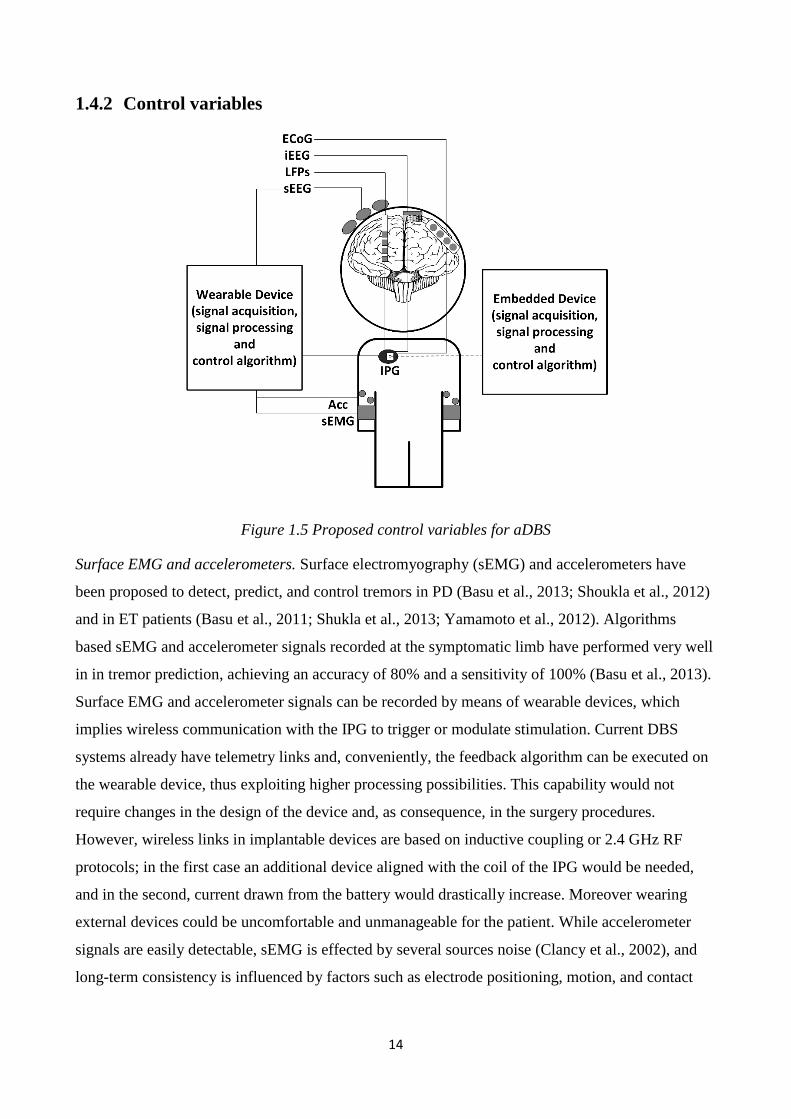
1.4.2 Control variables
Figure 1.5 Proposed control variables for aDBS
Surface EMG and accelerometers. Surface electromyography (sEMG) and accelerometers have
been proposed to detect, predict, and control tremors in PD (Basu et al., 2013; Shoukla et al., 2012)
and in ET patients (Basu et al., 2011; Shukla et al., 2013; Yamamoto et al., 2012). Algorithms
based sEMG and accelerometer signals recorded at the symptomatic limb have performed very well
in in tremor prediction, achieving an accuracy of 80% and a sensitivity of 100% (Basu et al., 2013).
Surface EMG and accelerometer signals can be recorded by means of wearable devices, which
implies wireless communication with the IPG to trigger or modulate stimulation. Current DBS
systems already have telemetry links and, conveniently, the feedback algorithm can be executed on
the wearable device, thus exploiting higher processing possibilities. This capability would not
require changes in the design of the device and, as consequence, in the surgery procedures.
However, wireless links in implantable devices are based on inductive coupling or 2.4 GHz RF
protocols; in the first case an additional device aligned with the coil of the IPG would be needed,
and in the second, current drawn from the battery would drastically increase. Moreover wearing
external devices could be uncomfortable and unmanageable for the patient. While accelerometer
signals are easily detectable, sEMG is effected by several sources noise (Clancy et al., 2002), and
long-term consistency is influenced by factors such as electrode positioning, motion, and contact
15
impedances. Lastly, using sEMG and accelerometers does not allow one to track other cardinal
symptoms, such as rigidity.
Cortical neuro signals. Single- and multi-unit activity and electrocorticography (ECoG) have been
widely investigated for neuroprostheses (Tsu et al., 2015) and epilepsy closed-loop devices (Vonck
et al., 2015). Single- and multi-unit activity signals ensure high temporal and spatial resolution
(Stavinsky et al., 2015) and are mainly recorded by means of micro-electrode arrays (MEAs), thus
exhibiting low signal stability over time (Shenoy et al., 2014). Electrocorticography-based
implantable devices for seizure detection are, instead, already commercially available for chronic
applications (Sun et al., 2014). Multi-unit activity and ECoG have been studied in PD patients and
PD animal models (monkey) to better understand the processing mechanisms of cortical-basal
ganglia circuits and to develop closed-loop strategies (Rosin et al., .2011; de Hemptinee et al.,
2015).
Reportedly, providing short train of DBS pulses (seven pulses at 130 Hz), in a 1-methil-4-phenyl-
1,2,3,6-tetrahyhydropyridine (MPTP) primate model of PD implanted in the GPi, 80 ms after an
action potential is detected from the motor cortex (M1 area) can concurrently reduce akinesia and
pallidal oscillations more than conventional DBS (Rosin et al., 2011).
Recently, Hemptinne et al. (2015) showed that in ECoG signals recorded form M1 motor cortex of
PD patients, the phase-amplitude coupling (PAC) between beta and gamma oscillations is
significantly reduced for motor tasks, and rigidity improvements.
From the physiological perspective, it is, therefore, reasonable to use cortical signals as a control
variable, considering also that the distance from the stimulating area would prevent or decrease the
stimulation artifact. However, sensing electrodes should be hypothetically distributed over a wide
cortical area to cover function connections. Finally, employing new sensors implies introducing
changes in the surgical procedures.
Neurochemical signals. Stimulation can induce dopamine responses that can be quantified and
potentially used as a control variable (Chang et al., 2013). The dopamine release can be measured
through carbon fiber microelectrodes (CFMs) for in vivo fast-scan cyclic voltammetry. These
electrodes have been implanted in the striatum of four anaesthetized rats to characterize the
relationship between dopamine levels and stimulation parameters (Crahn et al., 2014). Interestingly,
DBS determinates increased level of dopamine for a duration comparable to tremor-free periods
(Graupe et al., 2014). Despite that neurochemical signal measurements have important implications
in unveiling DBS mechanisms, their applicability in experimental and clinical in vivo protocols in
16
humans still faces technical issues (four adjunctive electrodes are necessary, and the lifetime of
CFM is limited to a few months) (Chang et al., 2013).
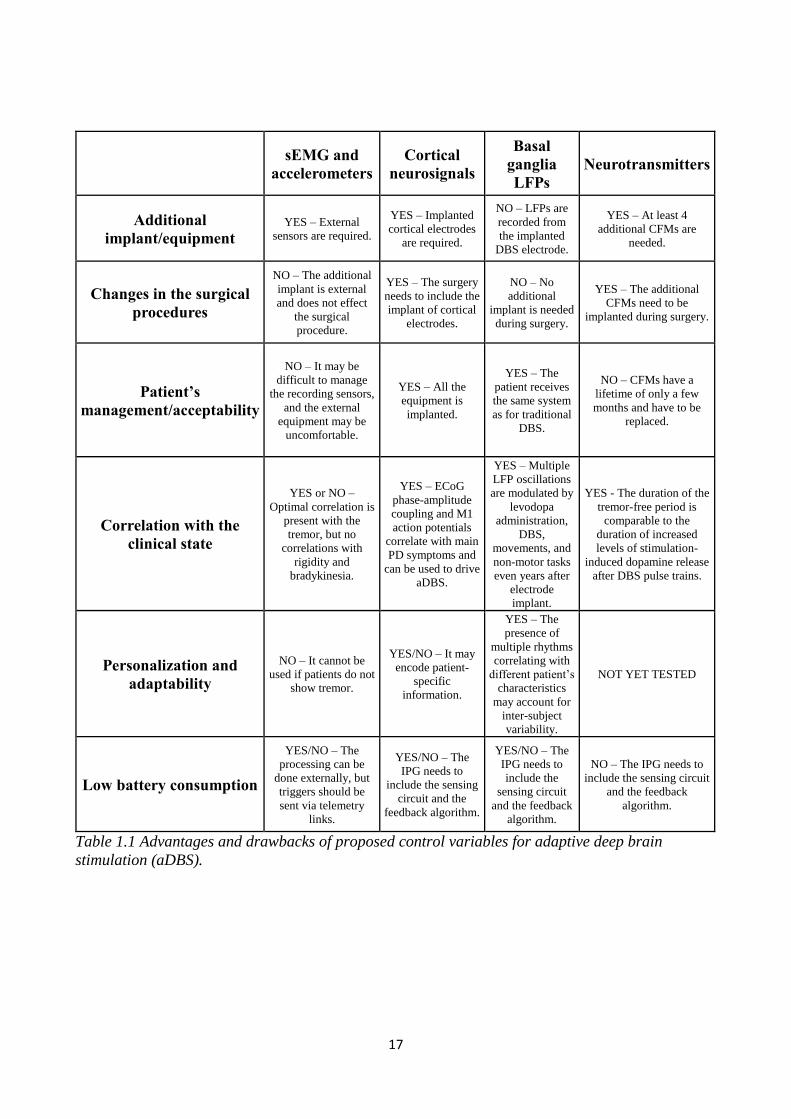
Basal ganglia (BG) local field potentials. The introduction of DBS therapy opened the possibility to
investigate the neurophysiological mechanisms of BG by recording the neuronal activity of the
target area from the DBS electrodes. The low-frequency oscillatory components of the electrical
activity of the neuronal population around the electrode are called local field potentials (LFPs),
representing the state of synchrony of a neural ensemble.
Consistently with electroencephalography (EEG) oscillations, BG LFP oscillations, can be clustered
into frequency bands: very low frequencies (LFs) (2–8 Hz), alpha frequencies (8–12 Hz), low beta
frequencies (12–20 Hz), high beta frequencies (20–35 Hz), gamma frequencies (60–80 Hz), and very-
high frequencies (250–350 Hz). The temporal and frequency features of these oscillations have been
shown to change in response to the patient's clinical state, during movement execution, and also with
cognitive and behavioral stimuli (Foffani et al., 2005a; Kuhn et al., 2009; Marceglia et al., 2011).
The beta oscillatory activity recorded from the STN of PD patients is, at present, the most studied and
debated frequency band. Beta oscillations are, in fact, modulated by dopaminergic medication (Priori
et al., 2004) and electrical stimulation (Eusebio et al., 2011; Giannicola et al., 2010), and they
correlate with movement preparation and execution (Foffani et al., 2005a), akinesia (Kuhn et al.,
2009), and freezing of gait (Toledo et al., 2005). Parkinson’s disease motor and non-motor symptoms
have also been correlated to other frequency bands: The LFs are associated with the occurrence of
dyskinesias (Foffani et al., 2005b; Alonso-French, 2006), the alpha correlates with the gait speed
(Thevathasan et al.), and the gamma has a prokinetic role (Florin et al., 2013). Because of the
correlation with the major clinical signs of PD, the LFP has been proposed as control variable (Priori
et al., 2013; Little et al., 2012).
From a technological perspective, the implanted DBS electrodes are suitable for long-term
recordings. Classical models of DBS microelectrodes (i.e. Model 3389, Medtronic, Minneapolis,
USA) are fabricated with platinum-iridium (Pt-I) cylindrical contacts with a large surface, along with
low and stable impedances. Therefore, an aDBS device, based on LFPs would not need any additional
electrodes or external implants, thus leaving the technical procedure unchanged. On the other hand,
they anyway require the modification of the electronic board of IPGs in order to add analog circuits
for neuro-signal recordings that are technically feasible (Rouse et al., 2012).
17
sEMG and
accelerometers Cortical
neurosignals
Basal
ganglia
LFPs Neurotransmitters
Additional
implant/equipment YES – External
sensors are required. YES – Implanted
cortical electrodes
are required.
NO – LFPs are
recorded from
the implanted
DBS electrode.
YES – At least 4
additional CFMs are
needed.
Changes in the surgical
procedures
NO – The additional
implant is external
and does not effect
the surgical
procedure.
YES – The surgery
needs to include the
implant of cortical
electrodes.
NO – No
additional
implant is needed
during surgery.
YES – The additional
CFMs need to be
implanted during surgery.
Patient’s
management/acceptability
NO – It may be
difficult to manage
the recording sensors,
and the external
equipment may be
uncomfortable.
YES – All the
equipment is
implanted.
YES – The
patient receives
the same system
as for traditional
DBS.
NO – CFMs have a
lifetime of only a few
months and have to be
replaced.
Correlation with the
clinical state
YES or NO –
Optimal correlation is
present with the
tremor, but no
correlations with
rigidity and
bradykinesia.
YES – ECoG
phase-amplitude
coupling and M1
action potentials
correlate with main
PD symptoms and
can be used to drive
aDBS.
YES – Multiple
LFP oscillations
are modulated by
levodopa
administration,
DBS,
movements, and
non-motor tasks
even years after
electrode
implant.
YES - The duration of the
tremor-free period is
comparable to the
duration of increased
levels of stimulation-
induced dopamine release
after DBS pulse trains.
Personalization and
adaptability
NO – It cannot be
used if patients do not
show tremor.
YES/NO – It may
encode patient-
specific
information.
YES – The
presence of
multiple rhythms
correlating with
different patient’s
characteristics
may account for
inter-subject
variability.
NOT YET TESTED
Low battery consumption
YES/NO – The
processing can be
done externally, but
triggers should be
sent via telemetry
links.
YES/NO – The
IPG needs to
include the sensing
circuit and the
feedback algorithm.
YES/NO – The
IPG needs to
include the
sensing circuit
and the feedback
algorithm.
NO – The IPG needs to
include the sensing circuit
and the feedback
algorithm.
Table 1.1 Advantages and drawbacks of proposed control variables for adaptive deep brain
stimulation (aDBS).
18
2 Design and implementation of an external portable
device for clinical research of adaptive deep brain
stimulation
2.1 Introduction
We designed, implemented and validated an external portable adaptive deep brain stimulation
(aDBS) device based on LFP feedback, aiming to investigate neurophysiological and DBS
mechanisms of action, and aDBS feasibility and efficacy. It was intended for use during
perioperative experimental sessions in patients having DBS leads externalization. After the surgery
for DBS electrodes implantation, they can be externalized and used both for recording and
stimulating. Our goal was to design a device that was portable (to allow the patients to move as
freely as possible), reprogrammable (to change and allocate new processing and closed-loop
algorithms) and safe (to avoid unwanted risk for the patients). In this chapter, we discuss the
requirements and the implementation of the aDBS device, and the validation tests in vitro and in
vivo. No details are provided at this stage about the closed-loop strategy; here, we focused on the
validation of its sensing and processing capability. Because an essential feature of the device is to
change the stimulation parameters in response to a change in the input control variable, we tested its
feature in vitro with a sample closed-loop algorithm.
2.2 Design and implementation
2.2.1 Requirements for sensing local field potentials during deep brain
stimulation
The sensing problem. The problem of recording local field potentials (LFPs) during deep brain
stimulation (DBS) was addressed for the first time by Rossi and colleagues (Rossi et al., 2007), who
developed a biopotential amplifier able to reject the stimulus artifact from the signal and isolate the
LFP component. The DBS stimulus artifact consists of harmonics of 130 Hz (Stanslaski et al.,
2012), while the interested frequencies of LFPs, especially beta oscillations, are under 40 Hz. The
strategy proposed by Rossi et al. (2007) is based on the frequency separation of the stimulation
artifact by means of a low-pass analog filter following a low gain differential amplification stage.
The same strategy has been used in other works (Denison et al., 2007; Zbrzeski et al., 2013). An
alternative solution to the artifact removal problem is the digital subtraction of template matching
(Hashimoto et al., 2002), but although it can extract LFP content offline it is not suitable for online
processing.
19
The low differential gain avoids saturation effects caused by the high magnitude of the stimulation
artifact compare to the LFPs. The low-pass filter suppresses the stimulation harmonics in order to fit
the rail-to-rail voltage supply range. Rossi et al. (2007) developed a recording chain having a +/− 15
V rail-to-rail voltage supply and used off-shields components for the instrument amplifier (INA111)
and the filter cells (OPA602), the device was sourced by the power line. We here review the
development requirements proposed by Rossi et al. (2007) to fit the technical constraints of a
portable device with a lower rail-to-rail voltage supply, lower dimensions, and limited power
sources.
Requirements definition. The requirements definition was done on the basis of the previous works
and LFPs recordings in vivo. In particular, we characterized the LFP signals and the artifact
magnitude.
The interested frequency band in LFPs was chosen between 2 and 40 Hz (Rossi et al., 2007),
including LF, alpha and beta oscillations. The mean power of beta oscillations (+/− 2 Hz the beta
peak) was reported to be between 1.1 𝜇𝑉𝑟𝑚𝑠 and 7.2 𝜇𝑉𝑟𝑚𝑠 (Yoshida et al., 2012). To confirm
and expand the requirement, we repeated the measurement in a data sample from previous LFP
recordings (Marceglia et al., 2006). The data were relative to PD patients recorded from the STN
after 12 hr of medication withdrawal; for convenience, we hereafter refer to this medical condition
as the “baseline” clinical state. Each LFP data sample was of a 30 s length, and was divided by the
total acquisition gain and then filtered between 3 and 30 Hz without phase distortions. The power
spectral density (PSD) was computed with the Welch method (“pwelch” function, Matlab) with 1 s
non-overlapping Hanning windows. The windowing operation was done to avoid power leakage
(Press et al., 1992), but then the result was multiplied for a correcting factor (0.375 for Hanning
window) to account for the power reduction caused by the windowing. We obtained a peak spectral
density ranging from 300 𝑛𝑉/√𝐻𝑧 to 1500 nV/√Hz, and a band power ranging between 1.2 and 7.7
𝜇𝑉𝑟𝑚𝑠, which were consistent with the literature (Yoshida et al., 2012).
The stimulation artifact was decomposed and characterized as in Rossi et al. (2007). The differential
part of the artifact was called differential mode artifact voltage (DMAV) and common mode artifact
voltage (CMAV). We assumed, conservatively, the maximum value of the CMAV to be 10.5 V.
The DMAV was reported to have a maximum peak-to-peak value of 5 mV (Rossi et al., 2007);
however, it was obtained in vivo by recording the artifact with a standard amplifier having a high
corner frequency at 1 KHz, which cuts the high-frequency components of the stimulation artifact,
thus resulting in a lower peak-to-peak amplitude. To derive a new measure, we used software
(Matlab) to simulate a stimulus artifact as a train of Dirac’s Delta functions at 130 Hz, then we
20
applied a one-pole low-pass Butterworth filter with a 1 KHz cutoff frequency and 10 KHz, which is
the intrinsic pole of operational amplifiers. In the latter case, the filtered output was 10 times bigger,
so we fixed the DMAV at 50 mV instead of 5 mV peak to peak. The DMAV requirement was used
to regulate the gain and the degree of the low-pass suppression, while the CMAV was used to
define the common mode rejection ratio (CMRR), which, in general, is always required to be high
(>100 dB) for bio-potential measures.
2.2.2 Hardware for sensing local field potentials
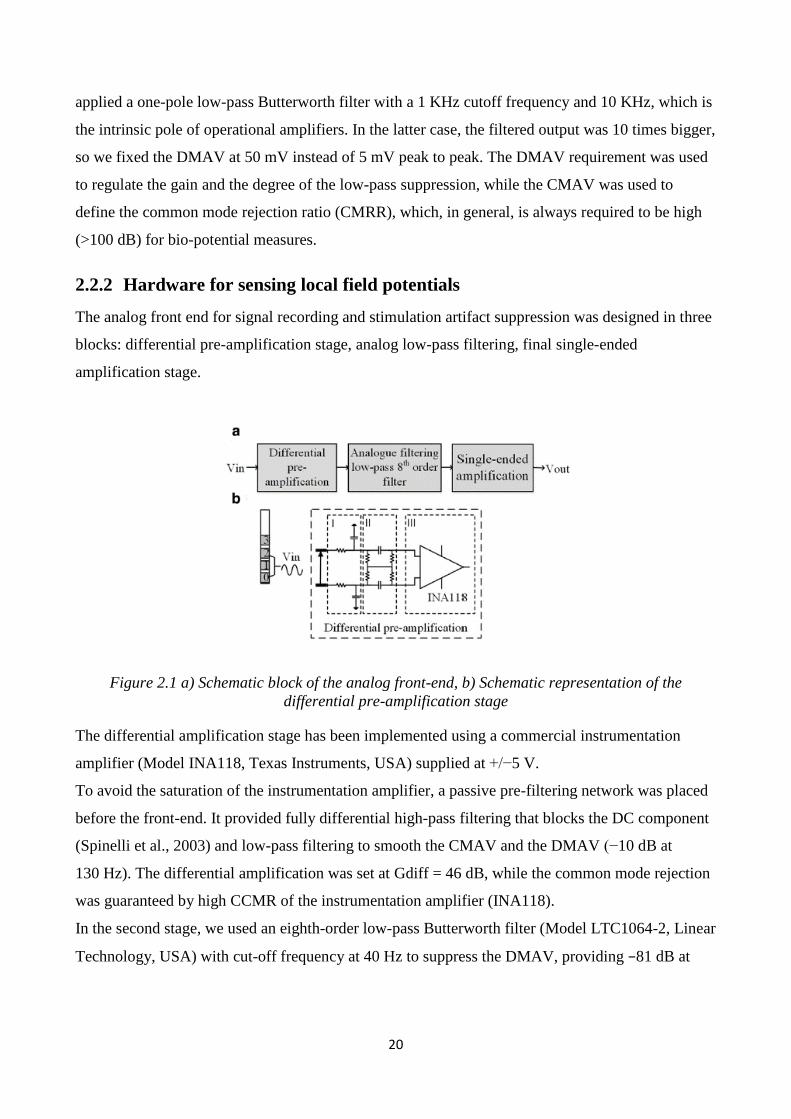
The analog front end for signal recording and stimulation artifact suppression was designed in three
blocks: differential pre-amplification stage, analog low-pass filtering, final single-ended
amplification stage.
Figure 2.1 a) Schematic block of the analog front-end, b) Schematic representation of the
differential pre-amplification stage
The differential amplification stage has been implemented using a commercial instrumentation
amplifier (Model INA118, Texas Instruments, USA) supplied at +/−5 V.
To avoid the saturation of the instrumentation amplifier, a passive pre-filtering network was placed
before the front-end. It provided fully differential high-pass filtering that blocks the DC component
(Spinelli et al., 2003) and low-pass filtering to smooth the CMAV and the DMAV (−10 dB at
130 Hz). The differential amplification was set at Gdiff = 46 dB, while the common mode rejection
was guaranteed by high CCMR of the instrumentation amplifier (INA118).
In the second stage, we used an eighth-order low-pass Butterworth filter (Model LTC1064-2, Linear
Technology, USA) with cut-off frequency at 40 Hz to suppress the DMAV, providing −81 dB at
21
130 Hz. The low input noise (10 nV/√Hz) of the selected instrumentation amplifier (INA118)
guarantees an input signal-to-noise ratio of bigger than 1.
The final amplification stage includes a single-ended non-inverting amplifier with a fixed gain
(G = 34 dB). The signal recording was performed with the MSP430FG4618 Mixed-Signal
Microcontroller (MCU) (Texas Instruments, USA) powered at 3 V, which provided a 12 bit analog-
to-digital converter (ADC) with 1.5 V dynamic range, whose reference was external (+7.25 V).
2.2.3 Requirements for processing
As discussed earlier (see Section 1.4.2), the research on local field potentials (LFPs) was based in
most of cases on the power analysis of the most physiologically relevant bands, low frequencies (4–
7 Hz), alpha (8–11), low beta (12–20 Hz), high beta (20–35 Hz), high gamma (60–80 Hz), and
300 Hz (270–330 Hz), and their correlation with clinical signs. The occurrence and the duration of
clinical signs have defined temporal features. Tracking the power changes of a certain frequency
band is, therefore, a processing requirement. The choice of the temporal resolution for the time-
frequency analysis depends upon the observed phenomena. The de-synchronization of beta
oscillations induced by levodopa administration have a different time scale (2–5 min; Priori et al.,
2004) than during self-paced movements (0.5/1 s; Foffani et al., 2005), and DBS-induced
modulations may occur in 3 min (Rosa et al., 2010). The time resolution should be therefore
programmable, as well as the band selection. Because most studies have selected a 5 Hz band
around the peak, the desired frequency resolution should be lower than 5 Hz.
2.2.4 Firmware implementation
The firmware was implemented on a low-power MCU (MSP430FG4618). The signal was
digitalized by the ADC peripheral of the MCU at a sampling frequency of 256 Hz. Every second, a
256-point complex fast Fourier transform (FFT) was computed. The FFT was implemented with the
Cooley-Tukey algorithm (Cooley & Tukey, 1965). The module of the FFT was calculated between
5 Hz and 30 Hz, and each frequency bin was normalized for the total power within this band. The
power of the selected band was calculated and then smoothed iteratively with an exponential
forgetting factor. Both the band power and the forgetting factor were user selectable.
Because we based our validation method (see Section 3.1.2) on levodopa-induced modulations of
beta oscillations, and because of the above-mentioned time course of levodopa-induced
modulations, we set the forgetting factor to 0.98, leading to a time constant of 50 s.
22
2.3 Validation
2.3.1 Methods
2.3.1.1 In vitro experimental set-up
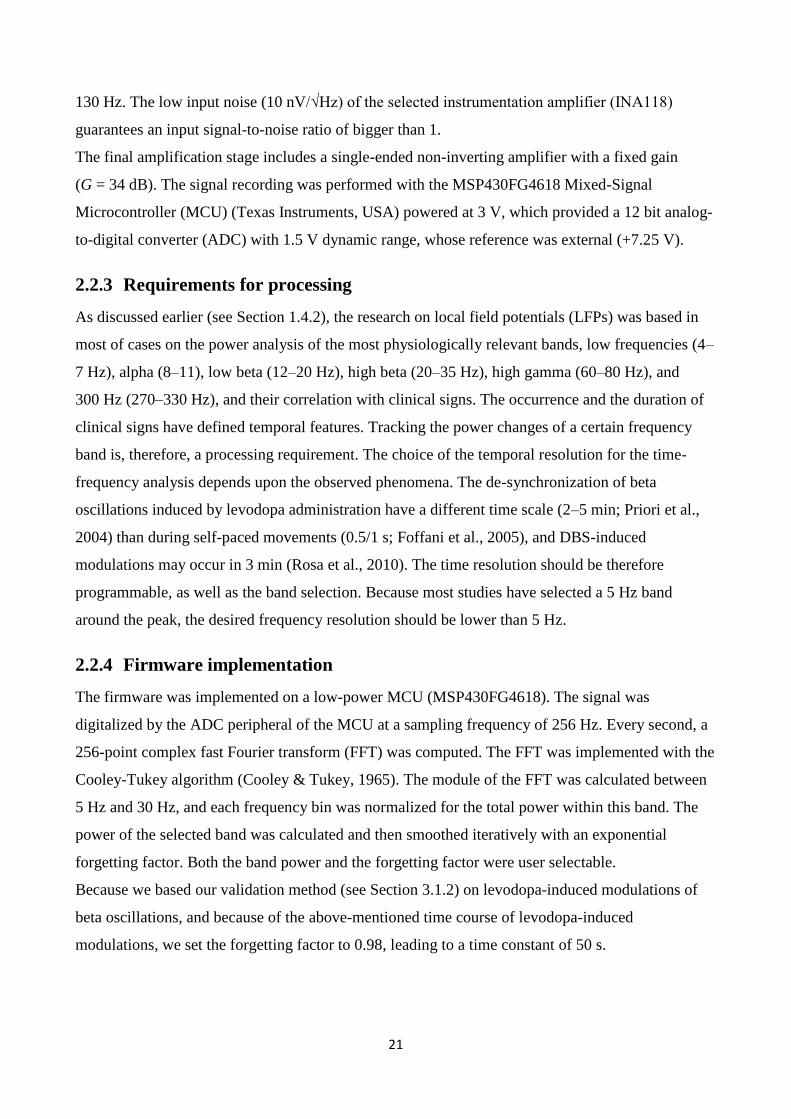
We configured a workbench experimental set-up to test the sensing and processing features of the
device. The goal was to emulate the in vivo experimental conditions. To do so we used a DBS
electrode (Model 3389 Medtronic, Minneapolis, USA) merged in saline solution (0.9% NaCl,
Bieffe Medical, Italy). The reference for differential recording and for stimulation was simulated by
two cylindrical Ag-AgCl electrodes (2 mm in diameter, 50 mm in length). The LFPs were
simplified by a sinusoidal signal created by a waveform generator (Model 33220A, Agilent, USA)
and input to the saline solution through two additional Ag-AgCl electrodes. To control the
amplitude of the input signal at the DBS electrode, we used standard amplifier (gain 80 dB,
passband 1–30 Hz, notch ON) (Model Grass ICP511, Astromed, USA), and we calculated the root
mean square voltage online with the software Spike 2 (Cambridge Electronic Design, UK) after
ADC conversion (CED 1401, Cambridge Electronic Design, UK). To control the sensing
functioning and have a parallel control on the processing outcome, we externalized the signals
before the ADC of the aDBS prototype, and we recorded them by means of the standard amplifier
(gain x50, passband 1–100, notch OFF) (Fig. 2.2). The same experimental set-up was already
validated and used in other works (Rossi et al., 2007; Stanslaski et al., 2012).
23
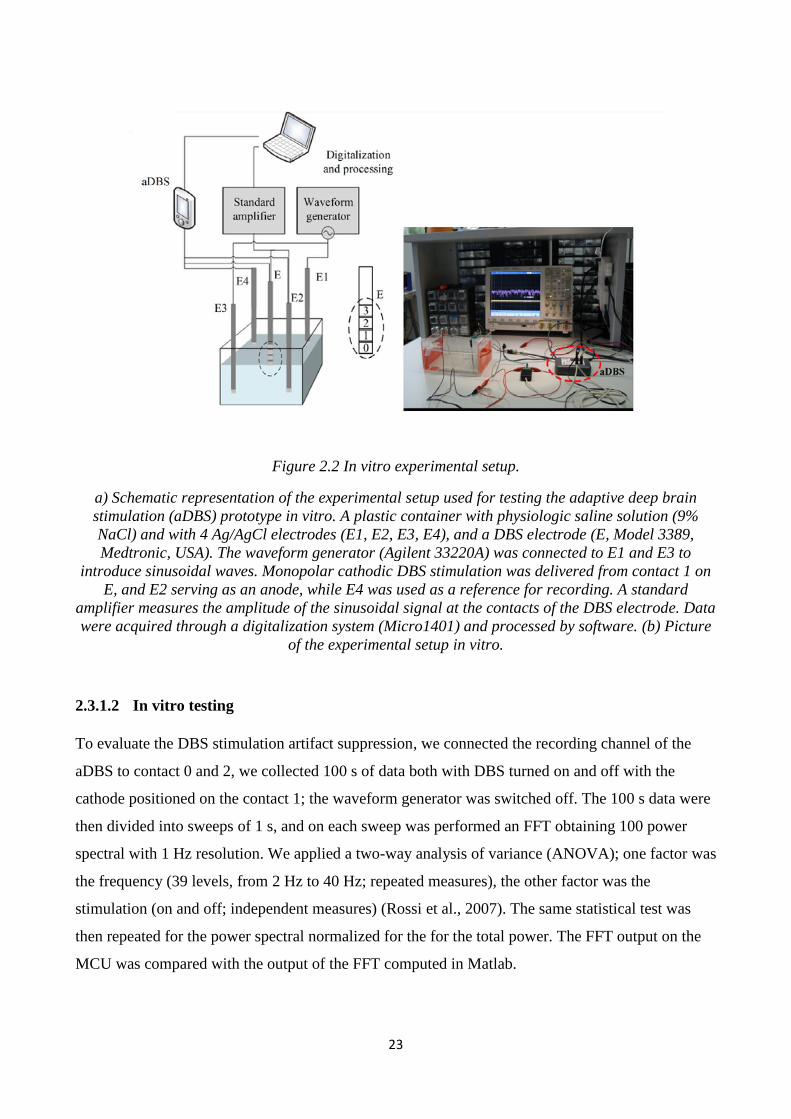
Figure 2.2 In vitro experimental setup.
a) Schematic representation of the experimental setup used for testing the adaptive deep brain
stimulation (aDBS) prototype in vitro. A plastic container with physiologic saline solution (9%
NaCl) and with 4 Ag/AgCl electrodes (E1, E2, E3, E4), and a DBS electrode (E, Model 3389,
Medtronic, USA). The waveform generator (Agilent 33220A) was connected to E1 and E3 to
introduce sinusoidal waves. Monopolar cathodic DBS stimulation was delivered from contact 1 on
E, and E2 serving as an anode, while E4 was used as a reference for recording. A standard
amplifier measures the amplitude of the sinusoidal signal at the contacts of the DBS electrode. Data
were acquired through a digitalization system (Micro1401) and processed by software. (b) Picture
of the experimental setup in vitro.
2.3.1.2 In vitro testing
To evaluate the DBS stimulation artifact suppression, we connected the recording channel of the
aDBS to contact 0 and 2, we collected 100 s of data both with DBS turned on and off with the
cathode positioned on the contact 1; the waveform generator was switched off. The 100 s data were
then divided into sweeps of 1 s, and on each sweep was performed an FFT obtaining 100 power
spectral with 1 Hz resolution. We applied a two-way analysis of variance (ANOVA); one factor was
the frequency (39 levels, from 2 Hz to 40 Hz; repeated measures), the other factor was the
stimulation (on and off; independent measures) (Rossi et al., 2007). The same statistical test was
then repeated for the power spectral normalized for the for the total power. The FFT output on the
MCU was compared with the output of the FFT computed in Matlab.
24
To test the processing method previously described, and in particular, to test its ability track and
distinguish levodopa-induced beta power changes, we provided as input to the saline solution real
LFPs. This data sample came from a data set of a previous work (Marceglia et al., 2006). The
amplitude of the LFPs at the DBS electrode was calibrated to match the real values.
Finally, we used a sample feedback algorithm, based on a threshold ON-OFF logic, to test the
ability of the device to change the stimulation parameters in response to beta power changes. The
sample feedback algorithm was developed to change the stimulation amplitude from 3 to 0 when
the control variable decreased under a certain value. This algorithm was tested on the real LFPs. We
also studied the delay between the event detection (signal power crossing the threshold) and the
amplitude update by applying to the saline solution a sinusoidal signal of 15 Hz. The amplitude was
switched changed from 2 μVrms to 1 μVrms.
2.3.1.3 In vivo testing
At this stage, the objective of the testing in vivo was the validation of sensing and processing
features of the prototype. The application of a specific feedback algorithm and the evaluation of its
effectiveness fell outside of the scope of the following testing methods.
We tested the aDBS prototype in one PD patient. The test took place two days after the surgery for
the DBS electrode implant (Model 3389, Medtronic, USA), and it consisted of two phases.
During the first, we assessed the stimulation contact, the stimulation parameters and the spectral
features of the LFPs recorded at the baseline condition (overnight medication withdrawal).
We choose the best contact to stimulate on the basis of the clinical outcomes of the surgery reported
by the responsible neurologist. To select the neurophysiological parameters (peak frequency and
frequency band), we recorded and analyzed LFP activity from both sides. As for the in vitro
experiment, we recorded LFPs by means of standard amplifier for control (Model Grass ICP511,
gain 80 dB, passband 1–100 Hz, notch ON), and recordings were done between all the contact pairs
and using a skin Ag/AgCl electrode placed on the left shoulder as ground; the peak power of the
LFP power was evaluated online (Spike 2, Cambridge Design, UK) and traced for each contact pair.
By inferring the information about the best stimulation contacts and LFP recordings, we choose to
stimulate from contact 1 and record from the contacts 0–2 of the right side. The simulation
parameters were settled at 2.2 V, 130 Hz and 60 (amplitude, frequency, and pulse width). We
selected the minimum voltage value that induced visible clinical effects, increased by 20%.
Consistent with the literature (Ray et al., 2008; Kuhn et al., 2009), we selected a frequency band of
5 Hz centered around the peak power. The device was programmed to extract and store the band
power centered at 11 Hz +/− 2 Hz. Despite that this frequency band is the higher part of the alpha
25
band, it was reported that when the LFP activity is recorded with the patient in a resting condition it
can then be associated with the beta band (Rossi et al., 2008). To discern whether the peak at 11 Hz
was significant or not, we applied the method described in Rosa et al. (2011).
During the second phase of the test, we ran the device programmed to store the band power values
for all the testing times and switched ON the stimulation 250 s after starting the device.
Because our goal was to test whether or not the prototype was able to the track levodopa-induced
LFP power changes with the imposed transitory time (forgetting factor), we started the device when
the patient was in the baseline condition and waited until the levodopa administration (occurring
after 25 min) took effect. The patient’s condition transited from the OFFOFF (without medication
and stimulation) to the OFFON (without medication and with stimulation) and finally to the ONON
(with stimulation and medication). A neurologist monitored the clinical transitions of the patient.
From the literature, it seems that all patients who manifest a significant power peak should undergo
levodopa-induced modulation and the superimposition of the medicaton, and DBS should not have
an additive effect on beta oscillatory activity (Giannicola et al., 2010).
For the entire session, the LFPs were externalized from the aDBS prototype by connecting the
analog output to the standard amplifier (see Section 3.1.2). We computed the time-frequency
analysis of the raw data offline (Matlab) to check the temporal correspondence of the MCU real
time analysis and the absence of the stimulation artifact in the analog pass band. Three data
segments corresponding to the three clinical conditions were extracted from the raw data, and the
normalized spectral power was computed for each condition with the Welch method (non-
overlapping 1 s Hanning windows).
After the device was stopped, we downloaded the band power values stored during the entire test
and applied a change point analysis to ensure that changes in the were not random, but related to
clinical state transitions. We performed the change point analysis with a percentage time resolution
of 3.3% (Rosa et al., 2010); this analysis lead to time windows of 126 s, consistent with the choice
of the time constant (50 s). Fig. 2.3 shows the experimental set up in vivo.
26
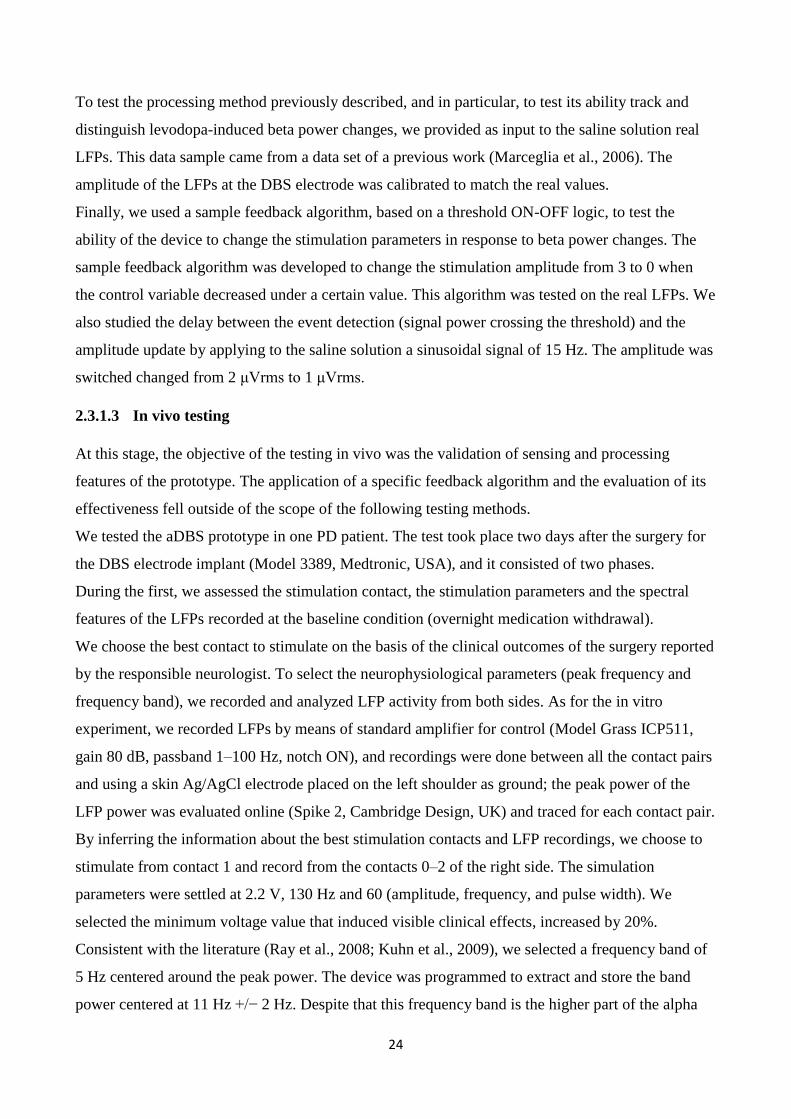
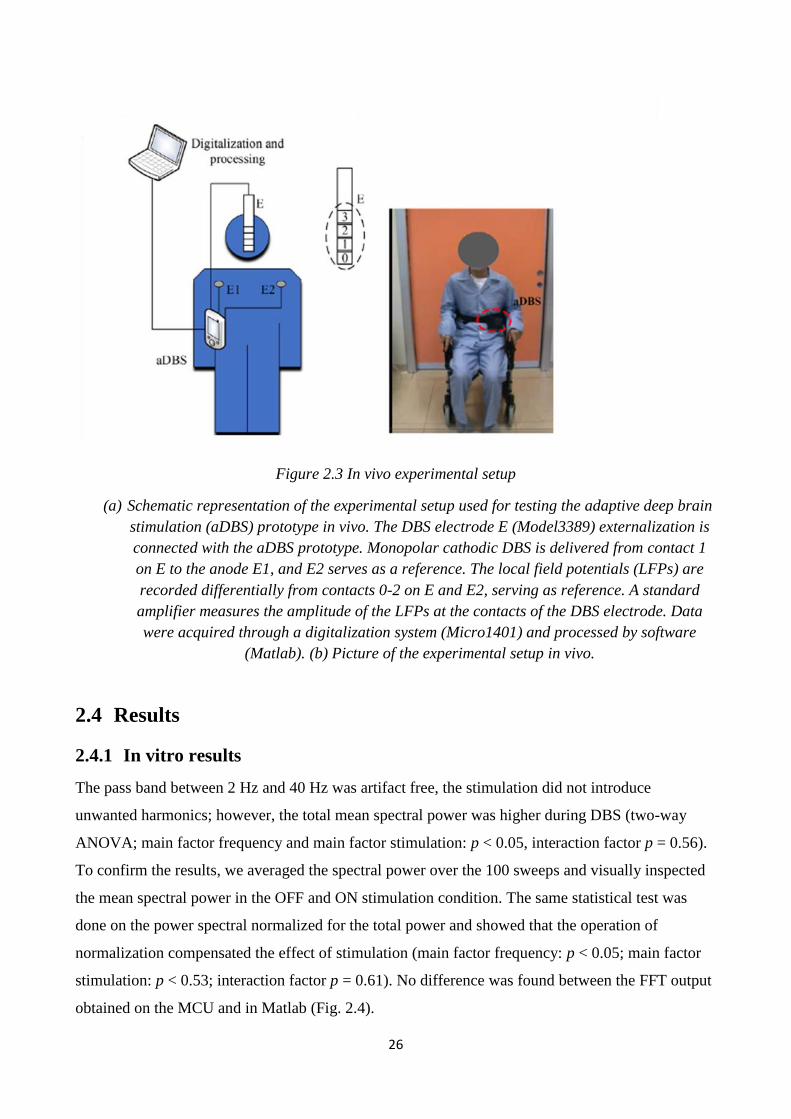
Figure 2.3 In vivo experimental setup
(a) Schematic representation of the experimental setup used for testing the adaptive deep brain
stimulation (aDBS) prototype in vivo. The DBS electrode E (Model3389) externalization is
connected with the aDBS prototype. Monopolar cathodic DBS is delivered from contact 1
on E to the anode E1, and E2 serves as a reference. The local field potentials (LFPs) are
recorded differentially from contacts 0-2 on E and E2, serving as reference. A standard
amplifier measures the amplitude of the LFPs at the contacts of the DBS electrode. Data
were acquired through a digitalization system (Micro1401) and processed by software
(Matlab). (b) Picture of the experimental setup in vivo.
2.4 Results
2.4.1 In vitro results
The pass band between 2 Hz and 40 Hz was artifact free, the stimulation did not introduce
unwanted harmonics; however, the total mean spectral power was higher during DBS (two-way
ANOVA; main factor frequency and main factor stimulation: p < 0.05, interaction factor p = 0.56).
To confirm the results, we averaged the spectral power over the 100 sweeps and visually inspected
the mean spectral power in the OFF and ON stimulation condition. The same statistical test was
done on the power spectral normalized for the total power and showed that the operation of
normalization compensated the effect of stimulation (main factor frequency: p < 0.05; main factor
stimulation: p < 0.53; interaction factor p = 0.61). No difference was found between the FFT output
obtained on the MCU and in Matlab (Fig. 2.4).

27
Figure 2.4 Comparison between online and offline fast Fourier transform (FFT) output.
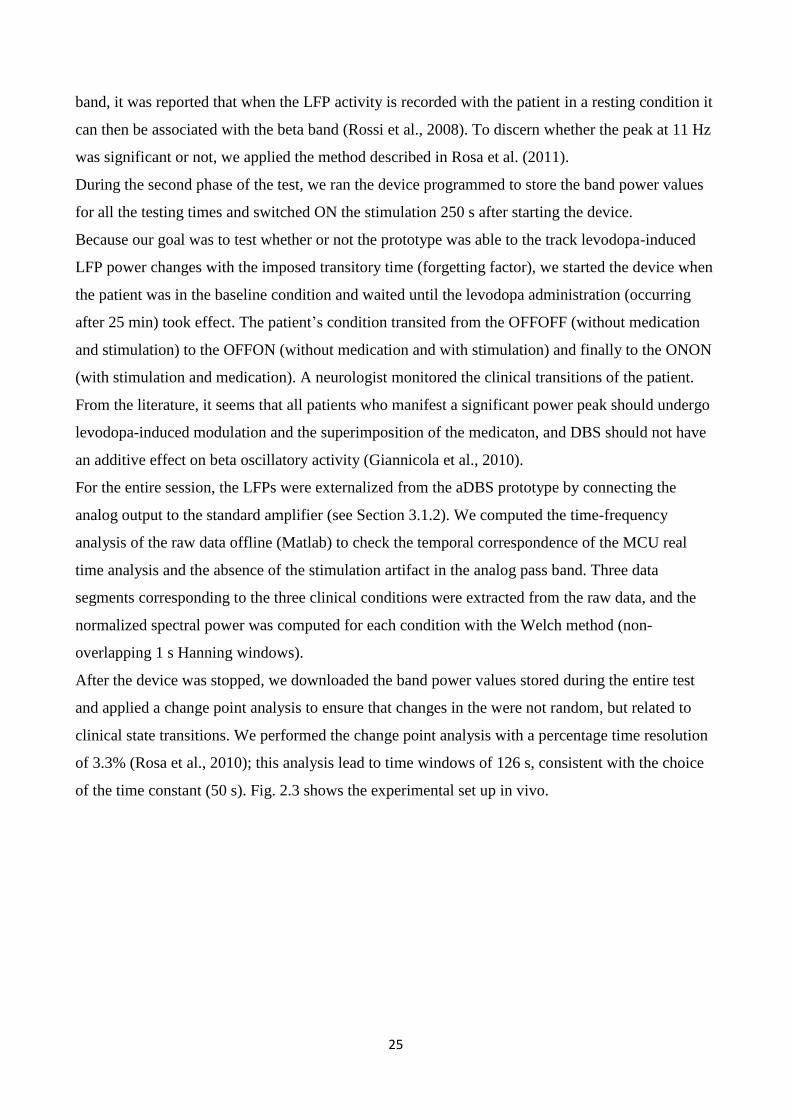
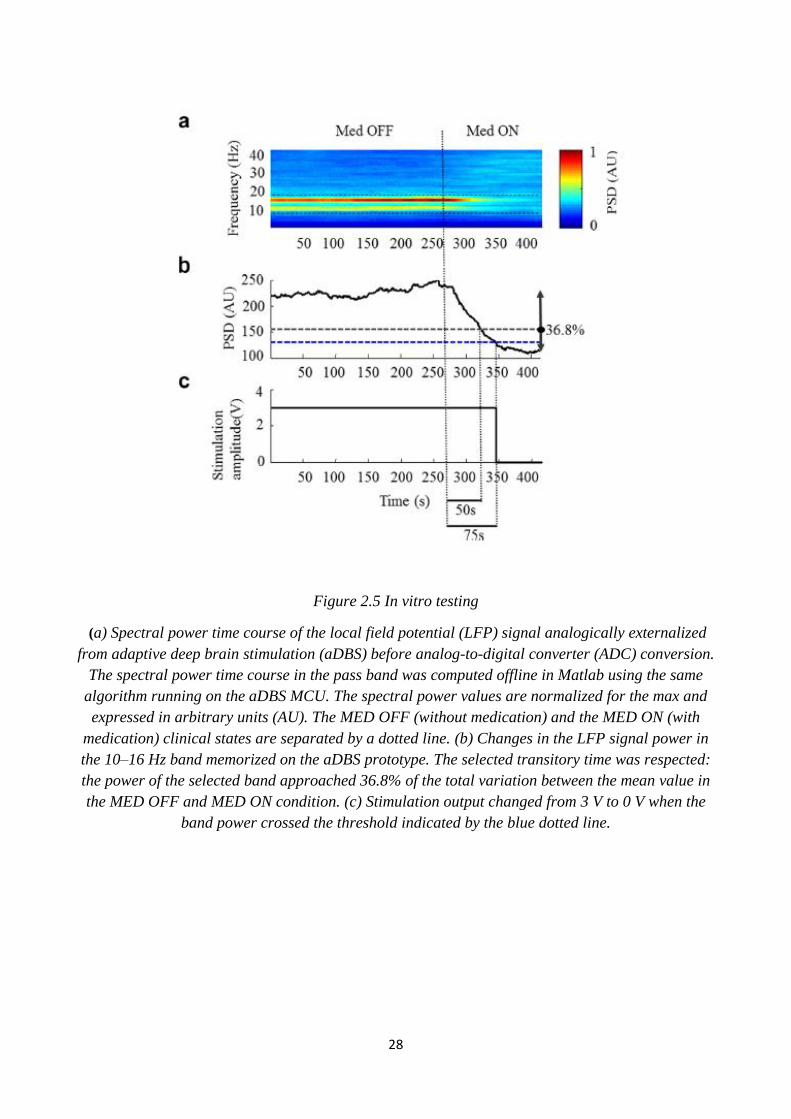
The visual inspection of the time frequency of the LFPs data confirmed that during the testing
session with real LFPs, the DBS, when switched ON, did not alter the content of the spectral power
in the band pass with unwanted harmonics (Fig. 2.5a). After 50 s (time constant) the value of the
beta power extracted online approached the 36.8% of the transitory between the mean beta power
values representing the OFFON and the OFFOFF states (Fig. 2.5b).
When the beta power crossed an arbitrary predefined threshold value, the device switched off the
stimulation output (Fig. 2.5c). The latency between the event detection and the voltage output
update was 340 ms, the time needed to compute the processing of 1 s of data acquired at a 256 Hz
sampling frequency (Fig. 2.6)
28
Figure 2.5 In vitro testing
(a) Spectral power time course of the local field potential (LFP) signal analogically externalized
from adaptive deep brain stimulation (aDBS) before analog-to-digital converter (ADC) conversion.
The spectral power time course in the pass band was computed offline in Matlab using the same
algorithm running on the aDBS MCU. The spectral power values are normalized for the max and
expressed in arbitrary units (AU). The MED OFF (without medication) and the MED ON (with
medication) clinical states are separated by a dotted line. (b) Changes in the LFP signal power in
the 10–16 Hz band memorized on the aDBS prototype. The selected transitory time was respected:
the power of the selected band approached 36.8% of the total variation between the mean value in
the MED OFF and MED ON condition. (c) Stimulation output changed from 3 V to 0 V when the
band power crossed the threshold indicated by the blue dotted line.
29
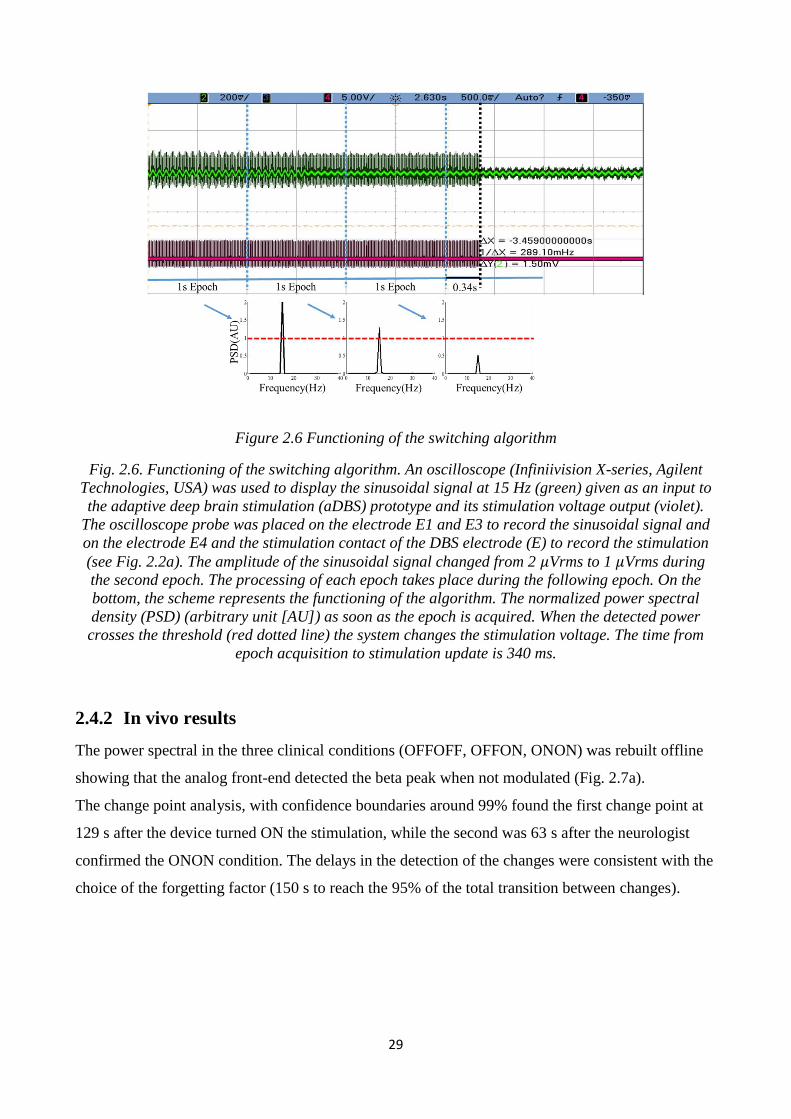
Figure 2.6 Functioning of the switching algorithm
Fig. 2.6. Functioning of the switching algorithm. An oscilloscope (Infiniivision X-series, Agilent
Technologies, USA) was used to display the sinusoidal signal at 15 Hz (green) given as an input to
the adaptive deep brain stimulation (aDBS) prototype and its stimulation voltage output (violet).
The oscilloscope probe was placed on the electrode E1 and E3 to record the sinusoidal signal and
on the electrode E4 and the stimulation contact of the DBS electrode (E) to record the stimulation
(see Fig. 2.2a). The amplitude of the sinusoidal signal changed from 2 𝜇Vrms to 1 𝜇Vrms during
the second epoch. The processing of each epoch takes place during the following epoch. On the
bottom, the scheme represents the functioning of the algorithm. The normalized power spectral
density (PSD) (arbitrary unit [AU]) as soon as the epoch is acquired. When the detected power
crosses the threshold (red dotted line) the system changes the stimulation voltage. The time from
epoch acquisition to stimulation update is 340 ms.
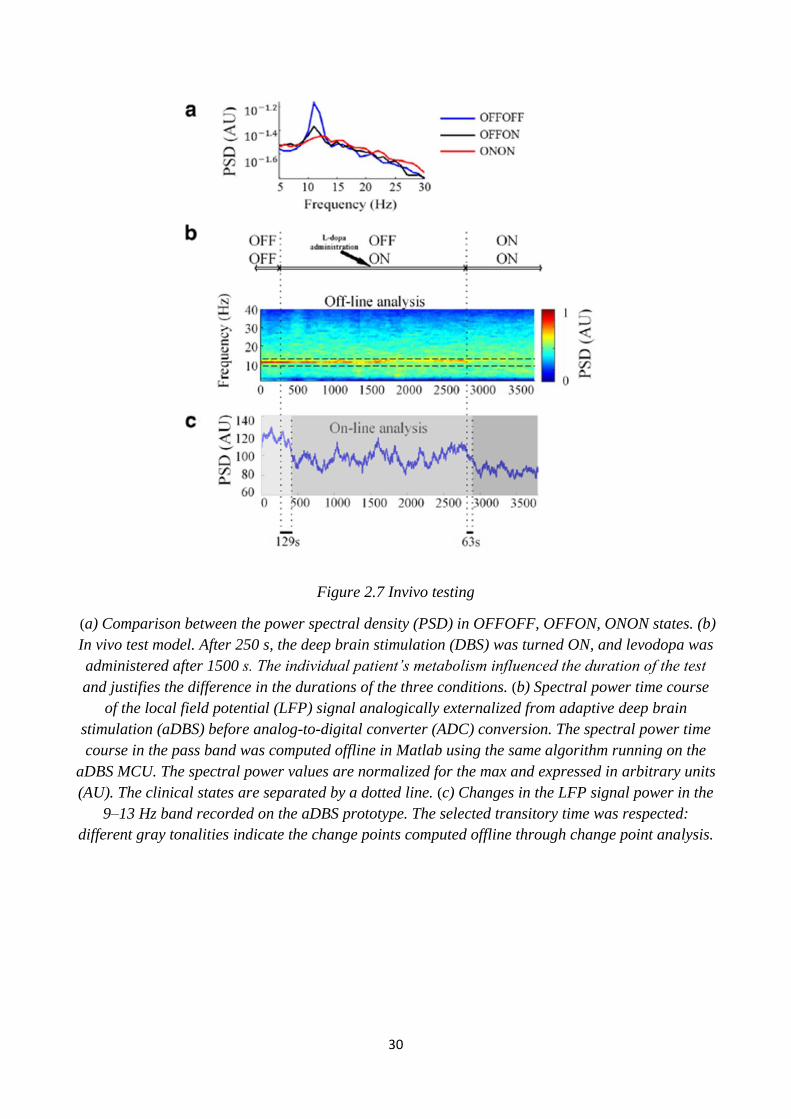
2.4.2 In vivo results
The power spectral in the three clinical conditions (OFFOFF, OFFON, ONON) was rebuilt offline
showing that the analog front-end detected the beta peak when not modulated (Fig. 2.7a).
The change point analysis, with confidence boundaries around 99% found the first change point at
129 s after the device turned ON the stimulation, while the second was 63 s after the neurologist
confirmed the ONON condition. The delays in the detection of the changes were consistent with the
choice of the forgetting factor (150 s to reach the 95% of the total transition between changes).
30
Figure 2.7 Invivo testing
(a) Comparison between the power spectral density (PSD) in OFFOFF, OFFON, ONON states. (b)
In vivo test model. After 250 s, the deep brain stimulation (DBS) was turned ON, and levodopa was
administered after 1500 s. The individual patient’s metabolism influenced the duration of the test
and justifies the difference in the durations of the three conditions. (b) Spectral power time course
of the local field potential (LFP) signal analogically externalized from adaptive deep brain
stimulation (aDBS) before analog-to-digital converter (ADC) conversion. The spectral power time
course in the pass band was computed offline in Matlab using the same algorithm running on the
aDBS MCU. The spectral power values are normalized for the max and expressed in arbitrary units
(AU). The clinical states are separated by a dotted line. (c) Changes in the LFP signal power in the
9–13 Hz band recorded on the aDBS prototype. The selected transitory time was respected:
different gray tonalities indicate the change points computed offline through change point analysis.
31
3 Adaptive deep brain stimulation vs conventional deep
brain stimulation: A proof of concept study
3.1 Introduction
Deep brain stimulation of the STN is nowadays an established and effective treatment for PD
(Benabid et al., 2009; Castrioto et al., 2013; Deushl et al., 2006). However, conventional deep brain
stimulation (cDBS) is limited in the long-term in that it can only partially control clinical
fluctuations (Rodriguez-Oroz et al., 2012). Hence, as clinical fluctuations occur, stimulation can be
unnecessary in certain periods and insufficient in others. Additionally, because the stimulation may
contribute to the development of long-term complications (Rodriguez-Oroz et al., 2012), strategies
that minimize stimulation application and intensity may also produce superior long-term outcomes.
Reducing stimulation according to the effects of antiparkinsonian drug treatment and the
corresponding clinical fluctuations can prevent transient summation of DBS and pharmacological
therapy. Because specific clinical signs of PD are correlated with increased beta band LFP
oscillations in the STN and, conversely, since beta band LFP power is reduced by levodopa (Ray et
al., 2008; Kuhn et al., 2009) and correlates with motor improvements, we focused on designing an
adaptive strategy based on beta power, aiming to reduce stimulation during pharmacological
treatments to provide a proof of concept for the technical and clinical functioning. This chapter
discusses how we defined the feedback algorithm, the method to parameterize it, its application in
an experimental design, and the technical and the clinical results, with a focus on methodology
rather than clinical results.
3.2 Feedback algorithm design
Levodopa-induced beta power modulations and their correlation with the patients’ clinical state
have been widely reported (Priori et al., 2004; Kuhn et al., 2006; Kuhn et al., 2009; Ray et al.,
2008). Priori et al. (2004) studied the distinct frequency bands power changes under the effect of
different pharmacological treatments: levodopa, apomorphine (a dopamine receptor agonist), and
orphenadrine (an anticholinergic drug). Both levodopa and apomorphine (which act on the
dopaminergic system) precipitated a power decrease in the beta band, while orphenadrine (which
acts on the cholinergic system) induced a power increase. This study measured and tested the
difference of logarithmic power before and after the pharmacological treatments, and no clinical
correlations were reported. Similar results have been obtained by Kuhn et al. (2006), who reported
32
that after dopaminergic medication there is a decrease of band power centered on the peak found in
the 8–35 Hz range, thus including alpha and beta oscillations, correlated with the motor
improvement of the patient’s motor state. They found that the percentage change in the beta power
[(beta power before medication – beta power after medication) / (beta power before medication)
*100], correlated linearly with the percentage change of the clinical state measured on the Unified
Parkinson’s Disease Rating Scale – Motion Scale (UPDRS III). The UPDRS III is a standard rating
scale used by clinicians to evaluate the degree of the disease’s symptoms. The correlation was
defined for a single levodopa administration cycle over a population of patients. Interestingly, the
absolute UPDRS III score and the absolute beta power did not show any correlations. Based on
these results, we inferred a feedback algorithm aimed to decrease the stimulation amplitude
following levodopa-induced beta power fluctuations.
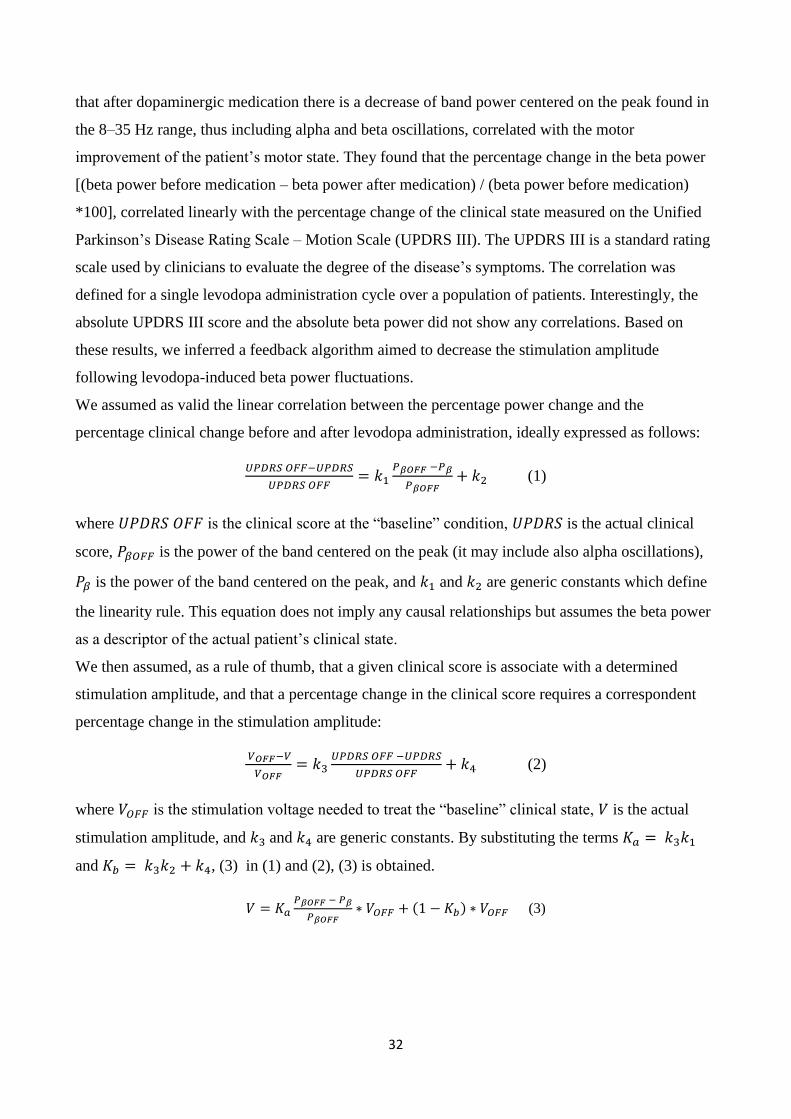
We assumed as valid the linear correlation between the percentage power change and the
percentage clinical change before and after levodopa administration, ideally expressed as follows:
𝑈𝑃𝐷𝑅𝑆 𝑂𝐹𝐹−𝑈𝑃𝐷𝑅𝑆
𝑈𝑃𝐷𝑅𝑆 𝑂𝐹𝐹= 𝑘1
𝑃𝛽𝑂𝐹𝐹 −𝑃𝛽
𝑃𝛽𝑂𝐹𝐹+ 𝑘2 (1)
where 𝑈𝑃𝐷𝑅𝑆 𝑂𝐹𝐹 is the clinical score at the “baseline” condition, 𝑈𝑃𝐷𝑅𝑆 is the actual clinical
score, 𝑃𝛽𝑂𝐹𝐹 is the power of the band centered on the peak (it may include also alpha oscillations),
𝑃𝛽 is the power of the band centered on the peak, and 𝑘1 and 𝑘2 are generic constants which define
the linearity rule. This equation does not imply any causal relationships but assumes the beta power
as a descriptor of the actual patient’s clinical state.
We then assumed, as a rule of thumb, that a given clinical score is associate with a determined
stimulation amplitude, and that a percentage change in the clinical score requires a correspondent
percentage change in the stimulation amplitude:
𝑉𝑂𝐹𝐹−𝑉
𝑉𝑂𝐹𝐹= 𝑘3
𝑈𝑃𝐷𝑅𝑆 𝑂𝐹𝐹 −𝑈𝑃𝐷𝑅𝑆
𝑈𝑃𝐷𝑅𝑆 𝑂𝐹𝐹+ 𝑘4 (2)
where 𝑉𝑂𝐹𝐹 is the stimulation voltage needed to treat the “baseline” clinical state, 𝑉 is the actual
stimulation amplitude, and 𝑘3 and 𝑘4 are generic constants. By substituting the terms 𝐾𝑎 = 𝑘3𝑘1
and 𝐾𝑏 = 𝑘3𝑘2 + 𝑘4, (3) in (1) and (2), (3) is obtained.
𝑉 = 𝐾𝑎𝑃𝛽𝑂𝐹𝐹 − 𝑃𝛽
𝑃𝛽𝑂𝐹𝐹∗ 𝑉𝑂𝐹𝐹 + (1 − 𝐾𝑏) ∗ 𝑉𝑂𝐹𝐹 (3)
33
3.2.1 Parametrization method
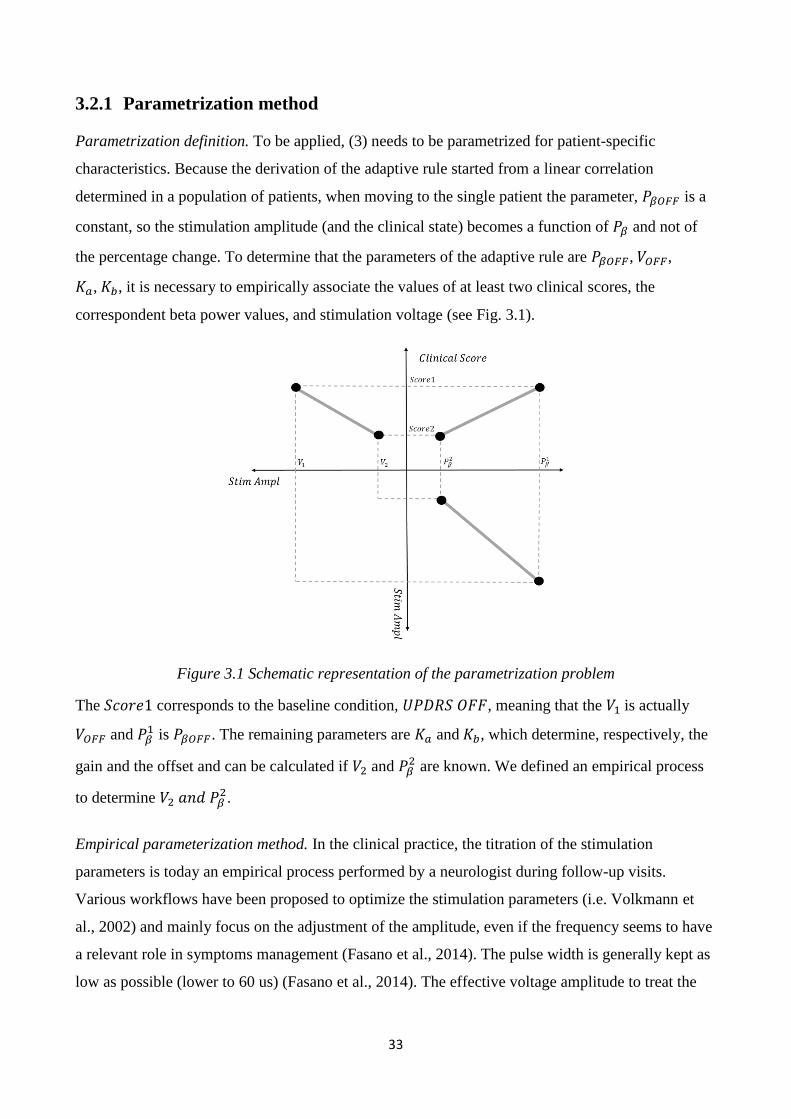
Parametrization definition. To be applied, (3) needs to be parametrized for patient-specific
characteristics. Because the derivation of the adaptive rule started from a linear correlation
determined in a population of patients, when moving to the single patient the parameter, 𝑃𝛽𝑂𝐹𝐹 is a
constant, so the stimulation amplitude (and the clinical state) becomes a function of 𝑃𝛽 and not of
the percentage change. To determine that the parameters of the adaptive rule are 𝑃𝛽𝑂𝐹𝐹, 𝑉𝑂𝐹𝐹,
𝐾𝑎, 𝐾𝑏, it is necessary to empirically associate the values of at least two clinical scores, the
correspondent beta power values, and stimulation voltage (see Fig. 3.1).
Figure 3.1 Schematic representation of the parametrization problem
The 𝑆𝑐𝑜𝑟𝑒1 corresponds to the baseline condition, 𝑈𝑃𝐷𝑅𝑆 𝑂𝐹𝐹, meaning that the 𝑉1 is actually
𝑉𝑂𝐹𝐹 and 𝑃𝛽1 is 𝑃𝛽𝑂𝐹𝐹. The remaining parameters are 𝐾𝑎 and 𝐾𝑏, which determine, respectively, the
gain and the offset and can be calculated if 𝑉2 and 𝑃𝛽2 are known. We defined an empirical process
to determine 𝑉2 𝑎𝑛𝑑 𝑃𝛽2.
Empirical parameterization method. In the clinical practice, the titration of the stimulation
parameters is today an empirical process performed by a neurologist during follow-up visits.
Various workflows have been proposed to optimize the stimulation parameters (i.e. Volkmann et
al., 2002) and mainly focus on the adjustment of the amplitude, even if the frequency seems to have
a relevant role in symptoms management (Fasano et al., 2014). The pulse width is generally kept as
low as possible (lower to 60 us) (Fasano et al., 2014). The effective voltage amplitude to treat the
34
patient at the baseline condition is chosen on the base of the neurologist’s selection criteria. The
𝑉𝑂𝐹𝐹 is thus set equal to the effective voltage amplitude. Under the baseline condition, the LFPs of
the patient are recorded and the beta band power is extracted. To drive a change in the clinical state,
a dopaminergic pharmacological treatment is administered, and, after its effect is revealed by a
neurologist, the beta band power is calculated and associated with the parameter 𝑃𝛽2, an arbitrary 𝑉2
value lower than 𝑉1. A specific realization of the parametrization method is described in Section
3.3.3.
3.3 Proof of concept study
3.3.1 Methods
3.3.1.1 Patient recruitment
We enrolled patients with advanced PD who underwent neurosurgery for STN DBS electrode
implantation. Patient recruitment was based on clinical and neurophysiological assessments. We
included all patients who did not experience any surgical complications. The neurophysiological
inclusion criterion was the presence of a significant peak in beta band (12–35 Hz) following the
method proposed in (Rosa et al., 2010).
3.3.1.2 Study design
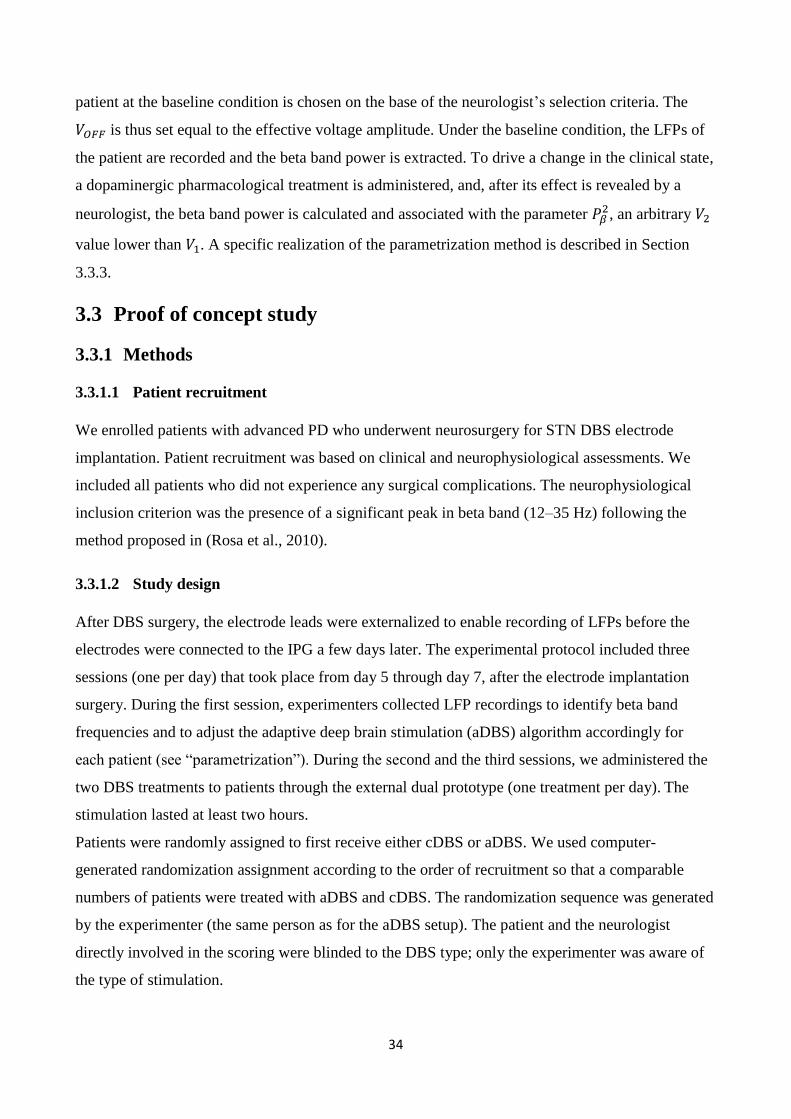
After DBS surgery, the electrode leads were externalized to enable recording of LFPs before the
electrodes were connected to the IPG a few days later. The experimental protocol included three
sessions (one per day) that took place from day 5 through day 7, after the electrode implantation
surgery. During the first session, experimenters collected LFP recordings to identify beta band
frequencies and to adjust the adaptive deep brain stimulation (aDBS) algorithm accordingly for
each patient (see “parametrization”). During the second and the third sessions, we administered the
two DBS treatments to patients through the external dual prototype (one treatment per day). The
stimulation lasted at least two hours.
Patients were randomly assigned to first receive either cDBS or aDBS. We used computer-
generated randomization assignment according to the order of recruitment so that a comparable
numbers of patients were treated with aDBS and cDBS. The randomization sequence was generated
by the experimenter (the same person as for the aDBS setup). The patient and the neurologist
directly involved in the scoring were blinded to the DBS type; only the experimenter was aware of
the type of stimulation.
35
3.3.1.3 Experimental procedure
The external prototype was placed in a pouch worn by the patient at the waist level, which allowed
the patient to move freely. The device was connected to the electrode selected for the best recording
and stimulation.
Both aDBS and cDBS were delivered unilaterally in the hemisphere in which the recorded LFPs
showed the highest beta band peak. Accordingly, we recorded the feedback signal for the aDBS
from the electrode contact pair that exhibited the highest beta peak and used the contact located
between these contacts for stimulation (the same for aDBS and cDBS sessions). At the time of the
experiment, levodopa was the only pharmacological treatment administered to the patients who
arrived at the surgery after three to four weeks of washout from all their antiparkinsonian
medication, according to the current clinical procedure.
Figure 3.2 Experimental sessions
After beta band identification, we selected the best recording and stimulation configuration for
optimal aDBS. We determined the hemisphere and electrode contact pairs (0-2; 0-3; 1-3) that
exhibited the highest beta peak. If a patient manifested a similar beta peak from both STN signals,
we chose the side contralateral to that associated with disease onset in that patient. The stimulation
contact was located between the two contacts selected for recording. We then identified the
effective stimulation amplitude for each patient. To this end, we delivered a monopolar stimulation
36
using the prototype in cDBS mode at 130 Hz with a 60 μs pulse and progressively increased the
intensity by 0.5 V every 3–4 min until the first stimulation-induced adverse effects appeared. The
effective stimulation amplitude was defined as the lowest stimulation intensity that induced at least
a 60% improvement in upper limb rigidity on the side contralateral to the stimulation site, without
adverse effects.
Then, to establish the reference beta band power values 𝑃𝛽𝑂𝐹𝐹 and 𝑃𝛽2, we connected the prototype
through the input and output channels to the previously selected electrodes and programmed it to do
as follows: record LFPs for about 20 min (baseline clinical condition) before switching on the
stimulation at the effective amplitude, to record LFPs for a further 20 min (stimON/medOFF
condition) and to continue to record LFPs while administering levodopa (the patient’s usual
antiparkinsonian medication with the treatment dose increased by 50%) and waiting for the drug to
achieve its clinical effect (stimON/medON). We then analyzed LFP beta activity offline to extract
the reference values of beta band power in the stimOFF/medOFF and stimON/medON,
respectively, 𝑃𝛽𝑂𝐹𝐹 and 𝑃𝛽2. Hereafter we refer to the 𝑃𝛽
2 value as 𝑃𝛽𝑂𝑁.
We used the specific beta band boundaries, the effective stimulation amplitude, and the reference
values of beta band power for each patient to set up a personalized aDBS algorithm. Because our
aim was to reduce the stimulation voltage to a value close to zero, we set 𝑉2 = 0. Under these
conditions, and by substituting in (3) the terms “𝑃𝛽𝑂𝐹𝐹 − 𝑃𝛽” with “𝑃𝛽𝑂𝐹𝐹 − 𝑃𝛽𝑂𝑁 − 𝑃𝛽 + 𝑃𝛽𝑂𝑁,”
(3) is reduced to (4):
𝑉 =𝑃𝛽−𝑃𝛽𝑂𝑁
𝑃𝛽𝑂𝐹𝐹−𝑃𝛽𝑂𝑁𝑉𝑂𝐹𝐹 (4)
This adaptive rule is applied only for values of 𝑃𝛽𝑂𝑁 < 𝑃𝛽 < 𝑃𝛽𝑂𝐹𝐹, for 𝑃𝛽 > 𝑃𝛽𝑂𝐹𝐹 𝑡ℎ𝑎𝑛 𝑉 =
𝑉𝑂𝐹𝐹, 𝑃𝛽 < 𝑃𝛽𝑂𝑁 𝑡ℎ𝑎𝑛 𝑉 = 0.
In the aDBS mode, the device was therefore programmed to deliver a 130 Hz stimulation with a
60 µs pulse and an amplitude that linearly changed, according to beta power recorded, between 0 V
and the effective stimulation amplitude calculated for each patient. Conversely, in the cDBS mode,
the device delivered a 130 Hz stimulation with a 60 µs pulse at the effective stimulation amplitude.
Thus, in the aDBS mode, the stimulation amplitude could not exceed the effective stimulation
amplitude delivered continuously in the cDBS mode. The prototype recorded the stimulation
amplitude delivered during the aDBS session.
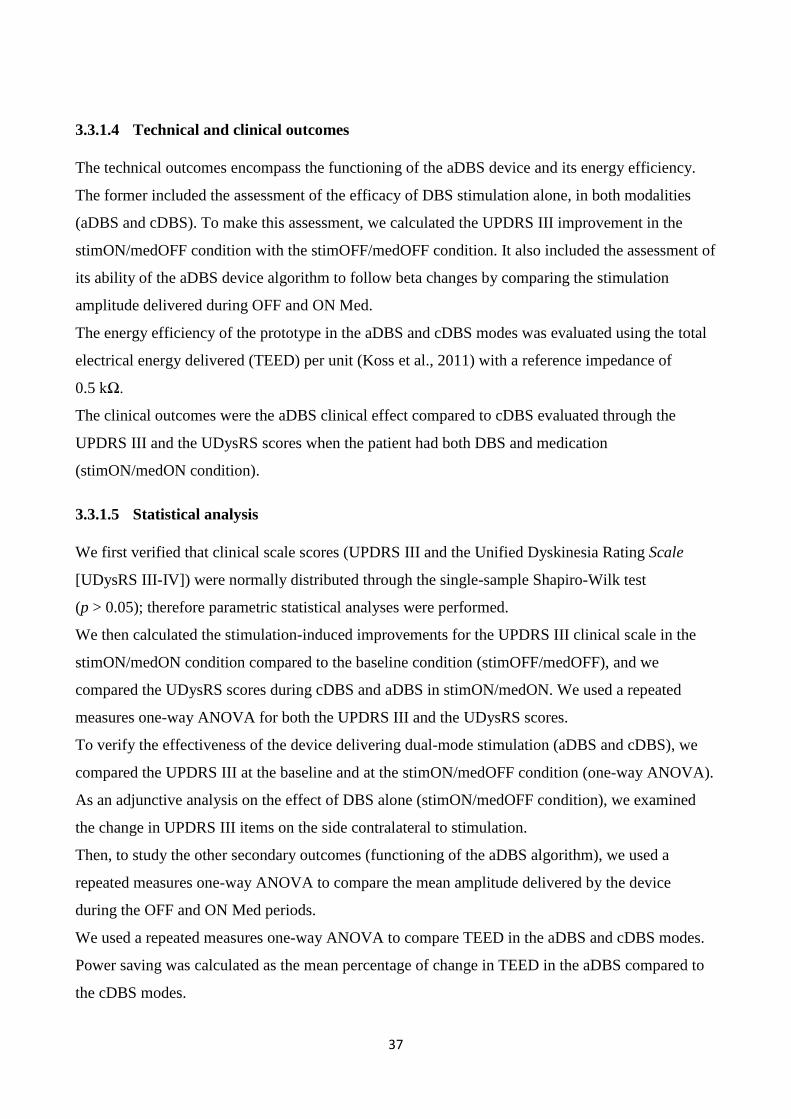
37
3.3.1.4 Technical and clinical outcomes
The technical outcomes encompass the functioning of the aDBS device and its energy efficiency.
The former included the assessment of the efficacy of DBS stimulation alone, in both modalities
(aDBS and cDBS). To make this assessment, we calculated the UPDRS III improvement in the
stimON/medOFF condition with the stimOFF/medOFF condition. It also included the assessment of
its ability of the aDBS device algorithm to follow beta changes by comparing the stimulation
amplitude delivered during OFF and ON Med.
The energy efficiency of the prototype in the aDBS and cDBS modes was evaluated using the total
electrical energy delivered (TEED) per unit (Koss et al., 2011) with a reference impedance of
0.5 kΩ.
The clinical outcomes were the aDBS clinical effect compared to cDBS evaluated through the
UPDRS III and the UDysRS scores when the patient had both DBS and medication
(stimON/medON condition).
3.3.1.5 Statistical analysis
We first verified that clinical scale scores (UPDRS III and the Unified Dyskinesia Rating Scale
[UDysRS III-IV]) were normally distributed through the single-sample Shapiro-Wilk test
(p > 0.05); therefore parametric statistical analyses were performed.
We then calculated the stimulation-induced improvements for the UPDRS III clinical scale in the
stimON/medON condition compared to the baseline condition (stimOFF/medOFF), and we
compared the UDysRS scores during cDBS and aDBS in stimON/medON. We used a repeated
measures one-way ANOVA for both the UPDRS III and the UDysRS scores.
To verify the effectiveness of the device delivering dual-mode stimulation (aDBS and cDBS), we
compared the UPDRS III at the baseline and at the stimON/medOFF condition (one-way ANOVA).
As an adjunctive analysis on the effect of DBS alone (stimON/medOFF condition), we examined
the change in UPDRS III items on the side contralateral to stimulation.
Then, to study the other secondary outcomes (functioning of the aDBS algorithm), we used a
repeated measures one-way ANOVA to compare the mean amplitude delivered by the device
during the OFF and ON Med periods.
We used a repeated measures one-way ANOVA to compare TEED in the aDBS and cDBS modes.
Power saving was calculated as the mean percentage of change in TEED in the aDBS compared to
the cDBS modes.
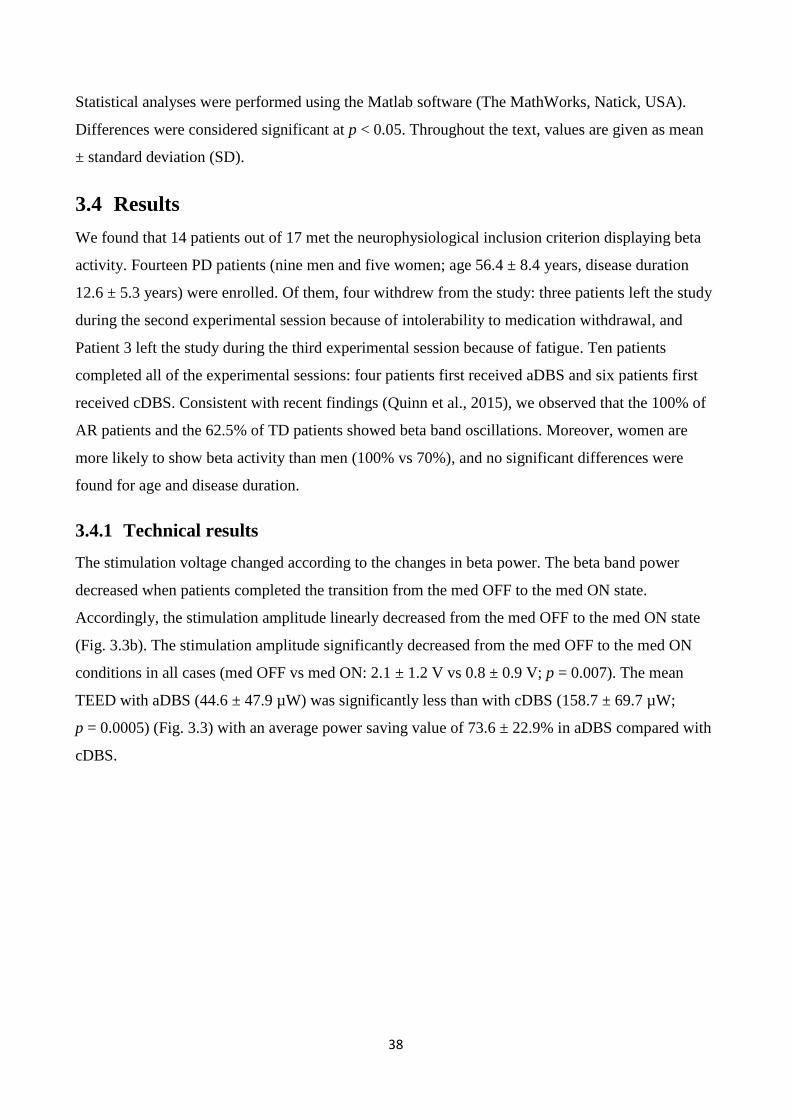
38
Statistical analyses were performed using the Matlab software (The MathWorks, Natick, USA).
Differences were considered significant at p < 0.05. Throughout the text, values are given as mean
± standard deviation (SD).
3.4 Results
We found that 14 patients out of 17 met the neurophysiological inclusion criterion displaying beta
activity. Fourteen PD patients (nine men and five women; age 56.4 ± 8.4 years, disease duration
12.6 ± 5.3 years) were enrolled. Of them, four withdrew from the study: three patients left the study
during the second experimental session because of intolerability to medication withdrawal, and
Patient 3 left the study during the third experimental session because of fatigue. Ten patients
completed all of the experimental sessions: four patients first received aDBS and six patients first
received cDBS. Consistent with recent findings (Quinn et al., 2015), we observed that the 100% of
AR patients and the 62.5% of TD patients showed beta band oscillations. Moreover, women are
more likely to show beta activity than men (100% vs 70%), and no significant differences were
found for age and disease duration.
3.4.1 Technical results
The stimulation voltage changed according to the changes in beta power. The beta band power
decreased when patients completed the transition from the med OFF to the med ON state.
Accordingly, the stimulation amplitude linearly decreased from the med OFF to the med ON state
(Fig. 3.3b). The stimulation amplitude significantly decreased from the med OFF to the med ON
conditions in all cases (med OFF vs med ON: 2.1 ± 1.2 V vs 0.8 ± 0.9 V; p = 0.007). The mean
TEED with aDBS (44.6 ± 47.9 µW) was significantly less than with cDBS (158.7 ± 69.7 µW;
p = 0.0005) (Fig. 3.3) with an average power saving value of 73.6 ± 22.9% in aDBS compared with
cDBS.
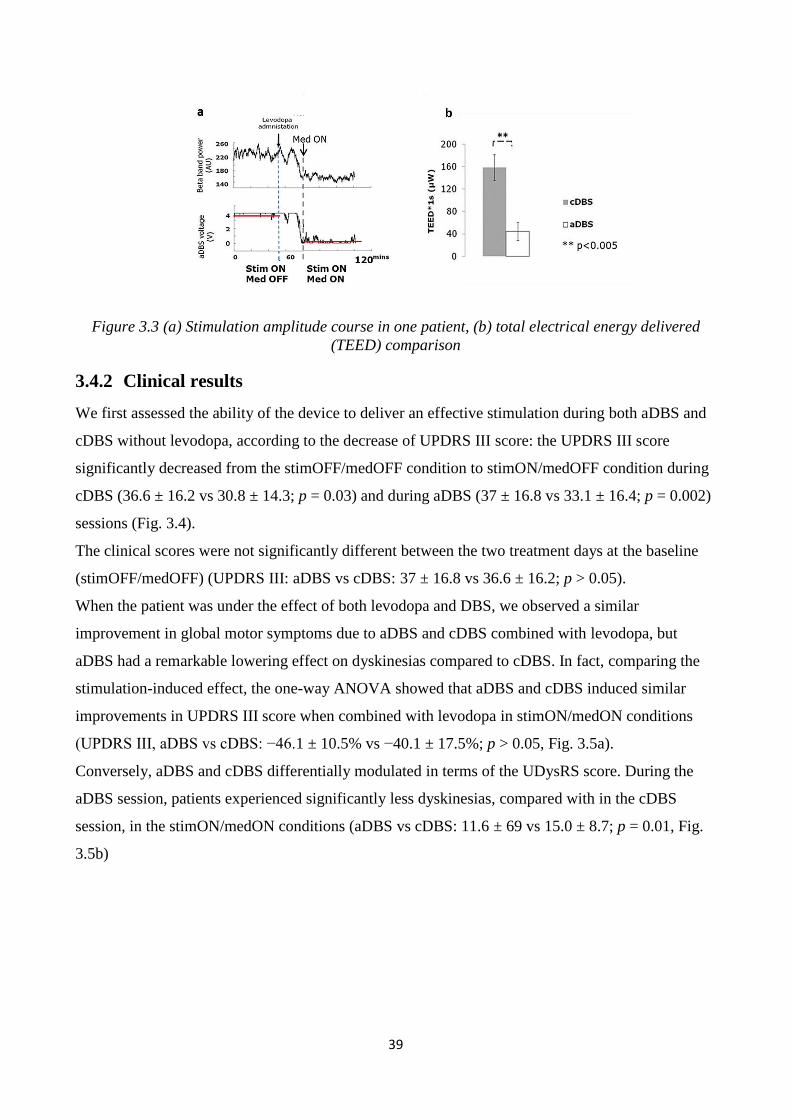
39
Figure 3.3 (a) Stimulation amplitude course in one patient, (b) total electrical energy delivered
(TEED) comparison
3.4.2 Clinical results
We first assessed the ability of the device to deliver an effective stimulation during both aDBS and
cDBS without levodopa, according to the decrease of UPDRS III score: the UPDRS III score
significantly decreased from the stimOFF/medOFF condition to stimON/medOFF condition during
cDBS (36.6 ± 16.2 vs 30.8 ± 14.3; p = 0.03) and during aDBS (37 ± 16.8 vs 33.1 ± 16.4; p = 0.002)
sessions (Fig. 3.4).
The clinical scores were not significantly different between the two treatment days at the baseline
(stimOFF/medOFF) (UPDRS III: aDBS vs cDBS: 37 ± 16.8 vs 36.6 ± 16.2; p > 0.05).
When the patient was under the effect of both levodopa and DBS, we observed a similar
improvement in global motor symptoms due to aDBS and cDBS combined with levodopa, but
aDBS had a remarkable lowering effect on dyskinesias compared to cDBS. In fact, comparing the
stimulation-induced effect, the one-way ANOVA showed that aDBS and cDBS induced similar
improvements in UPDRS III score when combined with levodopa in stimON/medON conditions
(UPDRS III, aDBS vs cDBS: −46.1 ± 10.5% vs −40.1 ± 17.5%; p > 0.05, Fig. 3.5a).
Conversely, aDBS and cDBS differentially modulated in terms of the UDysRS score. During the
aDBS session, patients experienced significantly less dyskinesias, compared with in the cDBS
session, in the stimON/medON conditions (aDBS vs cDBS: 11.6 ± 69 vs 15.0 ± 8.7; p = 0.01, Fig.
3.5b)
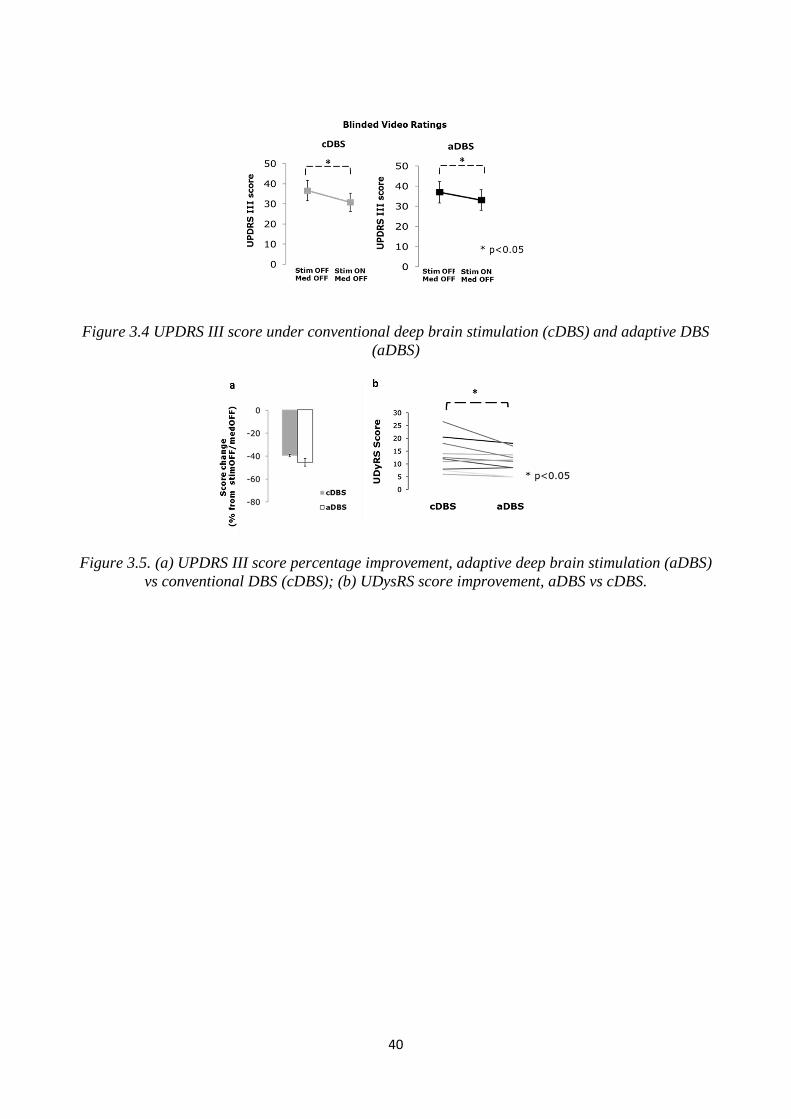
40
Figure 3.4 UPDRS III score under conventional deep brain stimulation (cDBS) and adaptive DBS
(aDBS)
Figure 3.5. (a) UPDRS III score percentage improvement, adaptive deep brain stimulation (aDBS)
vs conventional DBS (cDBS); (b) UDysRS score improvement, aDBS vs cDBS.
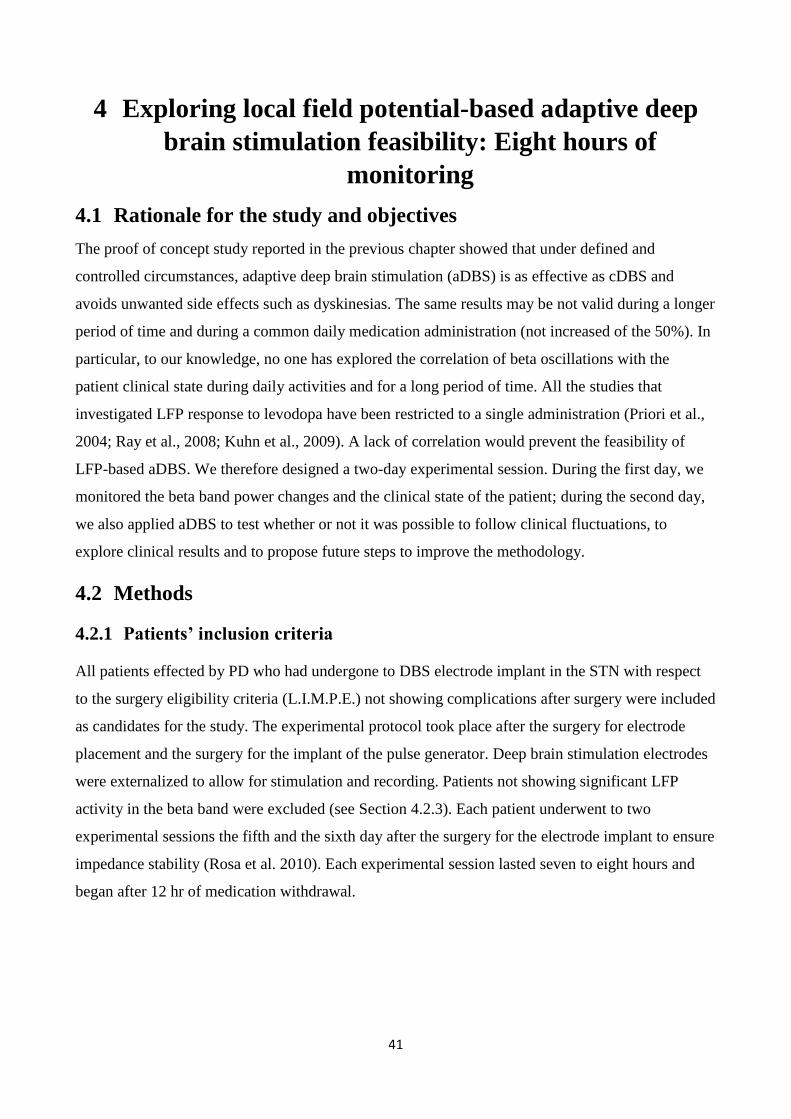
41
4 Exploring local field potential-based adaptive deep
brain stimulation feasibility: Eight hours of
monitoring
4.1 Rationale for the study and objectives
The proof of concept study reported in the previous chapter showed that under defined and
controlled circumstances, adaptive deep brain stimulation (aDBS) is as effective as cDBS and
avoids unwanted side effects such as dyskinesias. The same results may be not valid during a longer
period of time and during a common daily medication administration (not increased of the 50%). In
particular, to our knowledge, no one has explored the correlation of beta oscillations with the
patient clinical state during daily activities and for a long period of time. All the studies that
investigated LFP response to levodopa have been restricted to a single administration (Priori et al.,
2004; Ray et al., 2008; Kuhn et al., 2009). A lack of correlation would prevent the feasibility of
LFP-based aDBS. We therefore designed a two-day experimental session. During the first day, we
monitored the beta band power changes and the clinical state of the patient; during the second day,
we also applied aDBS to test whether or not it was possible to follow clinical fluctuations, to
explore clinical results and to propose future steps to improve the methodology.
4.2 Methods
4.2.1 Patients’ inclusion criteria
All patients effected by PD who had undergone to DBS electrode implant in the STN with respect
to the surgery eligibility criteria (L.I.M.P.E.) not showing complications after surgery were included
as candidates for the study. The experimental protocol took place after the surgery for electrode
placement and the surgery for the implant of the pulse generator. Deep brain stimulation electrodes
were externalized to allow for stimulation and recording. Patients not showing significant LFP
activity in the beta band were excluded (see Section 4.2.3). Each patient underwent to two
experimental sessions the fifth and the sixth day after the surgery for the electrode implant to ensure
impedance stability (Rosa et al. 2010). Each experimental session lasted seven to eight hours and
began after 12 hr of medication withdrawal.
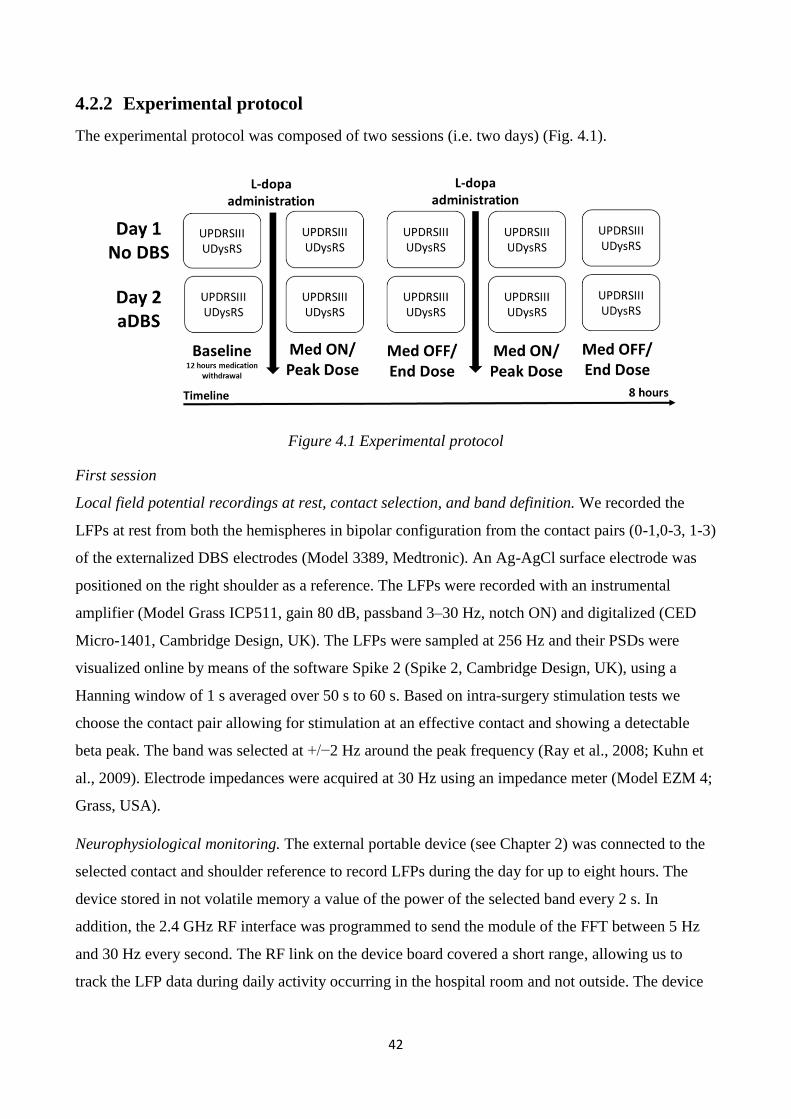
42
4.2.2 Experimental protocol
The experimental protocol was composed of two sessions (i.e. two days) (Fig. 4.1).
Figure 4.1 Experimental protocol
First session
Local field potential recordings at rest, contact selection, and band definition. We recorded the
LFPs at rest from both the hemispheres in bipolar configuration from the contact pairs (0-1,0-3, 1-3)
of the externalized DBS electrodes (Model 3389, Medtronic). An Ag-AgCl surface electrode was
positioned on the right shoulder as a reference. The LFPs were recorded with an instrumental
amplifier (Model Grass ICP511, gain 80 dB, passband 3–30 Hz, notch ON) and digitalized (CED
Micro-1401, Cambridge Design, UK). The LFPs were sampled at 256 Hz and their PSDs were
visualized online by means of the software Spike 2 (Spike 2, Cambridge Design, UK), using a
Hanning window of 1 s averaged over 50 s to 60 s. Based on intra-surgery stimulation tests we
choose the contact pair allowing for stimulation at an effective contact and showing a detectable
beta peak. The band was selected at +/−2 Hz around the peak frequency (Ray et al., 2008; Kuhn et
al., 2009). Electrode impedances were acquired at 30 Hz using an impedance meter (Model EZM 4;
Grass, USA).
Neurophysiological monitoring. The external portable device (see Chapter 2) was connected to the
selected contact and shoulder reference to record LFPs during the day for up to eight hours. The
device stored in not volatile memory a value of the power of the selected band every 2 s. In
addition, the 2.4 GHz RF interface was programmed to send the module of the FFT between 5 Hz
and 30 Hz every second. The RF link on the device board covered a short range, allowing us to
track the LFP data during daily activity occurring in the hospital room and not outside. The device
43
was connected to the belt and allocated in a pouch, thus allowing the patient to carry out daily
activities. A wearable accelerometer was placed on the arm contralateral to the stimulation to
collect kinematic data. The LFPs and acceleration data were stored in real time on the PC by means
of a custom script written in Matlab for reading data arriving at a USB access point (Fig. 4.2).
Figure 4.2 Data collection
Pharmacological treatment and clinical monitoring. The clinicians subministered to the patient a
levodopa therapy similar to the regular treatment the patient had before the operation, but decreased
the dose to accomplish the state of the patient improved by the “stun” effect of the surgery for the
DBS electrode implant. If the patient was used to taking dopamine agonists, these were substituted
with levodopa therapy when possible. In cases that such a substitution was not possible, the patient
was included in the study anyway under the hypothesis that the dopamine agonist has the same
effect as levodopa on LFPs spectral content (Priori et al., 2004). The clinical state of the patients
were monitored by an unblinded neurologist who annotated on a clinical diary the time and the
dosage of the levodopa therapy and the state of the patient. The clinical state of the patients were
evaluated in the OFF condition, during the peak dose (Med ON) and at the end of the dose before
the successive pharmacological assumption (Med OFF), with constant delays when possible. For
each evaluation, the neurologist gave scores on the following rating scales: UPDRS III and
UDysRS. At least two pharmacological cycles for each patient have been monitored (Fig. 4.1). A
clinical diary was also filled by the patient every 30 min as qualitative support in the clinical
monitoring process, but its contents do not appear in the following the analysis.
44
Second session
Tuning the stimulation threshold. With the use of our external device, the stimulation voltage was
increased in steps of 0.5 V until the appearance of side effects. At each step, a neurologist evaluated
the contralateral motor improvement. The voltage threshold was chosen as the value which
provided the greatest clinical effects without exacerbating side effects.
Setting and Testing aDBS. The aDBS device was programmed as described in Section 3.3. The
stimulation voltage changed linearly between the threshold voltage value and zero. The beta band
analysis was performed in real time as described in Chapter 2, and the stimulation voltage was
adapted proportionally on the basis of the power range given by the value of the beta power in Med
OFF condition (at rest) and the value in Med ON condition.
Neurophysiological and clinical monitoring. The neurophysiological and clinical monitoring were
done following the same methods used during the first session.
Results obtained during the two days of the experimental session were excluded if the offline
analysis of rest LFPs failed to show a significant oscillation.
4.2.3 Signal processing and statistical analysis
Local field potentials analysis
Local field potentials of nine patients were recorded from the 18 STNs five days after the implant of
DBS electrodes. The patients were 12 hr without medication at the time of the recordings. The LFPs
were recorded through the Grass amplifier (bandwidth 1–100 Hz, gain 80 db, notch ON) and
sampled at 256 Hz. Signals were filtered offline between 2 and 50 Hz in forward and backward
directions (“filtfilt” Matlab) to avoid any phase distortions. The minimum common length of the
data for all patients was 50 s. To separate the background noise to the oscillation component, we
applied the coarse-grained FFT analysis as proposed in (He et al., 2010; He et al., 2014). This
method centers on the hypothesis that the background noise is a “scale free” process having a power
spectrum following the rule 1/𝑓𝛼 . Under this assumption, the background neural noise is not given
by the averaging of transient, non-stationary oscillations, but is the result of arrhythmic activity on a
fractal domain.
The coarse-grained FFT analysis, therefore, provides three spectral estimations, Praw (power
spectrum of the raw data), Posc (power spectrum of the oscillatory), and Pfractal (power spectrum
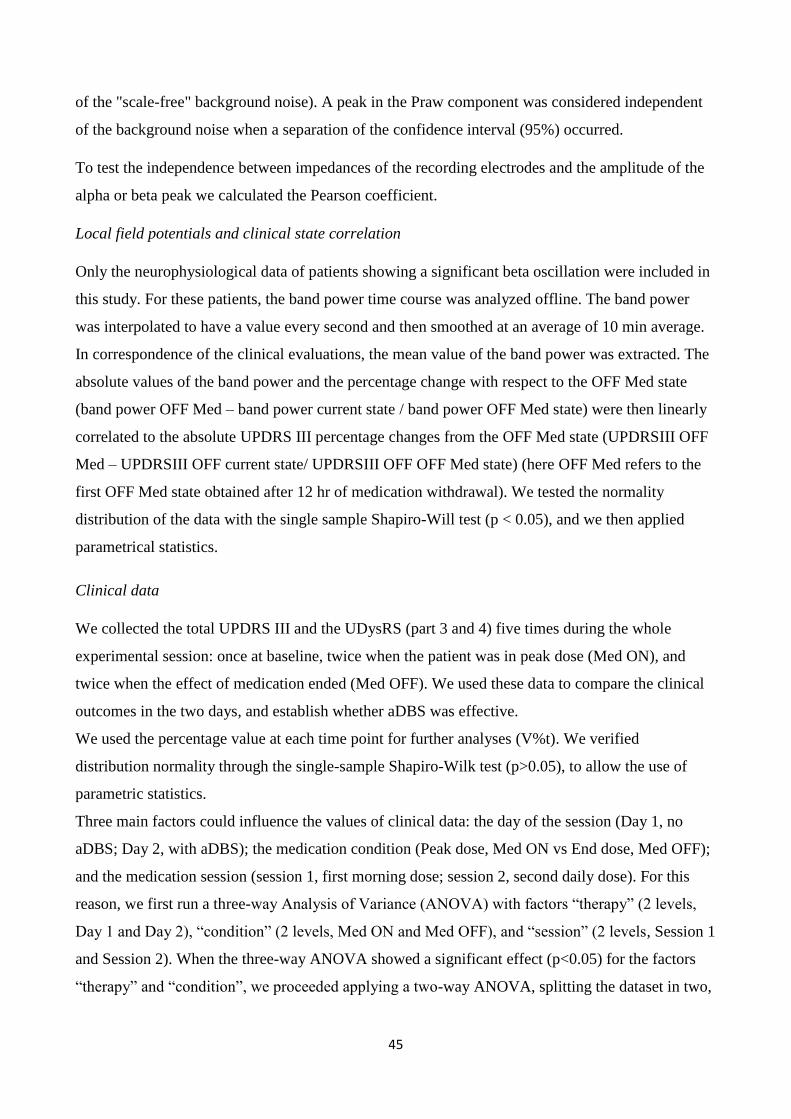
45
of the "scale-free" background noise). A peak in the Praw component was considered independent
of the background noise when a separation of the confidence interval (95%) occurred.
To test the independence between impedances of the recording electrodes and the amplitude of the
alpha or beta peak we calculated the Pearson coefficient.
Local field potentials and clinical state correlation
Only the neurophysiological data of patients showing a significant beta oscillation were included in
this study. For these patients, the band power time course was analyzed offline. The band power
was interpolated to have a value every second and then smoothed at an average of 10 min average.
In correspondence of the clinical evaluations, the mean value of the band power was extracted. The
absolute values of the band power and the percentage change with respect to the OFF Med state
(band power OFF Med – band power current state / band power OFF Med state) were then linearly
correlated to the absolute UPDRS III percentage changes from the OFF Med state (UPDRSIII OFF
Med – UPDRSIII OFF current state/ UPDRSIII OFF OFF Med state) (here OFF Med refers to the
first OFF Med state obtained after 12 hr of medication withdrawal). We tested the normality
distribution of the data with the single sample Shapiro-Will test (p < 0.05), and we then applied
parametrical statistics.
Clinical data
We collected the total UPDRS III and the UDysRS (part 3 and 4) five times during the whole
experimental session: once at baseline, twice when the patient was in peak dose (Med ON), and
twice when the effect of medication ended (Med OFF). We used these data to compare the clinical
outcomes in the two days, and establish whether aDBS was effective.
We used the percentage value at each time point for further analyses (V%t). We verified
distribution normality through the single-sample Shapiro-Wilk test (p>0.05), to allow the use of
parametric statistics.
Three main factors could influence the values of clinical data: the day of the session (Day 1, no
aDBS; Day 2, with aDBS); the medication condition (Peak dose, Med ON vs End dose, Med OFF);
and the medication session (session 1, first morning dose; session 2, second daily dose). For this
reason, we first run a three-way Analysis of Variance (ANOVA) with factors “therapy” (2 levels,
Day 1 and Day 2), “condition” (2 levels, Med ON and Med OFF), and “session” (2 levels, Session 1
and Session 2). When the three-way ANOVA showed a significant effect (p<0.05) for the factors
“therapy” and “condition”, we proceeded applying a two-way ANOVA, splitting the dataset in two,
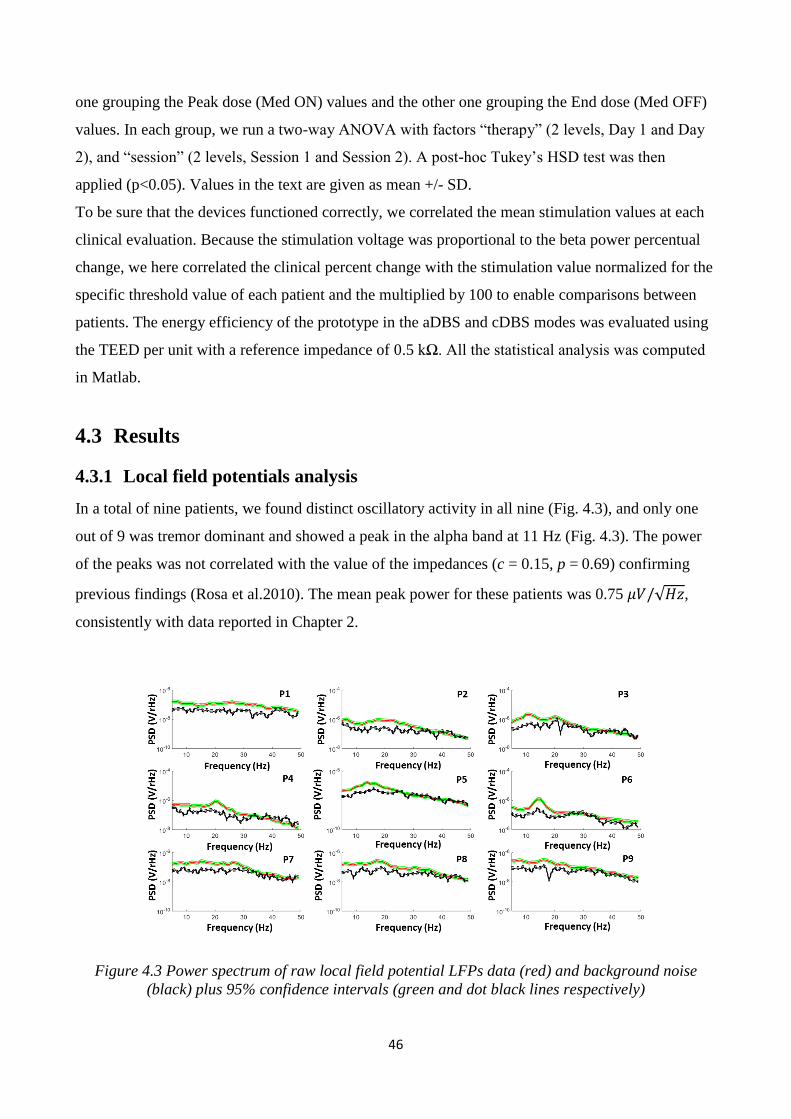
46
one grouping the Peak dose (Med ON) values and the other one grouping the End dose (Med OFF)
values. In each group, we run a two-way ANOVA with factors “therapy” (2 levels, Day 1 and Day
2), and “session” (2 levels, Session 1 and Session 2). A post-hoc Tukey’s HSD test was then
applied (p<0.05). Values in the text are given as mean +/- SD.
To be sure that the devices functioned correctly, we correlated the mean stimulation values at each
clinical evaluation. Because the stimulation voltage was proportional to the beta power percentual
change, we here correlated the clinical percent change with the stimulation value normalized for the
specific threshold value of each patient and the multiplied by 100 to enable comparisons between
patients. The energy efficiency of the prototype in the aDBS and cDBS modes was evaluated using
the TEED per unit with a reference impedance of 0.5 kΩ. All the statistical analysis was computed
in Matlab.
4.3 Results
4.3.1 Local field potentials analysis
In a total of nine patients, we found distinct oscillatory activity in all nine (Fig. 4.3), and only one
out of 9 was tremor dominant and showed a peak in the alpha band at 11 Hz (Fig. 4.3). The power
of the peaks was not correlated with the value of the impedances (c = 0.15, p = 0.69) confirming
previous findings (Rosa et al.2010). The mean peak power for these patients was 0.75 𝜇𝑉/√𝐻𝑧,
consistently with data reported in Chapter 2.
Figure 4.3 Power spectrum of raw local field potential LFPs data (red) and background noise
(black) plus 95% confidence intervals (green and dot black lines respectively)
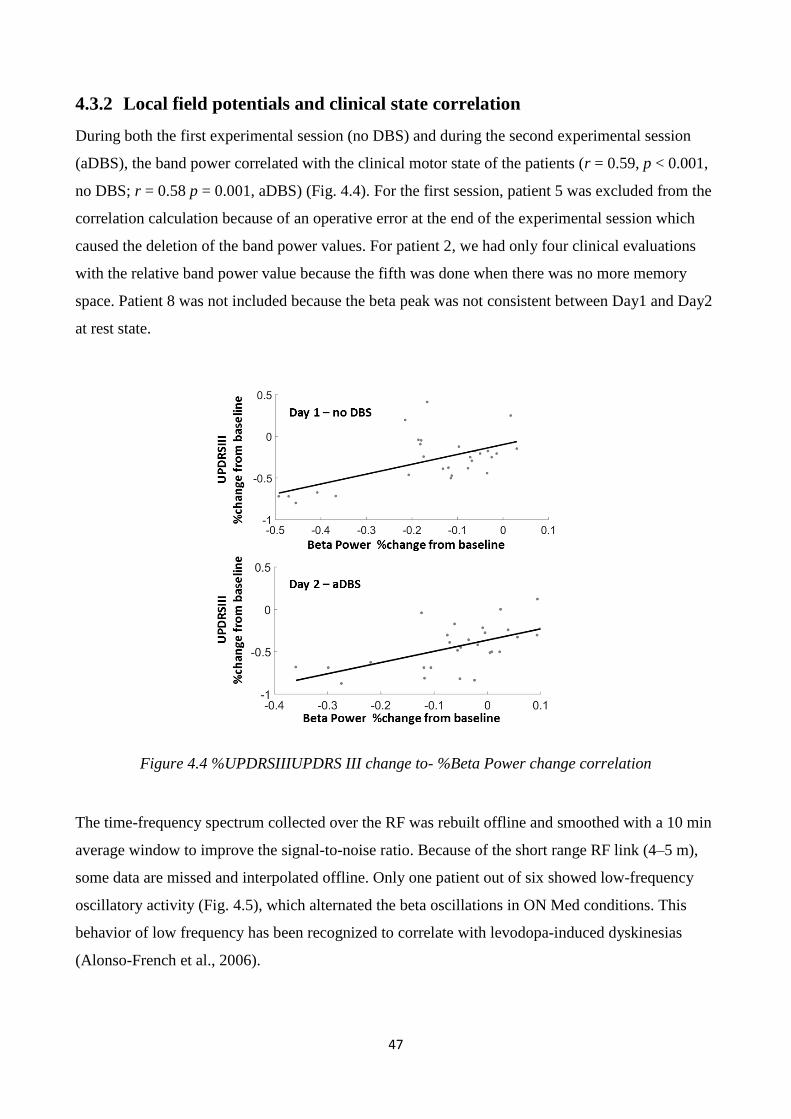
47
4.3.2 Local field potentials and clinical state correlation
During both the first experimental session (no DBS) and during the second experimental session
(aDBS), the band power correlated with the clinical motor state of the patients (r = 0.59, p < 0.001,
no DBS; r = 0.58 p = 0.001, aDBS) (Fig. 4.4). For the first session, patient 5 was excluded from the
correlation calculation because of an operative error at the end of the experimental session which
caused the deletion of the band power values. For patient 2, we had only four clinical evaluations
with the relative band power value because the fifth was done when there was no more memory
space. Patient 8 was not included because the beta peak was not consistent between Day1 and Day2
at rest state.
Figure 4.4 %UPDRSIIIUPDRS III change to- %Beta Power change correlation
The time-frequency spectrum collected over the RF was rebuilt offline and smoothed with a 10 min
average window to improve the signal-to-noise ratio. Because of the short range RF link (4–5 m),
some data are missed and interpolated offline. Only one patient out of six showed low-frequency
oscillatory activity (Fig. 4.5), which alternated the beta oscillations in ON Med conditions. This
behavior of low frequency has been recognized to correlate with levodopa-induced dyskinesias
(Alonso-French et al., 2006).
48
Figure 4.5 Time-frequency - Patient 4
4.3.3 Clinical data
aDBS was effective in improving UPDRS III motor scores by almost 35% when the patient was
OFF medication. In fact, the three-way ANOVA run on UPDRS III percentage changes from
baseline showed that both the “therapy” (Day 1 vs Day 2) and the “condition” (Med OFF vs Med
ON) had a significant effect (p=0.038 and p<0.001 respectively). This result allowed us to break up
the data into two groups, Med OFF and Med ON. In the Med OFF condition, when the patient was
at the end of the levodopa dose effect, only during Day 2, with aDBS ON, the patients experienced
a significant improvement from baseline (two-way ANOVA factor “therapy” p=0.033, Day 1 vs
Day 2: -9.8 +/- 25.8% vs -32.9 +/- 24.7%). There was no difference between the two sessions (two-
way ANOVA factor “session” p=0.55), nor between the two sessions in the two days (two-way
ANOVA factor interaction “session” x “therapy” p= 0.67). Conversely, when patients were on peak
dose (Med ON), the effect of levodopa was predominant on that of aDBS, and, in the two days, the
UPDRS III improvement was similar (two-way ANOVA factor “therapy” p=0.43, Day 1 vs Day 2:
-48.5 +/- 18.8% vs -55.1 +/- 22.0%). Again, there was no difference between the two sessions (two-
way ANOVA factor “session” p=0.60), nor between the two sessions in the two days (two-way
ANOVA factor interaction “session” x “therapy” p= 0.72).
The UDysRS remained unchanged in all conditions (three-way ANOVA factor “therapy” p=0.80,
factor “condition” p=0.11, factor “session” p=0.40).
The stimulation voltage correlated linearly with the percentage UPDRS III change (r = −0.51,
p = 0.0004) (Fig. 4.6), and the correlation is negative because of the formulation of the adaptive
rule. Assuming cDBS with a voltage equal to the max value of aDBS we would have reduced the
TEED by 70%.
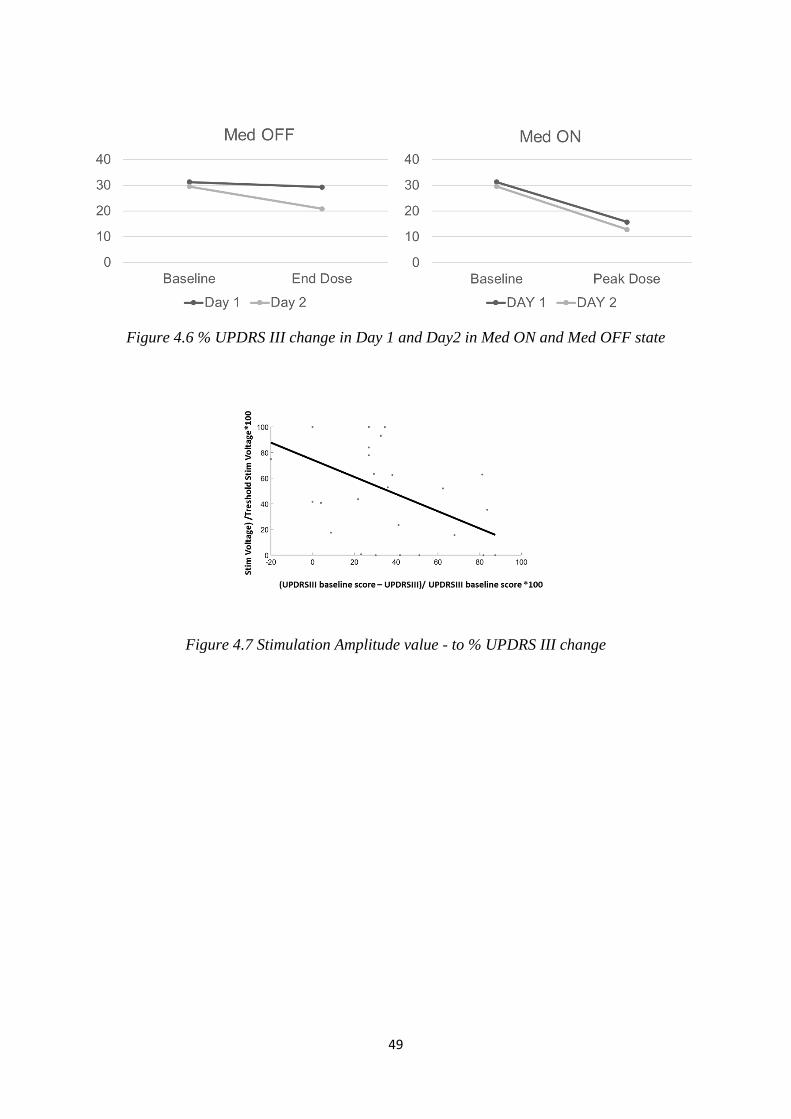
49
Figure 4.6 % UPDRS III change in Day 1 and Day2 in Med ON and Med OFF state
Figure 4.7 Stimulation Amplitude value - to % UPDRS III change
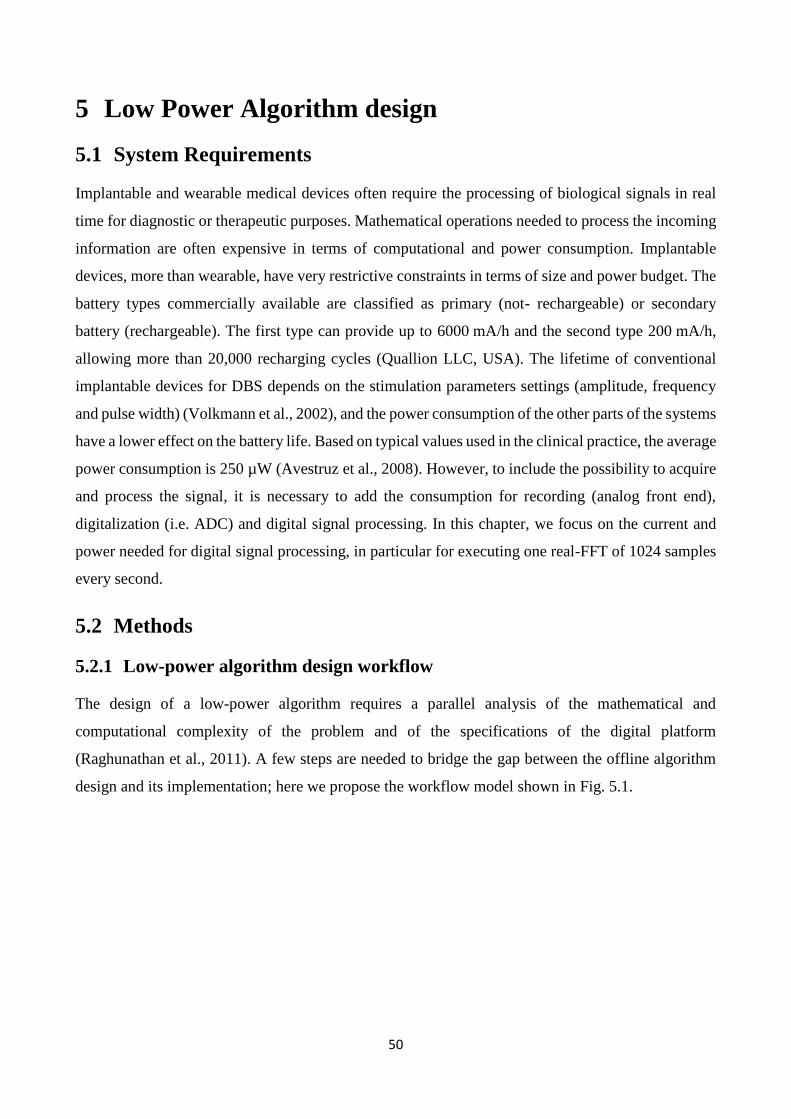
50
5 Low Power Algorithm design
5.1 System Requirements
Implantable and wearable medical devices often require the processing of biological signals in real
time for diagnostic or therapeutic purposes. Mathematical operations needed to process the incoming
information are often expensive in terms of computational and power consumption. Implantable
devices, more than wearable, have very restrictive constraints in terms of size and power budget. The
battery types commercially available are classified as primary (not- rechargeable) or secondary
battery (rechargeable). The first type can provide up to 6000 mA/h and the second type 200 mA/h,
allowing more than 20,000 recharging cycles (Quallion LLC, USA). The lifetime of conventional
implantable devices for DBS depends on the stimulation parameters settings (amplitude, frequency
and pulse width) (Volkmann et al., 2002), and the power consumption of the other parts of the systems
have a lower effect on the battery life. Based on typical values used in the clinical practice, the average
power consumption is 250 µW (Avestruz et al., 2008). However, to include the possibility to acquire
and process the signal, it is necessary to add the consumption for recording (analog front end),
digitalization (i.e. ADC) and digital signal processing. In this chapter, we focus on the current and
power needed for digital signal processing, in particular for executing one real-FFT of 1024 samples
every second.
5.2 Methods
5.2.1 Low-power algorithm design workflow
The design of a low-power algorithm requires a parallel analysis of the mathematical and
computational complexity of the problem and of the specifications of the digital platform
(Raghunathan et al., 2011). A few steps are needed to bridge the gap between the offline algorithm
design and its implementation; here we propose the workflow model shown in Fig. 5.1.
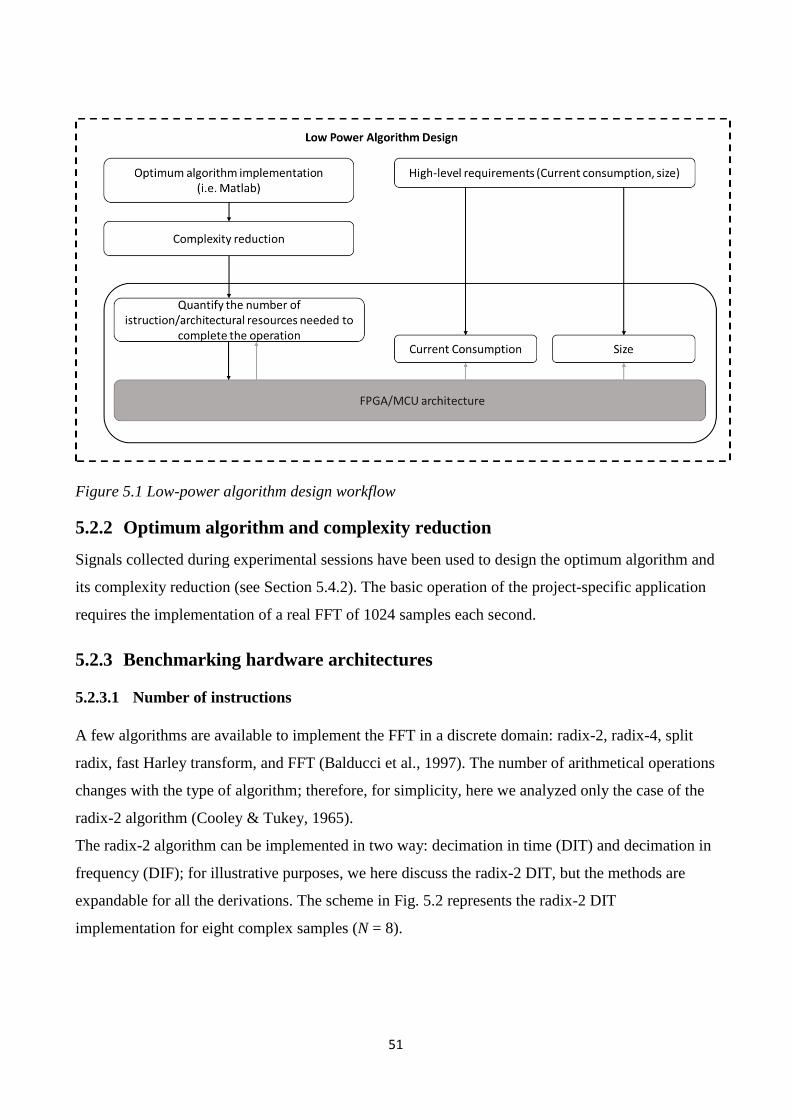
51
Figure 5.1 Low-power algorithm design workflow
5.2.2 Optimum algorithm and complexity reduction
Signals collected during experimental sessions have been used to design the optimum algorithm and
its complexity reduction (see Section 5.4.2). The basic operation of the project-specific application
requires the implementation of a real FFT of 1024 samples each second.
5.2.3 Benchmarking hardware architectures
5.2.3.1 Number of instructions
A few algorithms are available to implement the FFT in a discrete domain: radix-2, radix-4, split
radix, fast Harley transform, and FFT (Balducci et al., 1997). The number of arithmetical operations
changes with the type of algorithm; therefore, for simplicity, here we analyzed only the case of the
radix-2 algorithm (Cooley & Tukey, 1965).
The radix-2 algorithm can be implemented in two way: decimation in time (DIT) and decimation in
frequency (DIF); for illustrative purposes, we here discuss the radix-2 DIT, but the methods are
expandable for all the derivations. The scheme in Fig. 5.2 represents the radix-2 DIT
implementation for eight complex samples (N = 8).
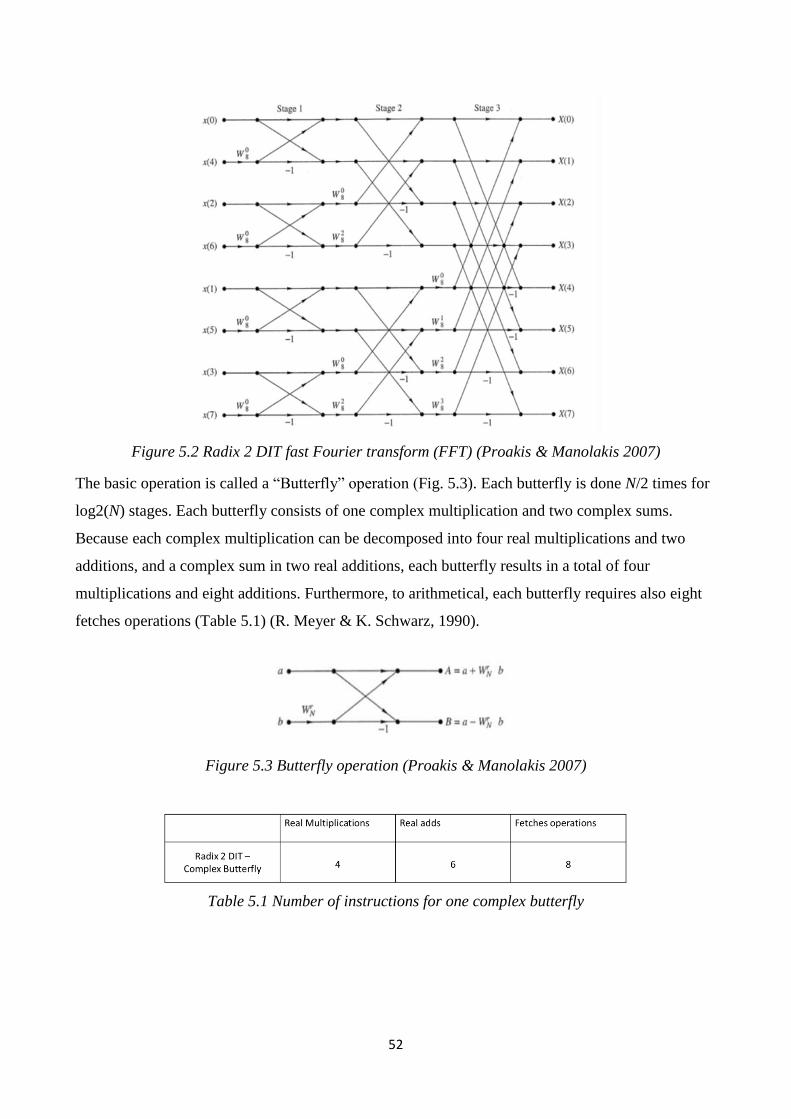
52
Figure 5.2 Radix 2 DIT fast Fourier transform (FFT) (Proakis & Manolakis 2007)
The basic operation is called a “Butterfly” operation (Fig. 5.3). Each butterfly is done N/2 times for
log2(N) stages. Each butterfly consists of one complex multiplication and two complex sums.
Because each complex multiplication can be decomposed into four real multiplications and two
additions, and a complex sum in two real additions, each butterfly results in a total of four
multiplications and eight additions. Furthermore, to arithmetical, each butterfly requires also eight
fetches operations (Table 5.1) (R. Meyer & K. Schwarz, 1990).
Figure 5.3 Butterfly operation (Proakis & Manolakis 2007)
Table 5.1 Number of instructions for one complex butterfly
53
N complex numbers can be represented by two vectors of N samples, one for the real part and one
for the imaginary part. The factors “W” are named twiddle factors and are complex numbers
representing the exponential terms of the discrete Fourier transform (DFT). The completion of one
butterfly requires four load and four store operations for data and two load operations for twiddle
factors (optional).
The total number of instructions per butterfly is therefore 18, and if N = 1024 then the number of
instructions for a complex radix-2 DIT FFT is 92,160. For instance, if each instruction is computed
in one cycle, then for a clock frequency of 1 MHz, the operation is concluded in 0.09 s. Given the
number of arithmetical operations and the type of instructions, the type of processor strongly
impacts on the time and the power consumed for the computation (R. Meyer & K. Schwarz, 1990).
5.2.3.2 Number of architectural resources and field-programmable gate arrays’
performances
The choice of the hardware to implement the algorithm is mainly constrained by the power
consumption.
Digital signal processors (DSPs) are the best choice in terms of computational efficiency, but their
current consumption is too high for implantable devices; on the other hand, ultra-low power
microcontrollers are not suitable for real-time processing applications. However, the recent spread
of the wearable and automotive sectors has pushed the industries to develop new solutions for low-
power processing. An example is the ultra-low power microcontroller MSP430FR5994 (Texas
Instrument, Dallas, Texas, USA). This particular microcontroller includes a peripheral called low-
energy accelerator (LEA) for signal processing, which can perform typical processing operations
(FIR, FFT) without calling the central processing unit (CPU), thus achieving lower power
consumption and computational time.
Custom solutions such as application-specific integrated circuits (ASICs) ensure high performance
with concurrent low power consumption and low area; however, their development implies high
costs, long time, and high complexity and risk. A trade-off solution is presented by field-
programmable gate arrays (FPGAs), which, in contrast, are reconfigurable, low cost, easier and
faster to develop. These devices are in fact programmable with hardware description languages
(HDLs) such as Verilog (VHDL). FPGAs consist of logic blocks including look-up tables (LUTs)
connected to a multiplexer and to a flip flop; each LUT has four inputs, which configure Boolean
functions. An FPGA has a routing architecture made of lines and switches in order to connect more
LUTs or logic blocks and to create more complex functions. Compare to ASICs, the area and the
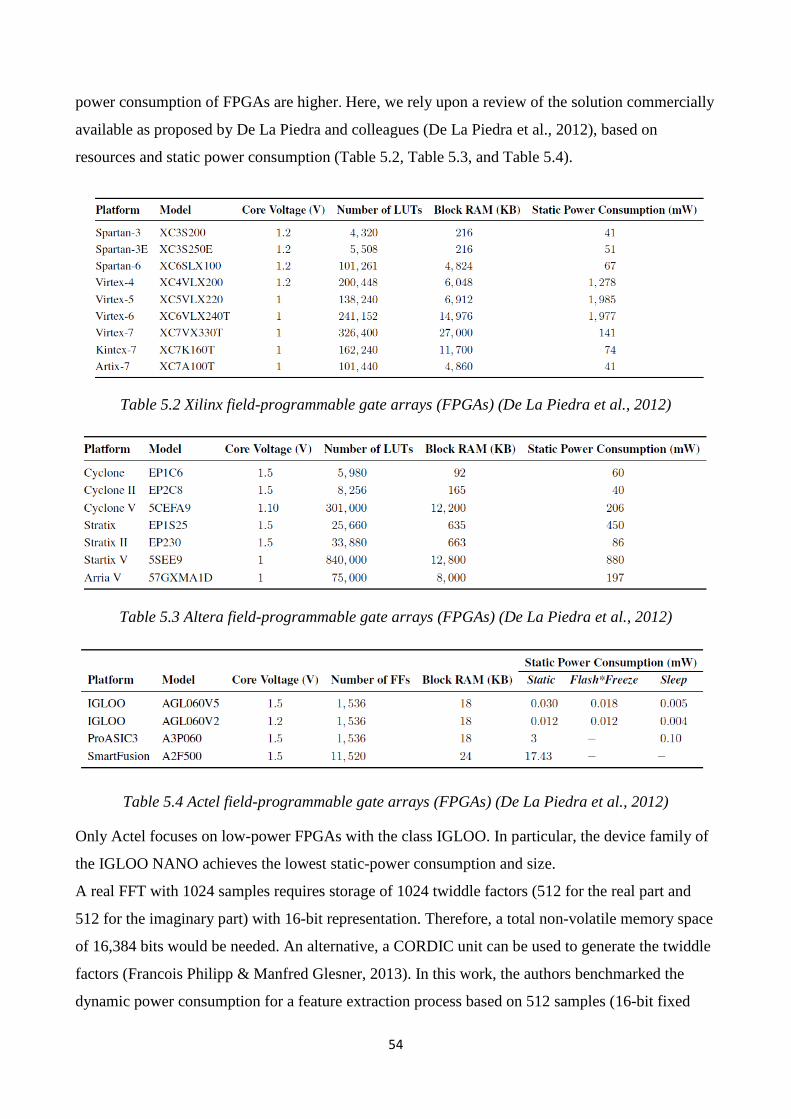
54
power consumption of FPGAs are higher. Here, we rely upon a review of the solution commercially
available as proposed by De La Piedra and colleagues (De La Piedra et al., 2012), based on
resources and static power consumption (Table 5.2, Table 5.3, and Table 5.4).
Table 5.2 Xilinx field-programmable gate arrays (FPGAs) (De La Piedra et al., 2012)
Table 5.3 Altera field-programmable gate arrays (FPGAs) (De La Piedra et al., 2012)
Table 5.4 Actel field-programmable gate arrays (FPGAs) (De La Piedra et al., 2012)
Only Actel focuses on low-power FPGAs with the class IGLOO. In particular, the device family of
the IGLOO NANO achieves the lowest static-power consumption and size.
A real FFT with 1024 samples requires storage of 1024 twiddle factors (512 for the real part and
512 for the imaginary part) with 16-bit representation. Therefore, a total non-volatile memory space
of 16,384 bits would be needed. An alternative, a CORDIC unit can be used to generate the twiddle
factors (Francois Philipp & Manfred Glesner, 2013). In this work, the authors benchmarked the
dynamic power consumption for a feature extraction process based on 512 samples (16-bit fixed
55
point) complex FFT implemented on the IGLOO FPGA (AGL1005), on a Xilinx Spartan6
(XC6SLX9, with and without using DSP resources) and a TI MSP430F1611 MCU. Based on a duty
cycle and static power (standby mode current at 3 V for the MCU), the average power consumption
is on the order of 𝑚𝑊 for the Spartan 6 (with and without DSP) and for the MCU, and of 𝜇𝑊 for
the IGLOO (Francois Philipp & Manfred Glesner, 2013). They showed that the dynamic power
consumption is similar if using the two FPGA types, lower if DSP blocks were used and higher if
CPU. The advantage of the IGLOO FPGA over the Spartan 6 is the low static power (see Table 5.2
and Table 5.4 for the comparison). Thanks to this feature, the IGLOO FPGA is suitable for long-
term applications that require performing the FFT with a certain duty cycle, and the platform can
stay in sleep mode most of the time.
Francois Philipp and Manfred Glesner (2013) used an IGLOO FPGA having a static power of about
50 𝜇𝑊, other FPGAs of the same family have lower static power, but also fewer resources (gate
and logic cells), and the authors declared that 75% of the total number of logic cells were used for
three parallel multiply and accumulate (MAC) units.
An ASIC realization of a low-power FFT hardware accelerator was presented by Kwong and
Chandrakasan (2011), consuming 616 𝑛𝐽 for a 512 point FFT, compared to the FPGA (2514 𝑛𝐽)
(Francois Philipp & Manfred Glesner, 2013), the energy was reduced by a factor of 4.
Excluding the ASIC results, the energy consumption of 2514 𝑛𝐽 for FFT computation and average
power consumption of 50 𝜇𝑊 (best case) were considered as benchmark values for MCU
comparison. In Section 5.2.3.3, we provide a theoretical calculation of the two values (in terms of
task-related energy and average power consumption), with a 512-sample FFT (16-bit fixed-point
FFT) is performed each second on the MCU TI MSP430FR994.
5.2.3.3 Microcontroller units’ performances
As abovementioned, the MSP430FR994 MCU includes a low-energy accelerator (LEA) for signal
processing. This peripheral shared with the CPU 8 Kbytes of RAM memory to load the data vector
and could be called by the CPU. In addition to conventional RAM space, this class of MCU also
has non-volatile ferroelectric random access memory (FRAM) which can be written with a lower
current than typical flash memory. More importantly, the MSP430FR994 has several low-power
operating modes, distinguished for the clock resources and peripherals available. As rule of thumb,
the lower the clock rate, the lower the power consumption.
The clock sources for the system are five in total (see Fig. 5.4):
- two external:
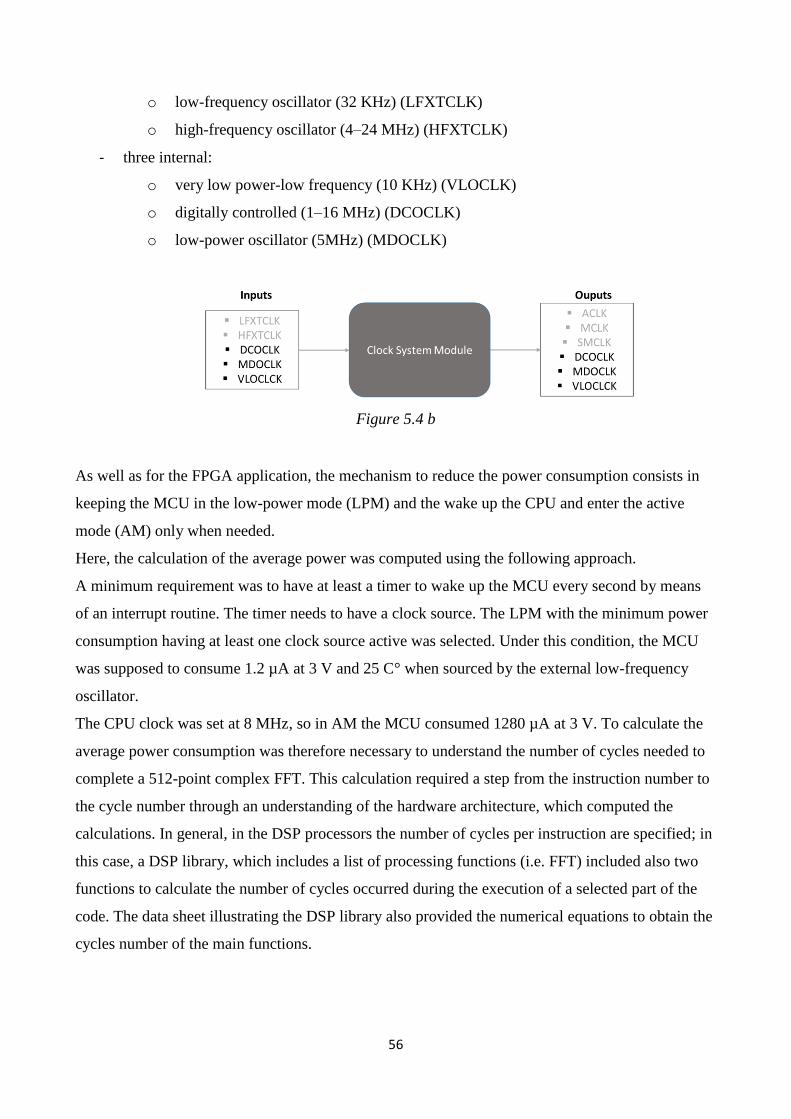
56
o low-frequency oscillator (32 KHz) (LFXTCLK)
o high-frequency oscillator (4–24 MHz) (HFXTCLK)
- three internal:
o very low power-low frequency (10 KHz) (VLOCLK)
o digitally controlled (1–16 MHz) (DCOCLK)
o low-power oscillator (5MHz) (MDOCLK)
Figure 5.4 b
As well as for the FPGA application, the mechanism to reduce the power consumption consists in
keeping the MCU in the low-power mode (LPM) and the wake up the CPU and enter the active
mode (AM) only when needed.
Here, the calculation of the average power was computed using the following approach.
A minimum requirement was to have at least a timer to wake up the MCU every second by means
of an interrupt routine. The timer needs to have a clock source. The LPM with the minimum power
consumption having at least one clock source active was selected. Under this condition, the MCU
was supposed to consume 1.2 µA at 3 V and 25 C° when sourced by the external low-frequency
oscillator.
The CPU clock was set at 8 MHz, so in AM the MCU consumed 1280 µA at 3 V. To calculate the
average power consumption was therefore necessary to understand the number of cycles needed to
complete a 512-point complex FFT. This calculation required a step from the instruction number to
the cycle number through an understanding of the hardware architecture, which computed the
calculations. In general, in the DSP processors the number of cycles per instruction are specified; in
this case, a DSP library, which includes a list of processing functions (i.e. FFT) included also two
functions to calculate the number of cycles occurred during the execution of a selected part of the
code. The data sheet illustrating the DSP library also provided the numerical equations to obtain the
cycles number of the main functions.
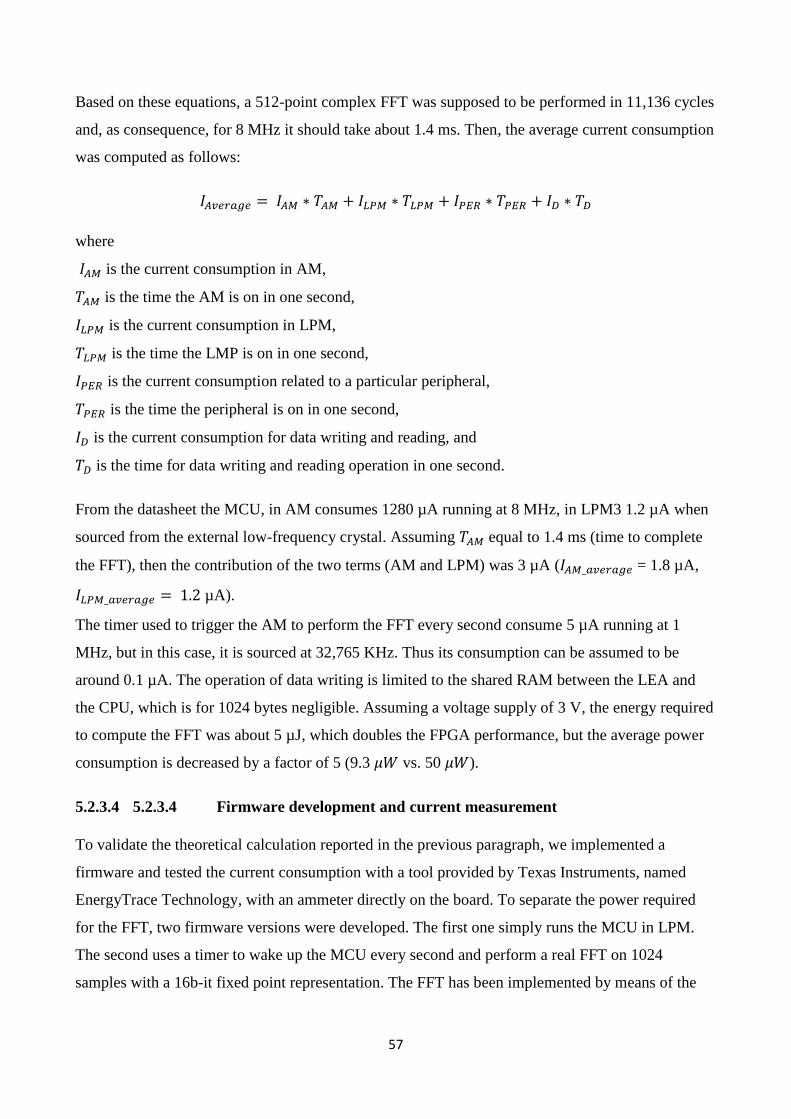
57
Based on these equations, a 512-point complex FFT was supposed to be performed in 11,136 cycles
and, as consequence, for 8 MHz it should take about 1.4 ms. Then, the average current consumption
was computed as follows:
𝐼𝐴𝑣𝑒𝑟𝑎𝑔𝑒 = 𝐼𝐴𝑀 ∗ 𝑇𝐴𝑀 + 𝐼𝐿𝑃𝑀 ∗ 𝑇𝐿𝑃𝑀 + 𝐼𝑃𝐸𝑅 ∗ 𝑇𝑃𝐸𝑅 + 𝐼𝐷 ∗ 𝑇𝐷
where
𝐼𝐴𝑀 is the current consumption in AM,
𝑇𝐴𝑀 is the time the AM is on in one second,
𝐼𝐿𝑃𝑀 is the current consumption in LPM,
𝑇𝐿𝑃𝑀 is the time the LMP is on in one second,
𝐼𝑃𝐸𝑅 is the current consumption related to a particular peripheral,
𝑇𝑃𝐸𝑅 is the time the peripheral is on in one second,
𝐼𝐷 is the current consumption for data writing and reading, and
𝑇𝐷 is the time for data writing and reading operation in one second.
From the datasheet the MCU, in AM consumes 1280 µA running at 8 MHz, in LPM3 1.2 µA when
sourced from the external low-frequency crystal. Assuming 𝑇𝐴𝑀 equal to 1.4 ms (time to complete
the FFT), then the contribution of the two terms (AM and LPM) was 3 µA (𝐼𝐴𝑀_𝑎𝑣𝑒𝑟𝑎𝑔𝑒 = 1.8 µA,
𝐼𝐿𝑃𝑀_𝑎𝑣𝑒𝑟𝑎𝑔𝑒 = 1.2 µA).
The timer used to trigger the AM to perform the FFT every second consume 5 µA running at 1
MHz, but in this case, it is sourced at 32,765 KHz. Thus its consumption can be assumed to be
around 0.1 µA. The operation of data writing is limited to the shared RAM between the LEA and
the CPU, which is for 1024 bytes negligible. Assuming a voltage supply of 3 V, the energy required
to compute the FFT was about 5 µJ, which doubles the FPGA performance, but the average power
consumption is decreased by a factor of 5 (9.3 𝜇𝑊 vs. 50 𝜇𝑊).
5.2.3.4 5.2.3.4 Firmware development and current measurement
To validate the theoretical calculation reported in the previous paragraph, we implemented a
firmware and tested the current consumption with a tool provided by Texas Instruments, named
EnergyTrace Technology, with an ammeter directly on the board. To separate the power required
for the FFT, two firmware versions were developed. The first one simply runs the MCU in LPM.
The second uses a timer to wake up the MCU every second and perform a real FFT on 1024
samples with a 16b-it fixed point representation. The FFT has been implemented by means of the
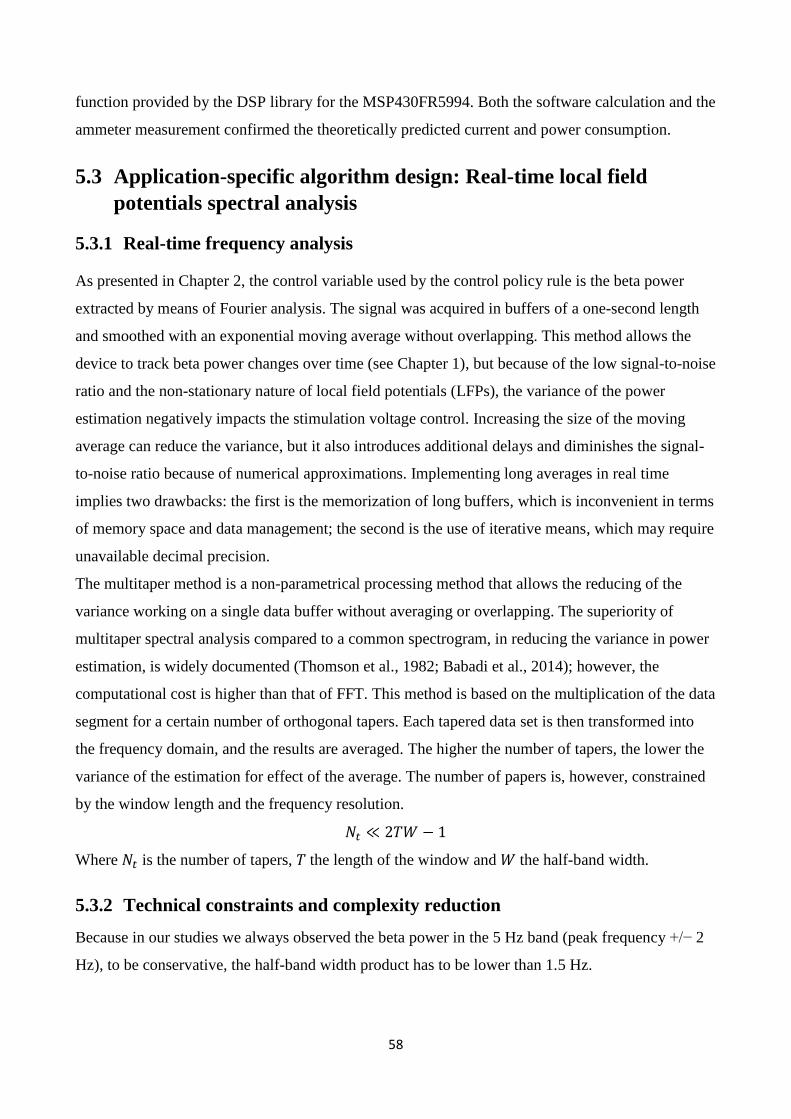
58
function provided by the DSP library for the MSP430FR5994. Both the software calculation and the
ammeter measurement confirmed the theoretically predicted current and power consumption.
5.3 Application-specific algorithm design: Real-time local field
potentials spectral analysis
5.3.1 Real-time frequency analysis
As presented in Chapter 2, the control variable used by the control policy rule is the beta power
extracted by means of Fourier analysis. The signal was acquired in buffers of a one-second length
and smoothed with an exponential moving average without overlapping. This method allows the
device to track beta power changes over time (see Chapter 1), but because of the low signal-to-noise
ratio and the non-stationary nature of local field potentials (LFPs), the variance of the power
estimation negatively impacts the stimulation voltage control. Increasing the size of the moving
average can reduce the variance, but it also introduces additional delays and diminishes the signal-
to-noise ratio because of numerical approximations. Implementing long averages in real time
implies two drawbacks: the first is the memorization of long buffers, which is inconvenient in terms
of memory space and data management; the second is the use of iterative means, which may require
unavailable decimal precision.
The multitaper method is a non-parametrical processing method that allows the reducing of the
variance working on a single data buffer without averaging or overlapping. The superiority of
multitaper spectral analysis compared to a common spectrogram, in reducing the variance in power
estimation, is widely documented (Thomson et al., 1982; Babadi et al., 2014); however, the
computational cost is higher than that of FFT. This method is based on the multiplication of the data
segment for a certain number of orthogonal tapers. Each tapered data set is then transformed into
the frequency domain, and the results are averaged. The higher the number of tapers, the lower the
variance of the estimation for effect of the average. The number of papers is, however, constrained
by the window length and the frequency resolution.
𝑁𝑡 ≪ 2𝑇𝑊 − 1
Where 𝑁𝑡 is the number of tapers, 𝑇 the length of the window and 𝑊 the half-band width.
5.3.2 Technical constraints and complexity reduction
Because in our studies we always observed the beta power in the 5 Hz band (peak frequency +/− 2
Hz), to be conservative, the half-band width product has to be lower than 1.5 Hz.
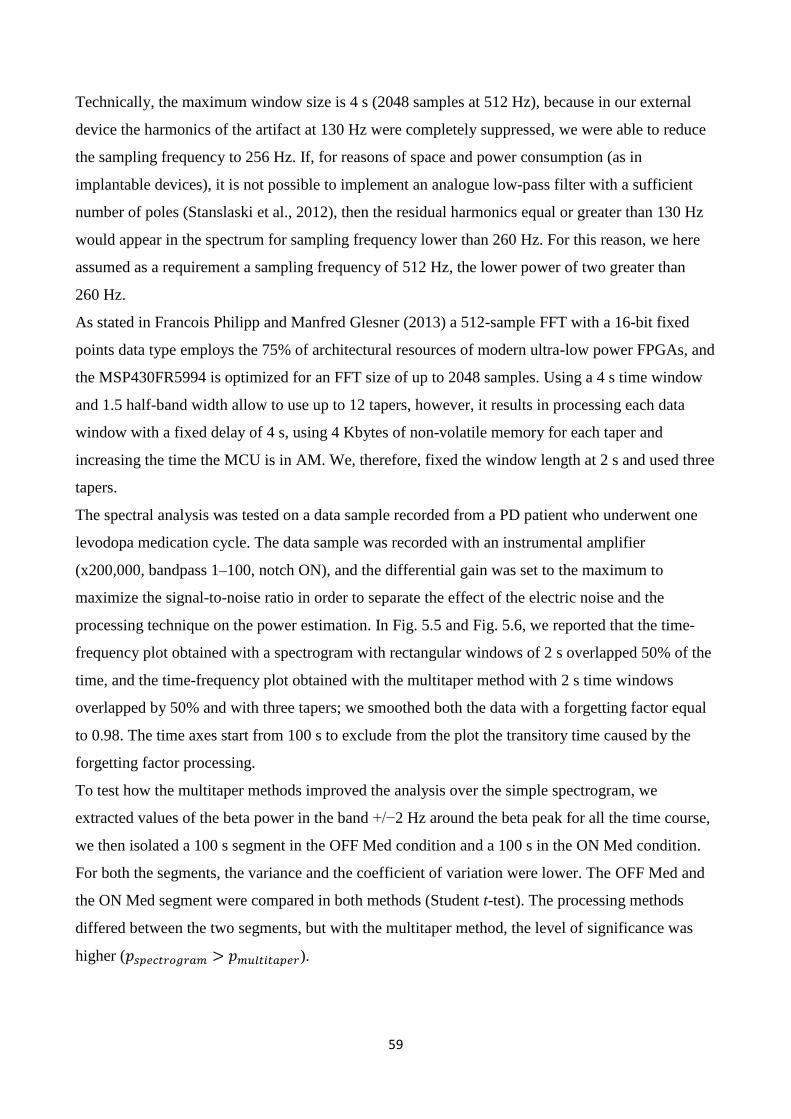
59
Technically, the maximum window size is 4 s (2048 samples at 512 Hz), because in our external
device the harmonics of the artifact at 130 Hz were completely suppressed, we were able to reduce
the sampling frequency to 256 Hz. If, for reasons of space and power consumption (as in
implantable devices), it is not possible to implement an analogue low-pass filter with a sufficient
number of poles (Stanslaski et al., 2012), then the residual harmonics equal or greater than 130 Hz
would appear in the spectrum for sampling frequency lower than 260 Hz. For this reason, we here
assumed as a requirement a sampling frequency of 512 Hz, the lower power of two greater than
260 Hz.
As stated in Francois Philipp and Manfred Glesner (2013) a 512-sample FFT with a 16-bit fixed
points data type employs the 75% of architectural resources of modern ultra-low power FPGAs, and
the MSP430FR5994 is optimized for an FFT size of up to 2048 samples. Using a 4 s time window
and 1.5 half-band width allow to use up to 12 tapers, however, it results in processing each data
window with a fixed delay of 4 s, using 4 Kbytes of non-volatile memory for each taper and
increasing the time the MCU is in AM. We, therefore, fixed the window length at 2 s and used three
tapers.
The spectral analysis was tested on a data sample recorded from a PD patient who underwent one
levodopa medication cycle. The data sample was recorded with an instrumental amplifier
(x200,000, bandpass 1–100, notch ON), and the differential gain was set to the maximum to
maximize the signal-to-noise ratio in order to separate the effect of the electric noise and the
processing technique on the power estimation. In Fig. 5.5 and Fig. 5.6, we reported that the time-
frequency plot obtained with a spectrogram with rectangular windows of 2 s overlapped 50% of the
time, and the time-frequency plot obtained with the multitaper method with 2 s time windows
overlapped by 50% and with three tapers; we smoothed both the data with a forgetting factor equal
to 0.98. The time axes start from 100 s to exclude from the plot the transitory time caused by the
forgetting factor processing.
To test how the multitaper methods improved the analysis over the simple spectrogram, we
extracted values of the beta power in the band +/−2 Hz around the beta peak for all the time course,
we then isolated a 100 s segment in the OFF Med condition and a 100 s in the ON Med condition.
For both the segments, the variance and the coefficient of variation were lower. The OFF Med and
the ON Med segment were compared in both methods (Student t-test). The processing methods
differed between the two segments, but with the multitaper method, the level of significance was
higher (𝑝𝑠𝑝𝑒𝑐𝑡𝑟𝑜𝑔𝑟𝑎𝑚 > 𝑝𝑚𝑢𝑙𝑡𝑖𝑡𝑎𝑝𝑒𝑟).
60
Figure 5.5 Spectrogram (periodogram)
Figure 5.6 Spectrogram (multitaper method)
5.3.3 Algorithm implementation and power consumption
Compared to the spectrogram, the multitaper method requires additional processing: data tapering, a
number of FFT equal to the number of tapers and averaging FFT modules.
As mentioned above, the average current consumption for a real FFT of 1024 samples performed
every second is 3.1 µ𝐴. To compare the spectrogram to the multitaper current requirement, we here
focused on the FFT operation and considered the module calculation on a second analysis. For the
above-selected parameters (T = 2 s, W = 1.5 Hz, tapers = 3), the multi-tapers analysis requires 3*N
multiplication and three real FFTs of 1024 samples. Because 3N multiplications of 16-bit fixed-
point datatypes take 0.58 𝑚𝑠, the total time the MCU stays in AM is 4.8 𝑚𝑠, resulting in an average
current consumption of 7.3 µ𝐴. The module of the three FFT realizations needs to be calculated and
averaged.
The computation of the FFT module implies square roots, multiplications, and sums; however, it
can be simplified by calculating it for only the frequencies of interest. Following the
abovementioned approach, we calculated the number of cycles for the calculation of the module for
a 5 Hz band with a 0.5 Hz frequency resolution for both spectrogram and multitaper method (1.6 µ𝐴
vs 2.5 µ𝐴). The total current consumption for the multitaper method is therefore about 9.8 µ𝐴.

61
An alternative solution to the MSP430FR5994 is the latest generation of MCUs, such as the Cortex
M4 CPU. The Cortex M4 microprocessor differently from the previous versions have DSP
instructions and a floating point unit (FPU). These additional features allow one to perform
processing operations faster and with greater precision. To theoretically calculate the current
consumption, we applied the same method used for the MSP430FR4994 to the STM32L4KC,
which is an MCU of the family of STM32L4 (ST Microelectronics, Geneva, Swiss) with a Cortex
M4 CPU. Despite the average current of this MCU, for the same multitaper algorithm, it resulted in
about double the MSP430; it is still suitable for implantable devices sourced by secondary batteries,
and because it can process 32-bit and floating point data types, it is suitable for neural signals
having a low signal-to-noise ratio.
62
6 Discussion
6.1 Technological considerations and further steps
We developed an external portable LFP-based aDBS prototype intended for use in PD patients with
externalized DBS leads. The system portability allowed us to test aDBS in ecologic conditions (i.e.
during daily activity in perioperative experimental sessions). Before, starting the experimental
protocols, we validated the device in vitro and in vivo.
The main objectives of the validation procedures were to test the sensing and the processing
functionalities. During in vitro tests, we proved that the device, despite the concurrent presence of
stimulation artifact, estimated the power change of a sinusoidal signal, which varied in the
amplitude of 1 µVrms. We also proved its functioning in tracking LFP spectral power changes
during stimulation in a PD patient. The aDBS prototype extracted the beta band power in real time
with the firmware and the expected tracking lag. The internal parameters were personalized
according to the specific LFP spectral features of the patient with 1 Hz resolution (peak and
frequency band). To verify that the beta power time course was associated with the patient’s clinical
conditions and not with random changes, we applied the change point analysis, and controlled that
the change points detected were relative to levodopa or DBS. The outputs of the change point
analysis confirmed the relationship between the beta power modulations and the different clinical
states.
One drawback of the external aDBS device is that it is a single-channel device, for both recording
and stimulating. This feature requires the use of two devices if a bilateral setting is needed.
Moreover, the pass band of the analog front end cuts the LFPs between 2 and 40 Hz, and although
beta band activity represents the primary choice for the control variable, it can prevent the
possibility of recording higher frequencies such as gamma oscillations. The coupling between beta
oscillations phase and gamma oscillations amplitude (i.e. the PAC) has been recently reported as
possible pathophysiological mechanism of the parkinsonian state, thus being a potential candidate
as a control variable (de Hemptinne et al., 2015; Connolly et al., 2015). Moreover, in this project,
we focused on spectral power estimation, but higher-order analysis may prove to extract most
robust control variables, thus requiring more processing resources.
Other groups have investigated aDBS or new stimulation protocols with fixed platforms, ensuring
greater processing possibilities (Rosin et al., 2011; Hauptmann et al., 2009; Little et al., 2013), but
limiting the testing to patients unable to move. In fact, the power consumption and the space
constraints have a negative impact on the processing possibilities, especially for implantable
63
devices that which require and hardware and firmware co-design (Rouse et al., 2012). The main
drawback of implementing feature extraction processing in hardware is the lack of flexibility, even
though they may be required to reduce power consumption. The implantable device presented by
Rouse et al (2012) presents analog filters to isolate oscillations with a frequency resolution of 5 Hz
and with a tunable band. This solution allows real-time measurement of the rectified voltage of the
interested frequency band. Moreover, systems on chip (SoC) with digital filter banks for power
extraction have been proposed for seizure detection devices (Verma et al., 2010). In the case of PD,
the open questions about physiological and DBS mechanisms lead to the choice of designing
implantable devices with explorative purposes having processing flexibility as one of the main
requirements. Although, it was focused on FFT computation, in Chapter 5 we showed that modern
microcontrollers can be preferred to FPGA implementations, and the ASIC solution should be
adopted only if the entity of the calculations surpasses the MCU possibilities. It is, therefore,
desirable that future implantable devices for neurological disorders should not be limited to
hardware processing but include flexible reprogrammable platforms.
The development of an external portable device provides a trade-off solution that can preserve the
flexibility and power computation while allowing the neurologist to design experimental protocols
where the patient can perform motor tasks relevant for the clinical evaluations (i.e. walking).
This approach, despite being limited to perioperative experimental sessions, can therefore promote
the understanding of PD pathophysiological mechanisms and can be extended to other neurological
disorders (e.g. Gilles de la Tourette syndrome [Priori et al., 2013]) treated with DBS.
6.2 Experimental and clinical considerations
The results of our proof of concept study comparing aDBS and cDBS showed that in the presence
of levodopa stimulation, aDBS induces similar global motor improvement with less dyskinesias
than cDBS. Additionally, aDBS was safely delivered and consumed less power than cDBS.
In our single case study (Rosa et al., 2015), we tested the portable prototype used in this study and
reported that aDBS was safe and well tolerated and that it induced better control of dyskinesias than
cDBS.
For all our parkinsonian patients, the aDBS algorithm was able to “follow” the patient’s beta
modulations, which we assume were related to clinical motor fluctuations. The beta reduction
induced by levodopa decreased the stimulation voltage, resulting in aDBS amplitude lower than
during cDBS. Our findings demonstrated several advantages in reducing stimulation through an
aDBS approach. First, we obtained a 73.6% decrease of the energy delivered to the patient. Second,
aDBS was more effective in reducing dyskinesias than cDBS. Our results support the idea that
64
aDBS could help clinicians limit the severity of side effects induced by the transient sum of DBS
stimulation and pharmacological therapy. Moreover, although a reduction of the levodopa dose is
observed for up to 10 years after DBS, antiparkinsonian treatment generally increases over time in
patients who receive DBS (Rodriguez Oroz et al., 2012). Consequently, DBS-induced control of
motor fluctuations tends to worsen after a number of years of DBS (Shupback et al., 2005; Zibetti et
al., 2011). However, considering that in our experimental setup levodopa-induced dyskinesias were
elicited by a supraliminal dose, it is difficult to draw a definite conclusion to direct improvement of
dyskinesias.
The improvements in the UPDRS III score elicited by aDBS were similar to those seen with cDBS,
both when DBS was delivered alone and when concurrent levodopa treatment was administered.
The aDBS and cDBS-induced improvements in UPDRS III scores were lower than those reported
by other researchers in follow-up DBS studies (Deushl et al., 2006). As we choose a low maximum
stimulation value (20% over the threshold for eliciting the 60% improvement in rigidity), this
discrepancy can be partially explained. Aside from clinical aspects, altered by a “stunning” effect
associated with the surgery, which can elicit a pseudo-subthalamotomic effect (Mann et al., 2009)
that improves the motor symptoms, the aDBS proved to work properly across patients. The beta
band power and then the stimulation voltage decreased significantly under the effect of
dopaminergic medication, which acted as a driver of clinical and neurophysiological change. Based
on a linear association of stimulation parameters to an observed range of variation of beta power
values, we avoided a concurrent electrical and pharmacological treatment.
Because the adaptive rule that we used drew on the hypothesis that beta-clinical state correlation
across patients is also valid intra-patient, we extended the period of observation to about eight
hours. In this prolonged study, a direct comparison with cDBS was not possible because of the
scheduling of the surgeries did not allow us to have three entire days for testing. Each experimental
day took about 10 hours from initial settings to final clinical evaluation. We therefore focused on
confirming the correlation of beta oscillations, stimulation amplitude, and clinical state. We found
that the statistical correlation was preserved, and, in OFF state, the patients experienced a
significant improvement of the clinical state compare to the baseline condition, while the ON state
was free of side effects such as dyskinesias.
The parametrization methods proposed in Chapter 3 may lead, however, to overstimulation or
understimulation when not correctly matching the (linear) correlation between the power of beta
and the clinical state. Future research will need to overcome this issue and optimize the adaptive
rule by means of long-term monitoring sessions.
65
The availability of concurrent physiological (beta power) and clinical (UPDRS III) data over a long
period (one week) is feasible only in chronic conditions with implantable devices with sensing
possibilities. A wearable device such as bracelet with accelerometer and gyroscope (Malcom et al.,
2015) proved to be able to infer the UPDRS III scores without the need of neurophysiologist. If the
correlation between beta power and clinical state is confirmed also intra-patient, the validity of beta
oscillations can definitely be considered a valuable biomarker of the parkinsonian state, although its
causal role remains unproven.
6.3 The role of beta oscillations and deep brain stimulation
mechanisms
How deep brain stimulation (DBS) acts on the neurophysiological mechanisms of PD is still under
investigation and widely debated. Here, we focused on physiological mechanisms, even if
neurochemical effects are thought to play an important role in exacerbating DBS therapeutic effects
(McIntyre et al., 2015).
Recording and stimulating different points of the cortico-basal ganglia network has unveiled new
evidence about the role of beta oscillations and the DBS interaction with neural rhythms.
Beta oscillations are recurrent over the motor networks, and in PD patient was found in the STN
(Brown et al., 2001; Kuhn et al., 2004; Priori et al., 2002; 2004 William et al., 2002), in the GPi
(Brown et al., 2001; Priori et al., 2002; Cassidy et al., 2002) and in the cortex (Whitmer et al., 2012;
de Hemptinne et al., 2013). Because it was consistently reported that beta oscillations can be
modulated by levodopa medication (Brown et al., 2001; Cassidy et al., 2002; Priori et al., 2004; Kühn
et al., 2006, 2009; Weinberger et al., 2006; Hammond et al., 2007; Ray et al., 2008; Alonso-French
et al., 2006), and by voluntary and involuntary movements (Cassidy et al., 2002; Priori et al., 2002;
Kühn et al., 2004; Doyle et al., 2005; Joundi et al., 2012; Oswal et al., 2013; Foffani et al., 2005;
Silberstein et al., 2005; Bronte-Stewart et al., 2009) it is considered a fingerprint of PD, directly
involved in the physiological mechanisms of motor impairments. Different hypotheses have been
formulated to interpret the role of beta oscillations in the cortico-basal ganglia network. The leading
hypothesis is that neurons in the STN are excessively synchronized on the beta rhythm, thus
preventing a physiological processing of the information (Brown & Williams, 2005).
As abovementioned, it is a common knowledge that beta oscillations are present in the cortex and
deep regions. However, the heterogeneity of the analysis methods to detect beta oscillations creates
difficulty in comparing results between different groups. The problem is here faced by means of
processing techniques, working on the statistical and temporal structure of the data. The question is
66
reduced to the problem of separating the peak oscillation from the background neural noise. The
methods proposed until now are two: fitting the background noise with an opportune noise model
(pink or red noise) or considering the oscillations overcoming a certain threshold (Rosa et al., 2011,
and the one we used for the first study). The first case is limited by the a priori choice of the exponent
of the power law (−1 for the pink noise, and −2 for the red noise); the background noise may follow
a different profile, thus biasing the results. Even if the exponent is calculated by regression methods,
the presence of very low-frequency oscillations, different from the background neural noise,
introduce some errors in the results. The second method, calculating the mean and the SD of the
power in a predefined band (12–35 Hz, in our study) and fixing a threshold at the mean + 1.97SD.
This method is, however, biased by the beta oscillation itself, which contributes to the value of the
threshold. To overcome these limitations, we used a coarse-grained analysis method to separate the
oscillatory component of the signal from the “scale-free background noise activity.” Compared with
He et al. (2010), we analyzed data for a shorter duration and acquired it with a narrower analog pass-
band. In the future, more structural analysis on longer recordings may help in providing a standardized
method for LFP analysis and for clarifying the role of different frequencies. For instance, we found
that in a single patient having two peaks in the alpha/beta band, only the lower peak at the lower
frequency was recognized as an oscillatory activity, and it was modulated by levodopa medication.
Findings like this may definitely shift the frequencies of interest from the beta band as 12–35 Hz to
the alpha/low beta band, at 8–20 Hz. A recent study, for instance, reported that across patients, the
band most strongly correlated with motor improvement is between 10–14 Hz (Neumann et al., 2016).
Recent evidence highlights the idea that beta oscillations may not be causally linked to cortico-basal
ganglia network abnormalities, but rather that these are epiphenomena. Local field potential recording
in the STNs of epileptic patients (Vyes et al., 2015) and dystonic patients (Wang et al., 2016) showed
statistically similar spectral profiles, with no difference in beta amplitude, and even in STN PAC
movement mechanisms (Wang et al., 2016). Moreover, similar to previous work on tremor
oscillations (4–8 Hz) that confirmed a bidirectional relationship between peripheral (sEMG) and local
(STN) oscillations (Tass et al., 2012), a recent study proposed cortico-muscular coherence (CMC) as
a biomarker of PD.. The exact role of beta oscillations remains an open question, as well as that of
DBS mechanisms.
Several studies, albeit controversial, shown that high-frequency STN-DBS can suppress beta
oscillation in the target area (Wingeiger et al., 2006; Eusebio et al., 2011; Giannicola et al., 2011;
Whitmer et al., 2012). Wingeiger and et al. (2006) observed a decrease in the beta power after
stimulation with a more evident desynchronization in the signals recorded in the dorsal area of STN.
67
Conversely, Whitmer et al. (2012) showed that the central part of the STN was more sensitive to a
gradient of stimulation than the dorsal. In other studies, however, it was not possible to observe DBS-
induced modulations in all patients (Giannicola et al., 2011) or even none (Rossi et al., 2008).
Recent evidence has shown that stimulation at 60 Hz instead of conventional 130 Hz contributes to
the improvement of bradykinesias while promoting low-frequency activity (Blumenfeld et al., 2015).
These results imply that a frequency other than the amplitude has a role in the network modulation
(Fasano & Lozano, 2014).
Recent evidence has also shown that DBS can reduce the PAC between the phase of beta oscillations
and amplitude of broadband gamma oscillations (50–200 Hz) recorded from the primary motor cortex
(M1) of PD patients (de Hemptinee et al., 2015), with concurrent improvement of the clinical state.
This study also suggests that PAC suppression is independent of concurrent beta suppression at the
cortical level. Moreover, previous studies have demonstrated that the PAC between high-frequency
oscillations (HFO, >200 Hz) revealed in STN recordings is reduced under dopaminergic treatment
(Azcarate et al., 2010; Ozkurt et al., 2011). It has also been hypothesized that high-frequency activity,
involved in movements preparation and execution mechanisms (Foffani et al., 2003), is unable to
undergo to physiological amplitude modulations if excessively coupled with beta oscillations.
The relevance of the electrode position, the stimulation frequency, and the involvement of gamma
and HFOs suggests that desynchronization of beta activity may not completely explain DBS
mechanisms, and, ultimately, demands deeper understanding of PD pathophysiology.
Aside from advancements in basic research, empirical approaches may promote the acceleration of
aDBS clinical research, following different pathways (see Fig. 6.2).
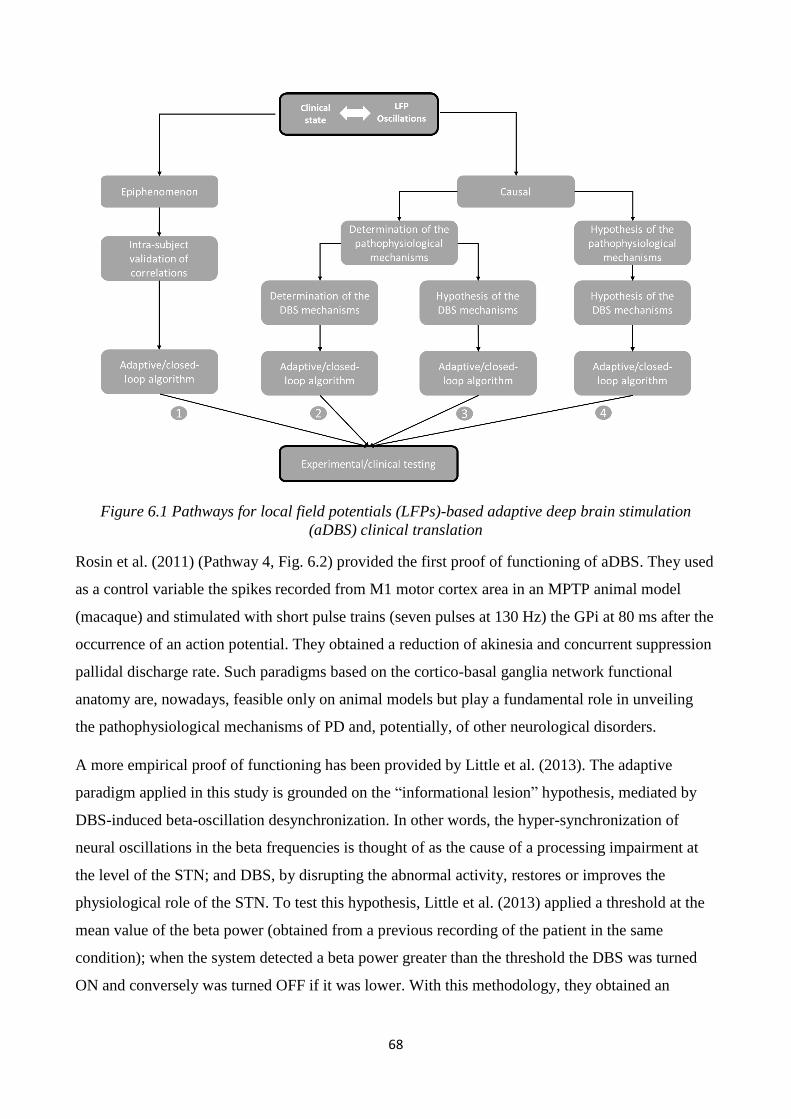
68
Figure 6.1 Pathways for local field potentials (LFPs)-based adaptive deep brain stimulation
(aDBS) clinical translation
Rosin et al. (2011) (Pathway 4, Fig. 6.2) provided the first proof of functioning of aDBS. They used
as a control variable the spikes recorded from M1 motor cortex area in an MPTP animal model
(macaque) and stimulated with short pulse trains (seven pulses at 130 Hz) the GPi at 80 ms after the
occurrence of an action potential. They obtained a reduction of akinesia and concurrent suppression
pallidal discharge rate. Such paradigms based on the cortico-basal ganglia network functional
anatomy are, nowadays, feasible only on animal models but play a fundamental role in unveiling
the pathophysiological mechanisms of PD and, potentially, of other neurological disorders.
A more empirical proof of functioning has been provided by Little et al. (2013). The adaptive
paradigm applied in this study is grounded on the “informational lesion” hypothesis, mediated by
DBS-induced beta-oscillation desynchronization. In other words, the hyper-synchronization of
neural oscillations in the beta frequencies is thought of as the cause of a processing impairment at
the level of the STN; and DBS, by disrupting the abnormal activity, restores or improves the
physiological role of the STN. To test this hypothesis, Little et al. (2013) applied a threshold at the
mean value of the beta power (obtained from a previous recording of the patient in the same
condition); when the system detected a beta power greater than the threshold the DBS was turned
ON and conversely was turned OFF if it was lower. With this methodology, they obtained an
69
improvement of the patient motor state greater than cDBS in a stimulation session of a few minutes.
This result needs, therefore, to be confirmed in a longer study with a more detailed analysis of the
physiological significance of the choice of the threshold and the technical feasibility (Pathway 4,
Fig. 6.2).
To help physicians in demystifying the role of beta oscillations, different computational models
have been proposed to explain pathophysiological and DBS mechanisms (Holt et al., 2017). These
models can suggest closed-loop paradigms and provide a workbench for back-testing. Tass et al.
(2003), by modeling a neural population as a network of phase oscillators, theoretical supposed that
a coordinated-reset DBS should have a weakening effect on local synaptic strength, thus promoting
a structural reorganization of the neural ensemble and, ultimately, a desynchronization effect on
abnormal oscillations. Intriguingly a recent application of such paradigm to PD patients seems to
confirm their assumptions (Adamchic et al., 2014).
Despite, the early focus on beta oscillations amplitude, modeling (Park et al. 2012) and empirical
studies (Moll et al., 2017) point toward the relevance of the phase. The computational model of
Park et al. (2012), moving from the assumption of an exaggerated coupling between GPe and STN
as cause of beta oscillations abnormalities, shown that the GPe output is sensitive to the STN input
phase and that dopaminergic medication exacerbates its effect by changing STN the firing pattern of
the STN. This result in part support the observations of Rosin et al. (2011), who shown that firing
pattern more than firing rate have a key role in PD pathophysiology. If the amplitude of beta
oscillations provides an information about the level of synchrony and thus the intensity required for
stimulation, the phase may provide the information about the timing. Beside the empirical
approaches, the computational modeling will promote the development of new paradigms with the
final goal of mimicking the network mechanisms and having a closed-loop system which, rather
than answers to the network, dynamically interacts with it.
In this project we assumed the worst case scenario, in which it represents only an epiphenomenon of
the parkinsonian state (Pathway 1, Fig. 6.2). Under this hypothesis, we therefore focused on
investigating the validity of beta power as a valuable biomarker of the patients’ clinical state. In fact,
the absence of convincing evidence about the causal link between beta oscillations and motor
symptoms does not imply that beta power cannot be used as a control variable, as long as its
correlation is confirmed between subjects.
By means of an external portable aDBS device we opened the possibility to study aDBS strategies
during perioperative sessions in freely moving PD patients. In particular, following this framework

70
we suggested that the aDBS methodology may help clinicians in the management of motor
fluctuations while avoiding side effects such as dyskinesias.
The same approach can be extended to more sophisticated algorithms and all patients who undergoes
to DBS electrode implant, thus providing a unique framework, which ultimately prompts the research
in this sector. Moreover, our technical, neurophysiological and clinical results encourage the pursuit
of the research in chronic conditions, which would definitely allow for long-term neurophysiological
and clinical monitoring and a better investigation of DBS mechanisms.
71
References
Adamchic, I. et al. "Coordinated Reset Neuromodulation For Parkinson's Disease: Proof-Of-
Concept Study". Movement Disorders 29.13 (2014): 1679-1684.
Albin, Roger L., Anne B. Young, and John B. Penney. "The Functional Anatomy Of Basal Ganglia
Disorders". Trends in Neurosciences 12.10 (1989): 366-375.
Alonso-Frech, F. et al. "Slow Oscillatory Activity And Levodopa-Induced Dyskinesias In
Parkinson's Disease". Brain 129.7 (2006): 1748-1757.
Avestruz, AI.T. et al., "A 5 \mu W/Channel Spectral Analysis IC for Chronic Bidirectional Brain–
Machine Interfaces," IEEE Journal of Solid-State Circuits. 43 (2008): 3006-3024
Balducci,M. A. "Benchmarking of FFT algorithms," Engineering New Century., Proceedings.
IEEE, (1997):328-330.
Babadi, Behtash, and Emery N. Brown. "A Review Of Multitaper Spectral Analysis". IEEE
Transactions on Biomedical Engineering 61.5 (2014): 1555-1564.
Barbe, M. T. et al. "Individualized Current-Shaping Reduces DBS-Induced Dysarthria In Patients
With Essential Tremor". Neurology 82.7 (2014): 614-619.
Basu, I. et al. "Pathological Tremor Prediction Using Surface Electromyogram And Acceleration:
Potential Use In ‘ON–OFF’ Demand Driven Deep Brain Stimulator Design". Journal of Neural
Engineering 10.3 (2013): 036019.
Basu, I. et al. “Adaptive control of deep brain stimulator for essential tremor: entropy-based tremor
prediction using surface-EMG”. Conf Proc IEEE Eng Med Biol Soc. (2011):7711-4.
Benabid, A.L. et al. "Acute And Long-Term Effects Of Subthalamic Nucleus Stimulation In
Parkinson's Disease". Stereotactic and Functional Neurosurgery 62.1-4 (1995): 76-84.
Benabid, A.L. et al. "Deep Brain Stimulation Of The Subthalamic Nucleus For The Treatment Of
Parkinson's Disease". The Lancet Neurology 8.1 (2009): 67-81.
Benazzouz, A et al. "Effect Of High-Frequency Stimulation Of The Subthalamic Nucleus On The
Neuronal Activities Of The Substantia Nigra Pars Reticulata And Ventrolateral Nucleus Of
The Thalamus In The Rat". Neuroscience 99.2 (2000): 289-295.
Berardelli, A. "Pathophysiology Of Bradykinesia In Parkinson's Disease". Brain 124.11 (2001):
2131-2146.
Bergman, H, T Wichmann, and M. DeLong. "Reversal Of Experimental Parkinsonism By Lesions
Of The Subthalamic Nucleus". Science 249.4975 (1990): 1436-1438.
Bergquist, Filip, and Malcolm Horne. "Can Objective Measurements Improve Treatment Outcomes
In Parkinson’S Disease?". European Neurological Review 9.1 (2014): 27.
Blumenfeld, Z. et al. "Sixty Hertz Neurostimulation Amplifies Subthalamic Neural Synchrony In
Parkinson’S Disease". PLOS ONE 10.3 (2015): e0121067. 19 Mar. 2017.
Bronstein, J.M. et al. "Deep Brain Stimulation For Parkinson Disease". Archives of Neurology 68.2
(2011):
72
Bronte-Stewart, H. et al. "The STN Beta-Band Profile In Parkinson's Disease Is Stationary And
Shows Prolonged Attenuation After Deep Brain Stimulation". Experimental Neurology 215.1
(2009): 20-28.
Brown, P. et al. “Dopamine dependency of oscillations between subthalamic nucleus and pallidum
in Parkinson’s disease”. Journal of Neuroscience, 21.3 (2011), 1033–1038
Brown, P, and D Williams. "Basal Ganglia Local Field Potential Activity: Character And
Functional Significance In The Human". Clinical Neurophysiology 116.11 (2005): 2510-2519.
Burgess, Jonathan G. et al. "Identifying Tremor-Related Characteristics Of Basal Ganglia Nuclei
During Movement In The Parkinsonian Patient". Parkinsonism & Related Disorders 16.10
(2010): 671-675.
Cassidy, M. "Movement-Related Changes In Synchronization In The Human Basal
Ganglia". Brain 125.6 (2002): 1235-1246.
Castrioto, Anna. "Ten-Year Outcome Of Subthalamic Stimulation In Parkinson Disease". Archives
of Neurology 68.12 (2011): 1550.
Chang, Su-Youne et al. "Development Of The Mayo Investigational Neuromodulation Control
System: Toward A Closed-Loop Electrochemical Feedback System For Deep Brain
Stimulation". Journal of Neurosurgery 119.6 (2013): 1556-1565.
Chiken, Satomi, and Atsushi Nambu. "Mechanism Of Deep Brain Stimulation". The
Neuroscientist 22.3 (2016): 313-322.
Clancy, E.A, E.L Morin, and R Merletti. "Sampling, Noise-Reduction And Amplitude Estimation
Issues In Surface Electromyography". Journal of Electromyography and Kinesiology 12.1
(2002): 1-16.
Connolly, A. T. et al. "Modulations In Oscillatory Frequency And Coupling In Globus Pallidus
With Increasing Parkinsonian Severity". Journal of Neuroscience 35.15 (2015): 6231-6240.
Cooley, James W., and John W. Tukey. "An Algorithm For The Machine Calculation Of Complex
Fourier Series". Mathematics of Computation 19.90 (1965): 297.
DeLong, Mahlon R. "Primate Models Of Movement Disorders Of Basal Ganglia Origin". Trends in
Neurosciences 13.7 (1990): 281-285.
Denison T. etal. “A 2 μW 100 nV/rtHz chopper-stabilized instrumentation amplifier for chronic
measurement of neural field potentials”. IEEE Journal of Solid State Circuits. 42.12
(2007):2934–2945.
Deuschl, Günther et al. "A Randomized Trial Of Deep-Brain Stimulation For Parkinson's
Disease". New England Journal of Medicine 355.9 (2006): 896-908.
Dorsey, E. R. et al. "Projected Number Of People With Parkinson Disease In The Most Populous
Nations, 2005 Through 2030". Neurology 68.5 (2006): 384-386.
Dostrovsky J.O. et al. “Microstimulation-induced inhibition of neuronal firing in human globus
pallidus”. Journal of Neurophysiology. 2000;84(1):570-574PubMed
73
Doyle, L. M. F. et al. "Levodopa-Induced Modulation Of Subthalamic Beta Oscillations During
Self-Paced Movements In Patients With Parkinson's Disease". European Journal of
Neuroscience 21.5 (2005): 1403-1412.
Eusebio, A. et al. "Deep Brain Stimulation Can Suppress Pathological Synchronisation In
Parkinsonian Patients". Journal of Neurology, Neurosurgery & Psychiatry 82.5 (2010): 569-
573.
Fasano, Alfonso, and Andres M. Lozano. "The FM/AM World Is Shaping The Future Of Deep
Brain Stimulation". Movement Disorders 29.2 (2014): 161-163.
Florin, E. et al. "Does Increased Gamma Activity In Patients Suffering From Parkinson’S Disease
Counteract The Movement Inhibiting Beta Activity?". Neuroscience 237 (2013): 42-50.
Foffani, G. et al. "Subthalamic Oscillatory Activities At Beta Or Higher Frequency Do Not Change
After High-Frequency DBS In Parkinson's Disease". Brain Research Bulletin 69.2 (2006): 123-
130.
Foffani, G. "Altered Subthalamo-Pallidal Synchronisation In Parkinsonian Dyskinesias". Journal of
Neurology, Neurosurgery & Psychiatry 76.3 (2005): 426-428.
Foffani, G. "300-Hz Subthalamic Oscillations In Parkinson's Disease". Brain 126.10 (2003): 2153-
2163.
Foffani, G. et al. "Movement-Related Frequency Modulation Of Beta Oscillatory Activity In The
Human Subthalamic Nucleus". The Journal of Physiology 568.2 (2005): 699-711.
Frankemolle, A. M. M. et al. "Reversing Cognitive-Motor Impairments In Parkinson's Disease
Patients Using A Computational Modelling Approach To Deep Brain Stimulation
Programming". Brain 133.3 (2010): 746-761.
Giannicola, Gaia et al. "The Effects Of Levodopa And Ongoing Deep Brain Stimulation On
Subthalamic Beta Oscillations In Parkinson's Disease". Experimental Neurology 226.1 (2010):
120-127.
Grahn, Peter J. et al. "A Neurochemical Closed-Loop Controller For Deep Brain Stimulation:
Toward Individualized Smart Neuromodulation Therapies". Frontiers in Neuroscience 8
(2014): n. pag.
Graupe, Daniel et al. "Letters To The Editor. Closed-Loop Electrochemical Feedback System For
DBS". Journal of Neurosurgery 121.3 (2014): 762-763.
Hashimoto T, Elder CM, Okun MS, Patrick SK, Vitek JL. “Stimulation of the subthalamic nucleus
changes the firing pattern of pallidal neurons”. Journal of Neuroscience 23.5(2003):1916-
1923PubMed
Hauptmann, C et al. "External Trial Deep Brain Stimulation Device For The Application Of
Desynchronizing Stimulation Techniques". Journal of Neural Engineering 6.6 (2009): 066003.
de Hemptinne, C. et al. "Exaggerated Phase-Amplitude Coupling In The Primary Motor Cortex In
Parkinson Disease". Proceedings of the National Academy of Sciences 110.12 (2013): 4780-
4785.
de Hemptinne, C. et al. "Therapeutic Deep Brain Stimulation Reduces Cortical Phase-Amplitude
Coupling In Parkinson's Disease". Nature Neuroscience 18.5 (2015): 779-786.
74
Hamani, Clement et al. "Bilateral Subthalamic Nucleus Stimulation For Parkinson's Disease: A
Systematic Review Of The Clinical Literature". Neurosurgery 56.6 (2005): 1313-1324.
Hammond, Constance, Hagai Bergman, and Peter Brown. "Pathological Synchronization In
Parkinson's Disease: Networks, Models And Treatments". Trends in Neurosciences 30.7
(2007): 357-364.
Hashimoto, Takao, Christopher M Elder, and Jerrold L Vitek. "A Template Subtraction Method For
Stimulus Artifact Removal In High-Frequency Deep Brain Stimulation". Journal of
Neuroscience Methods 113.2 (2002): 181-186.
Herrington, Todd M., Jennifer J. Cheng, and Emad N. Eskandar. "Mechanisms Of Deep Brain
Stimulation". Journal of Neurophysiology 115.1 (2015): 19-38.
He, Biyu J. et al. "The Temporal Structures And Functional Significance Of Scale-Free Brain
Activity". Neuron 66.3 (2010): 353-369.
He, Biyu J. "Scale-Free Brain Activity: Past, Present, And Future". Trends in Cognitive Sciences
18.9 (2014): 480-487.
Holt, Abbey B., and Theoden I. Netoff. "Computational Modeling To Advance Deep Brain
Stimulation For The Treatment Of Parkinson’S Disease". Drug Discovery Today: Disease
Models (2017).
Horne, Malcolm K., Sarah McGregor, and Filip Bergquist. "An Objective Fluctuation Score For
Parkinson's Disease". PLOS ONE 10.4 (2015): e0124522.
Joundi, Raed A. et al. "Oscillatory Activity In The Subthalamic Nucleus During Arm Reaching In
Parkinson's Disease". Experimental Neurology 236.2 (2012): 319-326.
Koss, Adam M. et al. "Calculating Total Electrical Energy Delivered By Deep Brain Stimulation
Systems". Annals of Neurology 58.1 (2005): 168-168.
Kuhn, A. A. "Event-Related Beta Desynchronization In Human Subthalamic Nucleus Correlates
With Motor Performance". Brain 127.4 (2004): 735-746.
Kühn, Andrea A. et al. "Pathological Synchronisation In The Subthalamic Nucleus Of Patients With
Parkinson's Disease Relates To Both Bradykinesia And Rigidity". Experimental
Neurology 215.2 (2009): 380-387.
Kühn, Andrea A. et al. "Reduction In Subthalamic 8-35 Hz Oscillatory Activity Correlates With
Clinical Improvement In Parkinson's Disease". European Journal of Neuroscience 23.7 (2006):
1956-1960.
Kühn, Andrea A. et al. "Reduction In Subthalamic 8-35 Hz Oscillatory Activity Correlates With
Clinical Improvement In Parkinson's Disease". European Journal of Neuroscience 23.7 (2006):
1956-1960.
Kwong, Joyce, and Anantha P. Chandrakasan. "An Energy-Efficient Biomedical Signal Processing
Platform". IEEE Journal of Solid-State Circuits 46.7 (2011): 1742-1753. 2
Lang, Anthony E., and Andres M. Lozano. "Parkinson's Disease". New England Journal of
Medicine 339.15 (1998): 1044-1053.
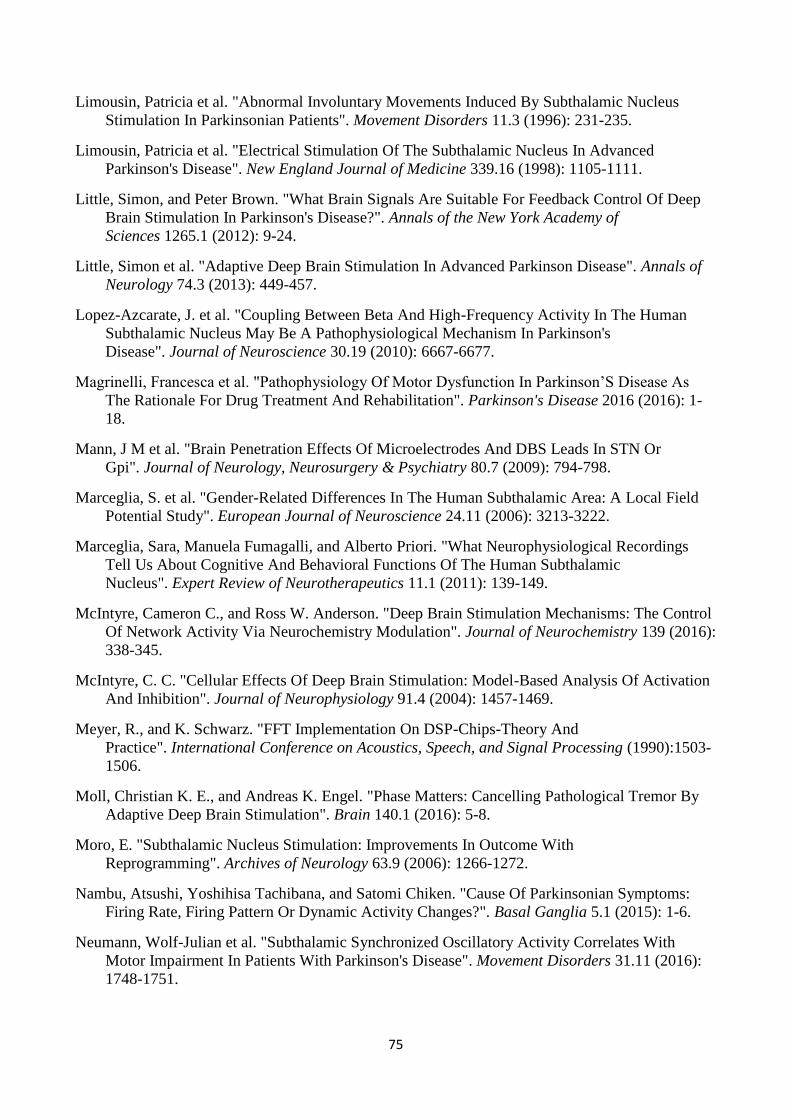
75
Limousin, Patricia et al. "Abnormal Involuntary Movements Induced By Subthalamic Nucleus
Stimulation In Parkinsonian Patients". Movement Disorders 11.3 (1996): 231-235.
Limousin, Patricia et al. "Electrical Stimulation Of The Subthalamic Nucleus In Advanced
Parkinson's Disease". New England Journal of Medicine 339.16 (1998): 1105-1111.
Little, Simon, and Peter Brown. "What Brain Signals Are Suitable For Feedback Control Of Deep
Brain Stimulation In Parkinson's Disease?". Annals of the New York Academy of
Sciences 1265.1 (2012): 9-24.
Little, Simon et al. "Adaptive Deep Brain Stimulation In Advanced Parkinson Disease". Annals of
Neurology 74.3 (2013): 449-457.
Lopez-Azcarate, J. et al. "Coupling Between Beta And High-Frequency Activity In The Human
Subthalamic Nucleus May Be A Pathophysiological Mechanism In Parkinson's
Disease". Journal of Neuroscience 30.19 (2010): 6667-6677.
Magrinelli, Francesca et al. "Pathophysiology Of Motor Dysfunction In Parkinson’S Disease As
The Rationale For Drug Treatment And Rehabilitation". Parkinson's Disease 2016 (2016): 1-
18.
Mann, J M et al. "Brain Penetration Effects Of Microelectrodes And DBS Leads In STN Or
Gpi". Journal of Neurology, Neurosurgery & Psychiatry 80.7 (2009): 794-798.
Marceglia, S. et al. "Gender-Related Differences In The Human Subthalamic Area: A Local Field
Potential Study". European Journal of Neuroscience 24.11 (2006): 3213-3222.
Marceglia, Sara, Manuela Fumagalli, and Alberto Priori. "What Neurophysiological Recordings
Tell Us About Cognitive And Behavioral Functions Of The Human Subthalamic
Nucleus". Expert Review of Neurotherapeutics 11.1 (2011): 139-149.
McIntyre, Cameron C., and Ross W. Anderson. "Deep Brain Stimulation Mechanisms: The Control
Of Network Activity Via Neurochemistry Modulation". Journal of Neurochemistry 139 (2016):
338-345.
McIntyre, C. C. "Cellular Effects Of Deep Brain Stimulation: Model-Based Analysis Of Activation
And Inhibition". Journal of Neurophysiology 91.4 (2004): 1457-1469.
Meyer, R., and K. Schwarz. "FFT Implementation On DSP-Chips-Theory And
Practice". International Conference on Acoustics, Speech, and Signal Processing (1990):1503-
1506.
Moll, Christian K. E., and Andreas K. Engel. "Phase Matters: Cancelling Pathological Tremor By
Adaptive Deep Brain Stimulation". Brain 140.1 (2016): 5-8.
Moro, E. "Subthalamic Nucleus Stimulation: Improvements In Outcome With
Reprogramming". Archives of Neurology 63.9 (2006): 1266-1272.
Nambu, Atsushi, Yoshihisa Tachibana, and Satomi Chiken. "Cause Of Parkinsonian Symptoms:
Firing Rate, Firing Pattern Or Dynamic Activity Changes?". Basal Ganglia 5.1 (2015): 1-6.
Neumann, Wolf-Julian et al. "Subthalamic Synchronized Oscillatory Activity Correlates With
Motor Impairment In Patients With Parkinson's Disease". Movement Disorders 31.11 (2016):
1748-1751.
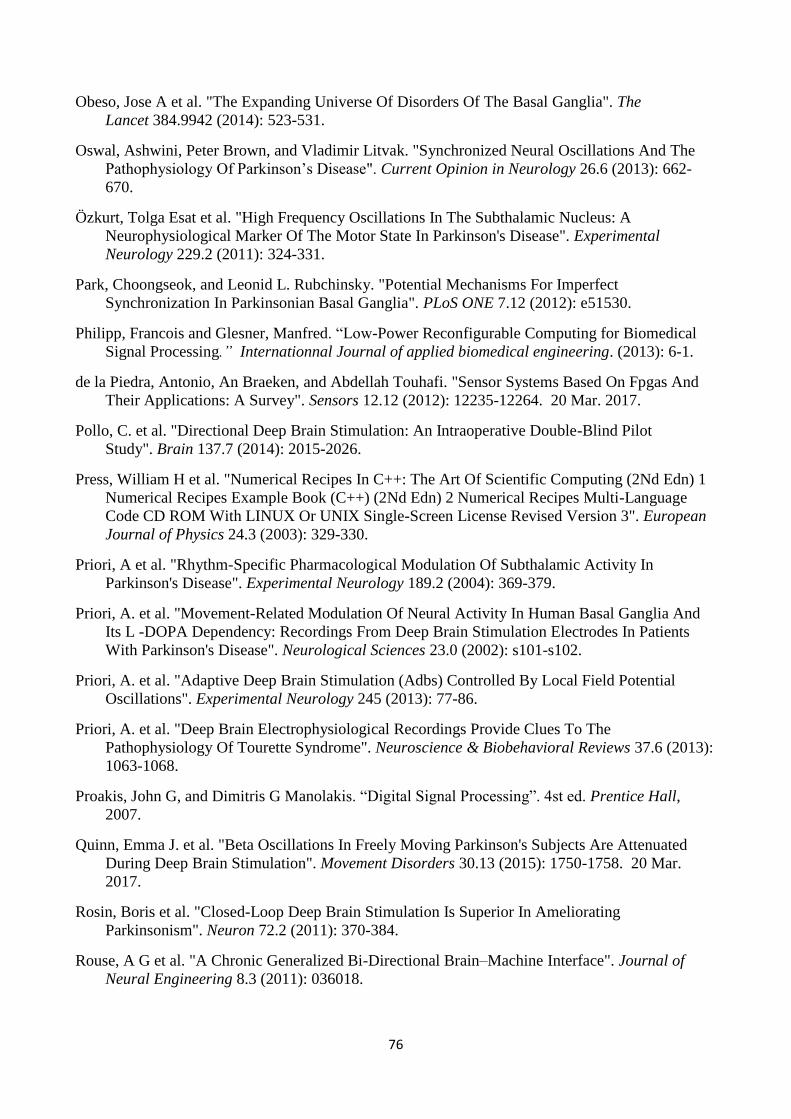
76
Obeso, Jose A et al. "The Expanding Universe Of Disorders Of The Basal Ganglia". The
Lancet 384.9942 (2014): 523-531.
Oswal, Ashwini, Peter Brown, and Vladimir Litvak. "Synchronized Neural Oscillations And The
Pathophysiology Of Parkinsonʼs Disease". Current Opinion in Neurology 26.6 (2013): 662-
670.
Özkurt, Tolga Esat et al. "High Frequency Oscillations In The Subthalamic Nucleus: A
Neurophysiological Marker Of The Motor State In Parkinson's Disease". Experimental
Neurology 229.2 (2011): 324-331.
Park, Choongseok, and Leonid L. Rubchinsky. "Potential Mechanisms For Imperfect
Synchronization In Parkinsonian Basal Ganglia". PLoS ONE 7.12 (2012): e51530.
Philipp, Francois and Glesner, Manfred. “Low-Power Reconfigurable Computing for Biomedical
Signal Processing.” Internationnal Journal of applied biomedical engineering. (2013): 6-1.
de la Piedra, Antonio, An Braeken, and Abdellah Touhafi. "Sensor Systems Based On Fpgas And
Their Applications: A Survey". Sensors 12.12 (2012): 12235-12264. 20 Mar. 2017.
Pollo, C. et al. "Directional Deep Brain Stimulation: An Intraoperative Double-Blind Pilot
Study". Brain 137.7 (2014): 2015-2026.
Press, William H et al. "Numerical Recipes In C++: The Art Of Scientific Computing (2Nd Edn) 1
Numerical Recipes Example Book (C++) (2Nd Edn) 2 Numerical Recipes Multi-Language
Code CD ROM With LINUX Or UNIX Single-Screen License Revised Version 3". European
Journal of Physics 24.3 (2003): 329-330.
Priori, A et al. "Rhythm-Specific Pharmacological Modulation Of Subthalamic Activity In
Parkinson's Disease". Experimental Neurology 189.2 (2004): 369-379.
Priori, A. et al. "Movement-Related Modulation Of Neural Activity In Human Basal Ganglia And
Its L -DOPA Dependency: Recordings From Deep Brain Stimulation Electrodes In Patients
With Parkinson's Disease". Neurological Sciences 23.0 (2002): s101-s102.
Priori, A. et al. "Adaptive Deep Brain Stimulation (Adbs) Controlled By Local Field Potential
Oscillations". Experimental Neurology 245 (2013): 77-86.
Priori, A. et al. "Deep Brain Electrophysiological Recordings Provide Clues To The
Pathophysiology Of Tourette Syndrome". Neuroscience & Biobehavioral Reviews 37.6 (2013):
1063-1068.
Proakis, John G, and Dimitris G Manolakis. “Digital Signal Processing”. 4st ed. Prentice Hall,
2007.
Quinn, Emma J. et al. "Beta Oscillations In Freely Moving Parkinson's Subjects Are Attenuated
During Deep Brain Stimulation". Movement Disorders 30.13 (2015): 1750-1758. 20 Mar.
2017.
Rosin, Boris et al. "Closed-Loop Deep Brain Stimulation Is Superior In Ameliorating
Parkinsonism". Neuron 72.2 (2011): 370-384.
Rouse, A G et al. "A Chronic Generalized Bi-Directional Brain–Machine Interface". Journal of
Neural Engineering 8.3 (2011): 036018.
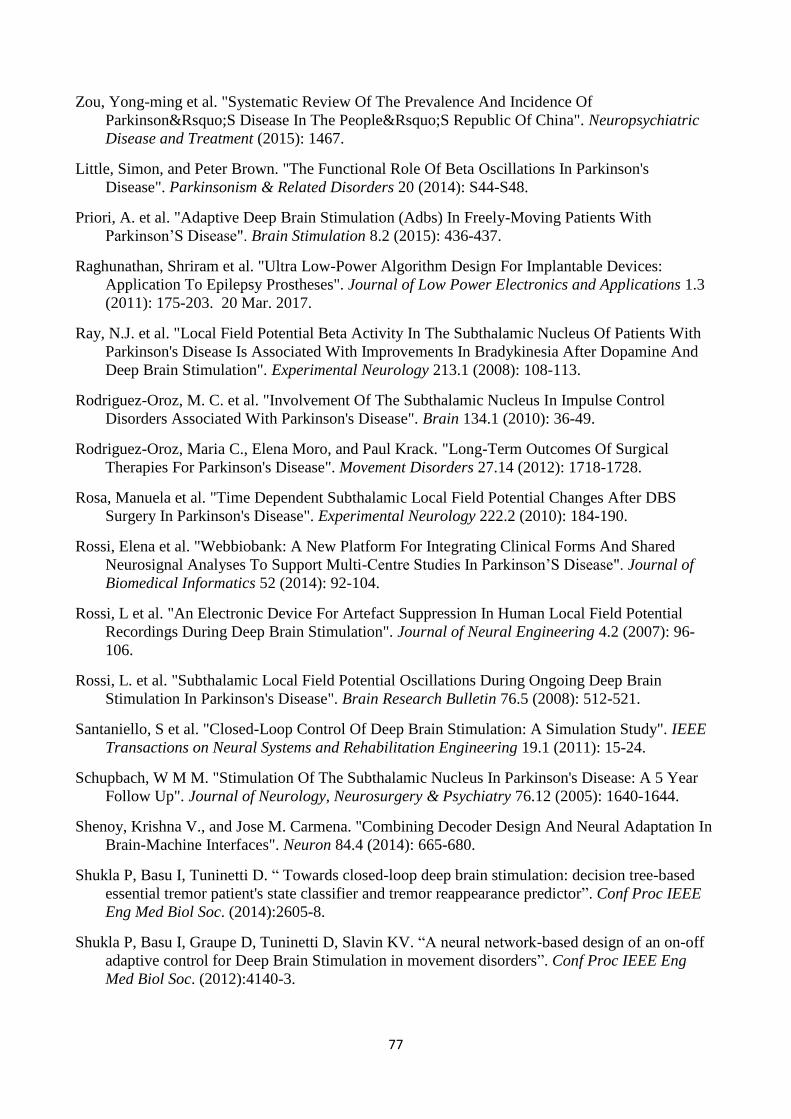
77
Zou, Yong-ming et al. "Systematic Review Of The Prevalence And Incidence Of
Parkinson&Rsquo;S Disease In The People&Rsquo;S Republic Of China". Neuropsychiatric
Disease and Treatment (2015): 1467.
Little, Simon, and Peter Brown. "The Functional Role Of Beta Oscillations In Parkinson's
Disease". Parkinsonism & Related Disorders 20 (2014): S44-S48.
Priori, A. et al. "Adaptive Deep Brain Stimulation (Adbs) In Freely-Moving Patients With
Parkinson’S Disease". Brain Stimulation 8.2 (2015): 436-437.
Raghunathan, Shriram et al. "Ultra Low-Power Algorithm Design For Implantable Devices:
Application To Epilepsy Prostheses". Journal of Low Power Electronics and Applications 1.3
(2011): 175-203. 20 Mar. 2017.
Ray, N.J. et al. "Local Field Potential Beta Activity In The Subthalamic Nucleus Of Patients With
Parkinson's Disease Is Associated With Improvements In Bradykinesia After Dopamine And
Deep Brain Stimulation". Experimental Neurology 213.1 (2008): 108-113.
Rodriguez-Oroz, M. C. et al. "Involvement Of The Subthalamic Nucleus In Impulse Control
Disorders Associated With Parkinson's Disease". Brain 134.1 (2010): 36-49.
Rodriguez-Oroz, Maria C., Elena Moro, and Paul Krack. "Long-Term Outcomes Of Surgical
Therapies For Parkinson's Disease". Movement Disorders 27.14 (2012): 1718-1728.
Rosa, Manuela et al. "Time Dependent Subthalamic Local Field Potential Changes After DBS
Surgery In Parkinson's Disease". Experimental Neurology 222.2 (2010): 184-190.
Rossi, Elena et al. "Webbiobank: A New Platform For Integrating Clinical Forms And Shared
Neurosignal Analyses To Support Multi-Centre Studies In Parkinson’S Disease". Journal of
Biomedical Informatics 52 (2014): 92-104.
Rossi, L et al. "An Electronic Device For Artefact Suppression In Human Local Field Potential
Recordings During Deep Brain Stimulation". Journal of Neural Engineering 4.2 (2007): 96-
106.
Rossi, L. et al. "Subthalamic Local Field Potential Oscillations During Ongoing Deep Brain
Stimulation In Parkinson's Disease". Brain Research Bulletin 76.5 (2008): 512-521.
Santaniello, S et al. "Closed-Loop Control Of Deep Brain Stimulation: A Simulation Study". IEEE
Transactions on Neural Systems and Rehabilitation Engineering 19.1 (2011): 15-24.
Schupbach, W M M. "Stimulation Of The Subthalamic Nucleus In Parkinson's Disease: A 5 Year
Follow Up". Journal of Neurology, Neurosurgery & Psychiatry 76.12 (2005): 1640-1644.
Shenoy, Krishna V., and Jose M. Carmena. "Combining Decoder Design And Neural Adaptation In
Brain-Machine Interfaces". Neuron 84.4 (2014): 665-680.
Shukla P, Basu I, Tuninetti D. “ Towards closed-loop deep brain stimulation: decision tree-based
essential tremor patient's state classifier and tremor reappearance predictor”. Conf Proc IEEE
Eng Med Biol Soc. (2014):2605-8.
Shukla P, Basu I, Graupe D, Tuninetti D, Slavin KV. “A neural network-based design of an on-off
adaptive control for Deep Brain Stimulation in movement disorders”. Conf Proc IEEE Eng
Med Biol Soc. (2012):4140-3.
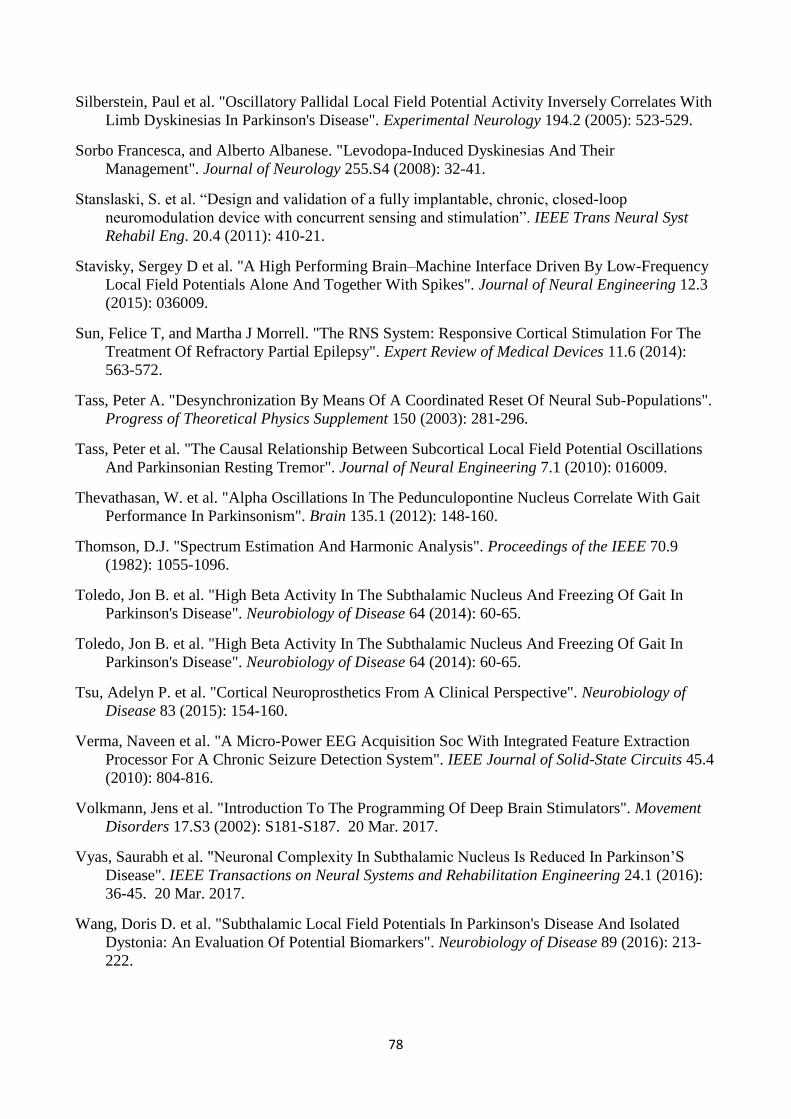
78
Silberstein, Paul et al. "Oscillatory Pallidal Local Field Potential Activity Inversely Correlates With
Limb Dyskinesias In Parkinson's Disease". Experimental Neurology 194.2 (2005): 523-529.
Sorbo Francesca, and Alberto Albanese. "Levodopa-Induced Dyskinesias And Their
Management". Journal of Neurology 255.S4 (2008): 32-41.
Stanslaski, S. et al. “Design and validation of a fully implantable, chronic, closed-loop
neuromodulation device with concurrent sensing and stimulation”. IEEE Trans Neural Syst
Rehabil Eng. 20.4 (2011): 410-21.
Stavisky, Sergey D et al. "A High Performing Brain–Machine Interface Driven By Low-Frequency
Local Field Potentials Alone And Together With Spikes". Journal of Neural Engineering 12.3
(2015): 036009.
Sun, Felice T, and Martha J Morrell. "The RNS System: Responsive Cortical Stimulation For The
Treatment Of Refractory Partial Epilepsy". Expert Review of Medical Devices 11.6 (2014):
563-572.
Tass, Peter A. "Desynchronization By Means Of A Coordinated Reset Of Neural Sub-Populations".
Progress of Theoretical Physics Supplement 150 (2003): 281-296.
Tass, Peter et al. "The Causal Relationship Between Subcortical Local Field Potential Oscillations
And Parkinsonian Resting Tremor". Journal of Neural Engineering 7.1 (2010): 016009.
Thevathasan, W. et al. "Alpha Oscillations In The Pedunculopontine Nucleus Correlate With Gait
Performance In Parkinsonism". Brain 135.1 (2012): 148-160.
Thomson, D.J. "Spectrum Estimation And Harmonic Analysis". Proceedings of the IEEE 70.9
(1982): 1055-1096.
Toledo, Jon B. et al. "High Beta Activity In The Subthalamic Nucleus And Freezing Of Gait In
Parkinson's Disease". Neurobiology of Disease 64 (2014): 60-65.
Toledo, Jon B. et al. "High Beta Activity In The Subthalamic Nucleus And Freezing Of Gait In
Parkinson's Disease". Neurobiology of Disease 64 (2014): 60-65.
Tsu, Adelyn P. et al. "Cortical Neuroprosthetics From A Clinical Perspective". Neurobiology of
Disease 83 (2015): 154-160.
Verma, Naveen et al. "A Micro-Power EEG Acquisition Soc With Integrated Feature Extraction
Processor For A Chronic Seizure Detection System". IEEE Journal of Solid-State Circuits 45.4
(2010): 804-816.
Volkmann, Jens et al. "Introduction To The Programming Of Deep Brain Stimulators". Movement
Disorders 17.S3 (2002): S181-S187. 20 Mar. 2017.
Vyas, Saurabh et al. "Neuronal Complexity In Subthalamic Nucleus Is Reduced In Parkinson’S
Disease". IEEE Transactions on Neural Systems and Rehabilitation Engineering 24.1 (2016):
36-45. 20 Mar. 2017.
Wang, Doris D. et al. "Subthalamic Local Field Potentials In Parkinson's Disease And Isolated
Dystonia: An Evaluation Of Potential Biomarkers". Neurobiology of Disease 89 (2016): 213-
222.
79
Welter, Marie-Laure et al. "Effects Of High-Frequency Stimulation On Subthalamic Neuronal
Activity In Parkinsonian Patients". Archives of Neurology 61.1 (2004): 89.
Whitmer, Diane et al. "High Frequency Deep Brain Stimulation Attenuates Subthalamic And
Cortical Rhythms In Parkinson's Disease". Frontiers in Human Neuroscience 6 (2012): n. pag.
Williams, D. "Dopamine-Dependent Changes In The Functional Connectivity Between Basal
Ganglia And Cerebral Cortex In Humans". Brain 125.7 (2002): 1558-1569.
Winestone, John S. et al. "The Use Of Macroelectrodes In Recording Cellular Spiking
Activity". Journal of Neuroscience Methods 206.1 (2012): 34-39.
Wingeier, Brett et al. "Intra-Operative STN DBS Attenuates The Prominent Beta Rhythm In The
STN In Parkinson's Disease". Experimental Neurology 197.1 (2006): 244-251.
Yamamoto, Takamitsu et al. "On-Demand Control System For Deep Brain Stimulation For
Treatment Of Intention Tremor". Neuromodulation: Technology at the Neural Interface 16.3
(2012): 230-235.
Yoshida, F. et al. "Value Of Subthalamic Nucleus Local Field Potentials Recordings In Predicting
Stimulation Parameters For Deep Brain Stimulation In Parkinson's Disease". Journal of
Neurology, Neurosurgery & Psychiatry 81.8 (2010): 885-889.
Yu, Hong, and Joseph S. Neimat. "The Treatment Of Movement Disorders By Deep Brain
Stimulation". Neurotherapeutics 5.1 (2008): 26-36.
Zbrzeski, Adeline et al. "Low-Gain, Low-Noise Integrated Neuronal Amplifier For Implantable
Artifact-Reduction Recording System". Journal of Low Power Electronics and
Applications 3.3 (2013): 279-299.
Zibetti, Maurizio et al. "Beyond Nine Years Of Continuous Subthalamic Nucleus Deep Brain
Stimulation In Parkinson's Disease". Movement Disorders 26.13 (2011): 2327-2334.