ad.-a2327 685~ - dtic.mil · dr. r.e. reichenbach 1 071 409 4423 amxsn-uk-ra ... from caterpillar...
TRANSCRIPT

'AD.-A2327 685~
COn t~fb ))AJA45 85 02007i
.4Fgto na1elp r eport JUL 0reenwoo d .
forf~linetiao
-~~~0 114odhNi T

REPORT DOCUMENTATION PAGE B O o o)OJ.orscI bp Date iur'3O 1935la REPORT SECURITY CEASSIFICATION lb RESTRICTIVE MARKINGSUnclassified
'a SECURITY CLASSIFICATION AUTHORITY 3 DISTRIBUTIONIAVAILABILITY OF REPORTApproved for public release; distribution
Ptb OECLASSIFICATIONIOOWNGRADING SCHEDULE unlimited
4 PERFORMING ORGANIZATION REPORT NUMBER(S) 5 MONITORING ORGANIZATIOi. REPORT NUMBER(S)
R&D 5305-AN-01
UNAME OF PERFORMING ORGANIZATION |6b OFFICE SYMBOL .a NAME OF MONITORING ORGANIZATIONPembroke College (if appicable) European Research OfficeUniversity of Cambridge USARDSG-UK
k. ADDRESS (Oty, Staie, and ZIPCOde) 7b ADDRESS(Cty. Stale, and ZPCode)Cambridge, CB2 lRF Box 65
FPO NY 09510-1500
4a NAME OF FUNDING/SPONSORING Rb OFFICE SYMBOL 9 PROCUREMENT INSTRUMENT IDENTIFICATION NUMBER
u Mf"A1Th~esearch Office (I applcabl,)USARDSG-UK ARO-E IOAJA45-86-C-007
k ADDRESS(Cty, State, and ZIP Cde) 10 SOURCE OF FUNDING NUMBERSBox 65 PROGRAM PROJECT ITASK WORK UNITFPO NY 09510-1500 ELEMENT NO NO INO 0ACCESSION NO
1 51102A 1L161102BHS 06 AR1 TITLE (Include Security Classification)
(U) Basic Mechanism.; of Diesel Lunrication - CorrelaTion of Bench and Engine Tests11 PERSONAL AUTHOR(S)Professor A. Cameron Dr J.A. Greenwood
,3. TYPE OF REPORT 13b TIME COVERED 14 DATE OF REPORT (Year, Month, Day) 15 PAGE COUNT
FINAL I FROMj rD'e-Fig"TO--an -1 91 MAR 25 22616 SUPPLEMENTARY NOTATION
17 COSATI CODES 1B SUBJECT TERMS (Continue on reverse if necessary and identify by block numberFIELD GROUP SUB.GROUP (U) Oils, (U) Luoricants, (U) Wear, (U) Friction, (U) SurfaE
11 I U8 Roughness, (U) Electrical contact resistance layer21 1 (U) Tenperature effects
19 ABSTRACT (ContinuWe on reverse if necessary and identify by block number)The lubrication behaviour of a cylinder liner/piston ring contact In a diesel engine hasbeen simulated in a point contact reciprocating rig. When lubricants containing ZDDPadditives are used, electrical contact resistance measurements establish that a thick'reaction film' quickly forms in the rubbed region, protecting the metal surfaces.Electrical capacitance measurements show that the film thickness can vary from 0.1 toI Pm: the film appears to be a solid organic polymer with e shear strength of50-100 NPa.
Using segments of diesel engine cylinder liners from various manufacturers in thereciprocating rig, the changes in surface roughness during the running-in process weremonitored. The induction time needed for the formation of the reaction film as well as
the coherence of the film was studied as a function of load and temperature(inthe range 150 - 250C).
A theoretical analysis of flash temperatures in reciprocating contacts confirmsthat these are small under the conditions in this rig, so that the measuredtemperatures are those actually responsible for the reactions.
20 DISTRIBUTION/AVAILABILITY OF ABSTRACT 21 ABSTRACT SECURITY CLASSIFICATIONgUNCLASSIFIED4JNLIMITED 3 SAME AS RPT I OTIC USERS Unlassified
22. NAME OF RESPONSIBLE INDIVIDUAL 22b TELEPHONE (include Area Code) 22C OFICE SYMBOLDr. R.E. Reichenbach 1 071 409 4423 AMXSN-UK-RA
DD FORM 1473,14 MAR 8 APR edition may beuseduni eauslel SECURITY CLASSIFICATION OF I. S PAGEAll Oher edition a te obsolete
' Unclassified

BASIC MECHANISMS OF DIESEL LUBRICATIONCORRELATION OF BENCH AND ENGINE TESTS
Contract No. DAJA 45 86 CD007
Final Report
for
Deparcment of the ArmyUnited States Army Research Development and Standardization Group UK
Edison House, 223 Old Marylebone Road, London NW1 5TH
A F Alliston-Greiner Dr J A Greenwood
D Cameron Professor A CameronPrincipal Investigator
March 1991
Dis t I
, ,
[!,: , .. . ....

BASIC MECIANISMS OF DIESEL LUBRICATION CORRELATION OF BENCH AND ENGINE TESTS
Contract No. DAjA 45 86 0007
9RiECT O THE WORK
The aim if this project is to produce a method of assessing cylinder liner
quality in a laboratory test machine, to reduce the amount of full-scale testing.
The pbibility of devising a much shorter, but equally effective running-in
procedure should also follow.
In order to do this effectively, a study should ie made of the type of
lbrica.ior. encountered in the cylinder liner/piston ring contact. This report
se kb to expand the understanding of the role of the anti-wear additive zinc
didlkyldithinphosphate (ZDDP) from observations of the action of the aJditive in
the contact forming a reaction film. Measurements of the film thickness arn also
part of the research.
SUMMARY
The work reported here- is in three parts. The first describes the reasons why
th, high frequency reciprocating (HFR) test apparatus simulates real life
conditions. It then describes z new design of the apparatus originally developed
at Imperial Zolege London and publish,id in 1981. Electrical contact resistance
(ecr) measurements indicated the existence of a thick boundary layer. Tc confirm
this a capacitance technique wa, Aeveloped to meabure it. Experiments showed it
to be of the order of 1/10 to I micronj thick, Ls expected. Using this result
together with the friction. the mechanical propn.J'r of the layer were
determined. This demonstrated the layer had the shear strength of 50-100 MPa,
which is typical of organic polymers. The layer was temperature and load
dependant.
In the second part the raction films of commercially available ZDDP
additives were studied. The apparatus was then redesigned to accept segments of
diesel engine liners. The running-in process was followed by three indicators
which were devised in this research. One, the change in the surfaces as shown by
2-
the rounding of the peaks. for which a new computer program was developed. The
second was the tine, the induction time, taken for the high e.c.r. hlm to be
formed.
Finally, the coherence of this thick film was measured. All these three
were dependant on load and temperatures in the range 150-250'C. Five liners, tio
from Caterpillar OL-5 and OL-6 engines and one each from Curmins NTC-400, John
Deere 6404 and Mack T-7 were tested and 9 oils. The conclusion was that this
device can clearly distinguish between the liner/oil pairs. To give an order of
merit the tempexatures must be specified, since the ranking varies with the
contact temperature, as would be expected. The decisive temperatures for the
different pairs can only be determined by comparing the various rankings as
decided by these tests with engine performance. Unfortunately, this was not
available, hence only the first part of the programme could be completed.
In the third part, a theoretical study of the temperatures generatred in this
reciprocal contact device was undertaken. One of the assumptions made !n the
design of this rig is that, under the conditions of running, the temperature rise
in the contacc, the temperature flash, was small. It needed a full theoretical
analysis to show that this was the case.
In conclusion it may be said that this work has produced a great deal of
basic data, especially in the realm of -unning-in, which will enable the choice
of liners and oils to be made with more confidence, once these tests can be
compared with the operational data of existing engines.
The title of the whole project is Basic mechanisms of diesel lubrication:
correlation of bench and engine tests. Due to a number of reasor.s no engine
tests have been reported to us, so this half o'f the project could not be
attempted. This is regrettable and limits thf immediate value of the work.
However, much has been found that engine makers and users could apply directly to
their products.
iL

4
3-
ARRAINGEMFNT OF THE WHOLE REPORT
This report, the final one, is divided ir.to three soctions.
Section I
The first section describes the development of the test rig used for the
work. This type of machine is relatively new and has produced evidence of a
thick polymer layer being formed on the surfaces of the rubbing contacts over a
definite temperature range. It is considered that this layer is a major factor
in the effective lubrication of internal combustion engines. The properties of
this film, including its thickness, were studied.
This section of the work is self contained and was presented as a paper at
the 1987 Leeds-Lyon Symposium. A reprint of the paper is bound at the end of
this report.
Section 2
This is in two parts. Part 1 deals with the lubrication characteristics of
the Caterpillar liner, designated liner C, and 4 oils, reference numbers
AL-15932/33/34/35-L, labelled oils Cl-C2-C3 and C4. These were studied in detail
and three methods were developed to give numerical values ior the running in
process. In the second part of the section a number of oils were used %lith the 6
lineis. In all these tests a single ball ended counter surface was used. The
reason for this was that there was so ruch to be learnt with the methods
developed in this work to describe the running-in process that attempting to
increase the matrix of tests using different piston rings, would have meant the
tests would have been spread so thinly that no reliable test data would have been
produced. These tests have produced most valuable results, and so have justified
the use of the ball ended test piece.
Section 3
There have been criticisms that the reciprocating rig produced temperature
flashes of unknown size. A thorough theoretical study was therefore undertaken
to find out what the surface temperatures were under these conditioiis. This work
is reported here.
A list of references for each section or part of the work, for convenience,
follows that section.

CONTENTS
SECPION I PROPERTIES AND THICNE OF ZDDP FILM
I OBJECT
2 SUMMARY OF SECTION 1
3 INTRODUCTION
4 RECIPROCATING RIG
4.1 Apparatus4.2 Electrical contact resistance4.3 Contact capacitance4.4 Load and friction force4.5 Heating and temperature measurement4.6 Cleaning
4.7 Film thickiess measurement4.8 Dielectric constant
5 REAG ION FILMS FORMED BY ZDDP ON STEEL AND CAST IRON
5.1 Film formation5.2 Wear reduction5.3 Variation of film thickness with load5.4 Variation of film thickness with temperature5.5 Shear properties of the reaction films
6 DISCUSSION
6.1 Film formation and wear reduction6.2 Film properties6.3 Effect of temperature
'7 CONCIIONS
8 APPENDIX 1 CIRCUIT DIAGRAMS
9 REFERENCES

SECTION 2 THE RUNNING-IN PROCES: OIL/LINER PAIRS ABKCDEF
I OBJECT
2 SUMMARY OF SECTION 2
PART I LINER C (Caterpillar 12) oils CI, C2, C3,C4
3 INTRODCTION
4 EXPERIMFiTAL DETAILS4.1 Reciprocating Rig4.2 Materials4.3 Surface analysis4.4 Friction and E.C.R.: Film activity and coherence4.5 Test conditions
5 7hE RUNNING-IN PROCESS5.1 Surface changes5.2 Induction tine5.3 Coherence
6 DISCISION6.1 Surface changes6 2 Induction time6.3 Coherence
7 CONCLUSIONS
8 APPENDIX1 Oil details2 Coherence scale
9 REFERENCES
PART 2 OIL/LINER PAIRS ABDEF
10 INTRODUCTION. Fixed pairings and mixed pairings
11 FIXED OIL/LINER PAIRS11.1 Surface changes
11.2 Induction time11.3 Coherence11.4 Summary
12 MIXED OIL/LINER PAIRS12.1 Surface changes12.2 Induction time12.3 Coherence12.4 Summary
13 DISCUSSION
14 CONCLUSION OF RUNNING-IN TESTS WITH LINERS ABC)EF

SECTION 3 TEKPERATURES IN A RECIPROCATING COlTACr
SUMNARY
1.1 Introductioa1.2 Framework and assumptions2.1 Steady temperatures. Small amplitudes (A S 1)2.2 Steady temperatures. Large amplitudes (A 1)3.1 Flash temperatures A < 13.1.1 Flash temperatures A < I small)3.2 Flash temperatures A > 13.3 Cooling from the steady state A > 13.4 Flash temperatures A = 14.1 Maximum temperatures4.2 Comparison with published solution4.3 Comments on the approximations5.1 Heat partitioning5.2 Contact temperatures under experimental conditions
ReferencesAppendix IAppendix 2Appendix 3

SECTION I - PROPERTIES AND THICKNESS OF ZDDP FILMS
I OU.IECT OF THE SECrION
Earlier work had reported that electrical contact resistance results suggest
that oils containing ZDDP additives produced thick films. Resistance
measurementb are never quantitative, so a capacitance method was needed to
measure it.
2 SUNNARY OF SECTION I
1. A newly designed reciprocating ball-on-flat apparatus is described.
2. Reaction film formation by commercially available ZDDP additives were
observed and their thicknesses measured by capacitance during the rubbing
process. The film behaviour is related to its composition and the thermal
stability and reactivity of the additives.
3. Preliminary observation is made of the running-in process with cast-iron
cylinder liners.

3 INTRODUCTION
There have been many observations of reactions between oils containing
zinc dialkyldithiophosphate and steel, forming 'varnish-like' films on
the metal surface (l-41. Much about their mode of formation in a contact
remains obscure. Monitoring the electrical contact resistance during
running is the normal method of detecting their formation [5). The electrical
contact resistance, howeverc can only give an indication of the effectiveness
of the film in reducing solid-solid contact, and cannot give a measurement
of film thickness [6). There has been ,n attempt to make a quantitative
relationship between the degree of asperity interaction and the nominal
elastohydrodynamic film thickness for a disc machine contact 171. This
relies on calculating the ehl film thickness.
Measurement of the thickness of reaction films therefore poses
a problem. Much work has been done on films already formed on surfaces,
either after running in a contact or by dipping a steel plate or 'coupon'
in heated oil. The thickness of the resultant film can be determined
optically, by scratching the film and observing the shadow cast by a light.
Scanning electron microscopy coupled with a chemical analysis system (e.g.
Auger Spectroscopy) iv also used. Films between 60 nm and 2 um (8-101
have been reported. The ob3ections to this 'static' study is that the
surfaces have to be cleaned before observation, which probably removes
some, unknown, amount of loosely bound material. Also the method of film
formation with a dipped coupon is different from its formation in a rubbing
contact, since the rubbed surfaces take part in the reaction (see below).
This is an important but often overlooked consideration.
It has been found that even under conditions of nominally pure
rolling, the film ir the wear track is far thicker than on the surrounding
surfa(:s [Ill. It is believed that the thick film is due to the rubbing
process which removes protective oxides and exposes active metal surface,
-4-

which in some way promotes film formation. Usually the rubbing metals
are polyvalent such as iron, chromium, etc., which are good catalysts.
It is most deqirable therefore that any study of the reaction film should
be of a film resulting from a rublieS irocess with carefully controlled
contact temperatures (see below). Dipping surfaces into heated oil is
much less satisfactory as the resultant film was not formed during the
frictional process.
These varnish films are formed by chemical reaction, and so presumably
are very temperature sensitive. Hence the temperatures at which the film
is formed is of considerable importance and should be known accurately.
Furthermore it is well known in accelerated oxidation tests that the reaction
mechanism changes with tem:,erature. Hence to study the action of E.P.
additives correctly the contact temperatures must be identical in test
rig and engine. The problem in most sliding contact bench experiments
is that the contact temperature is not known accurately. This is because
the contact temperature is made up of a 'bulk' component together with
a transient component due to frictional heating. A thermocouple placed
near the contact, or embedded in the surface does not pick up this flash
temperature, which can be very appreciable (12, 13). Furthermore where
the film is formed in a friction device running at slow 3peeds to enable
the contact temperature to be accurately determined, the rate of contact
repetition is wrong. This is discussed further below.
The first study of the formation and simultaneous measurement of
a reaction film thickness was using an optical ehl device [111. Temparatures
up to 99'C were achieved, and a very reactive oil was used. The optical
method demands a semi-reflecting layer on a glass plate, and a very highly
polished metal ball, so that the friction system was rather unusual, but
the results were of great interest. Next films were observed by a capacitance
method in a disc machine, running with a bulk oil temperature of 25*C
-5-

T114], but unknown contact temperature. These papers reported increases
in the ehl film thicknesses due to additive action of 160 nm and 600 nm.
The great diaadvantage of the disc machine is that the contact temperatures
are difficult to determine with certainty. A variant of the optical method
[151 used balls dipped in hot oil and subsequently run in the optical
device. Similar results were found.
It seems, therefore, that for a realistic study of the formation
of the reactiLon film, four conditions must be met:
(i) The film must be formed in a rubbing contact.
(ii) Realistic surfaces and materials must be used.
(iii) The temperature of the contact must be known accurately.
(iv) The lubrication conditions should be known.
Many components, and particularly the cylinder liner/piston ring
contact function in the 'mixed lubrication regime' - i.e. where there
is some contribution from oil viscosity and also some contribution from
boundary films. The problem in these cases is sorting out the viscous
from the boundary conditions. Therefore in order to make interpretation
of film properties straightforward, classical hydrodynamic lubrication
should be excluded, so that the lubrication conditions are known to be
purely non-viscous.
All these conditions are met in the reciprocating test rig that
is described in this report. In order to make measurements of film thickness,
the capacitance of t'e ball/flat contact is to be monitored. Deductions
of the film thicknesses are made from the capacitance readings. Thus
the distinctive contribution of this work is that thickness measurements
are made of reaction films formed by ZDDP during running under carefully
controlled conditions, (especially of temperature) and at the correct
repetition contact rate.
- 6-

JI4 RECIPROCATING RIG
The development of the reciprocating rig first described in [111]
has been detailed in the two interim reports (17, 18]. In this section
the principle of the machine is described, and then details of the component
parts of the rig are given, explaining their function.
In the piston ring/cylinder liner contact (and in any repeating
contact device) it is the repetition rate rather than the speed which
is important when considering interactions of surface asperities. The
protective film formed by additives is completely or partially removed
during each contact and must be reformed before the next one: the time
available for this is crucial. The rate of reformation depends on the
chemical activity of the systems (metals and oil) and of course the temperature
- see (19). Therefore knowing the contact temperature is important.
However, in most test devices the speed is high (giving large and unknown
flash temperatures due to frictional heating) but the repetition rate
is not as in the running engine. The reciprocating apparatus therefore
provides a simple device, using actual engine components, of avoiding
high flash temperatures (since the sliding velocity is low), but having
the correct repetition rate. This means also that the contact temperature
can be controlled accurately, simply by controlling the bulk temperature
of the test specimens.
4.1 Apparatus
The contact configuration is ball-on-flat, the ball being reciprocated
by a Ling Dynamics electro-mechanical 100 W oscillator loaded against
a fixed flat (see Figure 1, reproduced from the previous reports). Standard
conditions were 34.5 Hz, * 0.5 mm. The ball is a push-fit into a 0.092"
diameter hypodermic tube which holds it in place on the vibrator arm (eigure
-7-

2). The hypodermic tube provides an easy method of mounting, and also
o0 making electrical connection. Balls used in these studies have been
3/32' diameter bearing Lalls, and specially produced silver steel 'pins'
w.th radiused ends (radius 4.5 mm), hardened to 450 VHN (45 R ).c
The flat is held in place on the 'boat' (Figure 1) in a clamping
a%7rangernent (Figure 2). The 'boat' is prevented from moving horizontally
,,y a strain-gauge transducer (described later). The flats were made from
AXSI-01 high carbon (0.9 - 1.0%) steel gauge plate, hardened to 750 VHN
(60 R) and polished with emergy paper and diamond lapping to an initial
ffinish of 0.02 im cla. The flat was provided with a tapped hole to facilitate
electrical connection (dimensions are given in Figure 2).
By making the clamping arrangements for the ball and flat with 'tufnol'
(a phenol urea plastic) and also PTFE, electrical isolation of the rig
f-rom these pdrts was readily achieved. This, then, allowed not only for
electrical contact resistance to be measured (here isolation does not matter),
but also allowed the capacitance of the contact to be measured.
4.2 ]Klectrical Contact Resistance
This is a standard technique for monitoring contact conditions
in many test devices (5, 201. Quite simply, a voltage of approximutely
15 mV is applied across the contact by means of a potential divider (see
Figure 3), and the contact voltage is observed on an oscilloscope. 'Zero'
rolts implies that all the voltage drop is across the contact, i.e. that
the contact resistance is effectively 'zero' (only a rew ohms). '15 mV'
on the scope implies no voltage drop across the coptact, and therefore
a very large or 'infinite' resistance. Its exact value depends on the
size of the resistance in the potential divider. In our standard case
'infinite' means > 107 S.
-8-

Because of the way this circuit works, a contact voltage of '7.5 mY'
corresponds to a contact resistance of a value equal to the resistance
of the potential divider (R 2). Generally, the contact resistance fluctuates,
sometimes high and sometimes low (see Figure 4). This gives some indication
(qualitative) of the degree of asperity contact (5). By taking the average
of the siqnal (i.e. putting the signal through a low-pass filter) a continuous
record of the 'degree of asperity contact' can be recorded. This was
done, and it forms one of the three traces on a chart recorder.
4.3 Contact Capacitance
Capacitance measurements have been made in other friction devices,
such as piston ring/cylinder liner 121] and disc/disc (14). The advantage
of this method is that it is possible to make more quantitative estimations
of both the amount of asperity contact, and the thickness of the film
in the contact. However, the technique does rely on there being little
or no asperity contact, since any metal-metal contact shorts out the circuit.
The essential features of our neasurement system are given in Figure 5,
and are similar to those mentioned above [21, 22). The ball and the flat
become the two 'active' parts of the circuit, their contact capacitance
becoming the 'unknown' reactance in a 4-arm bridge circuit. The rest
is earthed. Balancing the capacitance with the ball/flat just out of
contact gives the value of stray capacitance, which can be deducted from
the experimental values. The bridge is a Wayne Kerr B224 transformer
ratioarm bridge, with the voltage supplied externally by an oscillator
at 2.4 kHz and an amplitude that keeps the conta-t voltage at about 50 my.
In this way maximum bridge sensitivity is achieved while keeping the voltage
low enough to avoid electrical break-down of the film on the contact.
The unknown signal is fed into the bridge, and the out-of-balance is also
- 9-

displayed on a HAMEG 208 storage oscilloscope, together with the friction
trace. The bridge can then be balanced at a particular point in the stroke
ss'y mid-stroke), and variations in the capacitance across the stroke
ca:i be observed. Metal-metal contact is observed when at particular points
in the stroke, the capacitance signal is seen to have a high value, or
a "short" (Figure 1:).
4.4 Load and Friction Force
The ball is loaded against the flat by means of a 'yoke' and lever
(Figure 1), the dead weights being decoupled by a spring. Loads in these
experiments were usually between 0.2 kg and 1 kg, sometimes higher. The
loads had to be big enough to produce a good friction signal, but not
so big that a coherent film did not form. It was found that 1 kg achieved
this balance best. Nominal contact pressure therefore range from 1.5 kN/mm'
to 2.6 kN/mm' for the bearing-ball contact.
Horizontal movement of the specimen was restrained by the strain-
gauge transducer. This was an aluminium block with a thin leaf section
1 mm thick, acting as a very stiff 'spring'. Strain-gauges glued to the
top and bottom surfaces (to provide compensation for bending) pick up
the small strains due to the friction force on the flat, and are then
amplified. The signal from the amplifier is displayed on the Hameg storage
oscilloscope, and also rectified and low-pass filtered to provide an average
friction force for the chart-recorder. Since the motion is sinusoidal,
the friction trace is a square-wave.
The strain-gauges were calibrated by applying static loads to the
aluminium block. The chart-recorder trace was calibrated using a function
generator.
-10-

4.5 Heating and Temperature Measurement
Heating is by hot air blown into an insulated container surrounding
the friction elements. The central section of the rig (that is everything
on the small base-plate) is enclosed in a thermally insulated box, which
is a metal-fibre sandwich. The box is split in half, and has hoies for
the vibrator-arm, loading lever, force-transducer, electrical connectors
and for hot air to be blown into the box. Air is blown through a tube
containing a resistance heater element. The air temperature is raised
from supply temperature to box temperature by this process. The hot air
outlet is directed to blow 3ust underneath the "boat". The air is from
a shop air-line, and a rate of 35 £/mmn was found suitable.
The temperature of the contact is monitored by two thermocouples.
One controls a West 2050 Programmer Controller, which switches the power
to the heating element with a 'bang/bang' relay. This thermocouple is
kept electrically isolated from the flat by placing it in between the
nylon sheets in the specimen clamp (Figure 2), so that it does not provide
an earth path which would render capacitance measurement impossible.
Th-3 other thermocouple is clamped against the flat, but so that the tip
is not directly in the path of blown hot air. This records the contact
temperature and becomes an input to the chart recorder. The thermocouples
are chromel/alumel, and the recording thermocouple is fed to a digital
voltage multiplier for display purposes.
The controller can be programmed to supply up to four ramps and
four dwells. Typically, contact temperature is maintained at 150'C ± V0C,
and ramp-rates of 50C/min and 25
0C/min are used.
- n1 -

4.6 Cleaning
Cleaning of the entire rig is important. To facilitate this, the
central section is made in 18/8 stainless 'teui ,o that excess oil can
be burned-off and cleaned without harm. It can therefore be thoroughly
cleaned when a change of additive is made. Trace amounts cf additive
seem to make a big difference. The ball and flat specimens are cleaned
ultrasonicdlly first in acetone and then in pentane. They are then assembled
in the rig carefully, coating them in the oil to be used in the experiment
as soon as possible.
4.7 Film Thickness measurement
Mostly, capacitance readings were taken at mid-stroke, and a typical
out-of-balance signal is shown in Figure 7a. The signal is nulled (Fig. 7b)
giving a combined capacitance of conductance for the contact.
Film thicknesses are obtained from these capacita.,ce readings by
reference to a calibration curve (Figure 8). Calibration was done in the
following way. First an unworn flat (initial finish 0.02 Lun cla) was coated
with a known tnckness of amorphous silicon oxide by vacuum depostion
at 300'C. The thickness was measured by ellipsometry.
These coated specimens were then used as calibration film thicknesses.
A ball was loaded against each flat, with the electrical connections the
same as in the experiment. For ease (and because of alignment problems),
the ball/flat were not loaded together in the rig, but in a jig to help
this alignment. This was particularly important when using balls chat
had themselves been used in an experiment and had a wear-scar. Contact
capacitance was measured as described earlier, and values for a range
of film thicknesses and a range of wear-scar sizes were obtained. The
- 12 -

line in Figure 8 has been drawn for a wear scar size of 0.15 mm (diameter),
which is typical of these experiments. What is surprising is that the
scar size seems to have little effect on the capacitance of the contact.
This could be due to misalignment of the contact, even though care was
taken to load the coated specimen against ths. worn part of the ball. There
may also be a problem that the ball was not in contact over its entire
worn surface, and therefore that the 'nominal' scar size was not actually
the size "seen" by the contact. This is confirmed by looking at a profile
trace of a worn ball (Fig. 9). The wear scar does not produce a 'flat'
on the ball, but rather reduces the curvature and roughens tho surface.
The dielectric constant of the oxide film was taken to be 4.0,
and that of the reaction film as 2.3 (see below). The calibralon line
for the reaction film was then obtained by dividing the capacitance values
for a given film thickness by the ratio of the dielectric constants.
4.8 Dielectric Constant
The above calibration has assumed that the dielectric constant
of the reaction film is the same as that of the un-reacted oil.
It has not been possible to measure di:ectly the dielectric properties
of the reaction films formed by ZDDP because of the difficult, in producing
sufficient quantities. A search of the literature reveels that measurements
have been made of the dielectric constants of mineral oils containing
ZDDP (23, 241 and are typically around 2.3 (i.e. the same as the base
oil). The capacitance of the base oil (500 Solvent Neutral) in these
studies was measured in a simple capacitance cell (F,gure 1G), and did
not change on addition of 1% ZDDP. Thus, in the hulk, the additive does
not change the die"-icLric propcrticr of the oil. Again, no change in
the dielectric constant was observed when a sample of oil with 1% ZDDP
- 13 -
LV

%s heated to about 250*C and cooled.
From current literature searches, it seems likely that the dielectric
constant of the reaction film will not be greatly different from the unreacted
additive. In the unlikely worst case of the dielectric constant being
as large as 4.0 (c.f. a highly polar polymer) the film thickness would
be larger and around twice the value calculated for c = 2.3.
- 14 -

1"5 REACTIO11 FILMS FORMED BY ZDD? ON STEEL AND CAST IRON
Four different ZDDPs were tsed in these experiments, incorporated
in a 500 Solvent Neutral (500 SN) base oil at a 1% by weight treat level.
The four additive oils were designated A to D and details are given in
Table 1. The essential difference between the tour ZDDPs is the nature
of the alkyl grou?s in the molecule, these are also shown in Table I. The
different alkyl groups give the ZDDPs different thermal stabilities and
reactivities, although exact details are not yet available. The baset
oil and additives were supplied by Castrol Research Laboratories, the
additives originating from Exxon and Lubrizol. No details were available
about their purity.
The experimental results presented aim to demnonstrate some of the
features of the method of lubrication witY zinc dialkyldithiophosphate
additive. Results include observations of film behaviour in the rubbing
contact under static and dynamic loading, with varying temperature, stroke
and frequency. Additionally, and this is where this apparatus differs
from other devices, measurements of film thickness are made during running
and at temperatures tkat are comparable to a running engine. The important
point is that the temperatures at which the films are formed is known.
5.1 Film Formation
The standard temperature for experiments was set at 150*C. This
is considered to be a typical working temperature for contacts such as
cam/tappett and piston ring/cylinder liner - although values much greater
than this may be experienced due to transient flash and high sump temperatures.
However, it should be noted that the calculated flash temperature in our
experiments is only a few degrees, which means that tne measured bulk
temperature is effectively the contact temperature. It was also found
- 15 -

that 150C was the optimum temperature for film formation, the additives
readily form a reaction film that provides good surface protection.
The first observation was that film formation is rapid. This can
be seen in the chart-recording of an experiment for additive C at a constant
temperature of 150*C in Figure 11. The load is 1 kg, and the upper trace
is the friction force, the lower trace the average electrical contact
resistance. Motion was started, and the load was applied. Initially
there is an 'induction time' in which no film activity is observed - in
this case about 45 seconds. In these first moments of motion a high friction
transient is seen, which rapidly settles down to a value 3ust greater
than U = 0.1. This friction transient is associated with the 'induction
time* when there is no film activity and therefore little protection of
the rubbing surfaces.
Subsequent to the 'induction time the average electrical contact
resistance is seen to rise rapidly from a value of almost zero to a value
higher than 10 MP in about 30 secs to 2 minutes of rubbing (corresponding
to 4000 passes or 8 m of sliding). In this time there is a small reduction
in the friction force - corresponding to the observed improvement in the
coherence of the reaction film. This is seen from the out-of-balance
capacitance signal in this period. When the electrical contact resistance
is observed to be high over the whole stroke, there is still much evidence
of solid-solid contact through the film, manifested by momentary 'shorting
out' of the capacitance signal. However, as motion proceeds, these asperity
interactions diminish until, in most cases, they vanish. Also in this
period, the value of capacitance to 'null' the trace at mid-stroke diminished,
indicating that the reaction film thickness increased.
Figure 12 shows another experiment at 150°C, but th i time with
a variable load. After film formation at the initial load of 0.2 kg,
the load was increased in steps of 0.2 kg. The averaged electrical contact
- 16 -

resistance trace reveals that the film was disrupted on two of these load
stages (seen from the downward spikes on the trace). But, after the fils
was disrupted, the contact resistance once again rises rapidly to the
high v.lue - the film has re-formed.
So far these observations have been for polished steel specimens,
but the same kind of effects were observed for cast-iron cylinder liner
specimens. These were plateau honed 0.25% phosphorus flake graphite cast
iron with a cla roughness of 1.50 pm. These experiments show the same
rapid film formation, although the time taken for appreciable asperity
interaction to cease is much larger, if not infinite. A typical trace
is shown in Figure 13, for oil B at 150*C and a load of 1 kg (i.e. conditions
identical to those in Figure 11). A high electrical contact rasistance
is formed after about 2 minutes of rubbing, and solid-solid contact is
reduced to almost zero within the first 10 minutes of rubbing. A second
experiment is shown in Figure 14, and here the film formation takes about
3 minutes, although at the end of this time the amount of asperity interaction
was still too great to make capacitance readings.
Cast iron experiments again demonstrate the resistance of the reaction
film to load changes. Figure 15 is a variable load experiment at 150*C
for oil B. The load is raised in 0.5 kg steps from 0.5 kg to 3 kg. At
each load stage, there is a momentary loss of the high electrical contact
resistance (e.c.r.), indicating a loss in film protection, bit this rapidly
heals giving the high e.c.r. again. The capacitance trace reveals that
at each load stage solid-solid contact did not fully cease. However,
some readings were obtainable, indicating film thickness values of 0.1
to 0.3 m, which compare favourably with values obtained for the polished
steel specimens (0.1 - 1.0 pin). The load stage of 3 kg caused the film
to show signs or failure (the high e.c.r. value is greatly reduced).
However, the additive is still effective at loads greater than 3 kg.
- 17 -

Figure 16 is for an experiment with a constant load of 5 kg, at 150'C
with oil A. Initial film formation is after about 4 minutes of rubbing,
but it then takes about 2 hours for there to be film with an appreciable
reduction in solid-solid contact. This is inferred from the amount of
'fur' on the e.c.r. trace gradually reducing over this period.
Returning to the polished steel specimens, experiments have been
performed with other initial temperatures from 20'C to 200*C. Two kinds
of effect have been observed. The first is that at 20'C there exists
what is substantially a hydrodynamic film, since at this temperature the
oil is much more viscous than at 150*C, and the additive is not yet reacting.
Figure 16 shows the chart recording for an experiment with a constant
load of 1 kg using oil B and a 4.5 mm radius pin, with temperatures from
20 - 250*C. Photographs of the electrical contact resistance were taken
from the oscilloscope (Figure 18) showing this behaviour. At 20*C there
is 'lift-off' in the middle of the stroke (top trace), but no lift-off
at the ends of the stroke, which is the hallmark of hydrodynamic lubrication.
It should be noted that there is still a high degree of asperity interaction
in these conditions. As the temperature is raised to 50*C, there is evidence
of some reaction film activity, since there is a non-zero resistance at the
ends of the stroke. It is far from being a coherent film, since it is noted
that on this scale the rsistance 'high' corresponds to only 10 kS2.
Figure 17 also displays that at 20oC the friction coefficient, p,
is lower than the value after a reaction film is formed. The "hydrodynamic"
lubrication gives p - 0.089, but the pure film gives p = 0.108. The same
effect, although less marked, was observed for the bearing ball sliding
(Figure 19): p rises from 0.088 to 0.095. In both these experiments,
a coherent film was not obtained until about 150*C.
The second effect noticed in the variable temperature experiments
is slightly different. The same trend in friction force is observed,
- 18 -

but the hydrodynamic action is obscured. This seems to be due to some
reaction film formation at the low temperature. This is shown in the
results recorded in Figure 20 for a bearing ball sl)ding, and at the lower
load of 0.2 kg. The explanation may lie in the severity of the bearing-
ball contact as compared with the radiused pin. The smaller radius gives
a larger contact pressure, and therefore greater local asperity pressures
which may give temperature effects suitable for film formation.
During motion, the film thickness was found to be nearly constant
over the entire stroke, with the main variation being at the ends of the
stroke where the velocity reverses. Figure 21 is a photograph of a typical
friction and bridge out-of-balance signal taken from the oscilloscope.
The bridge signal is very clean, indicating that there is no asperity
interaction. It has been 'nulled' at the ends of the stroke, and therefore
approximately displays the film 'shape' across the stroke. it should
be noted that the bridge separately balances out the capacitance and conductive
parts of the 'reactance', so enabling readings of both contact capacitance
and resistance.
The film shape is shown better when the signal is 'nulled' at the
mid-stroke position (Figure 22). Here the almost uniform film across
the stroke is readily observed. The capacitance values at the ends of
the stroke are always lower than at the middle. This i. plies that the
film thickness increases at the ends of the stroke - a rather surprising
observation, since we would expect the film to be thinner where the velocity
is zero. However, if the film is a solid: then this film thi&ness at
the ends of the strove can be attributed to a kind of 'bull-dozing" effect.
as the solid is sheared and pushed to the ends of the contact, and the
slider 'rides-up' on the piled-up material.
What is clear is that the fila does not act as cl-sical hvdx.odynamics
would require. The velocity varies markedly throughout the stroke, but
- 19 -

but the film thickness appears to be largely unchanged.
5.2 Wear Reduction
From visual obervations of wear scar at various stages of running,
it becomes apparent that most of the wear has taken place in the firct
1-2 minutes. It is in this period that the reaction film is seen to form.
The capacitance observations show that there is little cr no solid-solid
contact once the reaction film has been formed.
Simply comparing results for the additive oils with results for
the base oil alone reveals that while the friction coefficient is roughly
the same, the wear is very different. This is displayed in Table 2, where
friction coefficientq and wear scar diameters for a number of experiments
are recorded. The friction coefficient is a very poor indicator of the
ability of the reaction film to protect the surfaces. This same effect
is shown pictorially in Table 3. The wear reducing action of the additives
is very apparent: not only is the wear scar diameter reduced, but also
the apparent roughness of the worn surface is lower. The profiles displayed
in Table 3 were taken in a profilometer after the ball and flat had been
gently rinsed in solvent to remove excess oil. This m ant that most of
the reaction film was still in place on the surface. The profiles are
displaced by about 0.2 - 0.3 v1 on the vertical scale of the diagram to
give some indication of the relative size of the apparent roughness to
ne reaction film thickness. At the high load of 1.0 kg, the films were
about 0.3 Pm thick which was comparable to or greater than the apparent
rouganess of the wear scar. At the lower load of 0.2 kg, the films were
about 0.6 pm thick, and ruch greater than the apparen uqhness of the
scar.
It is, of course, this wear reducing ability of the idditive that
- 20 -

is important in practice. A photographic record of some results for 5 Xg
load tests using cast-iron cylinder liner is shown in Figure 23, each
picture showing the wear scar on the liner after 2 hours of rubbing. it
is immediately obvious that the wear is greatly reduced from the base
oil alone by addition of 1% ZDDP. The 'cross-hatch' honing marks were
obliterated when the base oil was used, but are still evident after running
with additive oil. Figure 24 displays photographs for experiments run
for different lengths of time '5 minutes, 2 hours and 4 hours). Here
it is quite striking that the wear scars are visually almost the same,
indicating that most of the wear seems to have taken place in the first
5 minutes of rubbing.
5.3 Variation of Film Thickness with Load
At a constant temperature (100, 150 or 200'C) wlh a load of initially
either 0.2 kg (bearing ball experiments) or 1.0 kg (for the radiused pins)
motion was started. Conditions were allowed to settle down, and then
a capacitance reading was taken for the mid-stroke position. The load
was then either raised or lowered in steps of 0.1 kg to cover the range
0.2 - 1.0 kg. Each load was applied for 2-5 minutes before a new capacitance
reading was taken. This allowed the film to establish itself under the
new running conditions. This is termed the dynamic loading of the films.
At the end of the dynamic loading, motion was removed. On all
but a few occasions, the film remained in the contact. It was immediately
apparent that the film thickness when static was different from the dynamic
readings, since the bridge out-of-balance signal changed. The film in
the contact was then loaded normally and capacitance readings taken at
each load stage.
Although there is some variation in the wear scar size between
- 21 -

each experiment, the calibration curve for deducing the film thickness
was used for a typical value of wear scar diameter. The reason for this
is that in calibration, the wear scar diameter (for the small sizes in
these experiments) did not seem to change the capacitance value significantly.
It should be noted that the wear scar on the ball is far from the 'ideal'
of a flat on the ball, and is rather a roughened region where the ball
contacts the flat. The variations of deduced film thickness against load
are shown in Figures 25 - 28, 30 - 33.
t Figures 25 - 28 are for bearing-ball experiments at 150*C, the
hollow symbols correspond to the dynamic loading, and the solid symbols
to the static loadinS. The first observation is that the film thickness
decreases with load. Curves have been drawn on the figures to indicate
the general trend. The curve is more nearly a straight line for the static
loading, indicating that the film behaves elastically in this condition,
confined in the contact. In other words, reduction in film thickness
on loading is completely recovered on unloading. Another general feature
is that the dynamic film chickners is on the whole lower than the static
value. This clearly shows that there is little or no viscoas contribution
from the film, that it is a solid and is sheared in the contact. The
reduction in film thickness with load during motion is probably due to
an increased amount of 'smoothing' of the film, the "bul]-dozing" effect
mentioned in the last section.
The trends of film thickness against load (represented by the dotted
lines in these figures) are compared with each other in Figures 29 and 34.
There is certainly some difference between the oils in the average film
thickness produced, but giving a definite order is diffcult since oils
B and D are so close to each other. However it does seem that oil C consistently
qives the thickest films, and oil A qives the tainnest films. This is
probably a reflection of the nature of the alkyl group in the ZDDP, and
- 22 -

will be discussee later.
Figures 30 - 33 differ in that they are for experiments with the
radiused pin, not the bearing-ball. Hlere the same trends are observed
as in the previous figures. The main difference is that the deduced film
thicknesses are about half the values for the corresponding bearing-ball
experiments. The range here is 0.05 Vm - 0.25 lUm, compared with a range
of 0.1 - 0.6 um. It is not clear whether this is a function of the calibration
method with the wear scars, or whether it is a real effect of the radius
of the ball. Further work needs to be done to elucidate this effect.
5.4 Variation of Film Thickness with Temperature
Figures 30 - 33 display results of film thickness against load
obtained at three different, constant temperatures (100'C, 150*C and 200*C).
The variation of film thickness with temperature is not very marked.
Th, re does seem to be an increase as the temperature is raised to 200*C,
and this is seen most clearly in Figure 31. Values at 100'C are either
comparable with those at 150*C, or slightly lower, which would be expected
if polymerisation of the film was temperature dependent.
Figure 35 has collected the film thickness values for the experiments
reported earlier where the temnerature was taken from 20 - 250'C in steps
if 25'C. There is a very noticeable change in the trend at around 180'C,
whe-e the film thickness drops appreciably. In some cases, above 2000C,
the film became disrupted and readings were no longer obtainable. In
one experiment, the film failed at 250*C and resulted in a scuff - the
friction rose sharply and the noise increased as well. This is shown
in Figure 36 for oil A at 1 kg. In this particular case, the film disruption
started at about 175C, and the friction trace was seen to fluctuate as
the film began to break down.
- 23 -

In the cylinder-liner experiments, there is a visually noticeable
difference between the surfaces run at 50*C, and the surfaces run at 150*C
(see Figure 23). This indicates that the ZDDPs have provided a better
protection at this temperature. On going to 200*C in separate experiments,
there does seem to be a slight redu-tion in the effectiveness of the additive.
This certainly ties up with the observations of electrical contact resistance
and friction in these experiments. Figures 37 and 38 show the superimposed
e.c.r., friction and temperature traces for the experiments that produced
the photographs in Figure 23. Very clearly, the average electrical contact
resistance is highest (indicating a thicker and more coherent film) at
150'C. At elher 500C or 200*C, the film quality is noticeably worse.
This is most clearly shown with oil B (Figure 37), wheze there is almost
zero e.c.r. at 50'C, and greatly disrupted at 200*C.
5.5 Shear Properties of the Reaction Films
The results presented indicate that the reaction films formed with
ZDDP in these experiments did not behave in a viscous manner. The behaviour
in the contact is more consistent with a solid polymerised film. Under
sliding conditions, the film behaves plastically - as a solid with a constant
shear strength. This being the case, deductions about the shear strength
should be available from friction force data.
It is assumed that the reaction films have reduced the frequency
of metallic contact to such an extent that the contribution of such asperity
interaction to the total friction force is negligible. Our results of
capacitance measurements show this to be a good assumption. This then
means that the friction force measured is due to the shearing of the film
itself. The second interim report f181 included a sirple calculation
of the shear strength of such a film by dividing the friction force in
- 24 -

I
an experiment by the area of the wear scar - determined by a measurement
of the wear scar diameter on the ball. Repeating and extending this calculation
for the range of additives gives values of shear strength in the range
50 MN/m' to 100 MN/m' (Table 4). The shear strengths of the films seem
to be roughly comparable.
Workers in the field of thin polymeric films on a hard substrate
[29, 30) have suggested a relationship between the measured contact shear
force and a shear strength of the film. It has the form:
Tc = T + apTc 0 p
where T c is the shear strength measured, To is a constant shear strenqth
for the material, a is a constant and p is the contact pressure. It
is not clear that our reaction films behave in this way: there is no
definite evidence for a TO , but there is some indication in our experiments
that the reaccion films behave in this way, but experimental accuracy
at the moment is not enough to dec2de. Modifications to the sensitivity
of friction-force measurement to take this idea further is now being undertaken.
This work was reported to the Leeds Lyon Conference in 1988. A
copy of the paper is given at the end of this section, appendix B, page
A3.
- 25 -

6 DISCUSSION
The apparatus described here has enabled the reaction film thickness
of ZDDP additives incorporated in a base oil to be measured under the
four conditions considered necessary in the introduction namely;
(W) The film formed in a rubbing contact
(11) Realistic surfaces and materials used
(iii) The temperature of the contact known accurately
(iv) Lubrication conditions known, to be boundary with minimal hydrodynamic
component.
These experiments have shown that both temperature and rubbing ar0
necessary for the formation of the reaction films from ZDDP. The second
interim report 118] described how no evidence of any reaction film being
formed away from the wear scar was found. This was demonstrated there
by using x-ray diffraction analybis and looking for the elements in the
adl.tive that were experted to appear in the film (namely Zn, P and S).
The film formed only where tnere was rubbing. Recen infra-red stuiles
of rubbed reaction films confirm this observation [251. Here the important
role of temperature in sustaining the reaction of the additive and promoting
film formation has been shown. Since the contact temperature is known
accurately, conditions under which the film forms have been observed.
It appears that the additives can become active at moderately low tempt atures
(75'C) but that they form the best films in the rec ,n of 150 - 200C.
This reflects the thermal stability of the additives. Above 200C they
decompose, and this hinders the formation of the film.
The implication in practice, and particularly in the piston ring/
cylinder liner contact, is that the ZDDPs act over a large range of temperature.
It is thought that typical liner wall temperatures range from 150 - 250C
(although accurate measurement is absent). At the top of this range,
-26 -
LKok

the 7DDP film is becoming disorientated, and thermal decomposition hinders
the anti-wear activity. It should be noted, of course, that the ZDDP
additive is never used on its own, and the inclusion of other additives
tends to mask the individual contribution [26, 27).
6.1 Film Formation and Wea" teduction
At the onset of rubbin,, there was no reaction film in the contact.
The observed initial 'induction' time when no film activity was detectable
has been reported elsewhere (51, and is probably due to the initial run-in
conditions being too severe to sustain a film. However, the subsequent
rapid film formation leading to a protective film indicates that these
extreme conditions do not last long. It is in the first few minutes that
the degree of solid-solid contact is hic'hest, and when most of the wear
takes place. This was noted when commenting on the variable time experiments
with cast-iron cylinder liners (Figure 24) in the results section. The
wear scars are very similar after 5 minutes and after 2 hours. This observation
has important implications for the running-in procedures in diesel engines.
Clearly not all the wear takes place in the first 5 minutes, and
in the cast-iron experiments it is very evident that asperity interaction
continues even for 2 hours of running. This was detected from observations
of the capacitance signal being shorted-out at many points. As the experiments
proceed, the running-in process continues, and presumably there are significant
changes in the surface topography. These observations are the impetus
for the next stage of the work, looking at the topographical changes during
running in, and the scheme is outlined in the Appendix.
In experiments on the polished-steel specimens as well as on the
cast-iron specimens, the reaction film was found to be highly tolerant
of changes in operating conditions. This is particularly noticeable in
- 27 -

the variable load experiments. A new load-stage often produced a disruption
in the film - evidtnced by a sharp drop in the electrical contact resistance,
corresponding to a sudden increase in asperities interaction. However,
the electrical contact resistance was observed subsequently to rise rapidly
to its high value again indicating rapid film re-formation, and the maintenance
of anti-wear protection. This is also important in running engines, since
conditions in the piston ring contact are seldom steady. The reaction
film quickly responds to changes in the contact conditions.
It has long been held that the major importance of an additive
such as ZDDP is in wear reduction, and only secondarily in friction reduction.
All these experiments have demonstrated this to be the case. The friction
coefficient is a bad indicator for the performance of the additive. Here,
the base oil alone had a friction coefficient of the same size as base
oil + additive, a value around 0.1 in all experiments. The friction ccefficient
remained at this value, even when all metallic contact had ceased.
6.2 Film Properties
We have observed that the main function of the ZDDP is that of
wear reduction. Shearing of the metal surfaces or asperities in the contact
is replaced by shearing of this solid reaction film. Although static
loading tests on the film formed in the contact shows some elastic behaviour
(the film thickness is the same on loading as when unloading), it cannot
be the elastic properties that contribute to wear reduction. The film
is in gross shearing for most of the contact time, it is only 'static'
at the ends of the stroke. It must therefore be t!,e plastic behaviour
of the films that is important in the contact, and the way the film is
bonded to the surfaces that determines its effectiveness as a wear-reducer.
The infra-red studies mentioned earlier (25) indicate that the additive
- 28 -

is strongly bonded to the metal substrate, but that there is a less-strongly
held part of the film that is possibly a polymerised layer.
The reaction films formed in these tests were found to be solids,
remaining in the contact when motion was removed. They behaved elastically
under normal load, and as constant shear strength material under tangential
motion. Their plastic behaviour seems +,o be similar to that of some common
extruded polymers such as PMMA and HDPE. The shear strain rates in these
experiments are high (of the order 106 s-
) and are comparable to the
extrusion process. Further experimentation is needed to investigate the
shear properties of these films.
It was noted that when the film was loaded dynamically, the film
thickness reduced, and also that the film thickness was greater at the
ends of the motion (where the velocity is zero) than at mid-stroke. This
has been attributed to a "bull-dozing" action of the slider, shearing
and pushing the films to the ends of the contact. The slider then rides-
up on these heaps of material.
Film thicknesses in these experiments have been deduced to be in
the range 0.05 Pm - 1.0 J=m. These values of thickness are of the same
order as films formed by elastohydrodynamic lubrication of concentrated
contacts. However, these results have demonstrated that the apparatus
functions in the bot dary lubrication regime, i.e. that there are no viscous
effects. As boundary films, the reaction films are thick, much greater
than a 'traditional' boundary film of a few molecular layers. The evidence
is that there is a polymerised solid in the contact. The film thickness
is qenerally larger than the surface roughness of the wear scars. At
higher loads, the deduced thickness becomes comparable with the roughness.
The film remained effective in wear reduction. This remained the case
when no film thickness values were obtained (i.e. that film thickness
was less than roughness size) with cast-iron liner specimens.
- 29 -

6.3 Effect of Temperature
For the constant temperature of 150'C, it has been observed that
there is a variatioli in the thickness of the reaction film between different
ZDDPs used. The four additives can be ranked roughly in the order C,
(B/D), A of decreasing film thickness at constant load. Looking at the
composition ox ie additives we :ee that this trend is reflected in the
thermal stability and reactivity of the additives.
Oil C contains a secondary alkyl ZDDP which, when compared with
oil A which contains a primary alkyl ZDDP (see Table 1), had a higher
reactivity and a lower thermal stability, From this viewpoint, oil C
would be expected to react at a lower temperature and to produce thicker
films than oil A. This is found to be the case. The placing of oils b
and D in the ranking are not clear from the experiments, and as yet details
of their relative reactivity and thermal stability are not available.
The observation that the nature of the alkyl group affects the thickness
of the reaction film formed has recently been indirectly observed using
surface analysis techniques L281. The authors there indicate that while
the surface composition for different additives is the same (also indicating
a polymerised upper layer on a more tightly held lower layer), the thicknesses
are different for different alkyl groups in the ZDDP. Their results tend
to the same qualitative picture as deduced here.
The difference in film thickness on going from conditions at 100'C to
conditions at 200C has seemed fairly minimal. If anything, there is a
slight increase in the film thickness at 200*C over the value at 150'C or
1000C. This again reflects the reactivity and thermal stability of the
additive. Particularly in the polished steel specimens a marked decrease in
film thickness was observed at 180 - 200C, which corresponds to the temperature
at which the additive begins to decompose. Together with this film thickness
decrease, increased asperity action produces a small increase in wear.
- 30 -

7 CONCLUSIONS
The apparatus described in this report has enabled thickness measurements
of reaction films formed by ZDDP during the running process to be made,
using capacitance.
The apparatus functions under the four conditions considered necessary
in the introduction. Working with these conditions of rubbing contact,
realistic surfaces, known contact temperature and known lubrication regime
some new features of the formation and thickness of reaction films have
been found.
Reaction film thicknesses were deduced to be in the range 0.05 pm -
1.0 pm. These were comparable or greater than the apparent surface roughness
of the wear scars.
These film thicknesses are typical of values in the chi regime.
Films of this size are not formed by hydrodynamic action, but by polymerisation
of the additive on active metal surface produced by rubbing.
Reaction film formation is rapid, taking place in the first few
minutes of sliding. The film is continous across the strke once formed,
and iemains in the contact when motion is stopped. Film thickness is
almost constant across the stroke, being greater at the ends of the stroke
due to a piling-up effect.
The reaction films formed in these experiments were found to be
solids. They behaved elastically under normal load, and as constant shear-
strenght material; under tangential motion. The shear strengths are similar
to common extruded polymers such as PMMA and HDPE.
Reaction film thickness and film quality vary according to the
temperature of the contact. The films protect the surfaces best in the
range 150 - 200'C. The film thickness is affected by the nature of the
alkyl group on the ZDDP. Those with a lower thermal stability and higher
- 31 -

reactivity produce the thicker films.
Once formed, the films show a remarkable tenacity and can rapidly
respond to fluctuations in luad, and hence in contact conditions.
These observations have important implications for the lubrication
of engine parts such as cylinder liner/piston ring and in running-in procedures
in engines. Tny also contribute to our understanding of the role of
reaction films in boundary lubrication.
The next stage of the research will concentrate on the running-in
process using cast-iron cylinder liners. The aim will be to gain a better
understanding of what makes a 'good' run-in surface, and particular attention
will be made to changes in surface topography. The primary aim is to
relate the performance of these test liners to that of the same liners
and additives in full-scale tests (see Appendix).
afag/rmo/7-1
12 08 87 - 32 -

-) - -q
Z- ~~, a a C4 " 0rC- rN ) C4 0I'*
CL N In g . 4 V
C,,
cc x
ILt

R 4.5 mim PIN AT 1500C
~mBASE OIL 0.133 0.497
0.125 0.610
OIL A 0.122 0.1590.135 0.205
OIL B 0.097 0.1160.104 0.137
OIL C 0.101) 0.1550. 108 0.157
OIL D 0.10 3 0.1450.101i 0.109
TABLE .2
COMPARISON OF WEAR SCMl DIMETERS (4, ) ANDFRICTION COEFFICIENTS -'OR THE BASE OIL ALONEAND WITH ADDITIVES

oc
Lq (D
0l 0 o c
W C.,
~. N -C, 0l n c
* 1~ 0
U) coI
L)'Jz 0 C.'
0 0 CC ;
- a, C; o .,oLL LL

R 4.5 mm PIN AT 1500C
Shear strength ofcontact(MPa)
OIL A 41
80
OIL B 54
58
OIL C 58125
OIL D 45113
TABLE_4
SHEAR STRENGTHS OF REACTION FILMS

al
xz
LLjceu
zz-7 L-
w <

FOR CLAMPING SCREWS
CLAMPING PIECE
THERMOCOUPLEINSERTED HEREFOR CONTROLLER
• PTFE SHEETS
FLAT SPECIMEN 10 BA TAPPED HOLEFOR ELECTRICAL
YP WIDE CONNECTION
1/16" GAUGE PLATE ~T EISR. PTFE INSERT
LOCATING PLATE
BOAT
HYPODERMIC TUBE (.090" I.D.)
I L -- -- SILER STEEL INSERT
FIGURE 2
DETAILS OF CLAMPING ARRANGEMENTAND PIN SPECIMEN

IV
FGRE 3L~*
FUREY-LUNN TYPE POrENT-'oMETER

15 mv
0 mV
FIGURE 4
TYPICAL CONTACT RESISTANCE PHOTOFROM OSCILLOSCOPE

mr,m
00
00
-3m
__ _ __ _ __ _
Cu 12r

SHItT INSG
3RI DG E
OUT-OF-BALANCE
SIGNAL
FRICTION
SQUARE WAVE
FIGURE 6
FPICTION AND CAPACITANCE TRACES FROMOSCILLOSCOPE SHOWING SHORTING OFCAPACITANCE DUE TO METAL-METAL CONTACT

FIGURE 7
()TYPICAL BRIDGE OUT-OFEBALANCE SIGNAL
() SIGNAL BALANCED AT MID-STROKE

30
U& lo
w SILICON OXIDE
z
03.0
REACTION FILM
1.0.0.1 0.3 1.0 3.0
FILM THICKNESS g~m
FIGURE 8
CALIBRATION CURVE OF CAPACITANCEAGAINST FILM4 THICKNESS

'.PM.4RJ.J SALL DUTre Y, X50
FIGURiE_9
WORN PROFILE OF A BALL

SPACE FILLED WITrH TUFNOL SPACER PIECEOIL OR AIR
4 .~, SCREENJED
-TERMINALS ONBRIDGE
FIUEio
CAPACITANCE CELL

V50
Ic r
FPICTION, 2'EMPEATURE AND CONTACT RESISTANCERECORD: CONDTIONS CG:VFN

zC.0
0
CD I-
wIL
wFj =1M4
0
U. w
0z
U. wjzi U CC,
o Skz

0.05
150e
5~OS .i I 'P~.~4~, I~ R~Si IPFr4 0t4 c4'rIIkN~
£IGUR: 13

LflcAJ
F~hum.
Ioakp
4%~

IO
700t
WIN Swr rA'M
j.t $

__________ Ii
II - g

ILS
20 5-

1~ 5 v
0 fnv
FIGURE 18
FRICTION AND E.C.R. PICTURE
FROM OSCILLOSCOPE, SHOWING 'HYDRODYNAM1IC' ACTION

5
4 'o ~~&t~L ~ ~LL1tIP4CrG ON STEEL Ft4r
F'IGuRS 19

C6
60 0SN-+ 'I ' L',B Ma/. 1316A VW., %r*iAsc- am STEM fLAT
FIGURE_20

FIGURE 21
BRIDGE SIGNAL 'NULLED' AT ENDS OF STROKE

FIGURE 22
BRIDGE SIGNAL 'NULLED' AT MID-STROKE
SHOWING FILM SHAPE

IDI
q.IF
0~
0 000
0l+u

500 sw +1'/PAR~mox 1.5 500 SN + Ill. PARNOX~b
5 Mims.
RMS ROUGHNESS 1.181u'm RMS ROUGHNESS 1.344m
ZJiS *
RMS ROV&44NESS .656,s RKS, RDUWG44SS 1.436,,m
+liJs
PJiS ROU&HiNESS 1.9". RKS ROUGH4NESS 1.200
UNWORN VALUE. RMS RM&HNf?~ESS L1j
FIGURE-24
CAST IRON WEAR RECORDVARIABLE RUN-IN TIME

OIL A
E 0.8
- 0.4 -
0.2 -
I T I T
0.2 0.4 0.6 0.8
CONTACT LOAD Kg
FIGURE 25
OIL A. VARIATION OF STATIC AND DYNAMIC
FILMA THICKNESS WITH LOAD

OIL BE 0.8 -0 A
Ci)WO .6 - az
0.4
08
0.2 $cub
0.2 0.4 0.6 0.8
CONTACT LOAD Kg
OIL B, VARIATION OF STATIC AND DYNAMICFILM TS ICYKNESS WITH LOAD

OIL C
\ 4L 1500CE 0.8
U) A
u0.6 a
-0.4
0.2 SLby6IsSA~
II I I
0.2 0.4 0.6 0.8
CONTACT LOAD Kg
rIGURE 27
OIL C: VARIATION OF STATIC AND DY'IA IC
FILM THICKNESS WITH LOAD

OIL D0
E 0.8 00
" 0
'0.4 %A A
0.2V
0.2 0.4 0.6 0.8
CONTACT LOAD Kg
FIGURE 28
OIL D: VARIATION OF STATIC AND DYNAMICFILM THICKNESS WITH LOAD

OILC 1500C
E 0.8 -OILB
(f)
0.4
0.2
0.2 0.4 0.6 0.8
CONTACT LOAD Kg
FIGURE-29
COM1PARISON OF FILM THICKN1ESSES BETWEENiTHE OILS - BALL SPECIMENS

loo*C OIL A
0 150 0 C
2 0.4::LA 200.C
U,
(UUJ 0.3z
0.2
U.1 0 A ,_ A A A A A
I .1 I I
0.2 0.4 0.6 0.8
CONTACT LOAD Kg
FIGUPE 30
OIL A: VARIATION OF FILM THICKNESS W1TH LOADRADIUSED SPECIMENS

10000lOIL 2
0 15000
E 0.4.=L 20000
U)(I) ALL 0.3 _
C.)
0.2 AA A
0.10
0 0 0 0 0
0,2 0.4 0.6 0.8
CONTACT LOAD Kg
T IGUR7 31
OIL B: VARIATION OF FILM~ THICKNESS W.IITH LOADRADIUSED S?ECIMENS

OIL C
0.4
A U 0 150-C
CJ) 2000
C
zU 0.3
0.2p
0.1 3 O
0.I. 0.6 0.8
COKTACT LOAD Kg
FLGUaRE_32
OIL C: VARIATION OF FILM THICKNESS WITH LOADRADIUSED SPECIMENS

o3 1000 C OIL D
0 150*c
E 0.4=L 2oO 1c
Cl,Cl,w 0.z
1 0.2
0.1 o 0 13 E3*
0.2 0.4 0.6 0.8
CONTACT LOAD Kg
IGURE 3
OIL D: VARIATION OF FILM THICK(NESS WITH LOADRADILSED SPC1C.ENS

100-2000 C
E0.4=LOILC\
/)0.3 K
z
I-0.2
0.1
0.2 0.4 0.6 0.8
CONTACT LOAD Kg
7IGURE 34
COMPARISON OF FILM THICKNESSES BETWEEN THE OILSRADIUSED SPECIMENS

o OIL A I Kg
o3 OIL B
0.8 OIL C
A OIL D
0.6
S0.4 0 VA7 '
0.2AL ,
40 80 120 160 200 240
TEMPERATURE ~C
FIGURE 35
VARIATION OF FILM THICKNESS WITH TEMPERATURE
AT A CONSTANT LOAD OF 1 KG

........... ...... ..
72KK
* f~iW ffrjofJ 94. U- 26?10~Cr.OM 411ML1M.41
f i G R 3

to
zoo-I
FIGURE 37
CAST IR~ON EXPERIM1ENTS AT D:FFERENT TEMPERATURESOIL A WITH 5 KG LOAD

0.0
050
FZGURZ 3a
CAST IRON EXPERIMENTS AT DIFFERENT TEMCRATURESOIL B WITH 5 KG LOAD

APPENDIX 1
CIRCUIT DIAGRAMS
Friction Force
'A Io
FIlLI
I. 4'a.
Charge amplifier: high impedance amplifier

Friction Force (cont'd)
Voltage amplifier (2-stage)
~OKJA U K SL
10OVi'SL
Rectifier
This circuit was used in preference to a single diode rectifier circuitwhich would not have given a clean rectified signak.
Low pass filter

3 ELECTRICAL CONTACT RESISTANCE
C~rx, I AVu Fin,
Amplifier and buffer
Low pass filter: same as in friction force measurement

REFERENCES
1 KAPSA, Ph, MARTIN, J M, Boundary lubricant films: a review, Trib.Int., 1982, 15, 37-42
2 FUREY, M J, Film formation by an antiwear additive in an automotiveengine, ASLE Trans., 1959, 2, 91-100
3 GEORGES, J M, MARTIN, J M, et al., Mechanism of boundary lubricationwith zinc dithiophosphate, Wear, 1979, 53, 9-34
4 KASTING, G B, The composition of four-ball wear-scar films formedby crankcase lubricants, ASLE Trans., 1985, 28, 351-357
5 FUREY, M J, Metallic contact and friction between sliding surfaces,ASLE Trans., 1961, 4, 1-11
6 FIENNES, W G, ANDERSON, J C, An analysis of voltage discharge measuremntsf in lubrication research, Proc. I. Mech. E., C112/72, 1972, 109-119
7 HIGGINCON, J G, The failure of elastohydrodynamic lubrication,PhD Thesis, Cambridge University, England, 1984
8 SAKAMOTO, T, UETZ, H, FOHL, J, KHOSRAWI, M A, The reaction layerformed on steel by additives based on sulphur and phosphorus compoundsunder conditions of boundary lubrication, Wear, 1982, 77, 139-157
9 COY, R C, QUINN, T F J, An application of electron probe mtcroanalysisand X-ray diffraction to the study of surfaces worn under extremepressure lubrication, Proc. I. Mech. E., 1972, C94, 62-68
10 TONCK, A, MARTIN, J M, KAPSA, Ph, GEORGES, J M, Boundary lubricationwith anti-wear additives: study of interface film formation byelectrical contact resistance, Trib. Int., 1979, 12, 209-212
11 FOWLES. P E, JACKSON, A, MURPHY, W R, Lubricant chemistry in rollingcontact fatigue - the performance and mechanism of one anti-fatigueadditive, ASLE Trans, 1980, 24, 107-118
12 BOWDEN, F P, TABOR, D, The friction and lubrication of solids,in Int. Series of Monographs on Physics, Clarendon Press, Oxford,1986
13 WINER, W 0, in Appendix to CZICHOS, H, BECKER, S, LEXOW, J,Multilaboratory tribotesting: results from the Versailles advancedmaterials and standards programme on wear test methods, Wear, 1987,114, 109-130
14 SNYDER, F L, TEVAARWERK, J L, SCHEY, J A, Effects of oil additiveson lubricant film thickness and traction, SAE Paper No. 840263, 1984
15 JOHNSTON, G, CANN, P M E, SPIKES, H A, A new mechanism of gearand bearing anti-wear additive behaviour. 5th International Collog.'Additives for lubricants and operational fluids'. Esslingen, 1986,Paper 3.12, 1-IG

16 MILLS, T N, CAMERON, A, Basic studies on boundary, EP, and piston-ring lubrication using on special apparatus, ASLE Trans., 1981,25, 117-124
17 ALLISTON-GREINER, A F, CAMERON, A, GREENWOOD, J A, Basic mechanismsof diesel lubrication correlation of bench end engine tests, 1stInterim Report, January 1986
18 ALLISTON-GREINER, A F, CAMERON, A, GREENWOOD, J A, Basic mechanismsof diesel lubrication, correlation of bench and engine tests, 2ndInterim Report, July 1986
19 BAILEY, M W, CAMERON, A, The effects of t'mperature and metal pairson scuffing, ASLE Trans., 1972, 16, 121-131
20 LUNN, B, Epilamen und Mischreibung, ZVDI Berichte, 1957, 20, 41-46
21 HAMILTON, G M, MOORE, S L, The lubrication of piston rings, Proc.I. Mech. E., 1974, 188, 253-268
22 HAMILTON, G M, The hydrodynamics of cam follower, Trib. Irt. 1980,13, 113-119
23 GALVIN, G D, NAYLOR, H, WILSON, A R, The effects of pressure and
temperature on some properties of fluids of importance in elasto-hydrodynamic lubrication, Proc. I. Mech. E., 1963, 178, 283-290
24 DYSON, A, NAYLOR, H, WILSON, A R, The measurement of oil-film thicknessin EHD contacts, Proc. I. Mech. E., 1965, 180, 119-134
25 CANN, P M E, JOHNSTON, G J, SPIKES, H A, The formation of thickfilms by phosphorus-based anti-wear additives, Proc. I. Mech. E.,Tribology - friction, lubrication and wear fifty years on, C208/87,1987, 543-554
26 ROUNDS, F G, Additive interactions and their effect on the performanceof a zinc dialkyldithiophosphate, ASLE Trans., 1977, 21, 91-101
27 BARCROFT, F T, PARK, D, Interactions on heated metal surfaces betweenzinc diathyldithophosphates and other lubricating oil additives,Wear, 1986, 108, 213-234
28 MONTEIL, G, LONCHAMPT, J, ROQUES-CARMES, C, Study of anti-wearproperties of zinc dialkyldithiophosphates through sliding-inducedelectronic emission, Proc. I. Mech. E., Tribology - friction, lubricationand wear - fifty years on, C224/87, 1987, 531-536
29 BRISCOE, B J, SCRUTON, B, WILLIS, F R, The shear strength of thinlubricant films, Proc. Roy. Soc. Lond., 1973, A333, 99-114
30 AMUZU, J K A, BRISCOE, B J, TABOR, D, Fric-ion and shear strengthof polymers, ASLE Trans., 1977, 20, 354-358

K
APPENDIX
A BENCH TESTS
This phase of the work (detailed in Item 5 of the work statement
C-1) can now begin, following the arrival of samples of engine parts and oils.
It is proposed to investigate the running-in process in the various
supplied cylinder liner/piston-ring pairs, together with oils from standard
engine tests. The materials were described in Table 1 below. The aim of
this work is to try and gain a better understanding of what makes a 'good'
surface. This will involve studying not only the run-in surfaces, but also
the unworn surfaces, to see what features appear to make running-in and
lubrication more favourable.
Table 1: Description of parts supplied
It was found (Jan 1991) that the column headed "Engine" should
have read "Engine Test Sequence".
Code Engine Oils (Ref. Nos.)
A Caterpillar O-5 AL-15930-L
B Caterpillar OL-6 AL-15931-L
C Caterpillar 1G2 AL-15932/33/34/35-L
D Cummins NTC-400 AL-13936-L
E John Deere 6404 AL-15937-L
F Mack T-7 AL-15939L
Further details are in Appendix 1 page 23 of Section 2.
1 Experiments at first will be restricted to using cylinder liner/oil
pairs with the reciprocating specimen being a ball, not a segment
of piston-ring. This is for ease of use.
2 A series of tests will be conducted on the running-in of each cylinder
liner/oil pair, along the following lines, depending on experimental
results
- Al -

1
2Run-in for 5 minutes at 150 - 35DOC* and constant load 5 kg.
30120
Conditions of frequency and stroke amplitude will be typical of
previous experiments, i.e. 35 Hz and 10.5 mm. Run-in will proceed
in the series of temperatures until lubricant or surface failure
is observed. This is detected by a rapid rise in the friction
force.
The unworn and run-in surfaces will then be characterised by surface
profilometry. Details about changes in various surface parameters
- especially the mean curvatures of the asperities - will be recorded.
Changes in these parameters can be correlated with observations
of how the surfaces ran-in (e.g. the friction force variations;
the rate of formation of the reaction film; the 'quality' of the
reaction film when formed), as well as to visual, optical and scanning
electron microscopic observation of the run-in surfaces.
3 In the case of liner C (see Table 1), where 4 oils are available,
a matrix of tests can be performed to attempt to 'rank' the oils
in order of 'best performance'. Tnis ranking could be done on
a criterion of the amount of wear that takes place, or possibly
from the point of view of now various surface parameters are affected.
Rankings will be obtained at different temperatures, to see if
the lubricant performance changes according to this working condition.
It is hoped that these experiments and observations will substantially
add to our understanding of exactly what makes a 'good' run-in surface.
*Temperature steps will at first be 25*C but may be increased to 50*C,
depending on the observed sensitivity to temperature. Once more theuncertainty of the interfacial ring/liner temperature in running diesels
makes itself felt.
- A2 -

161
PRESENTED AT THE 1957 LEEDS-LYON SYMPOSIUM
Paper VII()
The rheology of reaction films formed by ZDDP
A.F. Alliston-Greiner, J A. Greenwood and A Cameron
This paper describes experiments performed in a reciprocating ball-on-flat rig operating in theboundary lubrication regime and at contact temperatures up to 250*C. Measurements of contact capaci-tance permitted deductions about the thickness of the reaction films formed in the contact by ZDDPadditives: a typical value was 0.1 Luen, far thicker than a true "boundary film" as normally understood.The shear strength of the reaction films were studied as a function of load, temperature and shearrate. Typical contact conditions were p - 500 MPa and shear rate 106 s-
I. The shear behaviour of the
films weie similar to those of thin films of organic polymers.
1 INTRODUCTION repeating contact device (such as the pistonring/cylinder liner) it is the repetition rate
Zinc dialkyldithiophosphato (ZDDP) is used com- rather than thc pe which is important whenmercially as an anti-wear agent in diesel and considering interaction of surface asperities.aut motive engines. By reacting chemically with The protective film formed by additives is eom-the sliding metal surfaces a polymerised film is pletely or partially removed during each contactthought to be formed which separates the rubbing and mi-t be reformed before the next one: thesurfaces, so reducing wear. In these practical time available for this is crucial. The rate ofapplications the film forms under e.h.l. conds- reformation depends on the chemical activity oftuons, but appears to be additional to the usual the systess (metals and oil) and of course thee.h.l. film as shown by Tevaurwerk et al. (13 temperature - see Bailey and Cameron 373. Testand Spikes ot al. (23, it has many of *he features devices are either high speed (giving large andof a boundary lubricating film as normally under- unknown flash temperatures), with repetitionstood, except that it is far thicker and is rates similar to practical systems, or low speedcorrespondingly more effective in reducing wear. giving repetition rates very much lower. The
If the formation is a simple chemical recrsrocating apparatus therefore provides areaction, then it should be posoible to study it simple device that avoids high flash temperatureswithout the confusing factor of an e.h.l. environ- (since the sliding velocity is low),, but has thement: and in particular to study its formation at correct repetition rate. This means also thatslow speeds where the surface temperatures are the contact temperature can be knnwn with confi-known with confidence. One might go further and dence from the bulk temperature of the testeliminate the rubbing completely - but then the specimens,film does not form. Relative sliding appears to Four commercial ZDDPs were used in this work,be essential for the reaction/polymerisation to and observations of film formation and behaviouroccur. The role of the surfaces in this reaction sere made in the contact itself. Conditionshas been studied recently by Kajdas (33 and of load, temperature and repetition rate wereMonteil 143. similar to those found in an engine.
Little is known about the film formation orabout its behaviour in the contact Itself:particularly it is not known if the film exhibits 2 APPARATUS
hydrodynamic properties. Recent work un France151 has shewn how films could be removed after The rug (see Figure 1) consists of a 6 mm radiusedthey had been formed in a rubbing contact and pin (silver steel, polished and hardened to 450transferred to specially prepared surfaces. A VHN) loaded against a fixed flat (gauge plate,reciprocating ball on flat apparatus wsth a very polished to 0.02 pm c.l.a. and hardened to 750 VH)small amplitude of motion (10 - 30 nm) was used and reciprocated sinusoudally by a 100 W oscil-to study the elastic behaviour of the films. On lator. The standard condutions were 35 Hzthe assumption that the reaction film was poly- frequency and 1 0.5 mm stroke. Lubricant wasmaric in nature, Briscoe et al 163 deposited thin dripped into the contact at 3-5 il/hr. Thelayers of known organic polymers or built-up friction force was measured with a strain gaugeLangmuir-Blodgett type films and measured their transducer which restrained the flat from moving.theological properties. A ball on flat device By blowing hot air into an insulated box surround-was also used but with very low, unidirectional ing the contact, temperatures up to 250*C couldsliding speeds, which were necessarj to avoid be readily obtained.penetration of the film by the ball. Electrically isolating the ball and flat from
I, thin paps wors us described using a the rest 0t the apparatus made it possible toreciprocating ball-on-flat machine operating in monitor not only the contact resistance but alsothe boundary regime of lubrication at elevated the contact capacitance. Using the contact astemperatures (up to 250C). In any practical the 'unknown" reactance in a 4-arm bridge, and

162
LOAD alnost zero to a valie higher than 10 Mn in about30 seconds to 2 minutes of rubbing. In this timethere was usually a small reduction in thefriction force - corresponding to the observedimprovement in the coherence of the reaction film.This was seen from the bridge out-of-balance
HYPODERMIC TUBEC signal in this perIod. When the electrical con-tact resistance was observed to be high over the
MOTION whole stroke, there was still much evidence ofmetallic contact through the film. This wasmanifested by momentary and repeated 'shorting'
'UNKNOWN' of the bridge signal. Howevr, as notion pro-TERMINALS ceeded, these asperity interactions dirininshed
ON BRIDGE until, in most cases, they vanished. Also usthis period, the value of capacitance to null
BALL the bridge signal at mid-stroke fell, indicatingELECTRICAL- | FLAT that the reaetson film rhichnesn increased.
INSULATION Once appreciable asperity interaction had ceased,the film thickness did not alter.
A typical bridge out-of-balance signal andfriction trace, taken from the oscilloscope, is
FIXED shown in Figre 2a. The bridge signal here hasbeen nulled at the ends of the stroke. It isimmediately clear that there is some variation inthe film thickness across the stroke. By nulling
Fig. I: Contac: configuration and measuring the signal and obtaining capacitance values atcircuit
bringing the bridge signal to a null point (dis-played on an oscilloscope) meant that values ofboth capacitance and conductance were obtainable.The rig is described more fully elsewhere (8.
Details of the additives used are givenbelow in Table I, the ZDDPs being distinguishedby the alkyl group on the molecule. Ea~h of thetest oils consisted of a 500 Solvent Neutral baseoil with 1% by weight of the ZDDP indicated.
Alkyl radical
of l.vlP
OIL A n-Butyl- n-Pentyl
OIL B Octyl(a) Upper trace, bridge signal balanced at
OIL C Methyl lso-butyl ends of travel.Carbinyl Lower trace friction force.
OIL D Alkyl Aryl
(C12 or longer)
.16-
Table 1: Details of the additives
3 REACTION FILM FORMATIO, .12 I
In these exiert.nents, the formation of the re- -. 10action films by the ZDDP additives was rapid.Under a typical load of I kg, motion was startedand there was an 'induction time' of 15 - 45 .08seconds in which there was no film activity (asdeduced from the low value of electrical contactresistance). In these first momints of motion a Inigh friction transient was seen, which rapidlysettled down to give a value of around Is - 0.1. MID-STROKE MID-STROKEThis Iniction transient -as associateI 'itL, thc'induction time' during which there was no finacti lty and therefore little protection of the (b) Variation of film thickness in bothrubbing surfaces. directions of sliding.
Subsequent to the induction time tie averageelectrical ccntact resistance rose rapidly from Fig. 2: Film shape in the contact

163
successive intervals, it was possible to obtaina picture of the variation of the fils thickness. OIL 0This is shown in Figure 2b. The capacitance 150°Cvalues at the ends of the travel were always 0.8.lower than at the niddle. ThIs implies that thefilm thickness increased at the ends. This is ran important observation, since the fibs wouldbe expected to be thinner where the velocity is 0.6-zero if it were behaving hydrodynamically.Values Of the file thickness were obtained byreference to a calibration curve for the contact. BThe relationship between capacitance and film 0.4- s 0thickness Is not the straightforward inverseproportionality. This arises since for a point 0 0contact the capacitance is made up not only ofthe contribution from the Hertz flat but also the 0.2"fringe deformed zone around the Hertz area: thissecond term dominates the capacitance. In thiswork there was the added complication of a wornball,, so that the area was no longer Hertz area:hence the need for calibration. This was achieved 0.2 0.4 0.6 0.8by using deposited silicon oxide films of known CONTACT LOAD tGth Ic'nesas a nd dielectric constant, and then re-latng this to the film of dielectric constant
2.3. This Is described by the authors elsewhere[8). Typical values of film thickness for the Fig. 3. Comparison between static (solid symbols)four ZDDPs at 150C and I kg load were in the and dynamc (hollow symbols) film thickness withrange 0.05 pm to 0.2 UmW. load
Usually the frequency of motion was 35 Hz,so the maixmum velscity (at mid-stroke) was about100 mm/s. This meant that the shear rates ex- of the reaction films formed by ZDDP should bepersened by the film were of the order of similar to that of thin iayers of organic polymers106 h-1, but varied sinusoidally across the such as polymethylmethacrylate (PMMA) and highstroke. The contact pressure at 1 kg was about density polyethylene (HDPE). They state that the500 MPa, based on the wear scar diameter c.f. shear strength of the contact, T., increased1000 MPa for Hertz conditions). Hence the film proportionally with the mean hydroitatic pressure,was under conditions of pressure, temperature p. The friction coefficient for the shearingand shear similar to those experienced in running film is then given by:components.
u= -- +a(1)
3.1 Nature of Film p p
In addition to the increase in film thickness at where To and s are constants characteristic ofthe ends of the stroke, it was observed that the the materual being sheared. The existence offriction was independent of shear rate. As seen this two-term law of friction was first suggestedfrom Figure 2a, the ftiction force was a square by Deryaguin et al. 1ll) and theoretical supportwave. If there were viscous or any other rate- has been provided by Sutcliffe et al. 1121. Theydependent properties of the file, this would be explained the two terms as arising from thereflected sn the shape of the friction trace, motion of one layer of molecules ever another.The shear rate varied markedly throughout the The experimental work of Briscoe at al. 16, 93stro'e, but the friction force was constcnt in has caused the two-term friction law to be takenench directIon of slidIng. When the motion was seriously. Briscoe's studies of the shearstopped, the film remaned in the contact and strength cO polyner films used very smooth sur-could withstand a normal loading cycle that faces (usually glass) coated with the chin film.revealed an elastic-type behaviou. This is This was to ensure film penetration was negli-terned 'static' loading as opposed to the gIble. Furthermore in order to avoid destroying'dynamic' tests. A reduction in film thickness the carefully deposited films, the sliding speedson loading %as coepletely recovered on unloading, were low (up to 0.2 m/S) which made the shear
The static film thicknesses tended to be rate around 10 s-l.
This is much lower than irgreater than the corresponding dynamic thick- the exseriments reported here and far lower thannesses at the sane normal load. A typical example those found in practice.Is shows in Figure 3, where the solid symbols are An advantage of the smooth surfaces used bythe static loading values. The results are for oriscoe was that the contact pressure could bea ball of radius 1.2 nm instead of 6 mm. These determned from Hertz theory. In the experimentsobservations lead to the conclusion that the reported here, the film was formed as the resultreaction film %as not behaving in a viscous of a rubbing process. This meant that wear hadmanner, but behaved like a plastic. The evidence taken place, and the contact was no longer asuggests that there was a polynerised layer of ball on flat, but a worn ball. Determining thesome sort which was sheared in the contact, contact area therefore posed a problem, for
which no better solution has been found than toassume that the contact area was simply given by
3.2 Shear Rehavuour the size of the wear scar.
It was earlier noted that there was littleIt has been suggested by other workers such as or no metallic contact once a reaction filmBrIsroc 193 and Fein (103 that the shear behaviour had been formed. Therefore it was assumed

164
that the contribution of such contact to the displayed in Table 2.total frictional resistance was negligible. If The shear strength of the contact was foundthere was a relationship described by equation to be independent of shear rate. This was shown(1) then, without needing to know the area of by three observations. First that the frictioncontact (A), It can be re-written as: foce was a square wave, despite the large vari-
ations in shear rate in the stroke. Second at aF - sOA + oW (2) constant amplitude ( 0.1 sm) the frequency was
changed, and in a range from 20 Hz - 96 Hz thewhere F is the measured friction force and W is friction force was independent of frequency.the normal load. Initial tests induc,ted the This is shown in Figure 5, which also dnsplaysexistence of this To and was reported in the the corresponding variation in the film thickness.abstract. Further studies, however, /er a wide AP the frequency increases, the film thicknessload range (50 g - 2 kg failed to sutatantiate falls (more precisely, the capocitance rises).these results. What was found was that the Third, at a constant frequency (35 Hz) thefriction force was directly propoitional to the amplitude was changed: the friction force didload, i.e. the shear strength was proportional not change and the film thickness decreases wt'to contact pressure. This is shown in Figure 4. increasing amplitude.
100 MID-STROKE VELOCITY mn/s50 100 150 200 250
OIL C I
1.2 LOAD I KG00 l.: oo 000 \ 0OIL C
-0.4,
a 10. *rP o
I..3
F 0. 0 C' 03
C)seeo l.o
S0.2 ,
'm 0.9.
'2lr 0.1Thickness
10 100 1000
PIoAN CONTACT PRESSURE MPa 20 40 60 80FREQUENCY Hz
Fig. 4% Variation of shear strength withcontact presscre
Fig. 5: variation of frict:on force and filmthickness with frequency
Replotting these results on linear axesgives lines that go through zero within experi-mental error. Over the range of experiments Examining the wear scar on the flat bycarried out with the four additives at tempe- optical microscopy after an experiment revealedratures of 100, 150 and 200*C the gradient of the a film in the wear scar and in a region directlylInes were always around 0.1. These results are around it. This film was easily scratched by a
hard scriber as Figure 6 shows. The materialaround the scar, which could be seen more clearlyin an SEM, appeared to be the build-up of worn
TEMPERATURE material that was pushed out of the contact bythe slider. Figure 7 is a photograph taken from
OIL A 0.08 0.13 0.166 the SEM of the region at the ends of the travel,
0.11 0.098 0.093 showing the lumps of film maternal. This observa-tion is confirmed by X-ray analysis of the lumps,
OIL B 0.098 0.167 0.095 they contain Zn, P and S which would be expected
0.05 0.110 0.100 for film material. Areas well away from thescar had only negligibly small traces of these
OIL C 0.094 0.110 0.092 elements.Inside the scar there was evidence of not
only the deformation of the metal surfaces, but
also of film material than itseif hue heaOIL D 0.100 0.099 0.1051. fflth I-fh.I,0.095 0.093 0.106 heavily sheared. This is displayed in the SEM
photograph of Figure 8. The smeared appearance
of the surface, together with the rippled effectTable 2: Values of the gradient, , from plots at the edge of the scratches shows now the filmof friction force against contact soad had been sheared.

165
3.3 Effect of Te.perature
The shear strength was found to be slightlydependent on teerature. This was shown mostclearly for cases where the temperature wasvaried duing a single test. At a load of I kgand starting at room temperature, the temperatureWas raised in steps of 25*C up to 250C. Thevariation in the friction force is shown inFigure 9 for the four additives, and the corres-ending changes in film thichness in Figure 10..hat can b seen is that once a film was formed(and this sometimes occurred at temperatures
0 OIL A 1K1.2 - OIL .
t OIL C
M OIL D
-' --0.- 1
Fig. 6z Optical photograph of the wear scar on 0a flat showing a scriber mark through the surface ' .-
film 1.0
0.8
40 80 120 160 200 240
TEMPERATURE -C
Fig. 9: Variation of friction force withtemperature for the four ZDDPs
Fig. 7: SEM photograph of surface film at the 0 OIL A -' 1 KGend of the wea r scar on a flat 0.4- V OIL B
[ OIL COIL D
0.3.
0
40 80 120 160 200 240
TEMPERATURE *C
tig. t; SEM photograph of surface material in Fig. 10: Variation of film thickness withthe wear scar on a flat temperature for the four ZDDPs

166
louer than 150*C), the shear strength remained apparatus could function at liads low enough tofairly constant. At around 160*C - 180C there make the constant shear tern readily detectable,was a noticeable drop in the shear strength and although readings at these loads were lessthis was accompanied by a drop in the film accurate. It should be noted that Deryaguin 18)thickness. The friction trace became erratic admits the possibility from his experiments thatat temperatures above 200*C, showing that dis- in a certain number of cases in boundary lubri-ruption of the film was taking place This was cation to could be zero.also reflected in the bridge out-of-balance The reaction films in these experimentssignal which showed signs of film penetration were solids (remaining in the contact when -otionby surface asperities, was removed) with plastic-like (strain and utrain-
rate independent, ductile) shear behaviour, withshear strengths proportional to the mean hydro-
4 DISCUSSION static pressure. The constant of proportionalitywas found to be invariably around a - 0.1. This
Observation of the changes in film thickness was a value similar to that obtained by Briscoewith load, speed and temperature lead to the fos HOPE, PTE and polystyrene 16. It seemsconclusion thac the reaction films formed in that the dominant p-operty of the ZDDP film wasthis rubbing contact had no obvious hydrodynamic not its intrinsic shear strength, but that theproperties. The observations that the static shear strength was highly dependent on pressure.film thickness was greater than the dynamic film This determined the coefficient of friction, andthickness at a given loads the film thickness was since no to was detected, then it was found thatreduced for increasing shear rate and the film P u a. This gave values of v at around s - 0,1,was thicker at the enus of the stroke thun at the typical of boundary lubrication.middle shoe this. What appears to be happeningwas that the slider pushed film material beforeit, having smoothed out the surface, producing 5 CONCLUSIONa build-up of worn film material at the ends ofthe stroke. The slider was 'bull-dozing" the The reaction films formed by ZDDP rubbed onfilm into heaps at either end. This was con- steel in these tests were solid: the/ behavedfirmed by optical and SEK examination. The elastically under normal load and as plastic-slider, or ball, then rode up on this material like, strain and stran-rate independent, ductileas its velocity slowed down to the reversal material under tangential motion. Their shearpoint, producing the observed increase in film behaviour was similar to that of thir films ofthickness, organic polymers such as HOPE, polystyrene and
During motion there was a balance between PIPE. Lvidence of a two-term friction te)ation-film formation and film removal. This was ship was not found. React)on film thicknessesreflected in the decrease in film thickness were typically 0.1 vm, far thicker than a true(while still maintaining no asperity contact) bondary film.with increasing frequency. The equilibrium film Perhaps the most interesting conclusionthickness was reduced due to the increase in the of this work is the relation between classicalrepetition rate of the contact. It is the elastohydrodynemsc lubrication using lubricantsrepetition rate that is important in any -epeating containing ZDDP and the reacted film lubricationcontact device. The protective film formd by described here. In many papers on the lubsica-the additives is substantially (or partially in tion of contacts it seems there is scant reals-thus case) removed during each contact and must sation that there are two processes at dorkbe reformed before the next one: it is the time one based on surface chemistry and the otheravailable for this which is impu tant. Arrhenius on continuum mechanics and lubricant properties.states that for a chemical reaction the rate isa function of temperature. Therefore for aconstant temperature the reaction rate is con- 6 ACKNOWLEDGMENTSstunt. If the film removal rate increases thenthe film thickness must decrease accordingly The authors gratefully acknowledge the furdingsince there is loss the for film formation, of the SERC and the US Army Research, DevelopmentThis again ,s reflected in the decrease in film and Standordlsation Group (Uh).thickness and the increase in film penetrationobserved as the temperature was increased. Filmformation appeared to start at a certain tempera- Referencesture, but at the higher temperatures (0 200Cthere was decomposition of both oil and additivc i SYNDER, P L, TEVAARWERK, j L, and SCHEY, J A.leading to film disruption. Effects of oil additives on lubricant film
Since the film was in gross shear and at thickness and traction. SAE Paper No.igh .,hear rates 0 105 S-l) for most of the 840263, 1984contact tume, it cannot be the quasi-elastic 2 CANN, P M E, JOHNSTON, G J, SPIKES, I A.properties of the film, obs4 rved under static The formation of thick films by phosphorus-conditions, that contribute to the lubrication, based anti-wear additives. I.Mech.E. Conf.Since there was no observed asperity contact in 'Tribology-friction, lubrication and wearythese experiments, the friction force must have fifty years on', Paper C208/87, 1987,been due entirely to the shearing of the metal/ 543-554film or film/film interface. Shearing of the 3 KAJDAS, C. On the negative-ion concept ofasperities was replaced by shearing of the EP action of orgcns-sulphur compounds,polymerised reaction film. In comparing the ASLE Trans., 1984, 28, 21-30..oar bchavioui uS the reaction ixIms with 4 MONTJIL, G, LONCHAMPT, J, ROQUES-CARMES, C,that of thin polymer films in other studies, the The study of anti-wear properties of aicsame pressure dependence on shear strenuth was dialtydithiophosphates through sliding-found. However the constant shear ter:n, t0, induced electron:c emission. I.Mech.E. Conf.described by Deryaguin was not in evidence. The *Tribology - friction, lubrication and

167
wear, fifty years on', Paper C224/87, 1987,531-535
5 TOBCK, A, KAPSA, Ph., SABOT, J. Mechanicalbehaviour of tribochemical films under cyclictangential load in a ball-flat contact. RSME
inl. Trib., 1986, 108, 1±7-1226 BRISCOE, B J, SCRUTON, B, WILLIS, F R. The
shear strength of thin lubricant films. Proc.Roy. Soc. Lond., 1973, A333, 99-114
7 BAILEY, M W, CAMERON, A. The effects oftemperature and metal pairs on scuffing.ASLE Trans, 1972, 16, 121-131
8 ALLISTON-GREINER, A F, GREENWOOD, J A,CAMERON, A. Thickness measurements andnechanical properties of reaction filmsforned by ZDDP during running. I.Mech.E.Conf. 'Tribology - friction, lubrication andwear, fifty years on'. Paper C178/87, 1987,565-572
9 RAISCOnc B J, SMITH, A C. The shear propertiesof thin organic films. Revs. DeformationBehav. Matl., 1980, 3, 151-191
10 FEIN, R S, A perspective on boundary lubrica-tion. Ind. Eng. Chem. rundm., 1986, 25,518-524
11 DERYAGUIN, V, KARASSEV, V V, ZAKHAVAEVA, N N,LAZARV, V P. The mechanism of boundarylubrication and he properties of the lubri-cating film. Wear, 1957, 1, 277-290
12 SUTCLIFFE, M J, TAYLOR, S R, CAMERON, A.Molecular asperily theory of boundary friction.Wear, 1978, 51, 181-192

SECTION 2 - The running in process: oil/liner pairs ABDEF
1. ObJect of Section 2
The immediate aim of this section is to investigate the running-in process
and the role of anti-wear additive films, to provide a performance assessment of
the four oils used.
2. SUMMARY
1. A newly designed reciprocating ball-on-flat apparatus is described,
differing from the earlier rig in being able to accommodate sections
from engine liners.
2. The running-in process is examined using four different oils with the
same cast-iron cylinder liner, under different conditions of
temperature and load. Measurements are taken of both surface changes
to the liner and characteristics of the additive film during rubbing.
3. Relationships between film characteristics and surface changes are
investigated and related to oil composition.
4. The four oils are ranked in terms of performance using both film
characteristics and surface changes as measures of performance.
5. After the introduction and experimental de ails, the section divides.
Paragraphs 5 to 9 consider in some detail the performance of liner C
with 4 oils Cl, C2, C3 and C4. Paragraphs 10-13 then report tests on
a mixture of oils and liners. Paragraph 14 discusses all the results.

3-
3. INTROIIUCTION
The First Annual Report [1] Section I examined the formation of reaction
films by commercially available zddp additives. Their thickness was measured by
capacitance during rubbing and their behaviour under varying conditions of load
and temperature studied. A newly designed reciprocating ball-on-flat apparatus
was described. Chart recordings monitored the electrical contact resistance,
friction force and temperature of the rubbing pair while capacitance readings
gave values of film thickness. The wear scar diameter of the steel pin or ball
and also visual observation and rms roughness values of the wear scar on the
'flat' were used as indicators of the degree of wear.
After the start of rubbing, films form in a matter of minutes. This is
indicated by a rise in the electrical contact resistance (e.c.r.) (2] and a small
drop in friction force. The period before film formation is termed the induction
period. The e.c.r. rises rapidly at first but takes some time to stabilise -
about 10 minutes for a polished steel flat but up to an hour for a cast-iron
cylinder liner. This is termed the gradient period. During both induction and
gradient periods capacitance readings are shorted out by asperity contact. After
the gradient period e.c.r. stabilises and capacitance readings are rarely shorted
out. indicating the presence of a thick reaction film that prevents asperity
contact. Film thickness can then be measured. The friction force remains stable
after the small drop at induction time. Fig. I shows a tracing of a typical
chart recording.
Film thickness and film 'quality', as measured by the value and stability of
the e.c.r., both decreased with increasing load and also as temperature rose
above 200°C. Increasing the load once a film has formed results in a sudden drop
in e.c.r., indicating disruption of the film, followed by a quick recovery close
to its original value of e.c.r. The friction coefficient is similar for base oil

Induction
TieGradient Period
ELECTRICAL
CONTACT
RESISTANCE
FRICTION0.
COEFFICIENT 00
0 25 so 75 100TIN4E [MINUTES)
FIG. 1: Typical Chart Recording
Oil C4, Liner C, 5kg, 150-c

-4-
and base oil + I zddp although the degree of wear indicated by wear scar
diameter, visual observation and rms roughness of the flat, all showed
considerable wear reduction for base oil + additive. These indicators of wear
also suggested that most wear occurs in the early minutes of rubLing,
particularly during the induction period.
This report examines the running-in process of a cast-iron cylinder liner
with four different oils over a period of four hours. The unworn and worn line.-
surfaces are characterised by surface profilometry, the main parameters of
interest being the rms roughness and the peak curvatures. Changes in these
parameters are then correlated with how the surface ran-in, particularly the
induction time and the film quality, both determined from the e.c.r. chart
recording. The oils are then ranked in terms of surface changes, induction time
and film quality at different temperatures and loads. Because the majority of
wear occurred during the induction period an attempt is made to compare oil
performance in terms of surface changes at an early stage. Any differences
between the oils in terms of prevention of surface changes during the induction
period could be very significant. This quality of the oil is referred to as its
initial anti-wear activity.

4. EXPERI MNErAL DETAILS
4.1 Reciprocating Rig
T- development of the reciprocating rig first described in [3] has been
detailed in the two interim reports [4] [5] and the First Annual Report [I].
This rig wras ret'aosigned to take segments of cylinder liner as the lower specimen,
t.e essential difference being the nature of the clamping arrangement. Liner
matori'.l was available in " wide rings cut from a new cylinder liner and these
were further cut to produce segments of liner 35" x 3/4". These were of variable
thickness acc')rding to the particular liner being used. The thicknesses could
vary from 1/8" to 35". The reciprocating apparatus therefore, was completely
redesigned and the main features are shown in Figure 2. Th re was no need to
isolate electrically the liner segment iom the rest of the apparatus, since only
the contact resistance was to be monitored during the experiments. This meant
that the liner could be clamped up against the cross-bars and the back face of
'-. hanging system (Figure 2), which provided easy accommodation of specimen size
differences. T" nanging system was suprrted by leaf springs connected to four
upright pillars. Horizontal motion of the hanger was prevented by the
piezo-ele, . ".:ce transducer, which gave readings of the reaction, or friction
force.
The pin specimen clarp was as described in the First Annual Report, made of
'tufnol' to ensure electrical ,,,- 'tion and enable the contact resistance
measurements to be made. A Ling Dynmics 20 Watt shaker was used to drive the
pin specimen over the liner and loads were applied by dead weights, via a yoke
and pulley system. Oil was drip-fed into the contact region through a hypodermic
tube that was incorporated in the pin clamp.
The central part of the rig was 'double glazed' using 'Pyrex' heat-resistant
glass tubes of two different diameters. The tubes had slots cut In them, to fit
over the force-transducer coupling and shaker arm and to allow hot air to be

- -
blown into the rig space for heating purposes. A Pyrex lid that fitted ovel the
top of the tubes had a hole to allow the oil-feed and electrical connection to
the pin specimen to pass through. The heating and temperature controlling
arrangements were as described in the First Annual Report.
Waste oil was channelled from the drip-tray under the specimen clamp, to be
collected in a beaker and a fume extractor was installed directly over the heated
section. The entire rig was manufactured from stainless steel to enable flame
cleaning between oil changes. Other crucial parts, such as the oil feed tube and
thermocouple were readily replaceable. Specimens were cleaned ultrasonically for
10 minutes, first in acetone and then in pentane before assembly in the rig.
Electrical connections were made to the pin specimen and the rest of the
rig, and a resistance switch box as described in the First Annual Report was used
to monitor the contact ,esistance. In these experiments, a resistance 'high' was
usually >105 fl, two decades less than in the previous experiments for reasons
given later. The contact resistance was displayed on a storage oscilloscope,
together with the friction signal from the force transducer. A chart kept a
continuous record of the average electrical contact resistance (ecr) and friction
force as before.
4.2 Materials
The pin specimen is made of silver steel, finished with a 4.5 mm radius,
heat treated at 800C, wattr quenched, then tempered at 450°C for one hour to 550
VHN. The radiused head is then polished with emery paper and lsras:o, a
commercial household liquid cleaner containing a aild abrasive.
The liner specimen is liner C (Caterpillar 102). Surface hardness was 420
VHN, rms roughness 0.9 pm and peak curvature 0.067 -1
Four different oils were used in these experiments, designated oils Cl to
C4. Details are given in Appendix 1, The essential difference between these
oils is the 7ddp concentration, virying from 0% Lu i.4%.
4.3 Surface Analysis
Surfaces were analysed in a profilometer (rerranti 'Surfcom') and the
digitised profile data was processed by a standard computer program to give

bO
41~~~ Ii.~ ~ .
40 0
%n 0 1
01 Nt 0410.
0
'CO
(n 01 j
01 n..-0
0 01
u01 rw1 d)U10L..

-7-
values of rms roughness and peak curvature. Roughness measurements exhibited
considerable variability associated with the manufacturing process. Surface
profiles of the unworn liner indicated at least two distributions of honing
marks, one set being significantly deeper than the other, but with a lower
frequency. The rms roughness varied considerably depending on whether or not
such a deep honing mark was present in the profile trace, particularly for
measurements of the wear scar rms roughness since the length of profile trace
must be less than the length of the wear scar, Imm. Peak curvatures were
calculated by first defining a peak as a point that was higher than its two
nearest neighbours and then fitting a curve through these three points. The data
sampling interval was set at 2pm for all the readings allowing 500 points along
the length of the wear scar. Difficulties in accurately locating the wear scar
after short periods of rubbing led to the dumping of 50 of these points at each
end of the profile trace. The remaining 400 points at the centre of the profile
trace gave more consistent values of peak curvature since they were consistently
located within the wear scar. All values of rms roughness and peak curvatures
are averages of five profile traces taken in small increments across the wear
scar. This attempted to take into account the variations in these parameters
across the wear sar and to iron out any freak readings.
4.4 Friction and e.c.r: Film Activity and Coherence
Friction force and e.c.r. are monitored by a chart recorder. The e.c.r.
record gives values of induction time, the time at which the e.c.r. begins to
rise, and also of film quality. Two measures of film quality are used: '% film
activity' and 'coherence'. Both are estimated by eye from the e.c.r. record, and
reflect the value and stability of the e.c.r. The % film activity is a measure
of film quality from induction time to stop time and is estimated by comparing
the area bounded by the e.c.r. trace on the chart recording with the total area
of the rectangle given by the axes induction time-stop time and o e.c.r. - Co
e.c.r. A film activity of 100% would result when the e.c.r. rose to wo
immediately after the induction time and stayed at this value until the stop

time. The coherence is a measure of film quality after the e.c.r. has stabilised
- i.e. after the gradient period. A coherence of 100% would result when the
e.c.r. stays at - Q from the end of the gradient period to the stop time. The
scale for assessing % coherence is given in Appendix 2.
4.5 Test Conditions
Running-in tests were carried out at 1kg load and 5kg load. The tests at
1kg load were performed at 150°C, 200°C and 250*C, with test duration of I min.,
5 mins., 30 mins., I hour, 2 hours and 4 hours. The tests at 5kg were performed
at 150C and 250°C with test durations of 5 mins., I hour and 4 hours.
Standard test conditions were similar to those of the First Annual Report,
with reciprocation frequency of 35 Hz and amplitude 1 0.5 mm.

-9-
5. 1iE RUNNING-IN PR0SS, Part I
5.1 Surface Changes
Changes in the rms roughness and peak curvature of liner C were investigated
with oils Cl - C4 over a period of four hours of running-in. Film
characteristics - induction time &nd % film activity - were also measured. The
results are summarised in Table I (Ikg load tests) and Table 2 (Skg load tests).
The four oils show similar trends as shown in Figs. 3 - 6 where the surface
changes for each oil are shown under different conditions of load and
temperature. The first five minutes were marked by a significant decrease in
peak curvature and this was followed by a slower fall off for about 40 mins. The
rms roughness decreased more slowly, the largest changes occurring in the first
30 mins. to 1 hour, though under severe conditions it continued to fall between 2
and 4 hours. In general a steady value of each parameter was reached after 2 to
4 hours, indicating the completion of the running-in process.
Oils Cl, C3 and C4, the three oils containing zddp additives (see Appendix
I), show similar trends as experimental conditions vary, particularly their
sensitivity to temperature. For these oils surface changes are minimal at 150'C
and 200*C but become much more severe at 250"C. Oil C2, containing a non-zddp
additive, shows the reverse trend with less surface changes occurring as
temperatures increaz.., 'rom 150C to 250°C. The affect of load on surface changes
is not so clear for any of the oils. In general increasing the load from 1kg to
5kg makes little difference to surface changes unless conditions are sevre
i.e. high temperature for Cl, C3 and C4 or low temperature foe" C2.. Cer'ainly the
ability of an additive film to protect the liner surface under the coneitions
tested is much more dependent on temperature than on load. Considering both rms
roughness and peak curvatures changes from Figs. 3-6, the severity of conditions
can be ranked for each oil.
Cl 250°C > 200°C > 150°C
C2 150"C > 2C0°C > 250"C
C3 250°C > 150 C 200°C
C4 250°C > 150°C > 200°C

so~ Eal r2 E9O E U E Eu~ EO E EQ E .
0 l- E; s0 -.
V1t~~ 10 I D v-
.1 .
m "I_ E' 0 l l f
C'~C* 440 m
9L 0 s 9"6 S0 C, S
r.- r a
-E g 2imW"d IC~) C~ Ifl 0 0) 0 ~ () t ( o~E
-n -z C,
- q 0) -b . _
.-. O~~~ .' .0 .)0 .~ .))40 J 0-r-C 0 . ~ . ..
E ~ E E E~cq W~ 0 q r. r U
r od 0 4s 0 c 0 0 tO -
0 0 0 a 0 .0 0 0 0 400
0 U) 0
El 0) 0 N 0.- ar (

5 MINUTES 1 HOUR 4 HOURS
Cl 0.646 No f.a. 0.894 12 0.581 6
0.0400 0% 0.0370 40% 0.0247 70%
I C2 0.796 No f.a. 0.693 43 0.566 27
5 0 0566 0% 0.0175 0% 0.0441 80%
0
C C3 0.938 3 0.858 4.5 0.851 3
0.0574 5% 0 0605 80%4 0 0406 95%
C4 0.817 No f.a. 0.708 15 0.568 8
0.0625 0% 0.0644 90% 0.0507 90%
Cl 0.760 4.5 0.735 6 0.065 11
0.0401 0% 0.0115 1% 0.0096 5%
C2 0,857 No f.a 1 045 50 0.759 21
2 0.0610 0% 0.0355 0% 0.0469 50%
5
0 C3 0.874 4 0 393 2.5 0.752 5
C 0.0518 3% 0.0279 2% 0.0400 30%
C4 0.822 No f.a 0 570 5 0.428 5.5
0.0409 0% 0.0471 70% 0.0240 50%
* No. f.a. = No Film Activity
DATA PRESENTED IN FOLLOWING FORM:
Roughness [pin] Induction Time [mins]
Average Peak Curvature rm- 1 % Film Activity
TABLE 2: Results from Running-In Experiments at 5kg Load

0.05-0---t
w 0-0
0-02 --
1 2 3 4TIME [HOURS)
1.0-
0-9-
0.85-
-0-7-
Z 1%
w 0.5-
02-
0.1x
1 2 3 4TIME (HOURS)I
C 1509C
o2001C - 1 kg G. 3: Oil Cl, Surface changes
X250-C --- 5kg

0"07
0.06
w 005
CC
D-
0.01
,,> , z-- ....
12 34TIME [HOURS]
1.0- ---
S0.2 -x
0.0E
0o.6 -
w 0.5z
(D 0.40
0.1-
1 2 3 4TIME [HOURS]
ja 150*C
O 200*C - kg FIG. 4: oil C2, Surface Changes
X 2501C ---- 5 kg

0-0
E 0'06---
0-0 -
0
1 2 34TIME (HOURS
0.9 250C -- - k

0-07-
E 0-06-.
w 0-05-
< >
W] 003----
<0-02--
wC 0.01-
12 34
TIME [HOURSI
0-9
x -5-x--- kK:

- 10-
These results confirm the observation that zddp films decompose as
temperatures rise above 200*C. The First Annual Report noted that film thickness
decreased significantly for zddp additive films as temperatures increased from
200*C to 250°C.
Figs. 7-11 compare the performance of the four oils, in terms of preventing
surface changes, at each experimental condition. Considering both parameters of
su. face changes together from Figs. 7-11, the performance of the four oils can be
ranked for each experimental condition.
1kg 150°C Cl, C3, C4 > 02
200°C C3, C4 > C2 > Cl
250CC 02 > C3, C4 > Cl
5kg 150"C C3, C4 > Cl, C2
250"C C2 > C3, C4 > C1
The improvement in performance of oil C2 with temperature is very clear.
Oils C3 and C4 appear to have comparable performance at each condition. They
contain 0.5% zddp and 1.4% zddp respectively. Oil Cl's performance is comparable
with the other zddp oils only at the least severe condition for zddp additive
films - 1 kg 150°C. At higher temperatures and the higher load performance is
poor. This may reflect the very low concentration of zddp in oil Cl, less than
0.1%. This suggests that zddp concentration in oil Cl is too low for good
overall performance and that the higher concentration in oil C4 compared to oil
C3 does not produced improved performance.
5.2 Induction Time
Induction time is the time at which the e.c.r. begins to rise, indicating
the formation of a thick additive film. Table 3 summaries the results of
induction time measurements for the four oils at eacl' different experimental
condition.

0'07 -"I4...
E 0'06 - "
w 0.05k- - "-- - -
R o~o-S0"03 -- .--. ,c
< 002-
0-01
,,1 2 3 4TIME [ HOURS ]
)L
< 09-
w
-u O.571- - - -'
z
2 3
0-J0
0"2
0.1
1 2 3 4TIME [HOURS]
, :.FIG. 7: 1 kg, 1500C. C~mparison of all Oils in terms of
SSurface Changes
-U 0-5

I
0"07 ---.-
S.03C
< 0'02.
LU
0-0
0.01
1 2 3 4TIME [HOURS]
1-0
0.9 - -- S -
0 -8 - C 3
--0.7 CZ2
E --. - -- - -- --- CI
w 05z
o0 -4 -
020.3 -
0.1-
I I1 2 3 4
TIME [HOURS)
FIG. 8: 1 kg, 200*C. Comparison of all Oils in terms of
Surface Changes

0-07
E0-06-~-* 'K
.000-;C,
wC-C
002
12 3 4TIME (HOURSI
0urac Chage

0-07
< 0-02w
L0.01
12 34TIME [HOURS I
1.0-
0 9 C 3
0*6- - -
z
0
02-
0.1
1 2 3 4TIME [HOURS)
FIG. 10: 5 kg, I50Cc. Comparison of all Oils in termsof surface changes

E 0-06
<002-
(L 0-01-
12 34TIME I(HOURS)
0-9
0.8 CC
-0-7-EN
- - 0-6
L.cw 0-5-
1 zTIM [HORS
FIG. 11- g 5C oprsno l isi em
ofSrae0hne

- 1l -
150"C O"C 250"C
- Ja 5-ikg - I kg L 5 k
Cl 7.1 9 5.3 5.4 7.2
C2 13 35 15 18.5 35.5
C3 1.7 3.5 1.8 1.3 3.8
C4 6.8 11.5 3.9 8.8 5.3
Table 3: Inductioa Times [in minutes]
The ranking of the four oils remrains consistent under the different
conditions. although oil C4 shows considerable variability.
Induction time ranking: C2 > Cl, C4 > C3
Increasing temperature appears to reduce slightly the induction time for zddp
oils Cl. C3 and C4, oil C4 showing this most clearly. Conveisely oil C2, the
non-zddp oil, shows a slight increase in induction time as temperature increases.
Increasing load increases the induction time for oils Cl, C2. and C3, especially
oils C2 and C3 where the induction time at 5kg load is double that at lkg load.
However oil C4 shows a reduction in induction time at the higher load. An
increase in induction time with load would be expected since:-
Film formation rate = film reaction rate - film removal rate
Film removal rate will be increased by increased load, delaying film
formation.
The role of induction time in the running-in process was investigated by
comparison with surface changes. The First Annual Report noted that most surface
changes occurred in the first few minutes and concluded that 'most of the wear'
took place during this time. Figs. 3-6 of this report also indicate significant
surface changes during this time, though not necessarily 'most o; the wear'. The
induction time marks the end of this high wear rate period, so it would be
expected to correlate with the surface changes that occur after 5 to 30 minutes
of running-in - the longer the induction time, the greater the surface changes.
Fig. 12 examines the relationship between induction time and peak curvature

- 12 -
changes at I kg load. For Fig 12(a) the peak curvatures at 5 mins. and 30 mins.
are averaged to give values at the averaged time of 17.5 mins, at which time the
differences in induction time may be most evident, differences in film anti-wear
activity being mostly eliminated. Fig. 12(b) looks at the relationship between
final run-in peak curvature (averaged for 2 and 4 hours) and induction time, with
shaded areas representing the induction time values from Fig. 12(a) - this allows
easy comparison between surface changes at induction time and surface changes
once running-in is complete.
Fig. 12(a) shows that differences between the oils are evident after 17.5
mins. of running-in. Oil C's variability of induction time is very clear, but
oils Cl, C2 and C3 are fairly well grouped, and these groupings do follow the
expected trend. Oil C3, with the shortest induction time, shows the least
surface changes at 17.5 mins., while oil C2, with the longest induction time
shows the most. However considering trends within each oil grouping it is clear
that this is not the whole story. Oil C2 shows this particularly, as temperature
rises from 150°C to 250°C induction time lengthens, yet surface changes reduce.
Similarly oil Cl's induction time is relatively constant as temperatures change,
yet surface changes vary considerable. This provides good evidence that the
initial anti-wear activity, during the induction period, is not constant, showing
the same temperature sensitivity trends noted in the oil rankings in terms of
run-in surface changes - namely for oil Cl anti-wear activity is reduced as
temperature increases while for oil C2 it increases (see section 5.1).
Fig. 12(b) compares the oils film anti-wear activity Oil C3 performs well
except at 250C when its additive film is clearly not prozocting the surface
well. Oil C2 demonstrates good film performance, allowing a drop of only about
0.01 Jim- in peak curvature from induction time to run-in time. Oil Cl's
additive film performance is generally not so good, allowing a drop ol about 0.02
-lpim in peak curvature over this period. In general it does seem that the
differences between the oils in terms of surface changes after running-in are
evident already at induction time and that this may be due to differences in
initial anti-wear activity as well as in induction time.

w
w 00 -- \Cg
04 2 (a)w0-
0-01-
f0 5 10 15 20INDUCTION TIME [MINSI
0007
:L0-05- 4
OI -04-I
g C II10 15U 20
INUTONTMs[IS
FI.1:TeEfc fTmeatr nAeaeIdcinTm
and2 Sufc hngs( glodtss
~ (a Pea curaturs ater 7* mns ad avrag
FIG 12:C ih feto epraueo vrgnduction ime

- 13-
Table 4 compares the oils ranking for peak curvature changes at 5 mins with
their ranking after running-in, to examine the differences in initial anti-wear
activity. Data from the 5kg load tests are used since the higher wear rate
results in greater differences after 5 mins. of running-in, and in most cases
delays induction time till after 5 mins., eliminating film anti-wear activity.
Run-in time values of peak curvature are the averages of the I hour and 4 hour
values.
Cl C2 C3 I C4
PK. RANKING PK. RANKING PK. RANKING RANKINGCURVATURE CURV. CURVA. CURVA
1.50"C 5 mins 0,0400 4 0.0566 3 0.0574 2 0.0625 1
Av6O+240 mins 0.0309 - 3 0.0308 = 3 0.0506 2 0.0576 1
250"C 5 mins 0.0401 4 0.0610 1 0.0518 2 0.0409 3
Av6O+240 mins 0.0106 4 0.0412 1 0.0340 3 0.0356 2
Table 4: Comparison of Oil Rankings at 5 gins. and at Run-in Time.
Table 4 gives clear evidence that the major differences between oils in
terms of peak curvature drop at run-in time are the result of differences in the
initial anti-wear activity. The change of ranking of oil C2 with temperature is
particularly clear.
Any effect of differences in induction time upon final surface changes
appears to be minimal compared with the differences in initial anti-wear
activity. Taking surface changes as a measure of wear, and so of performance, it
seems that induction time is not a good characteristic to use for ranking the
performance of these four oils.
5.3 Coherence
Film quality was measured by assessing the value and stability of the e.c.r.
trace, firstly from induction time to stop time - the % film activity - and
secondly after the e.c.r. has stabilised, after the gradient period - the X
coherence. Unlike induction time the gradient period was found to be very

-14-
variable when a test was repeated with the same oil at the same experimental
conditions. This made it impossible to established a fixed % film activity for a
particular oil at a particular condition. However film quality after the
gradient period, measured by % coherence, did give consistent results. Tables 1
and 2 give results of % film activity. The % coherence values are the average of
the % film activity values after 60 mins. of running-in. Appendix 2 gives the
scale of measurement. Table 5 gives % coherence values for the four oils at the
different experimental conditions.
150"C 200"C 250"C
lk- 5k . l1g 5kg
Cl 77 55 65 58 3
C2 75 80 72 87 50
C3 96 87 95 63 16
04 87 90 85 50 60
Table 5: % Coherence
The zddp oils, Cl, C3 and C4, show a reduction in coherence as temperature
rises from 150*C to 250*C while oil C2, the non-zddp oil, shows an increase in
coherence for the 1kg load tests. Load increases do not significantly affect
coherence at 1500C, except for oil Cl, while a similar load increase at 250°C
does reduce coherence. These trends are in broad agreement with the surface
changes trends noted earlier, indicating that coherence may be a good indicator
of performance in terms of prevention of surface changes.
The relationship between coherence and changes in peak curviture is examined
in detail in Figs. 13-18. Figs. 13-15 examine the effect of temperature at
constant load while Figs. 16-18 examine the effect of load at constant
temperature. In each case the first figure (i.e. Figs. 13 and 16) looks at th
relationship between run-in peak curvature and coherence. The second (Figs. 14
and 17) between peak curvature at induction time and coherence, and the third
(Figs. 15 and IS) the relationship between % drop in peak curvature from

0-07-
E0-06-
0.05-
0-04-C
w C 0-03-'
S0-02-4 I kg Woad
'50 60 70 80 90 100% COHERENCE
0-07-
g 006-
0-05-aw
-0 4 - C2 -
C-)
0.02 kg Load
a. 0. 01
20 140 60 80 100% COHERENCE
O150*C FIG. 13: The Effect of Temperature on Coherence
o 200*c and run-in Peak Curvature
XC 250*c

0-07-x ~
006 C3/
E 0060
0-05 Cl
w
CrC
<I- 0-04
Y5 20 0 60 90 T00% COHERENCE
0 0 CFG4 h feto Tmeaueo oeec
o 2O~candPea Crvaureat nc tinTm,E 0-0 C

60-x I kg Load
w 50-
0oCr00 30-
< 20-Ca.
10-
f50 60 70 so 90 100% COHERENCE
70-
60- 5 kg Load
w 50-
<40 c0 a:
U 30 X
w 20-C
10 X
20 40 60 80 100% COHERENCE
13 150-C FIG. 15: The Effect of Temperature on Coherence
o 200*C and % Drop in Peak Curvature from
X 250-C Induction Time to Run-in Time

0-07'-
0.06-c-
0.05-
0:1 0.04-C
0-02-
a- 0-01-
'50 60 70 80 90 100% COHERENCE
0-07-
'E0-06-
w0-05-
z0-03-
S0-02-0~01 -i p250*C
20 40 60 80 100% COHERENCE
1 kg FIG. 16: The Effect of Load on Coherence
and Run-In Peak CurvatureX 5 kg

0-07-
E0-06-L0-05- C2
<004
S0-02- 15000
a- 0-01-
'50 60 70 80 90 100% COHERENCE
0-07-
E0-06- 3C
0-05-
< 1- 0-04 x i
D 0-03-
S0-02- 25000wCL 0-01-
20 40 60 80 100% COHERENCE
FIG. 17: The Effect of Load on Coherence andJ3 1 kg Peak Curvature doL Induction Time
5 5kg

60-150*C
w 50-
0a:>Cr 30-
a. 03C
0 60 7 0 9 0
% COHERENCE
70-
60- 250*c
w 50-
a. >
Y C2_
w 20-a.
10-
20 40 60 80 100% COHERENCE
[3 1 kg FIG. 18: The Effect of Load on Coherence and
X 5 kg %Drop in Peak Curvature from Inducti.on Time
to Run-In Time

- is5-
induction time to run-in time and coherence. In this way any relationship shown
between run-in peak curvature and coherence is split into two components
representing initial anti-wear activity and film anti-wear activity. The peak
curvature at induction time is an estimate based upon the most appropriate values
available. For 1kg load it is the average peak curvature of 5 mins. and 30
mins., giving a value at the averaged time of 17.5 mins., while for the 5kg load
the 5 mins. values for peak curvature are used.
Fig. 13 examines the relationship between run-in peak curvature and
coherence at constant load. The results support the contention that coherence is
a good measure of oil quality in terms of prevention of surface changes - high
coherence is associated with least change in peak curvature. However Table 4
showed that the majority of differences in peak curvatures between oils were
already evident before induction time, so coherence may be associated with
initial anti-wear activity rather than film anti-wear activity.
Fig. 14 examines the relationship between peak curvatures at induction time
and coherence at constant load. The resuit, indicate that there is a correlation
at lkg load, but not at 5kg load. Fig. 15 then looks at the relationship between
% drop in peak curvature from induction time to run-in time and coherence and
this indicates that coherence is associated with film quality - high coherence
giving a smaller % drop in peak curvature. This suggests that coherence is a
measure of both film anti-wear activity and initial anti-wear activity.
Fig. 16 examines the relationship between run-in peak curvature and
coherence at constant temperature. The results indicate a correlation at 150C
but not at 250C. Fig. 16, 250C does show very clearly the rankings of the oils
in terms of both peak curvature and coherence but increasing load reduces
coherence without significantly reducing run-in peak curvature. Fig. 17 shows
that this pattern is established by the induction time with high coherence being
associated with high peak curvature at 150°C but not at 250*C. Fig. 18 shows
that film behaviour is quite different with an association at 250*C but not at
150-C, demonstrating the load tolerance of additive films at 150*C compared with
at 250°C.

- 16-
These results indicate that generally coherence is a good measure of surface
protection, but there are three areas in which no association is found: at 5kg at
induction time (Fig. 14), at 250"C at induction time (Fig. 17) and at 150"C
during film activity (Fig. 18). The first two involve the more severe conditions
during induction time and it may be that a maximum wear rate is reached due to
the constant severe conditions. Fig. 18. d'.,.ing film activity, indicates that
increasing load at 150*C does reduce coher nce without increasing surface
changes. This suggests that the additive film is squashed by the increased load,
and this results in a lower coherence, but is still of sufficient strength to
protect the surface. At 250°C (Fig. 18) the films strengths is reduced by the
higher temperature so that increased load affects both coherence and surface
protection.

- 17 -
6. DISCUSSION
The apparatus described here has enabled differences in oil performance to
be established based upon the degree of surface changes produced during
running-in. The effect of load and temperature on oil performance is also
clearly demonstrated. Measurements of the e.c.r. have been shown to give values
of oil quality that correlate well with oil performance in terms of surface
changes. The importance of the first few minutes of running-in, before film
formation, has been shown and oil anti-wear activity during this period has been
shown to correlate with the additive film anti-wear activity. A correlation of
these results with oil composition has also been attempted. The main object of
this project was to compare the assessment of oil performance in this
experimental rig with assessment in engine tests, but this has not been possible
as the US Army have not produced any engine test data.
6.1 Surface Changes
Peak curvature and rms roughness measurement have indicated differences in
wear severity during running-in. Rms roughness values were found to be less
consistent due to honing variability, so peak curvature changes were used in
determining correlations with oil characteristics. An increase in load from lkg
to 5kg was found to have little effect on surface changes for all the oils.
However temperature had a very significant effect. For oils Cl, C3 and C4,
containing zddp, surface changes were minimal at 150°C and 200"C but become more
severe at 250°C. This agreed with film thickness measurements from the First
Annual Report, thickness decreasing as temperature rose above 2000C. Conversely
oil C2, containing a non-zddp additive, showed less surface changes as
temperature rose from 1500C to 250C.
Rankings in terms of prevention of surface ch-mges were obtained for each
experimental condition. Oils C3 and C4 showed the best performance at 150*C and
200C while oil C2 was the best at 250"C. Oil Cl performed well only at lkg,
150°C, giving the worst performance at the other conditions. The ranking of the

- 18 -
zddp oils, Cl, C3 and C4 seems to be linked to their zddp concentration. Oil Cl
has Z 0.1% zddp, oil C3 z 0.5% zddp and oil C4 z 1.4% zddp. The poor performance
of oil Cl is probably due to a slow film reaction rate, produced by low zddp
concentration, such that any increase in severity of conditions from the optimum
for zddp oils, lkg 150"C, results in a significantly thinner film and loss of
surface protection. However oils C3 and C4 are very similar in their performance
even though oil C4 has considerably more zddp. This is probably due to
differences in the metal detergent inhibitors [7,8]. Oil C1 and C3 have similar
inhibitors ana oil C3, with a higher zddp concentration, shows the fastest
induction time, and better surface protection. If oil C4 had a similar inhibitor
it would be expected to give a faster induction time than oil C3, and better
surface protection. In fact in this case oil C4 would protect the surface too
well and not allow running-in. The inhibitor it does have seems to lengthen the
induction time allowing a significant degree of surface changes in these first
few minutes, allowing running-in to occur. Tests carried out in the First Annual
Report with base oil + 1% zddp with no inhibitor show very fast induction times,
film coherences of 100% and no significant surface changes after 4 hours of
running-in. This indicates the importance of inhibitors in significantly
reducing zddp activity allowing some running-in to occur at high concentration of
zddp.
6.2 Induction Time
The induction time has been found to be a consistent characteristic of an
oil. For the zddp oils Cl, C3 and C4 temperature increases slightly reduce
induction time while for oil 02 induction time is slightly increased at higher
temperature. Load increases from lkg to 5kg tend to increase induction time,
doubling it for oils C2 and C3.
Film formation rate = film reaction rate - film removal rate. The film
reaction rate depends upon both anti-wear additive concentration and
interference/competition between the additive and detergent inhibitor, and it is
the relative importance of the latter that changes with temperature. Load

- 19-
increases increase the film removal rate, delaying induction time until further
running-in has occurred, raducing the severity of contact conditions.
No clear re'ationship was found between induction time and surface changes
after 17.5 mins. of running-in, indicating that the intital anti-wear activity of
the oils might be very different. This was confirmed by comparing surface
changes rankings at 5 mins with run-in surface changes rankings. The results
indicated that the major differences in surface changes after running-in were
produced before induction time, and so by differences in the initial anti-wear
activity of the oils.
These results suggest that induction time is not the best characteristic by
which the performance of an oil should be assessed [9]. However it may still
have great importance in an engine test where the additive film fails and a fast
recovery is essential. This could be established by comparing engine test data
for oils C3 and C4, both of which perform well in terms of protecting the
surface, but they differ markedly in induction time and this may affect their
engine performance.
6.3 Coherence
The coherence, a measure of the value and stability of the e.c.r., was found
to be a consistent characteristic of an oil under fixed conditions. For zddp
oils, Cl, C3 and C4, coherence was generally highest at 150"C and 200"C, becoming
much lower at 250"C, while for oil C2, the non-zddp oil, coherence increases with
temperature from 150"C to 250"C. These trends match the surface changes trends.
However load increases tend to reduce coherence signficantly whereas surface
changes were found to be largely unaffected by load.
Detailed examination of the relationship between coherence and surface
changes showed that at constant load there is a good correlation as temperature
varies and this correlation is evident for surface changes before induction time
as well as surface changes from induction time to run-in time. Coherence appears
to be a good measure of oil quality during both these periods suggesting a

- 20 -
similar anti-wear action both before and after induction time. These results can
be related to the eouation,
Rate of film formation = rate of reaction - rate of film removal
The rate of reaction increases with temperature until thermal degradation
begins at about 200"C and this increases rapidly above 200"C resulting in an
overall decrease in the rate of reaction, and a reduction in mechanical strength,
leading to a reduction in film thickness and consequently greater wear.
Increased load increases the rate of film removal and so reduces film thickness
but at 150*C the mechanical strength of the film is high and this thinning has
little affect on the protecting ability of the film. At 250°C thermal
degradation reduces the film strength and any reduction in film thickness due to
load then results in considerably more wear.
An electronic method of assessing coherence would be valuable. At the
moment it is done by eye which has, obviously, severe limitations.

- 21 -
7. ONLUION
Measurements of surface changes during running-in show significant
difference in the performance of the fo%1r oils. Contact temperature effects
performance considerably, oil C2 improving as temperature rises from 150'C to
250*C while the perfnrmance of oils Cl, C3 and C4 decreases. Load increases from
1kg to 5kg generally have little effect on surface changes. Oil performance
rankings based upon peak curvature changes vary with temperature,
150"C - 200*C C3, C4 > CI, C2
250'C C2 > C4. C3 > Cl
These trends were related to oil composition, oils Cl, C3, and C4 contaning
zddp performing well at the lower temperatures while oil C2, containing a
non-zddp additive performed best at the higher temperature. Higher
concentrations of zddp gave better oil performance but the presence of inhibitors
can reduce zddp anti-wear activity considerably allowing running-in to occur when
otherwise the zddp would protect the surface too well.
From the e.c.r. recording two consistent oil characteristics can be found,
induction time which can be obtained directly and coherence, assessed by eye.
Induction time was not found to be a good measure of oil performance in terms of
surface changes, but did seem related to zddp concentration and inhibitor type in
the same way as surface changes. Higher zddp concentration gives shorter
induction times but inhibitors can significantly lengthen it. Induction time was
only slightly effected by temperature, but increased considerably under load
increases. Oils are ranked: C3 < Cl, C4 < C2 by induction times.
Coherence is a good measure of oil quality, correlating well with surface
changes both before and after induction time. This suggests that anti-wear
activity before induction time is essentially similar to anti-wear activity after
the additive film has formed. This is confirmed by the observation that the
major differences in surface changes after running-in occur before induction
time.

- 22 -
The temperature trends for surface changes and coherence for the zddp oils
matches the trends for film thickness reported in. the First Annual Report.
Unfortunately, the wear performance of tiese oils in ,ctual engine tests is
not known. Data from single-cylinder tests designed to assess the oils in terms
of their tendency to form undesirable piston deposits show that oils C3 and C4
failed, suggesting that oils that form a thicker and more effective anti-wear film
were the ones that also produced more deposits.
Table 6 summarises the rankings of the oils in terms of induction time,
coherence and peak curvature changes before and after induction time. Only
comparison with engine test data can determine the relative importance of
induction time rankings and surface r ianges rankings.

(0~ (0(D
C ~ ~~ c1V IQ N O C' -1 ,c 1. ,
E- 0 m I a
V_ _ 4 ) a. 0. NO
= 0 *0.'or 0 94 L
0) w v ~ m Nq m 0 0 0
v 0
- 1 f ) 00 t- 0)0
v (D 01000 v m2
C~ (0 (--0 ~'0) 10 0
M M M VN l-(0 co C 0

-23-
APPENDIX I
Oil Details
OIL BASE OIL ZDDP METAL DETERGENT TEST
' IHIIBITOR PERFORMANCE
Cl Mineral Oil <0.1% primary calcium suphonate Passalkyl
C2 Mineral Oil no zddp calcium suphonate Passunidentifiedphosphorusanti-wear agent
C3 Mineral Oil 0.5% primary barium suphonate Failalkyl(a mixtureof Paranox 15and 16)
C4 Mineral Oil 1.4% primary calcium/magnesium Failalkyl(a mixture nitrogen-typeof Paranox 15and 16)
It was found (January 1991) the list of engine specimens should have
been headed "Engine Test Methods" and not simply "Engines".
A new list can now be made. In it the first column gives the label as
supplied (A,B,C.... ). The next is the official name of the oil, where known
[REO is short for R'-ference Engine Oil]. Then come the test sequence and its
purpose and the engine used in the test.
OIL TEST PURPOSE OF TEST ENGINE
A, REO 212 OL5 Piston Deposit Control Cat 3406 400HP
B, " OL6 Sump oil degradation "
C, IG2 Deposit control Cat 1 Y73
D, REO 217/86 Crown land deposit Cummins NTC 400and cylinder wear
E, REO 217 6404 300 hours. Wear John Deere 6404
F, REO 212/84 Mack T7 Soot. Wear not noted Mack EM6. 285HP

-24-
APPENDIX 2
HER ~I MEASUROM SCALE
% COHERENCE ECR TRACE
100%
99%
97%
95%
80%
70A
50=

-25-
9. REFERE(CES
1. ALLISTON--REINER, A.F., CAMERON, A., GREENWOOD., J.A., Basic mechanisms of
diesel lubrication, correlation of bench and engine tests. 1st Annual
Report, August, 1987.
2. FUREY, M.J., Metallic contact and friction between sliding surfaces. ASLE
Trans. 1961, 4 , 1-11.
3. MILLS, T.N., CAMERON, A., Basic studies on boundary, EP, and piston-ring
lubrication using a special apparatus. ASLE trans. 1981, 2_5 117-124
4. ALLISTON-GREINER, A.F., CAMERON, A., GREENWOOD, J.A. Basic mechanisms of
diesel lubrication, correlation of bench and engine tests. 1st Interim
Report, January 1986.
5. ALLISTON-GREINER, A.F. CAMERON, A., GREENWOOD, J.A., Basic mechanisms of
diesel lubrication, correlation of bench and engine tests 2nd Interim
Report,July 1986.
6. LUNN, B, Epilamen and Mischreibung, ZVDI Berichte, 1957, 20. 41-46.
7. ROUNDS, F.G., Additive iiteractions and their effect on the performance of a
zinc dialkyldithiophosphate. ASLE trans. 1977, 21. 91-101.
8. SPIKES, H.A., CAMERON, A., Additive interference in dibenzyldisuphide
extreme pressure lubrication. ASLE trans. 1974, 17. 283-289.
9. MARTIN, J.M., GEORGES, J.N., MEILLE, G., Boundary lubrication with
dithlophosphates: influence of lubrication on wear of the friction interface
steel/cast-iron. Wear of Materials, Glaesser, W.A. and Ludema, K.C. eds.,
1977, 289-297.

THE RUNNING-IN PRO : Part 2
i
10 Introduction
Running-in experiments were repeated with oil/liner pairs ABDEF following
the same experimental design as with liner C. The same test rig was used, test
conditions were 150'. 1kg, 150*C, 5kg, 250"C, lkg, 250°C, 5kg, and test durations
were of 5 minutes, I hour and 4 hours. Surface analysis and measurements of film
characteristics were as before.
Liner characteristics varied considerably in terms of hardness,
rms.roughness and peak curvature. Details are given in composition; this is also
summarised in the Appendix. Running-in tests were divided into two groups:
fixed pairings and mixed pairings. The fixed pairing tests used each liner with
its appropriately matched oil, eg. liner A with oil A, and the aim of these tests
was to examine the performance of each pair and to compare them. The mixed
pairing tests used different combinations of liner and oil at the fixed
conditions of 150°C. lkg. These tests attempted to separate performance
differences due to liner surfaces from differences due to oil composition.
11 Fixed oil/liner pairs
11.1 Surface changes
Changes in the rms.roughness and peak curvature of each liner were
investigated with the appropriate paired oil over a period of four hours of
running-in. Film characteristics, induction time and coherence, were also
measured. The results are summarised in Tables 7 and 8. Surface changes for the
five oil/liner pairs show similar trends as indicated in Figs. 19-23 where
surface changes are shown under different conditions of load and temperature. At
150°C surface changes were minimal but became much more severe at 250°C . Load
increases had less significant effect, though generally the 5kg load tests do
show slightly greater surface changes than the lkg load tests. These results
confirm those from the running-in tests with liner C where 3 ZDDP oils, oils Cl,
C3 and 04. showed similar behaviour. Fig. 21 shows that oil/liner pair D
undergoes very severe surface changes under all test conditions, presumably due
to the softness of the liner D(VHN 200).

TIM [HOURS
LJ0.95
x-u 007
C0)
002-
001-
1 2 341TIME (HOURS
* 10 - 1g
)(0---5g Fga:Sraecags i/ie arA

>007
TEM [HOUS-
0-04-
W D0.0 -1-'
12 34TIME (HOURSI
* 1 0 -1k
0..o9uraecageol-ne arB
X 0.8- 5

0-07-
E0-06-
wj 0-05-
0.04
w : 0.03L)
< 0-02-w
0.01 ~ - - - - - - - - -
12 34TIME [ HOURS I
1-0-
0.9-
0-8
- 0-E- 0-6
w ~0-5-zr
00/
12 3 4
TIME (HOURS]
) 50C --- kg Fg.21:surface changes, oil/liner pair D.

0-07-
E 0-06-
w 0-05 -
w~~ =-00
w 003-=
-.~0-02----
0.01
2 34TIME [ HOURS]I
09 7
E
w 0-65-z
00.4
01
1 2 3 4TIME (HOURS]
150*C -1kg
x250*C -- -5kg Fig.22:Surface changes, oi1/liner pair E.

0-07-
E 0-06-
w O*05-
Wi.> 0,04-0: - -. - -
-..-
w0.01
12 3 4TIME [HOURS]
1.0-
0.9
0.8
w 0.57E
C!)
~0.3-
~0*352- -x
0.1-
12 3 4
TIME [HOURS
150* lkg F-19.23: surface changes, oil/liner pair F.
X 250'C -- 5kg

Considering both rms.roughness and peak curvature changes from Fig.s 19-23
the severity of conditions can be ranked for all pairs: 150°C. lkg<150*C,
5kg<250"C, 5kg.
Figs 24-27 compare the performance of the five oil/liner pairs, in terms of
prevention of surface changes, at each experimental condition. These figures
clearly show the severity of conditions ranking indicated above, but due to
differences in initial surface parameters of the five liners, a performance
ranking of the five pairs cannot be directly obtained. The effect of liner
hardness may be indicated in the performance of liners D and A. Pair D, with the
softest liner (VHN 200) always performs poorly, as noted above.
5 MINUTES 1 HOUR 4 HOURS
A 0.803 no fa* 0.774 25 0.774 250.0677 0% 0.0518 70% 0.0554 95%
B 0.941 no fa* 0.707 19 0.537 100.593 0% 0.0536 80% 0.0474 95%
150"C D 0.179 3 0.290 3 0.075 21 0.0116 0% 0.0133 90% 0.0115 80%
E 0.352 0.5 0.507 0.5 0.382 0.50.0474 0 0.0453 98% 0.0445 97%
F 0.750 2 0.686 2.5 0.60.9 10.0326 0% 0.0306 97% 0.0282 97%
A 0.846 no fa* 0.465 6 0.340 9
1 0.0499 0% 0.0213 60% 0.0180 95%
B 0.883 4 0.629 3 0.365 60.0458 0% 0.0377 80% 0.0141 80%
D 0.287 2 0.147 1 0.085 6250*C 0.317 0% 0.0139 80% 0.0123 75%
E 0.460 0.5% 0.287 1 0.254 10.0436 0% 0.0233 90% 0.0224 85%
F 0.454 1.5 0.681 2 0.178 11 0.0338 0% 0.0252 98% 0.0119 80%
* no fa = no film activity
Data presented in the following form:
rms.roughness (tm) 1 induction time (mins.)
peak curvature (M- % coherence
Table 7: Results of running-in tests with liners ABDEF and paired oils at lkg
lod.

0-07
r= 006.
9004
00
4 0.02
L0-01 ____________
0*12 34
TiME HOURS
0.9
- 07 F
E
0.
00.4
~03
02
0.1
TIME [HOURS)
Fg.24 Surface hanlges at 150 ,lkg al 01 1 /1ner
pars

0-07-
wj 005
D003-
<002-
w
12 34TIME (HOURS]
1.0-
0.9F -
0.- 07
E F106
zE
~0.3F
0 -
1 2 3 4
TIME LHOURS]
Fig.25: Surface changes at 15O*C,5kg *all oil/liner pairs

0-07-
E 006-V
(IL O.OL.r\
>0
o~ - D
12 4TIME (HOURS]I
0-8-
0.6
V)
0 A
01 2F
TIME [HOURS)
FIg. 26:Surface changes at 25O*Ckg ail oil/liner pairs

0-07-V
E 0-06-
w 0.05
w 0.04-0 __________
w 0.03 E
< 0-02-w A
1 2 34iIME (HOURSI
'-0-
0-9-
0-8-
E0.6
0U) 0 - -
0 - -
024
TIME [HOURS]
Fig. 27.Surface change-s at 250*C.5kg .all oil/liner pairs

5 MINUTES 1 HOUR 4 HOURS
A 0.690 no fa* 0.806 13 0.804 80.0469 0% 0.0583 60% 0.0460 70%
B 0.504 no fa 0.718 14 0.556 !3
0.0466 0% 0.0620 70% 0.0283 60%
1501C D 0.080 no fa 0.143 1.5 0.092 1110 0.0085 0% 0.0109 90% 0.0102 25%
E 0.697 1.5 0.296 5 0.452 10.0427 0% 0.0382 90% 0.0208 75%
F 0.735 3.5 0.632 4 0.620 40.0306 0% 0.0394 85% 0.0352 90%
A 0.731 no fa 0.436 - 0.093 200.0360 0% 0.0196 - 0.0104 50%
B 0.659 no fa 0.474 - 0.093 200.0317 0% 0.0283 85% 0.0108 50%
250*C D 0.081 no fa 0.087 6.5 0.079 60.0096 0% 0.0110 30% 0.0115 20%
E 0.575 3 0.387 - 0.037 4
0.0395 0% 0.0310 - 0.0117 20%
F 0 617 2 0.357 4 0.149 3.5
0.0263 0% 0.0326 40% 0.0117 75%
* no a = no film activity
Data presented in the following form:
rms.roughness (p)_ 1 induction time (mins.)
peak curvature (pm % coherence
Table 8: Results of running-tests with liners ABDEF and paired oils at 5kg
load.
Liner A is the next softest liner (VHN 390) but initially has the greatest peak
curvature and rms. roughness, and so might be expected to show a greater degree
of surface changes as conditions become more extreme. This does appear to be the
case: at 150C line A still has the greatest values of peak curvature and
rms.roughness after running-in while at 250°C surface changes are more severe for
liner A than for liner B (VHN 450) and liner B has the greatest values of surface
parameters after running-in.

Table 9 shows the X drop in peak curvature for each oil/liner pair over the
four hour running-in period at each experimental condition. Pair D is omitted
since wear is severe at all conditions.
150"C, 1 I 150"C, 5kg 250-C. lkg 250"C. 51g
A 26.0 38.5 75.9 86.1B 35.1 61.3 80.7 85.2E 25.3 65.1 62.4 80.4F 31.4 14.3 71.1 71.5
Table 9: Total % drop in peak curvature during running-in
The values indicated in Table 9 suggest the following performance ranking
for the five pairs:
150"C, Ikg:, E>A>F>B>D
150"C, 5kg: F>A>B>E>D
250°C, Ikg: E>F>A>B>D
250"C, bkg: F>E>B>A>D
On this basis pair E shows the best performance at lkg load, pair F at 5kg.
Pair A performs well at 150°C but less well at 250°C. In general performance
ranking is:
F2E>A>B>D
To compare surface changes before induction time with those after induction
time, Table 10 shows the % drop in peak curvature during the first five minutes
and the % drop in peak curvature from five minutes to four hours. Pair D is
again omitted.

% drop in peak curvature 0-5 mins.
150C, lkg SOC, 5k 250C, lkg 250-C, 5kg
A 9.5 37.3 33.3 51.9
B 18.8 36.2 37.3 56.6
E 20.5 28.4 26.8 33.7
F 20.7 25.5 17.8 36.0drop Inak curvature 5-240 mins
is'c. 1kz 150C., 5kg 250-C. 1kg 2EO'C, 5kg
A 18.2 1.9 63.9 71.1
B 20.1 39.3 69.2 65.9
E 6.1 51.3 48.6 70.4
F 13.5 -15.0 64.8 ,55.5
Table 10: X drop in peak curvature before and after induction time
Firstly we can see differences in how initial anit-wear activity and film
anti-wear activity are effected by changing conditions. Initial anti-wear
activity, as indicated by the % drop in peak curvature in the firs five minutes,
is similar at 150*C, 5kg and 250*C. 1kg, approximately midway between the least
severe condition, 150°C, lkg, and the most severe condition, 250"C, 5kg. Film
anti-wear activity, as indicated by the % drop in peak curvature from five
minu~es to fou- hours, is mainly affected by temperature with performance at
150C, 5kg being similar to that at 150C, 1kg, and 250C, lkg performance
similar to that at 250"C, 5kg. Table 10 also indicates similar initial anti-wear
activities for pairs A and B and also for pairs E and F. This may be due to
similarities in the initial surface parameters: liners A and B have similar high
values of rms.roughness and peak curvature compared to those of liners E and F
(see Appendix 1).
11.2 Induction time
Table II shows average induction times for the five oil/liner pairs under
different experimental conditions. The ranking of the induction times is also
shown.

150*C 250 C_Ikg Iranking 5kg ranking I ranking 5kg raI
A 25 5 10.5 4 7.5 5 20 5B 14.5 4 13.5 5 4.3 4 9 4D 2.7 3 6.3 3 3.0 3 6.3 3E 0.5 1 2.5 1 0.8 1 3.5 2F 1.8 2 3.8 2 1.5 2 3.2 1
Table 11: Average induction times (minutes)
Pairs D, E and F show the trends expected from the results of running-in
tests with oils Cl to C4 and liner C, namely that temperature doe-s not
significantly affect induction time while increasing the load from lkg to 5kg
doubles the induction time. Pairs A and B do not show such clear trends but do
suggest a faster induction time at the higher temperature.
The ranking of induction times seem fairly consistent across the different
experimental conditions; in terms of fastest induction time: E>F>D>B>A
Pairs A and B are similar in having long induction times while pairs E and F
have short induction times. This may be due to the differences noted above in
the initial surface parameters:, liners A and B with greater wlues of
rms.roughness and peak curvature may need more running-in before the thick ZDDP
film can build.
11.3 Coherence
Table 12 shows average % coherence values for the five oil/liner pairs at
different experimental conditions.
150 *C. 1kg 150 'C, 5kg 250 *C, lkg 250 *C. 5kg
A 95 70 95 50
B 95 60 80 50
D 80 25 75 20
E 97 75 85 20
F 97 90 80 75
Table 12: Average X coherence

The experimental conditions can be ranked in -ms of severity, the more
severe the conditions the lower the coherence:
150C, lkg<250*C, lkg<150"C.5kg(250"C. 5kg
This ranking does not match that of surface changes noted in Table 9 where
150*C.5kg is less sever,_ than 250°C, lkg. This ranking is however shown in Table
10 for % drop in peak curvature in the first five minutes, suggesting a link
between film coherence and initial anti-wear activity.
Pair D gives the lowest values of coherence throughout, presumably due to
the high wear rate resulting from the softness of liner D. Pair F gives the
highest coherence at the 5kg load conditions, agreeing with the % drop in peak
curvature data in tables 9 and 10 where pair F shows least surface changes of all
pairs at high load. The relationship between coherence and changes in peak
curvature is examined in detail in Figs. 28-31, Figs. 10 and 19 showing the
relationship between peak curvature at five minutes and coherence and Figs. 30
and 31 the relationship between % drop in peak curvature from five minutes to
four hours and coherence. This attempts to show any relationship between firstly
initial anti-wear activity and coherence (Figs. 28 and 29) and secondl'[ film
anti-wear activity and coherence (Fig.s 30 and 31). Pair D has been omitted as
peak curvatures drop to their run-in values almost immediately even at the least
severe conditions.
The trends are similar for all oil/liner pairs. Figs. 28 and 29 show that a
constant temperature load increases reduces both coherence and peak curvature at
five minutes. It is also clear that at constant load the higher temperature
reduces coherence and peak curvature at five minutes. This clearly indicates a
correlation between initial anti-wear activity and the coherence of the ZDDP film
formed after induction time. Figs. 30 and 31 show that at constant load the
higher temperature both reduces coherence and increases the % drop in peak
curvature from five minutes to four hours. This indicates a correlation between
coherence and film anti-wear activity. However at constant temperature load
increases reduce coherence without necessarily a corresponding increase in Z drop
in peak curvature, eg. Fig. 31 pair F.

0"07
'E 0.06
0O05-
0.04 -
S0,03
: 0.02wa- OIL/LINER A
I I II
20 40 60 80 100% COHERENCE
0.07
E 0.06
u 0.05x -
-R~ 00. -.- "
S003003
x 0.02w 0.01 OIL/LINER Ba.0.01-
20 40 60 80 100% COHERENCE
* !kg -50'C Fig. 28: Coherence and puak curvatureafter 5 mins. of running-2n.
X 5kg --- 250"C

0-07
E 006-
w0-05-
5 003-
S0-02-QW0.1 OIL/LINER E
20 4060 80 100f % COHERENCE
0-07-
0.06-
w 0-05-
% COERNC
0 DK 5C Fg 9 oeeneadpa uvtrafe P m0.,ofrun4g-n
XC k 250
4w

_XX
60 \ OIL/LINER A
w 50 -
z -
10-
50 60 70 80 90 100% COHERENCE
x
60 \\
KD.0 0- \
0 M0 7 0 9 0
60 -)
w5rm30
20 OIL/LINER B
a-10-
V I I I I L
50 60 70 80 90 100% COHERENCE
* 150,C -Ikg Fig .30 : Coherence and % drop in peak
X 250C ---5kg curvature from 5 - 240 mins.

70 -
60-
w 50-
<40-
a. OIL/LINER E
10 1
20 40 60 80 100% COHERENCE
x
60-x
w 50-
-40-0 0:Cr:D30-
<20-W OIL/LINER Fa.
10
50 60 70 80 90 100% COHERENCE
*150'C 1lkg Fig.31: coherence and %6 drop in peak
X 250-C -- 5kg curvature from 5 - 240 mins.

11.4 Summary
Table 13 surmarises the rankings of oil/liner pairs ABEF in terms of best
performance for induction time, % coherence, initial anti-wear activity (% drop
in peak curvature in the first five minutes) and film anti-wear activity (% drop
in peak curvature from five minutes to four hours).
150 C,lkg 150 C, 5kg 250 C, 1kg 250 C,Skg4 =3 3 3 4 1 4 =2
A 1 3 =3 =1 3 =2 3 =3
3 =3 4 4 3 =3 3 =2B 2 4 =3 3 4 4 4 2
1 =1 1 2 1 2 2 4E =3 1 2 4 2 1 1 =3
2 =1 2 1 2 =3 1 1F
=3 2 1 =1 1 =2 2 1
KEY: Induction time. % coherence
X drop in Pk.C % drop in Pk. C
0-5 mins. 5-240 mixis.
Table 13 Summary of rankings in terms of best performance
On these criteria pairs E and F perform better than pairs A and B. This may
well be due to liners E and F having low initial values of rms.roughness and peak
curvature. The good performance of pair F at 5kg may well result from the low
initial peak curvature of liner F, allowing the higher load to be more evenly
spread across the asperities.

12 MIXED OIL/LINER PAIRS
12.1 Surface Changes
Changes in the rms.roughness and peak curvature of liners ABCDEF were
investigated over a period of four hours of running-in, using a variety of oils
with each liner. Liners A and C were run-in with each of the five oils. ABDEF,
liner A with a high value of initial rms.roughness and peak curvature, liner C
with lower values. The results for liner C could then be compared with the
previous running-in data for liner C with oils Cl, C2, C3 and C4. Oils A and D
were tested on all liners, oil A with the longest induction time, oil D with a
much shorter induction time. By comparing the performance of liner A with liner
C and oil A with oil D it was hoped that differences in performance due to
initial liner surface parameters could be distinguished from differences due to
oil composition. Standard experimental conditions were fixed at 150C, 1kg load.
Tables 14 and 15 sunmarise the running-in data for all oil/liner
combinations tested. Figs. 32-37 show the changes in surface param.ters during
running-in for each of the six liners, comparing the performance of all oils
tested on each liner. The performance ranking of oils in terms of prevention of
surface changes is given as follows:
Liner A: ABEF > D
Liner B: A > D > B
Liner C: AB > DEF
Liner D: A > D
Liner E: A > E > D
Liner F: ADF
A general oil performance ranking does seem evident:
A B > EF D
1ft

OIL LINER 5 MINUTES I HOUR 4 HOURS
A A 0.803 No F.A.* 0.0774 25 0.774 250.0677 0% 0.0518 70X 0.0554 95%
B 0.973 No F.A. 0.992 14 0.996 140.0621 0% 0.0677 85% 0.0657 85%
C 0.738 No F.A. 0.937 12 0.793 170.0666 0% 0.0643 90% 0.0608 95%
D 0.500 2 0.258 1.5 0.174 2.50.0425 0% 0.0253 80% 0.0217 85%
E 0.558 2.5 0.659 3 0.575 20.0521 0% 0.0546 97% 0.0455 99%
F 0.659 5 0.534 3.5 0.517 31 0.0372 0% 0.0308 98% 0.0276 97%
A 0.776 No F.A. 0.940 15 0.783 4B 0.0611 0% 0.0600 0% 0.0571 95%
B 0.941 No F.A. 0.707 19 0.537 100.0593 0% 9.0536 80% 0.0474 95%
C 0.606 No F.A. 0.780 6 0.581 6___0.0599 0% 0.0595 98% 0.0583 9(;%
* No F.A. = no film activity
DATA PRESENTED IN FOLLOWING FORM:
rms.roughness (pm) induction time (mins.)
peak curvature (pz-1)
% coherence
Table 14: Results of running-in tests at 150'C. "'g, for oils A and B with
various lines

OIL LINER 5 MINUTES 1 HOUR 4 HOURS
A 0.931 2 0.755 2 0.552 2D 0.0590 0% 0.0545 100% 0.0424 98%
B 0.999 2 0.722 2 0.685 20.0590 0% 0.0587 96% 0.0497 97%
C 0.572 1 0.604 1.5 0.620 10.0614 0% 0.0555 99% 0.0466 95%
D 0.179 3 0.290 3 0.075 20.0116 0% 0.0133 90% 0.0115 80%
E 0.654 0.5 0.304 0.5 0.732 0.50.0499 0% 0.0431 99% 0.0337 99%
F 0.610 1 0.&53 1.5 0.550 1.50.0347 0% 0.0355 98% 0.0276 98%
A 0.613 2 0.831 2 0.737 2E 0.0560 0% 0.0523 96% 0.0549 95%
C 0.569 1.5 0.675 2 0.505 2.50.0561 0% 0.0509 90% 0.0441 95%
E 0.352 0.5 0.507 0.5 0.382 0.50.0474 0% 0.0453 98% 0.0445 97%
A 0.904 No F.A* 0.811 7 0.856 4F 0.0558 0% 0.0554 0% 0.0532 95%
C 0.584 No F.A* 0.682 5 0.534 4 50.0536 0% 0.0587 90% 0.0418 95%
F 0.750 2 0.686 2.5 0.609 10.0326 0% 0.0306 97% 0.0282 97%
* No F.A. = no film activity
DATA PRESENT IN FOLLOWING FORM:
rsoughresc, (pa) induction time (mins.)
ak curvature (pm- I % coherence
Table 15: Results from running-in tests at 150*C. lkg for oils D, E and F with
various liners.

0-07-
w 0-05-
(w 0-04-
~0-02-w0L
0-01-
I12 3
TIME [HOURS]
0.8
o,1
TIE HORSFi.2:ae 05srae cags a l O 4~ o1 BE

EIM 0HORS
004
1 2 3 4TIME IHOURS I
1g3:Ue ,sufc hnesa 5C0 A

>007
-L
0: D
002
12 3 4TIME LHOURS
F1.340 ie .sraecage t10-k ol BE

0-07-
E 0-06-
w 0-05-
U 0.03-
<0-02-
12 3 4TIME IHOURSI
1-0
0.8LE
w- 0-5
z00.40
0112
TIME (HOURS]
Fig.35- Liner D., surface changes at 150'C.lkg .oils AD

0-07
0-4
0-01
I
1 2 3 4.TIME [HOURS]
1.0-
0.9g
0.8-
-07
1E 31TIME (HOURS
Fi 6LnrE uraecagsa lOnk Ol D

0-07-
E 0-06-
w 0.05-
>0.4
w
f1 2 3 4TIME [HOURS)
1.0-
0.9-
0.8
0.6
I I>1) 2A
TIM [HOURSFa.z ~nrF ufc hne t10~k ol D

Table 16 gives X drop in peak curvature data both before induction time (0-5
minutes of running-in) and after induction t. z (5-240 minutes of running-in)
X drop in peak curvature 0-5 minutes
liner A B C D E Foil
A 9.5 14.9 1.8 33.5 12.6 9.5
B 18 .3 18 .8 1 1 .8 . . . .
D 21.1 19.2 9.4 81.8 16.3 15.6
E 25.1 ---- 17.3 ---- 20.5 ----
F 25.4 ---- 20.9 ---- ---- 20.7
%drop in peak curvature 5-240 minutes
liner A B C D E Foil
f A 18.2 -5.8 8.7 48.9 12.7 25.8
B 6 .5 2 0 .1 2 .5 ....
D 28.1 15.8 24.1 0.9* 32.5 20.5
E 2.0 ---- 21.4 ---- 6.1 1.5
F 4.7 I - - 22.0 - - - -- -13.5
running-in has been completed after 5 minutes
Table 16: Z drop in peak curvature before and after induction time.
Comparing liners A and C it is clear that liner C performs better than liner
A during the first five minutes for all oils. However, from 5 to 240 minutes the
performance of liner C is only better than liner A for oils A, B and D. On the
whole no clear liner performance ranking is evident though D consistently
performs badly and there is some evidence to suggest that liners with lower
values of surface parameters perform better than those with higher values.
Comparison of oil performance does indicate clearer results, especially for
oils A and D. Oil A seems to have particularly good initial anti-wear activity,
performing better than the other oils on all liners in the first five minutes and
performing better than oil D on all liners except F from 5-240 minutes.

12.2 Induction time
Table 17 shows average induction times for all oil/liner combinations
tested.
LINER
OIL A B C D E F
A 25 14 14.5 2 2.5 3.8
B 9.5 14.5 6 - - -
D 2 2 1.2 2.7 0.5 1.3
E 2 --- 2 - 0.5 -
F 5.5 - 4.8 - - 1.8
Table 17: Induction time (mins.) for all oil/liner combinations
Clearly induction time is not a characteristic exclusively of oil or liner
but rather a combination of the two. Induction time rankings for oils and liners
are as follows:
Oils: D E < F < B A
Liners: ED < F < C < B A
Measurements of induction time with liner D were somewhat confused as the
black liner coating gave an initial e.c.r. reading of o 0 which quickly dropped
to 00 as it was worn away in the first minute of running-in.
The ranking of liners for induction time suggested a correlation with
initial surface parameters. liners with high initial values of rms.roughness and
peak curvature giving the longest induction times. To examine this possibility
all liners were ground and polished so that peak curvatures were all 0.0150
i 0.0030 pm-1 and rms.r-ughness values were all 0.050 ± 0.010 Pm. Table 18 shows
induction times for oils A and D on these liners.
LINER
OIL A B C D E F
A 0.9 1.3 1.4 0.1 2.1 2.6
D 1.1 0.6 1.0 1.6 0.7 1.2
Table 18: Induction tims (ains.) for ground and polished liners

I
Clearly induction times are faster on these liners, the greatest difference
being shown with oil A on liners A, B and C, the liners which had the highest
initial values of surface parameters before grinding and polishing.
The importance of induction time in the running-in process is not at all
clear, if indeed there is any importance. The comparison between oils A and D is
particularly striking in this respect. Table 16 indicated that oil A prevents
surface changes to a much greater extent than oil D. yet Table 17 shows that oil
D has a consistently faster induction time after the first five minutes of
running-in for liners A, B and C, oil A has not produced a thick film, whereas
oil D produces a thick film after 1-2 minutes but still allows more surface
changes than oil A. This indicates that firstly oil A has a particularly high
initial anti-wear activity, and secondly that this may result in delaying
induction time since the surface is well protected and takes longer to wear down
enough to accommodate a thick film.
12.3 Coherence
Table 19 shows % coherence values for all oil/liner combinations tested.
LINER A B C D E F
OIL
A 95 85 95 85 99 97
B 95 95 99 ......
D 98 97 95 80 99 98
E 95 -- 95 -- 97 --
F 95 -- .0 -.. 97
Table 19: X coherence for all oil/liner combinations
There is little to distinguish the performance of oil/liner combinations in
terms of % coherence at 1500C, 1kg load. However liners E and F, with the lowest
initial values of surface parameters, do give the highest coherence values.

Liner D gives the lowest coherence values, associated with the high wear rate due
to its softness. Certainly there is no clear difference between oils A and D in
their coherence values, again suggesting that the better performance of oil A
over oil D may be due to better initial anti-wear activity rather than bettcr
film activity.
12.4 Summary
To some degree it has been possible to distinguish the affect of initial
surface parameters from that of oil composition in the running-in process. A
general oil performance ranking based upon surface changes and largely
independent of liner type, seems evident,
A B > EF > D
A general ranking of induction time for the oils has also been possible, and
this is almost exactly the reverse of the performance ranking for the oils*
D E<F<B A
This supports the suggestion that good performance in terms of prevention of
surface changes may result in delayed induction time since the surface takes
longer to wear down enough to support a thick film. Performance differences may
thus reflect differences in initial anti-wear activity rather than film anti-wear
activity, a suggestion supported by the similarity of coherence values for all
oils, indicating similar film anti-wear activities.
No clear performance ranking for the liners was possible perhaps due to the
relatively mild conditions of 150°C, lkg load. However, liner D performed poorly
both in terms of allowing severe surface changes and having a low coherence
value. This presumably is due to the low value of hardness for liner D
(VHN 200). Liner C, with lower values of initial surface parameters than liner
A, performed consistently better than liner A in the first five minutes of
running-in and from 5-240 minutes for oils A, B and D. This suggests that lower
initial values of surface parameters may improve performance.

A ranking of induction time for liners was possible:
E, D < F < C < B A
This follows the ranking of initial rms.roughness for the liners, other than
liner D whose rms.roughness quickly drops in the first few minutes of running-in.
Grinding and polishing of liners with high initial ris.roughness values
dramatically reduced induction times for oil A. This supports the suggestion
that the induction of a thick film occurs once a certain load bearing area is
produced and also that good initial anti-wear activity could therefore lengthen
the induction period.
Liners E and F, with the lowest initial surface parameters, showed the
greatest values of coherence but performance in terms of prevention of surface
changes was not significantly better than the other linors, except liner D. This
may be due to the mild conditions, 150"C, Ikg load, allowing all liners except
liner D to perform well.
13.0 DISCUSSION
13.1 Surface changes
The fixed pairing tests indiated a general performance ranking in terms of
surface changes of:
F>E>A>B>D
The mixed oil/liner combination tests ranked the performance of oils in terms of
surface changes as:
A B > EF > D
and the performance of liners as:
C > A > D and BEF > D
Clearly the oil performance ranking does not match the general performance
ranking for the fixed oil/liner pairs. The performance ranking of liners, though
somewhat unclear, does seem closer to that of the general ranking for the fixed

oil/liner pairs, and this seems to relate to the initial surface parameters of
the liners:
Hardness: BE > F > C > A > D
rms.roughness: AC > B > D > F > E
Peak curvature: A > B > C > D > E > F
The poor performance of oil/liner pair D could be due to either the low
hardness value of liner D or the consistently poor performance of oil D. The
good performance of oil/liner pairs E and F compared with pairs A and B must be
mainly due to their low initial values for rms.roughness and peak curvature,
combined with relatively high values of hardness, since oils A and B tended to
out-perform oils E and F. This certainly seems to indicate that liners
manufactured with low values of rms.roughness and peak curvature may need less
running-in than those with higher values. There is also some evidence that the
severity of wear in the first few minutes is considerably lower for these liners.
13.2 Induction Time
The ranking of induction times for the fixed oil/liner pairs was consistent
under all experimental conditions:
E(F<D(B(A
The mixed pairing tests ranked induction times for oils and liners:
oils: D E < F ( B A
liners: ED < F ( C ( B A
As the induction time rankings for oils is very similar to that for liners it is
not possible to establish which is mainly responsible for the ranking given by
the fixed oil/liner pairs. Grinding and polishing of liners with high values of
initial rms.roughness did dramatically reduce the induction times for oil A, but
it is also clear that these are major differences in induction time for oils with
the same liner and that these may be linked to differences in the initial
anti-rqear nctiviry cf the oils, induction time being greater for oils that

protect the surface well since it may then take longer for the surface to iun-in
enough to support a thick film. While induction time may be an indication of
initial anti-wear activity there Is little evidence to suggest that it has an
important role in the running-in process.
13.3 Coherence
The fixed pairing tests at 150"C, 1kg indicated a performance ranking in
terms of coherence as:,
EF > AB > D
The mixed pairing tests suggested that under these relatively mild experimental
conditions all the oils gave similar coherence values. The liners however did
provide a definite performance ranking:
EF > ABC > D
This ranking matches that of the fixed oil/liner pairs suggesting that under these
conditions it is differences in the liners that is predominately responsible for
differences in values of coherence. This ranking also matches the general ranking
for surface changes given above, which, as previously noted, matches the rankings
of initial rms.roughness and peak curvature for the liners, with the exception of
liner D. High values of coherence are associated with good performance in terms
of prevention of surface changes and these seem to be related to low initial
values of rms.roughness and peak curvature for liners with hardness values between
390 VHN and 470 VHN.
Lack of accurate and detailed information about oil compositions has
prevented an examination of the role of oil composition in the performance of
differences of the oils.
14. (XON(SIONS OF RUNNING-IN TESTS
The final aim of this project was to produce, using a laboratory test
machine, a method of assessing the quality of oil/cylinder liner pairs which
correlates with engine performance, so reducing the amount of full-scale engine
testing. Segments of cylinder liner were tested in a reciprocating ball-on-flat

apparatus. Changes in rms.roughness and peak curvature over the four hour
running-in period provided the primary method of assessing the quality of
oil/liner pairs. The electrical contact resistance (e.c.r.) of the rubbing pair
was continually recorded, providing information about the additive film formed
after rubbing was initiated. The ecr recording gave two parameters which could
be used as a measure of oil/liner quality: induction time, the time at which the
additive film forms (indicated by a sharp increase in the ecr.) and coherence, a
percentage measure of the magnitude and stability of the ecr after it has reached
a steady state. These two parameters were found to be characteristic of a
particular oil/liner pair under particular experimental conditions.
Good performance in these tests could then be designed in three ways
Firstly, in terms of surface changes: oil/liner pairs with least surface changes
over the four hour running-in period perform the best. Secondly, in terms of
induction time: oil/liner pairs showing the shortest induction time perform the
best. Thirdly, in terms of coherence: oil/liner pairs showing the greatest
coherence perform the best. Pcrformance rankings were obtained for each of these
three measures of quality at different temperatures and contact loads. However
it was realised that performance in these terms could in fact be too good and not
allow running-in to occur e.g. 1% ZDDP, with no Inhibitors present, at 150"C, lkg
load can give an induction time of less than one minute, coherence of 10A and
virtually no surface changes after four hours of rubbing. It was hoped that
comparison with engine performance data would establish the optimum performance
levels in this test machine but this data has not been made available, leaving
the final aim of this project unachieved.
Relationships between surface changes, induction time and coherence were
examined and also the affect of temperature and load on each. These results were
then related to cylinder liner characteristics (hardness, initial rms.roughness
and peak curvature) and oil composition (ZDDP concentration and metal detergent
inhibitor type) in an attempt to examine the role of each factor in the
running-in process. Unfortunately little information was available about oil
composition.

Surface changes -
Both rms.roughness and peak curvatures decreased over the four hour
running-in period. Under mild conditionz, eg. 150C, kg load, rms.rougness and
peak curvature values stabilized after about one hour, while under more severe
conditions. eg 250"C, 5kg load, running-in might not be complete until after 3-i
hours of rubbing. In general there was a good correspondence between drop in
peak curvature and dr-p in rms roughness but honing marks caused considerable
variabilit. in rms.roughness readings so changes in peak curvatures were used to
evaluate the degree of surface changes.
Load increases from lkg to 5kg produced slightly greater surface changes but
temperature was found to be the most important factor. For ZDDP oils, all those
testcd except oil C2, 150"C and 200"C produced best results, with surface changes
being much greater at 250C. Oil C2 performed best at 250"C. The rankings of
oils Cl to C4 on liner C, in terms of surface changes, was the same after 5
minutes of rubbing as after 4 hours and since the thick additive film tended not
to form till after 5 minutes, this indicated differences in initial anti-wear
activity, as opposed to film anti-wear activity.
Induction time -
Induction time varied considerably between oils and oil/liner rmbinations,
depending on initial rms.roughness of the liner as well as on ZDDP concentration
and inhibitor type. Inci-easing load from 1kg to 5kg tended to approximately
double the induction time while temperature usually h,.. little affect. No
relationship was found between surfs, changes and induction time. Indeed there
was some evidence to suggest that a long induction time might be associated with
good initial anti-wear activity end so good overall performance, contrary to the
original essumption that a short induction time indicated good performance.
Coherence -
The coherence of a thick additive film was found to be a consistent
characteristic of a particular oil/liner combination, and was found to be
affected Ly load and temperature in much the same way as surface changes.

increased load reduced coherence as did high temperature (250"C) for the ZDDP
oils. There is strong evidence to suggest a relationship between the coherence
value and the degree of surface changes both before and after induction time,
performance rankings based on coherence closely matching performance rankings
based on surface changes. In the case of oils Cl to C4 these performance
rankings related well to additive type and concentration.
While the overall aim to match these bench test results with engine test
results has not been accomplished, due to lack of engine test data, it is clear
that the test machine used does allow detailed examination of the running-in
process and, in particular, measurement of the induction time, the time at which
thick film formation occurs, and measurement of the coherence, the quality of
the thick film formed.
I.I

15. APP INDIX I
Liner characteristics, liners ABIEF
Liner lrdness (VHN) rms.roughness (W) Peak curvature (pn)
A 390 0.900 0.0750
B 470 0.820 0.0730
* 200 0.700 0.0640
E 470 0.510 0.0600
F 430 0.650 0.0410
surface covered with a black coating
Oil characteristics, oils ABDEF
OIL
A Primary alkyl ZDDP (1.5% Paranox 16,0.4% Paranox 15)
B Primary alkyl ZDDP (1.5% Paranox 16)
D No details
E No details
F Primary alkyl ZDDP (1.5% Paranox 16,0.3% Paranox 15)

SECTION 3 - Surface temperatures due to a reciprocating heat source
SUMMY
The object of this part is to carry out a theoretical analysis of surface
temperatures due to a reciprocating heat source. This has confirmed and
quantified the original belief that the reciprocating rig provides a convenient
method of studying friction and wear in which the surface temperatures are known
accurately because the additional flash temperatures are small.

1.1 INTRODUCTION
It is well-known that when a body slides under a (frictional) heat
source, the contact surface becomes, locally and for a very short time, very
much hotter than the bulk temperature of the solid. These temperatures may be
measured directly using an infra-red microscope if one of the sliding pair is
mad- 'f glass or sapphire (e.g. Turchina, Sanborn and Winer, 1974). or by
using the thermo-electric effect between dissimilar metals to make the sliding
pair its own thermocouple: but more normal techniques using embedded or
trailing, sliding, thermocouples fail because of the localised nature of the
temperature rise: the hot zone is frequently only microns thick, and rarely
extends more than a millimetre behind the source.
Accordingly, it is often necessary to rely on theoretical estimates of
these 'flash' temperatures. Fortunately, at least for a single, well-defined,
contact area (such as a square or a circle) moving rapidly, there is a simple
formula for the maximum flash temperature
max=
'K' KI)
where q is the rate of heat supply per unit area, K is the thermal
conductivity, a the thermal diffusivity, d the length of the source in the
sliding direction, and V the sliding speed. Blok (1937), Jaeger (1942), and
Archard (1959) all made contributions to the mathematical and physical basis
of this result, and elaborate analyses, such as that by Jaeger and by many
later authors, have oaly showed, either deliberately or invoJuntarily, the
?-1-

HEATDISTIBUION
STATIONARY SOLID
TEMPERATURE
(b)
FIGUE.-1A Moving sources of heat. (a) Source representedby a plane bump on a moving semi-infinite solid,lower semi-infinite solid stationary, (b) Flashtemperature due to the passage of the slider, amaximum at the rear of the source.

value of Blok's equation.
Temperatures in a Reciprocating Contact
The usual sliding contact moves with a steady, uni-directional
velocity. This means that each point on the stationary surface ieceives heat
only when the moving source is above that point, and is subsequently unheated.
This is shown in Figure la, and the corresponding temperature distribution for
the Blok solution in Figure lb. The point A begins to receive heat when the
slider first arrives and stops receiving heat when the back of the slider has
passed: the maximum temperature is seen at the rear of the source. The
slider, on the other hand, sees a constant heat input from the friction in the
contact and can, therefore, be treated as a stationary source on a semi-
infinite solid.
In reciprocating contact, the picture is different since a point on the
lower surface is passed repeatedly by the slider and there is no frame of
reference in which the heating or temperature is steady. This means that
flash temperatures, as defined in the last paragraph, do not exist and the
problem is more difficult than for uni-directional sliding. The repeated
passage of the slider produces, in the steady-state, a local temperature rise
over the whole swept area that is in addition to any 'flash' temperature.
A numerical solution of the heat conduction equations for such a case
has been made by Hirano and Yoshida (1966). Their solution, in terms of
integrals of error functions, gave the steady-state temperature distributions
across the slider rather than the contact region on the semi-infinite solid.
The results they presented were only for a limited range of contact conditions
and geometry, particularly appropriate for fretting contacts.
Archard re-worked the Blok/Jaeger theories of flash temperature,
emphasising their physical basis and avoiding much of the mathematical
complexities. In the same spirit, this paper presents a more accessible
-2-

SLIDILR
TSOLID
21
yc
(b)
FIGUJR...2 Geometry of the reciprocating coflt3ct

solution than Hirano and Yoshida's for reciprocating contacts. The enormous
advantage of this solution is that temperatures can be calculated easily for
any experimental conditions without recourse to re-evaluating the complex
numerical solution for every new condition. Hirano and Yoshida's analysis did
not and could not easily take into account the partition of heat between the
slider and the solid. The analysis in this work starts with the same
assumptions as Hirano and Yoshida and then extends the solution by simple
means to inzlude partitioning of heat.
1.2 FRAMEWORK AND ASSUMPTIONS
This analysis was carried out using the following simplifying
assumptions, see Figure 2:
(i) The slider moves sinusoidally
(ii) The slider is in full contact with the semi-infinite solid and the
contact is square or rectangular.
(iii) The slider is adiabatic, and heat loss by convection from the lower
surface is negligiole: all heat generated in the contact is conducted
away into the lower surface.
(iv) The production of heat is uniform over the area of the slider at any
particular instant, and is proportional to the contact pressure,
friction coefficient and velocity of sliding:
q = ppV (2)
The basic geometry is given in Figure 2, 1 a slider of sides 2e x 2b
reciprocating with an amplitude a about zero position. The motion of the
centre is given by:,
x = a sin(wt) (3)
-3-

22
/
(a)
"FAN HEAT INPUT RTE
"FIPUT
~p~~
contilnuouiy heAted ,
(b)
Contact geometry and heat input
distribution for values of A (I I.

I
where a is the amplitude of motion. Blok's speed parameter, Ve/2a, becomes.
after non-dimensionalisation, 2M2A where A = a/8 and M 2 = (ae
2/4a). This is
the non-dimensional form used by Hirano and Yoshida and while, perhaps, not
the most appropriate. its adoption allows the results of the two analyses to
be compared.
The analysis will be carried out in two stages. We shall first
calculate the steady temperatures produced by taking the supply of heat at
each point to be constant (and equal to the mean rate at that point).
Secondly we shall calculate the temperature fluctuations ('flash
temperatures ) due to the variation of the heat supply rate at a point about
its mean value.
2.1 STEADY TEMPERATURES: SMALL AMPLITUDES (A 1)
For small values of A. the contact size is greater than the amplitude
and the contact geometry is shown in Figure 3a. In this case, some points on
the lower surface are always under the slider and are, therefore, continuously
heated. For such points, the average rate of heat input is given by:
Tr/2J
q= . f ppaw coswt . dt = 2 paw/r (4)
This is true for all points -(e - a) < x < (8 - a). For points at the ends of
the travel (8 - a) < x < (8 + a), heating starts at a time after t = 0, at
Wto = sin- 1 ((x - E)/a) and continues to wt1= 7r/2. The average rate of heat
input at such points is given by:
tI
q ipaw coswt . dt =jp(a - x + e) w/r (5)
0

Fb x
y
(a)
'Full' wedge solution To l\\ Trapezoidal solution
/)X 'Reduced' wedge solution
2A C
(b)
FIGURE 4 The solution for temperatures due to atrappzoldnl heat input- wedge heat inputs (3)are superposed (b). The 'reduced' wedge issubtracted trom the 'full' wedge to produce thefinal trapezoidal solution.

Equations (4) and (5) agree at x - (e - a). The heat input to the rectangular
contact area on the lower surface is shown in Figure 3b. Note that the slope
of the end sections is
X = ppp/7r (6)
The steady temperature rise due to a distributed heat source of rate
q(x',y') is known to be
O(x1y) = I q(x'.y') dx'dy' (7)
(- x)2 + (y - y,)2
[Francis (1970) points out that this is identical to the expression giving the
elastic surface deflection due to a distributed pressure q(x',y') if the
thermal conductivity K is replaced by half the plane-strain modulus V (i.e.
E' +-* 2K), so that answers to steady temperature problers can often be found
by consulting texts on elasticity, e.g. Timoshenko and Goodier (1983)).]
The trapezoidal heat input distribution of Figure 3b can conveniently
be obtained by superposition of 'pyramid' solutions as shown in Figure 4: a
pyramid has width 2b and extends from x = -c to x = +c with slope EN. It is
shown in Appendix I that this gives rise to surface temperatures
where F(z) = 2z sinh-l + z2 sinh-I , ] +2 (9)
Hence, by first taking c equal to (t + a) and then to (e - a) (see Figure 4b),
we get
O(x) = [ e8+ a] +Fx a] x + a,] +F(x - +a]
(10)
wheye from equation (6) X = iw/ir.
We introduce a non-dimensional temperature 0 defined by
-5-

1..p ... 0tw
i i..t input 0 1
x -2.0 -0.5 -0.6 -0.4 -0.2 0 .1 .4 O.C 0. 1.0
~ Heat Input distribution and correspondingtemperature solution for A = 0.05.
F MX
L~1 6Temperaiture
-2 0 2.0 X
~ Contact geometry, heat Input and tesperatt.resolution for the case A = 1.

= Rcal.ght_ =(e2)V.(e1anwrt
Note that this differs from the i used by Hirano and Yoshida. who define
0= v 2KOl(2pa). Rcalling tht M = (e2)vG/_, we can write
2 b2M2 [x + e+ alF fx- a Fx + e- a. - 8+ a]
Ir12
Typical examples for e = 1, b = 1. a = 0.05 and a = I are givet, .n
Figure 5a,b. The (steady) temperature is a maximum at the middle of the
rubbed area, in 5a it is fairly constant up to the edge of the heated zone,
while the much more concentrated heat input for A = I (Figure 5b) gives a more
'peaky ' temperature.
2.2 STEADY TEMPERATURES: LARGE AMPLITUDES (A 1)
When the amplitude a is greater than the half-length E of the slider,
oist of the points in the stroke are passed by the slider moving at an
approximately constant velocity and this can be treated as a fast-moving heat
source. It is only towards the ends of the stroke that this becomes a poor
approximation. The essential geometry is shown in Figure Ga, and the total
heat received is distributed as shown in Figure 6b. This cai, oe obtained
either by the method used in the last section, or as follows. If the source
is split into strips of width dx, then each strip heats a point for a time
dx/V at a rate WpV and, therefore, supplies ppdx to that point. The total
heat received by any point in a single pass of the slider is then given by:
QTOT = pp x (width of source that passes the point)
and the mean rate of heat input at that point will be QTOT/(v/w), i.e.
q = P x (width of the source that passes the point) (13)7ri

C(a)
MCAN HEAT INPUT xWrE
I -
not continuously
heated
a
(b)
FI.GUR Contact geometry and total hent distribution forvalues of A > 1.

Thus, for points in the region 0 <Ixi < a - 8 the mean rate is
= 2ppw8/r, while points in the fringe areas a - e < Ixla + e are passed
only by (e + a - lxi) of the slider, to give,
q (e + a- jx) (14)
The steady heat input is drawn in Figure 6b, and is seen to be the same
as for small amplitudes, except that the height of the plateau is 21.xwe/II
instead of 2ppwa/r;, the end slopes are still X = j/pw/r as given in equation
(6).
The steady temperature distribution is obtained in the same way as for
small amplitudes, except that in superposing the wedge solutions, we subtract
those for c = a - e M le - al instead of those for c = e - a. The final
non-dimensional solution for the steady temperature can therefore be written
for any value of A as
o(x) L [!)-2
.M2[Fx + I + a] - I
In all the results presented in this work, the slider was square, i.e.
b = e. Typical values of the non-dimensional temperature at x = 0 are
tabulated below for M = 1.
Table I
A 0.1 0.2 0.5 1 2 5 10
0 steady 0 286 0.570 1.404 2.619 3.836 5.349 6.476
[For comparison, we note that for uniform heating at a rate
q = (2/v)jpaw over a square 2e x 2e, the result is 0s~eady = 2.858 M
2A:
•
clearly the motion has little effect on the steady temperature for A < 1.]
-7-

HEAT INPUJTRATrE
[. - - mean rate
DIMENSIONLESS TM0 n/2 n U/
Qa)
-n/2 4/23m/2 DIMENSIONLSS rim
FIGQRE .7 Time varying heat inputs to points on thestatiolp:y solid (a) at x=0 and (b) at x=1 andto allI points on the slider. t,

3.1 FLASH TEMPERATURES.- A < 1
In addition to this steady temperature rise in the contact, there is a
transient temperature due to the passage of the slider. All points less than
a distance (e - a) from the centre of the contact (x = 0) - which for small
atmplitudes means most of the heated area - are continuously under the slider
and so continuously heated, but at a varying rate due to the varying velocity.
Thus, the heat input rate is a rectified sine wave as shewn in Figure 7a. We
have calculated the steady temperature rise due to the meani heat input (shown
dashed in Figure 7a): we now wish to estimate the effect o the variation
about this mean level.
The surface temperature due to a sinusoidal heat input over the whole
surface is g'vext by Carslaw and Jaeger §2.9: q cost gives rise to4qA
9 = q Ar- cos(wt - 7r/4) (16)
Hence, by Fourier analysis of qAIsinitl (e:opping the constant term (2/ir)qA )
we get
0 (n cos(nwt - 7r/4) (17)
n even
(cf. Carslaw and Jaeger §2.9(vi)). Taking qA = lppaw gives
P= -8AM 1 cos(nwt - 7/4) (18)
n even
The series is easily summed by digital computer, a,.d we find
0 mx= 0.549 AM (19)
occurring when ot - 57/8, somewhat after the time of greatest heat input,
(t = 7r/2.
When can we regard our rather small heated area as the entire plane
surface? Clearly, the answer is w';en the edges are far enough away. But it

is known that after a time t, the response to a temperature change at one
point is small at a distance 2vaia, but reasonably completc at distances less
than 0.5vrE". We deduce that the temperature at the centre of an area which is
heated uniformly with a heating rate varying sinusoidally with frequency 21,
will be largely independent of the heat input beyond a distance of order
vacr/4. Noting that our heat input begins to fall off at a distance (e - a)
but only falls to zero at (e + a), and falls abruptly to zero at a distance e
in the lateral direction, we take the effective distance to be equal to e, so
Lhat we require P ) Zicr/, or approximately. M > 1.
The exact solution for sinusoidal heating over a circular area on the
surface of a semi-infinite solid is easily derived by integrating the solution
for a sinusoidal point source, whinh is given by Carslaw and Jaeger. This is
done in Appendix 2, and shows that the above result is pessimistic, and that
the centre temperature is close to that for a source covering the whole
surface whenever M > 0.6, provided that A is appreciably less than 1.
3.1.1 Flash Temperatures: A ( 1: M Small
For M < 0.6. we cannot assume our heat source to be large. For
sufficiently small amplitudes it is clear that the motion is irrelevant,
except in so far as it provides the frictional heat: we require the solution
for a stationary heat source, with heat input varying as lipatisin'tl - or more
generally, as an cos,t. The exact solution for a sinusoidal square (Or
rectangular) source is not known: but it is easy to extend the analysis for a
circle to give a good approximation for a square. According to Appendix 2,
the result is
q = coswt = A . cos (t - - cos[t - - z
where z = Mv! for a circle of radius e, while for a square of side 2S,
approximately z = 1.587 M, which is equivalent to approximating the square by
-9-
-- 9 --

lleat
Input
A t
(a)
O'C- Unifor-m heat input
13q - - --- I- --. ,[_13q M3LL[TTr rTITTT"tTTTTI"I t
J Zero mean input
(b)
FIGURE * Heat pulses seen by points in the stroke. (a) Ageneral point passed by the slider twice acycle. (b) The centre point receives heat pulsesevery half cycle: this can be split into twoparts, an averaged or uniform heaZ input and azero menn time varying input.

a circle of radius 1.122 t. Hence, from the Fourier analysis of
q = ppawisinwt] we get for the largest variation from the steady temperature
0 = M A f(M).
where
Table II
M 0.1 0.2 0.4 1.0
f(M) 0.1467 0.2639 0.4014 0.5822 0.5492
[The fact that the temperature for a finite disk or square is larger than for
an infinite one is due to the time lag in the arrival of heat from distant
parts of the source:' see Appendix 2.]
3.2 FLASH TEMPERATURES: A > I
For amplitudes greater than the source half-length, the pattern of heat
input to any point on the surface is as shown in Figu~e 8a. The method used
for A < I is inappropriate, but an obvious way is to treat each passage of the
slider as an ordinary uni-directional sliding contact. It is clear that the
maximum temperature will occur when the velocity is at, or near, its maximum
value, so we need not worry about the ends of the stroke where the velocity is
small and reverses its direction.
Near the centre of the stroke the velocity will be almost aw, so that
the Blok high-speed solution, equation (1), may be used provided Jaeger's
parameter L = Ve/2a is sufficiently large. Taking V =aw, we have
L = ae/2a =2AM2: Jaeger's condition is that L > 5.
At slow speeds, Jaeger shows that the answer for a stationary source,
6 = 1.1222 (qe/K), may be used provided L < 0.1.
Thus, we have
L > 5. VF = 2.257 VU : L ( 0.; , 4s = 2.244 L.
- 10 -

Unfortunately in this work we are interested in intermediat, values of
L. Archard (1959) has proposed an interpolation rule fr the average source
temperature: but this is not very accurate. If. however. wc use a .Amilar
rule.
02 02
F S
which we simplify to
P = 2.257 L (20)
comparison with Jaeger's results for intermediate values of L (Table IIT)
shows that we can obtain an acceptable qccuracy.
Table III
L 0.1 0.2 0.5 1 2 3 4 5
01Jaeger 0.22 0.12 0.89 1.60 2.66 3.44 4.10 -1.71
1(20) 0.214 0.410 0.918 1.591 2.601 3.380 4.033 4.602
We note that Jaeger's condition for the high-speed solutio,. to be valid
is rather lenient: at L = 5 it would give 5.05 - noticeably worse than any
value in cur table.
h.wLver, in order to account for the steady temperaturf rise, we wish
to use the solution already obtained (Equation (15)) for the effect of the
mean rate of heat input. We need, therefore, to find the transient
temperature due to a moving source with zero total heat input, or, what comes
to the same thing, to allow for the cooling down from the 'steady' temperature
since it was 'topped up' by the last passage of the heat source.
The first method is indicated in Figure Sb: if the time between pulses
is T (S i/u) and the pulse length is P3T, then we regard this as a moving
source of strength q0 operating from t + -YPT to t = +Y3, tugether with a
moving source of strength -q 0 starting at t = -(I - P).T/2.
- 1I -

(This is an adaptation of the normal method of finding the temperature
. hlnd. a moving heat source by regarding the source as continuing to operate,
but to be followed by a negative source of the same strength).
If the speeds are sufficiently high, we may use the Blok/Jaeger high
speeo solution for both pulses. According to this, the maximum flash
temperature occurs as the rear of the source passes the centre point, and is
0 flash K . G . (21)
where f= sin-' 8 , T -
If U/a is very small, we can take 8 to equal the maximum heating rate Ippaw:0
but in this case we could also take 13 = 2e/ra. For moderate vaiues of e/a it
seems more consistent to use the mean heating rate while the source passes the
centre point. This is qo = ppue/sin -(e/a): so for the flash temperature we
get
LM I " 1 2 0 = A sin-'
But the condition for the validity of the high-speed solution is not
the same for the real pulse as for the negative one: the :iegative pulse has
far more time available for lateral conduction. It is therefore convenient to
separate the two effects: for the flash temperature we replace
0 8M
.r1
by the appropriate conversion of equation (20);, while for the cooling we
replace
8 = /LM 2 -11 (c ,t 2 F (22)
by its equivalent for lower speeds.
To convert (20), we note that the definition L Ve/2a is slightly
- 12 -

misleading: L appears in the theory as the square of the ratio of the
half-length of the source, e, to the diffusion distance vra:
L = 1'= e since t = .at~ 2ar tV
Icncr for an oscillating contact passing the centre-point of its track, we
have wt = 2sin-I (/a) and so we use equation (20) in the form
2.25 L with L = 2/il(l/A) . (23)
3.3 COOLING FROM TIE STEADY STATE: A > 1
We wish to calculate the reduction below the 'steady' temperature at
the time when the source makes its next pass over the centre point: and we
have argued that this is due to a source of heat -Pq acting from
t = -(1 - 1)T/2 to t = 0 as the mid-point of the source passes, or to
t = +fT/2 as the rear edge passes. Now if we take q to be the mean rate
while the source passes the centre point, then Pqo = (2/,r) tpwe: which is, of
course, exactly the mean heating rate q responsible for the steady
temperature. That is, we regard the steady heating as ceasing at a time
between -(I - 13)T/2 and -T/2 before the time of interest.
We therefore need to study the development of the steady temperature
(in order to subtract it from the equilibrium steady temperature). We
consider first the simpler case of a rectangle 2a x 2b with a uniform heating
rate qA' The analysis is given in Appendix 3: the final equations were
integrated numerically on a digital computer. The important conclusions are:
(i) Initially the temperature grows according to
0 = q - Av
- 13 -
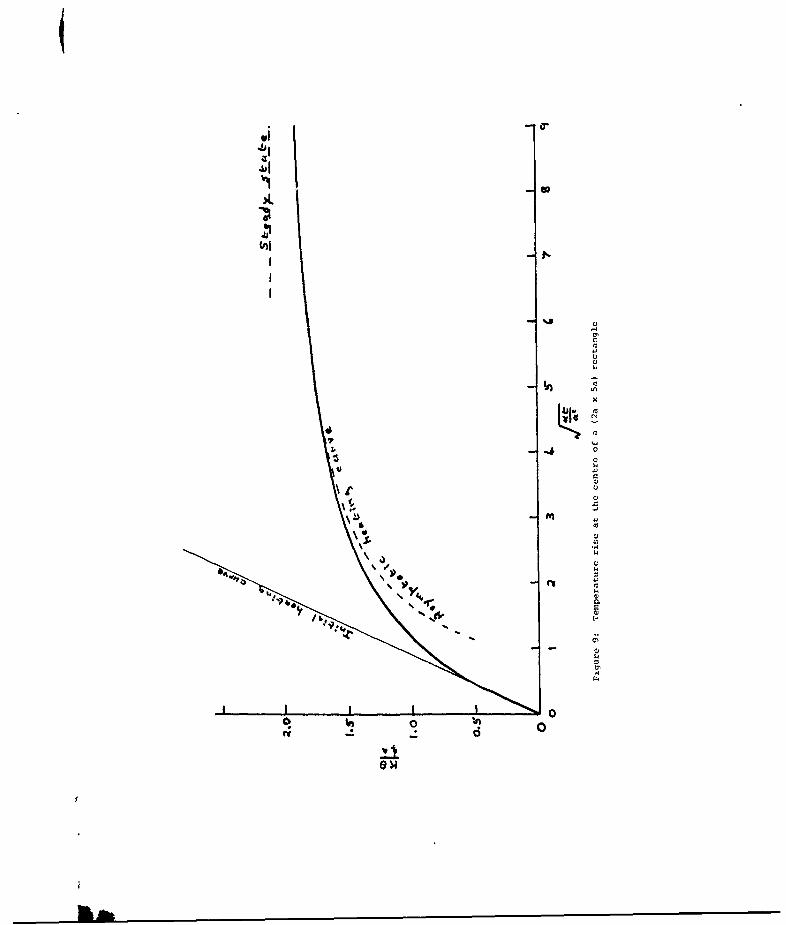
(0~
'II
U~1
C)
C)*4C,C)
C)C))
x
d
4 C)C)
VCC)C)
C)-C
1V1C)
C)
C)
C)44C)4)C)44C)0.C)C)6-
- C)44C)
0o 0WV d 0

as if the source covered the entire plane. The temperature is 10%
below this value when at/b2 = 0.52 for any rectangle whose length a is
greater than four times its width: for a = 2b the time falls to
at/b2
= 0.50 for a = b it falls more noticeably to at/b2 = 0.33.
Thus, except for A = 1, we can use the Blok formula (22) provided
(taking t = v/20)
M2 > 7/4
(ii) For long times, the temperature varies as
Q 1 1 R +k (24)0(t) = ON ) 2rK " ,ia t • l
where O(t) and 0(-) are the temperatures at any point (xy,z):
R2 = X 2 + y
2 + Z
2 is the distance of that point from the centroid of
the heat input distribution, k2
is the 'radius of gyration' of the heat
input (borrowing the term from mechanics: the heat input rate q
replaces the density), and Q is the total rate of heat input to the
plane. We see that whenever (R2 + k
2)/l2at is small, the temperature
deficit, 0(-) - O(t), is independent of source geometry and of
position: physically we recognise that it represents the heating-up of
the distant parts of the half-space the local temperatures have
reached a quas!-equilibrium, but are still rising as a whole because of
the distant temperature rise.
The condition that (R2 + k
2)/12at be small can easily be interpreted
for the actual trapezoidal heat input, equal to for lxi < a - e, falling to
zero at lxi = a + j. Then k' = 2(a + 2+ 2), so that for the centre-point
R = 0 we require
a2 + b2 + e2 < 0.11
36at
which for t = /r/2w (b = e) becomes
- 14 -

M2(A2 + 2) < (25)
Figure 9 shows the temperature development for a uniformly heated
rectangle with a = 5b. together with the initial and final approximations: it
is clear that these cover the majority of the range.
We note that where A law is valid, the steady tempearture 0(,O)
disappears from the final equation for the maximum temperature, to leave
0= flash + . A M (26)max lash 7ra
3.4 FLASH TEMPERATURES: A = I
We have already estimated the flash temperature for A ( 1 by assuming
the contact to cover the whole plane, and shown that this is valid for
M >0.6. For A > I we can assume the velocity of the slider to be constant
(equal to aw) as it passes the centre point, and so use a form of the Jaeger
solution as just described.
For A = 1 we can certainly not assume that the slider velocity is
constant: its variation, or rather, the implied heat input rate, is shown in
Fig. 7. Each point under the slider experiences a different cycle of heat
input, and we note that it is not clear where the maximum temperature will
occur. As the slider passes the centre point, it supplies the maximum heating
rate, but is moving fast. As it approaches the ends, the heating rate is
less, but it heats the surfaces for longer. The centre-point sees a time-
varying heat input as shown in Figure 7a and the point x = 2 (half way to the
end of the stroke)receives heat as in Figure 7b - with the same maximum heat
input rate, but twice as large a deviation above the mean rate (and half as
large below - but this does not concern us).
- 15 -

Now, Archard showed that the Blok solution is obtained by ignoring
lateral heat conduction: it is therefore equivalent to taking the source to
cover the entire half space. But we have already used the solution for a
plane source whose intensity varies sinusoidally to obtain the flash
temperatures for A < 1: we rejected it for A = 1 because the source was too
small. However, if the speed is high enough to satisfy the Archard criterion
VS/2a > 5, we have an alternative justification: the solution will be valid
if
either M > 0.6 and A < I or if 2M2A > 5
Thus, as for A < 1. we make a Fourier analysis of the heat input, and
use the solution for the temperature due to a plane sinusoidal heat input
(equation (16)) for each component.
The heat input is easily shown to be
q = gpawlsinotl for -tI < t < tI
q = 0 otherwise
where for x > 0, cit1 =Cos[-Z~i a x say.
Hence, q = pjpaL) an cos nwt
he 1 [- cos(n-I -Y) 1 -cos 7- } (27)
whr n = n + 1 - n -I
The temperature due to q = an cosnut is, as before,
,aor = 2AM cos(nt - /4) (29)
[Note that on setting x = 0, R = a, we get 7 = rT so that a n 0 when n is odd,n
and an = -4/(T(n - 1)) when n is even, recovering equation (17) - but with
-16-

different conditions for validity.]
Evaluation of equation (29) for different locations gives
Table IV
- ,,/M 0s teady/M2
0 0.549 2.6190.2 0.752 2.480.4 0.98 2.130.6 1.17 1.700.8 1.31 1.281.0 1.28 0.97
The maximum temperature will be the sum of t flash and €steady' so we
give values of Vsteady in the final column. The flash temperatures are valid
only for M > 2.5, and for this range we see that despite the increase in flash
temperature as we leave the centre, the maximum temperature will always occur
close to x = 0, and its value can be taken as te value there, i.e.
0 max 0.55M + 2.62 M2 for A = 1, M > 2.5 (30)
4.1 MAXIMUM TEMPERATURFS
We now collect together the various answers found in the previous
sections.
(i) 0steady is given by Table I (repeated here for convenience)
A 0.1 0.2 0.5 1 2 5 10
s s Neady/M2 0.286 0.570 1.40-1 2.619 3.836 5.349 6.476
(ii) flash = 2.257 L where L =
IF, -+L sin- I )
For A > 2; M > 0.4 0= s d cool +
flashs teady
-17-

where + SM= in-I
cool =' 2 i "
TI For A > 2: M2 (A2 + 2) < w/2 ' = 0res + 0 flash
where * = 1.480 AM0res
III For A = lo M_> 2.5 0 = 0steady + 0.549 M
IV For A ( I = 0steady + AM f(M)
where f(M) is given by Table II (repeated here)
M 0.1 0.2 0.4 1.0 5
f(M) 0.1467 0.2639 0.4014 0.5822 0.5492
From these equations, we can assemble the maximum temperature chart, Figure
10. In order to reduce the range tG be covered, this shows O/M2 rather than
(A. We see that for fretting contacts, dcfined as those moving less than their
width (A , 1). the picture is complete: at all frequencies the steady
temperature is the major term: at high frequencies, M > 5, effectively the
only term. For reciprocatinK contacts (A > 1), the "flash" temperature
dominates at low frequencies - where it is a low-speed flash temperature, not
the usual Blok temperature. At higher frequencies we get a Blok flash
temperature, but it no longer dominates, and again for M > (5 - 10)
effectively only the steady temperature is important. There is a substantial
range of frequencies (0.2 < H ( 1) for which we have no equation; but there
seems to be no difficulty in extrapolating the curves across the break.
For the special case A = 1, dividing the fretting contacts from
reciprocating ones, we have no answers except for M > 2.5, where we have the
steady temperature plus a small correction. This does not seem to be a
particularly important case in practice; but unfortunately it is the principal
case for which a comparison with earlier work is possible.
- 18 -

II
ft - ft
S2tt
q0
-_-o
a. n0
/ / i 4.., i
/ °
00
0 .tCtU

4.2 COMPARISON WITH PUBLISHED SOLUTION
Hirano and Yoshida's (1966) analytical solution for the temperature
over the slider gives answers for A = 1, vary ng M and M = 1, varying A.
Their general conclusions were: (i) the reciprocating contact temperatures
were signifi':antly higher than those calculated using a Blok-type solution
with uni-directional rubbing, especially at high values of A or M2. In
addition to any flash temperatures, there was, due to the lo-alised continuous
heat input into the contact zone on the solid, a significant and time-
independent temperature rise. This was a true contact temperature as opposed
to what was normally understood as a 'bulk' temperature. (ii) The steady-
state temperature variations were set up after only a few cycles of rubbing,
(iii) the maximum temperature occurred near the centre of the stroke, (iv) the
temperature rise in reciprocating rubbing was nearly proportional to the non-
dimensional amplitude A and the parameter H2. On this last point, Hirano's
paper actually quotes proportionality with M not H2. but this can not be the
case for reasons out]ined below and must be a typographical error.
Hirano and Yoshida plot dimensionless temperature (3/20/2) against A
for M = 1, and against H for A = 1. Values read from their figures 8 and 9
have been added to our figure 10 and it is clear that there is substantial
agreement. In particular, for H = 1, A < 1 the agreement is 'perfect' - that
is, to the accuracy with which values can be read from HiranD's rather small
graph.
At large amplitudes, our solution is consistently slightly above
Hirano's. If this is not simply due to a plotting or reading error, then this
is very difficult to understand. At these amplitudes the contact is a fast-
moving heat source with very nearly constant velocity as it passes the centre:
the final temperature is the Blok solution plus the contribution due to the
mean heat input which we calculate exactly. We can see no reason to distrust
these principles in this range: and our calculation is simple enough to be
- 19-

I
free from numerical errors. We note that, in contrast, Hirano's results
depend on the accurate numerical integration over an infinite range of an
oscillating function - and that in any case the difference is small.
Hirano's values for A = 1, for which our methods fail unless M > 2.5,
appear to fit in well, and indeed can be taken as completing our chart.
Interestingly, our equation for A = I
P = 2.619 + 0.549 M
although only justified for H > 2.5, gives exactly, Hirano's answer at M = 1.
It should be noted that the figure from which Hirano's values are taken
has M not M2
as the ordinate, but we have treated this as a typographical
error since it is not consistent with the text of the paper, or the physics of
the situation. At the higher values of M the dominant contribution must be
due to steady heating: this must be proportional to the me'n heating rate,
that is, to (, and so to M2 S (e/'a.
4.3 COMETS ON THE APPROXIMATIONS
Flash temperatures were calculated on the basis that motion had taken
place at constanit velocity for a time sufficient to give a steady transient
solution. Jaeger (1942) described the build-up to the steady solution as a
function of time, 1. He gives a plot of the time needed to reach W0. of the
final temperature, which is very close to
Yt= 0. 25 L (33)2a
(where L = Ve/2a for a square source 2e x 2e). for small values of L the time
is less than this. From other graphs of the development of temperature
against time, it appears that a similar result holds for 90% of the final
temperature:
_-

V2a 1.2 L (34)
These results are more conveniently interpreted in terms of the
distance the source slides before the given fraction of the final temperature
is achieved:, they become
d(50%) = 0.25 e ; d(90%) = 1.28 (35)
Thus, we can assert that once the source has moved its own width, the
temperature will be close to the final flash temperature.
Applying this to our reciprocating contact, we note that even for
A = 1, the contact has moved its own width when we estimate the flash
temperature, although not with a constant velocity; for A = 2 or more the
variation in velocity is small. We conclude that, except possibly for A = 1,
the maximum temperatures will be close to the calculated ones.
5.1 HEAT PAPTTIONING
The analysis so far assumes that all the heat flows into the stationary
body and the moving body takes none. This is an acceptable approximation for
a fast, uni-directional slider; but is certainly not valid for a reciprocating
contact.
We now assume that the sliding body is also a half-space, the square
contact trea being a slightly raised portion. Heat flow into the slider will
again produce a steady temperature and a variable temperature: the only
differences from the previous analysis being that for all values of A, there
is continuous contact and the heat input varies as in Figure 7c, and that we
require the steady temperature for uniform heat input over a square contact.
From Jaeger, this is 1 = 2.858 Ad2 .
Accordingly,
- 21 -

4 = 2.858 M2 + AM f(M)max
where f(M) is given by Table II.
Jaeger's criterion for the partitioning of heat between two bodies is
that the average surface temperatures should be the same. It is indeed
necessary to match average temperatures since the maximum temperatures of the
two bodies will rarely be at the same location - and the temperature
redistribution due to placing the bodies in contact will usually bring the
maximum temperature down near to the average value.
Despite this, we can obtain aix over-estimate of the likely maximum
temperature by assuming heat partition leads to equal maximum temperatures.
Table V shows the calculation for M = 2.5.
Table V: lle.-t Partitioning
A 0.1 0.2 0.5 1 2 5 10
PI/m 2 0.31 0.61 1.51 2.82 4.75 7.40 9.70
,V2/M2
0.34 0 68 1.70 3.41 6.82 17.04 34.09
Fraction toMon Bo 0 52 0.53 0.53 0.55 0.59 0.70 0.78Moving Body
0. /M2
0.16 0.32 0.80 1.54 2.30 5.16 7.55
Generally, we may expect heat partitioning to halve the maximum temperature
for low frequencies for all A:, at higher frequencies there will be a smaller
reduction when A becomes large.
5.2 CONTACT TEMPERATURES UNDER EXPERIMENTAL CONDITIONS
The aim of this analysis was to obtain an estimate of the contact
temperatures in our reciprocating rig experiments. Working conditions -, re:
-22 -

Frequency 35 Hz ca = 220 rad/s
Stroke ± 0.5 mm
Temperature 150"C
Load 1 kg 31 =0.1
The steel specimens have thermal constants:
K = 50 W/mK
a = 1.5 x 10- 5 r/s
2
The worn contact size on the balls were typically 0.15 to 0.4 mm in diameter.
For these two contact sizes, calculation and Figure 9 gives
(s) A M M2 (] 4,/M2 V
0.07 7.1 .13 .017 20 27 0.46 9.2*C
0.2 2.5 .40 .16 2.4 9.6 1.54 3.7*C
Heat partiticning will approximately halve these temperatures.
Thus, at a contact load of 1 kg, the maximvr calculated temperature is
5"C, when partitioning of heat is taken into account. At the increased leads
of 5 kg, the contact diameter was of the order 0.2 mm and the total
temperature is five times that at 1 kg and 0.2 mm, approximately 10'C.
The conclusion from this analysis is that the total contact
temperatures in the reciprocating rig, due to frictional heating, are only a
few degrees centigrade. Both flash and steady temperature rises are
negligible in size compared to the bulk temperature of the test specimens,
typically 2000C. This means that temperature measurements from a thermocouple
placed near to the contact gave readings of the contact temperature correct to
a few degrees.
jag/rmo/9-124 01 89
-23 -

REFERENCES
J F ArchardThe temperatures of rubbing surfacesWear, 2 (1959) 438-455
il BlokTheoretical study of temperature rise at surfaces of actual contactProc. I. Mech. E., "General Discussion on Lubrication", 2 (1937).222-235
H S Carslaw and J C JaegerConduction of Heat in SolidsOUP (1959)
H A Francis
Interfacial temperature distribution within a sliding Hertzian contactASLE Trans. 14 (1970) 41-54
F Hirano and S YoshidaTheoretical study of temperature rise at contact surface forreciprocating motionProc. 3rd Int. Heat Transfer Conf., Chicago (1966) p. 127-132
J C JaegerMoving sources oi heat and the temperature at sliding surfacesProc. Roy. Soc. NSW, 66 (1947), 203-224
V Turchina, D M Sanborn and W 0 WinerTemperature measurement in sliding EHD point contactsJ. Lub. Tech. (ASME), 96 (1974), 464-471
S Timoshenko and J N GoodierTheory of ElasticityMcGraw Hill (1951)
-24 -

Appendix 1
STEADY TEMPERATURES DUE TO A TRAPEZOIDAL HEAT INPUT
It is convenient to use the scheme !:epinted in Fig. 4b. and obtain the
solution for a trapezoidal heat source by super",,-tlon of two pyramidal
sources, each with slope X. one exteniJng letween i le - al. the other between
( + a). In applications we shall take X = ppw/w.
Pyramidal Heat Source
We take q = X(c - Ix'j) per unit time, unit area over -c < X, < c
The steady temperature at (x.y) dLe to a point source Q at (x'.y') on the
surface of a half-space is
0 Q *1
2 /(x - X,)2
+ (y - y,)2
so taking Q = q dx'dy' gives
+c +b
(x) = -L f dxdy
x=-c y'=-b I(x - x)2
+ (y -y)2
For points on the centre-line this becomes
+c b
B(x) = L q dxdy
x=-C 0 /(x x)2 + y'2
Consider first the wedge 0 < x' < c for which q = X(c - x'). Then
+c +b
7K. f (x- x') + (c-x) dy'
x 'O y ' O (x - x ) 2 + y .2
and the x'-integration gives
-25-

(C - X) sinhi- • -rii + nh1 nn [2m 4, y +2
The contribution from the wedge -c < x' < 0 may be obtained by changing the
sign of x: so together
b
0 ( ) {c - x) 1 + (c + x) sh 4' - Ylr - 2x sh- 1
y'=0
- [ _(C - x 2 + y,- + C + X) 2 + Y2 - 21 7 } dy'
The y'-integration requires
b
0
which, noting that it is an even function of d, becomes
sh- I bfdl + Ib2
db sh-[) + d- sh-'b - 1 bfd' +
Hence, taking d = (c - x), (c + x), and x in turn,
0= bj F( ) c+X
wK r[F -bi +F = - - 2F() (Al)
where F(z) = z sh-lz + IZ2 sh-1 -21 I + z .
Trapezoldal Heat Source
We now take equation (Al) with c = a + e and subtract from it the
equation with c = la - e : then
o = ?'j [FFra + e- X1 + F a + e + x. 2F1~
-{(lI ]-- F - In--el F b + F-2F[
which is equation (15).
-26-

Appendix 2
TEMPERATURES DUE TO A SINUSOIDAL HEAT INPUT OVER A CIRCLE OF SQUARE
Carslaw and Jaeger (§10.4. VI) give the temperature at a distance R
from a sinusoidal point snurce Qe it as
0 = exp(-iR + i((t - OR))
where 3 = (s/2a) . For a point source on the surface of a half-space this
must be doubled to allow for purely downwards flow, so the temperature at a
point on the surface
0s = Q exp(-3r + i((ot - Oir))
where r2 = x2 + y
2.
Hence, the temperature at the origin due to a disk source of radius b,
strength qe it/unit area will be
icot b
0s !2K _ r exp{-fir - if3r) . 27rr dr (Al)
r--O
qA Rot I - e-ob (l+i)= -e 13(I + i) (A2)
Taking the real part, we get the temperature due to qA cost over r < b as
06 s Alc< [os t ~ ~e fib cos ut - fb] (A3)
For (0ib) large, this becomes the result for a plane sinusoidal source (Carslaw
and Jaeger, §2.6)
0 = A r (A4s K- 4Z cos((t - r/4) (A4)
For moderate values of (fib) the amplitude of the oscillations is
- 27-
tJ

q A (-a I - 2e-Pb cos(Pb) + e-20b
so that for Ob as small as r/2 the amplitude differs only by a factor 1.021
from that for the plane source. Surprisingly. it ,s larger than for the plane
source, which indicates that the finite disk cuts out contributions which,
because of the time taken to reach the origin, would have been out of phase
with the dominant contributions.
The largest variations are when 3b - 3v/4. when they are 1.07x larger
than for the plane source. To this accuracy (± 7%) we can say that disks of
any radius Ob > 1.2 give the same answer.
Square Sinusoidal Source
For a square source of side 2e, strength qAe
, it is easy to see that
equation (Al) is replaced by
lct ir/4 esec4'
0 q . 8 J exp{-Pr(l + i)} . drdP
4--0 r--O
vr/4-A ei(dt j exp(-ge(1 + I) secP) &P
irK J j(l + i)
For 0 < P < i/4, sec varies only from I to Z so we can get an
approximate analytical answer by replacing sec/ by its mean value, which is
1.1222, i.e. (4/v en(l +
Os !A + i. exp{-1.1222 Pe(l + i))
which is seen to be equation (A2) with b = 1.1222e, that is, a square source
of side 2E behaves approximately as a circle of radius b = 1.12228.
The advantage of this approximate answer is that with an equation of
the form (A3), we can readily find the response to a rectified sine wave,
-28-

using the Fourier series
I sinwt I = ---ICos ni~t
n even
Results are given in the text, Table II, and show that the plane source gives
answers within IX for bi > 2. For a square source this becomes M > 1.3.
-19

APPENDIX 3
Development of steady temperatures in a half-space due to surface heating.
a) Uniform ,iurface heating over a rectangle.
From Carslaw and Jaeger fl0.2 we find that an instantaneous heat source
of strength Qpc at a point (x *,y' ,0) on the surface of a half-space gives rise
to a temperature at (x,y,z) after a time t equal to:
2
0 = Q exp R I where R= (x - x) + (y -y)2+ z ...(Al)4( at)/
Hence the effect of instantaneous sources of strength Q pc per unit area
distributed over the rectangle Ix'< aIyIl< b is
0= Q +a exp t dx* .+b exp - dY .exp[ -z
x =-a y =-b
which can be shown to equal
2__ [ xa ax1 [ y -Ib0 Q erf X+ erf ax erf y+b + erf by exp
4(?at) 1/2 2Va 2vr 2vat 2v7
Accordingly, the temperature due to heat supplied at a constant rate
q/unit time, unit area for a time t is
ysb [ .0 = q...f_ t 1 erf x+a erf exp -a1 dr.4pe T--o 'Va_ 2,- NO IV I'
where the I indicates a set of four terms of which the one given is typical.
-30-

Let u=2vrr/a x=af , y=brl , X=b/a, z=ar
s tht x+a _ 12 y+b = X_____
stht 2Vra- u 2vTW U.
Then 6 = -4 - L I V~aerf erf e-C/ du (A2)K 4,A -
u=o
where the four terms involve obvious combinations of 1 ± fX ± o
For the centre of the rectangle the equation simplifies slightly to:
2 -14GrIa
0(0,0) q erf I . erf - du. (A3)
Equation A2 was evaluated by numerical integration, supplemented by
analytical integration of the series expansions of erf x for x small (u
large). As a check, it was confirmed that the steady state temperatures could
be obtained as t-P' by an analysis resembling that in Appendix 1. These are
found to be.
O(XY)---2-qR (a-x~sh-'b-x +(by~sh- ~x+ax~sh -y +(b-y)sh- x
Ia-xI jb-yI Ia+xI jb-yj
+(a+x)sh- .b~±X + (b+y)sh' a ~ + (a-x)sh- b+Y +(b+y)sh' a+xIa+xI Ib+yI Ia-xI Ib~yI
(A4)
The result for the centre of the heated area is again very much
simpler:
6(,0 [a A aa shb+ (A5)
-31

However, it was noted that the steady state took unbelievably long to
reach, and an analysis was performed to study this.
b) The approach to-the steady state
Consider now a heated area A of any shape on the surface of half-space,
the rate of heating q (x',y') may now vary over A.
The temperature at any point (x,yz) due to a continuous point source
at (x',y') is from equation (Al):
2
O~) f Q ep[Ri dT
T=o 4 c(7aT)a i 2
where R = (xx,)2
+ (yy)2
+z2
The steady temperature at the same point is found by taking the upper
limit of the integral to be o, so the deficit A 0 = 0 (O) - 0(t) is.
AO(t) ;Q f exp R dT
r=t a
Put -2 = 4'T then
1 J-.exp -L dv
AO(t) = = j " 2v~ 2 e [
For t large, we can replace the exponential by a series and integrate
term-by-term:
AO(t) R Rh O ~ ) K
' J v = q ' - 7 ( 1 - -+ T 4 ..) d v
K72~ Jv=2vratV2 V22v4
2 4v
Q R 21
i-j a;+ 160a22.
- 32 -
j6

Now replace Q by q(x-,y')dx-dy- and integrate over A:
2 2
(XX)+(y-y') 42+ dxdyA6(t) =f -xy') - 2kt+ dxy
A
and we see that the leading term is:
4T~t 1a (A6)
where k is the total rate of surface~ heating, ignoring the spatial
distribution.
For the second term it is convenient to take the origin at the centroid
of the heat input distribution, so that:
ff xq (x .y')dx'dy' fJyq (. .y')dx'dy' = 0
We then get:
1 1 1 ~ [ 2 211J q (x'y [ r2 + x+ y. dx'dy'
2
so that k pis the "radius of gyration' of the heat input distribution if we
interpret q as a density and OTas the mass.
-33-

Thus, the leading term describing the temperature rise 'still to come'
derends only on the total rate of heat input, and is the same for all
locations in the heated body (on the surface or below it!). The next term is
of order t-3/2
so much smaller when t is large: it depends on a simple overall2
measure of the size of the heated area, k : and on the square of the distanceP
from the point considered to tb- centrold, so that the correction to the
leading term is particularly swill for compact sources (squares or circles
compared to rectangles) and for points near the centre of the source.
I
- 34 -

SECURITY ILASSI IION OF THIS PAGEformn Approled
REPORT DOCUMENLION PAGE OF.4BNo 0704 0288_______________________________________________I Elp Date Jun 30 1936
Tal REPORT SECURITY CLASSIFICATION lb RESTRICTIVE MARKINGS
28SCRITY CLASSIFICATION AUTHORITY 3 DISTRIBUTION iAVAILABILITY OF REPORT_________________________________ Approved for, public release;, distribution
Zb OECLASSIFICATIONOOWNGRAOING SCHEDULE unliiTted
4 PERFORMING ORGANIZATION REPORT NUMBER($) S MONITORING ORGANIZATION REPORT NUMBER(S)
R&D 5305-AN-01
6a NAME OP PERFORMING ORGANIZATION 6b OFFICE SYMBOL la NAME OF MONITORING ORGANIZATIONPembroke College (if applicable) European Research OfficeUniversity of Camb~ridge USARDSG-UK
6c ADDRESS (Oty. State. "n ZIP Cede) 7b ADDRESS (City, State, Jnd ZIP Code)
k Cambridge, CB2 IRF Box 65FPO NY 09510-1500
Sa NAME OP FUNOING,/SPONSORING Ob OFFICE SYMBOL 9 PROCUREMENT INSTRUMENT IDENTIFICATION NUMBERSVOW search Off ice (it applicable) DJ4-6C00
USARDSG-UK ARO-E IDJ4-6C00ADDRESS(City St--te ndZIP Code) TO SOURCE OF FUNDING NUMBERSBox 65 PROGRAM PROJECT ITASK I WORK UNIT
FPO NY 09510-1500 ELEMENT NO NO NO IACCESSION NO
51102A 11611028H51 06 ARITITLE (include Security Clasi~fkiao)
(U) Basic Mechanismis of Diesel Lubrication -Correlation of Bench and Engine Tests2PERSONAL AUTHOR(S)Professor A. Cameron Dr J.A. Greenwood
13a TYPE OP REPORT 13b TIME COVEREOD1 DATE OF REPORT (Year, Month,ODay) 15 FlOGE COUNT
FINAL _ I FROMj 5TO _jl....9 91 MAR 25 226_16 SUPPLEMENTARY NOTATION
17 COSATI CODES 18 SUBJECT TERMS (Continue on reverse if necessity and identify by block number)
FIELD IGROUP ISUB-GROUP (U) Oils, (U) Luoricants, (U) Wear, (U) Friction, (U) SurfaE11 1 8 Roughness, (U) Electrical contact resistance '.ayerF1 I U/ I !! (U) Tenperature effects
19 ABSTRACT (Continue on reverse if necessary and ident~ify by block number)
The lubrication behaviour of a cylinder liner/piston ring contact in a diesel engine hasbeen Simulated in a point contact reciprocating rig. When lubricants Containing DPadditives are used, electrical contact resistance mseasurements establish that a thickreaction film' quickly forms in the rubbed region, protecting the metal surfaces.
Electrical capacitance measurements show that the film thickness can vary from 0.1 to1 ism: the film appears to be a solid organic polymer with a shear Strength of50-100 XPa.
Using segments of diesel engine cylinder liners from various manufacturers in thereciprocating rig, the changes in surface roughness during the running-in process weremonitored. The induction time needed for the formation of the reaction film as well as
the coherence Of the film was studied as a function of load and temperature (inthe range 150 - 250%).
A theoretical analysis of flash temrperatures In reciprocating contacts confirmsthat these are small under the conditions in this rig, so that the measured
.. pea~ue --- oc acual rc.,pol for the rcactions.
20 OISTRIBUTION /AVAILABILITY OF ABSTRACT 21 ABSTRACT SECURITY CLASSIFICATIONd UNCLASSIFIEDI.NLIMITBO tJ SAME AS RPT I6JOTIC USERS Unlassified
2?a NAME OP RESPONSIBLE INDIVIDUAL 22b TELEPHONE (Include Area Cosde) 22c OFFICE SYMBOLDr. R.E. Reich-nbach 071 409 4423 AMXSN-UK-RA
DO FORM 1473,8B4 MAR 83 APR edition rn4 be used Lifl exhausted SECU-RITY CLASSIFICATION 01 in S PAGIAll other edions are obsoleteUnasi e