actual costs pilot - gov.uk · is important to note that the actual costs pilot covers families ......
TRANSCRIPT
Research Report DFE-RR104
Childcare Affordability Pilots (CAP09) – Actual Costs Pilot: the impact of real time reporting of childcare costs on families – a data analysis report
Kevin Goodman HM Revenue and Customs

The views expressed in this report are the authors’ and do not necessarily reflect those of the Department for Education.

© Crown Copyright 2011
Copyright in the typographical arrangement and design rests with the Crown. This publication may be reported free of charge in any format or medium provided that it is reproduced accurately and not used in a misleading context. The material must be acknowledged as Crown copyright with the title and source of the publication specified.
Executive Summary .....................................................................................2 Introduction ..................................................................................................4
Background...............................................................................................5 Families targeted by the Actual Costs pilot ...............................................7 Regions Targeted by the Pilots.................................................................8 How were families allocated to pilot and control group? ...........................9 Processes for families in the pilot ...........................................................10
Management Information ...........................................................................12 Number of families choosing the new system of payments ....................12 Number of families who drop out of the pilot system, particularly those who return to the standard system..........................................................15 Does the pilot system help parents cope better with seasonal variations in childcare costs? ......................................................................................16 Season variations and the extent to which these are close to monthly limits for claiming childcare costs............................................................16 Number of families using transition payment and advance facilities and extent of this ...........................................................................................21 Extent to which the pilot system reduces error and overpayments .........24 Reasons for non take up.........................................................................27 Cost / benefit analysis – implications for implementing an actual costs system for child care costs......................................................................28 Operational Considerations ....................................................................30
APPENDIX 01 – CAP09 process flow charts .............................................32 APPENDIX 02 – Cost Benefit Analysis ......................................................34
1

Executive Summary The Childcare Affordability Pilots 2009 (CAP09) were set up to assess the impact of providing alternative forms of childcare support to families moving into work. A number of pilots were set up across government departments and local authorities and this paper examines one of the three that were run by HM Revenue & Customs (HMRC). The Actual Costs pilot1 was set up to assess family’s reactions and behaviours in using a payment system better designed to help them budget for their childcare costs, given that they often vary significantly across the year. The current system run by HM Revenue & Customs (HMRC) pays childcare support as an element of the Working Tax Credits system, and relies on families to correctly average their costs for the full year. HMRC statistics2 show that on average 8.9% of tax credit claims in 2008/09 had elements of error or fraud favouring the claimant, with this error and fraud element valued at some £2.11bn to the Exchequer. For childcare cases the error and fraud rate valued some £390m out of expenditure totalling almost £1.6bn in 2008/09, or nearly 25% of expenditure on childcare. Overall results showed that a system of paying a proportion of actual childcare costs in arrears would significantly reduce the level of error and fraud in the system, with a subsequent reduction in over-payments. Initial problems in explaining the system to families, and in getting them to call in their costs on time every 4 weeks, meant that the underlying operational costs were high. In terms of cost / benefit it is debateable whether a telephone based system run on the same basis as the Actual Costs pilot would be cost effective. Utilising more automatic on-line reporting of costs would be less expensive, but would inevitably lose some of the reduction in error and fraud benefits found in the pilot. The data analysis has limited information as to why families chose not to participate in the CAP09 Actual Costs pilot. HMRC telephone records for about 800 families clearly show ‘do not want monthly contact’ as a primary reason. For a broader understanding of the issues around the Actual Costs pilot please read this report in conjunction with the CAP09 research report3. In terms of budgeting requirements families appear to have coped well with fewer over-payments resulting from the process. A transition payment to help families move into childcare or the change from up-front average to actual cost arrears payments was taken up by 50% of families and seems to have been received very well. The CAP09 research discusses how well and also 1 Under the Tax Credit system for the payment of the Childcare Cost Element, families are asked to average their costs over the year. The Actual Costs Pilot was designed to help families budget better by paying a proportion (80%) of the last month’s actual costs. 2 Child & Working Tax Credits, Error and Fraud Statistics 2008/09 3 CAP09 research report: Qualitative Research into Families’ Experiences and Behaviours in the Childcare Affordability Pilots (CAP09): Actual Costs Pilot
2

3
why the other 50% of families may not have wanted the payment. However the facility to take advance payments where costs varied by more than £100 per month was taken by only 9 families, 7 of whom ended up with over payments. Three separate groups were targeted, those out of work and childcare, those in work but not receiving support for childcare and those in work and benefiting from the children’s element of childcare, so that a broad understanding of behaviours could be tracked for families either new to, or already established in, work and childcare.

Introduction The primary aims of the Actual Costs pilot focuses not on take-up as with the 100% and the Disabled Children pilots, but more on the experiences and behaviour of families under the piloted system of reporting and payment. The Actual Costs pilot looks at whether an alternative process, whereby families do not have to average, and can claim (a proportion) of their actual last month’s childcare costs, helps families to budget better, and results in a lower level of error and fraud overall. There is no enhancement of benefits in this pilot, rather families are offered the opportunity to budget for their costs better with more frequent contact (4 weekly rather than once a year ‘averaging’). The aims of this report are to assess whether the CAP09 Actual Costs pilot resulted in:
• A reported improvement in families’ ability to know which costs to report to HMRC, and to do so more accurately.
• A reported improvement in families’ ability to pay their childcare costs, especially when these fluctuate throughout the year
• A decrease in over/underpayments among families in the pilot, as compared to the control group.
• A decrease in error rates among families in the pilot, as compared to the control group.
• Families are able and willing to report their costs at the end of each month.
The Actual Costs pilot was run in two cohorts i.e. those joining the pilot in 2009-10 and those joining in 2010-11. The pilot was offered to three categories of family and all were targeted families with children who lived in London and the South East of England.
4

Background There are some 6.3 million families4 who receive tax credit and childcare payments in the UK. Of these 5.7 million families have children and receive Child Tax Credits or the equivalent and 0.6 million families are in-work but without children receiving Working Tax Credit payments only. Of the 5.7 million families with children, 486,000 benefit from the childcare element. Each receives an average of £69.50 per week help with their childcare costs. Total annual childcare costs amount to nearly £1.6 billion. To understand variations in this report around the cost of childcare reported it is important to note that the Actual Costs pilot covers families in London and the South East only Figure 1: Regional variations in average childcare support payments, provisional awards, December 2010
England 244.4 157.4 401.8 £69.33 119.2
North East 13.1 8.1 21.2 £66.85 7.3
North West 44.8 29.3 74.1 £66.90 17.4
Yorks & The Humber 26.4 19.1 45.5 £64.71 12.8
East Midlands 21.3 16.8 38.2 £65.39 11.4
West Midlands 27.9 19.9 47.8 £66.30 14.7
East 20.1 13.3 33.4 £68.24 13.2
London 41.7 12.0 53.6 £95.51 12.3
South East 29.5 20.5 50.1 £65.51 17.9
South West 19.6 18.4 37.9 £57.79 12.1
Wales 13.0 9.7 22.7 £65.07 8.1
Scotland 29.4 14.8 44.2 £68.43 11.8
Northern Ireland 9.9 6.3 16.2 £82.29 6.1
Foreign and not known 0.4 0.4 0.8 £82.85 0.2
United Kingdom 297.2 188.6 485.7 £69.50 145.5
Benefiting from childcare element (£'000s)Benefiting
from disabled
child element
Singles Couples Total
Average help with childcare
costs (£ per week)
4 Data from National Statistics “Child and Working Tax Credits Statistics”, December 2010
5
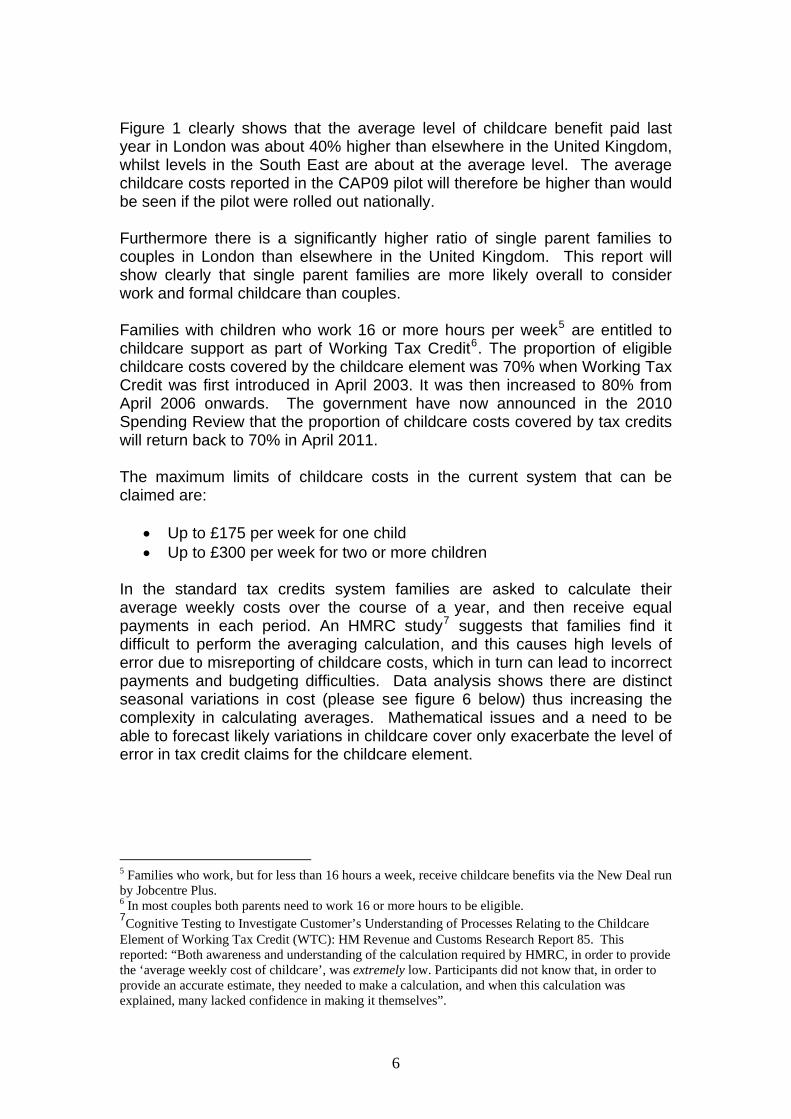
Figure 1 clearly shows that the average level of childcare benefit paid last year in London was about 40% higher than elsewhere in the United Kingdom, whilst levels in the South East are about at the average level. The average childcare costs reported in the CAP09 pilot will therefore be higher than would be seen if the pilot were rolled out nationally. Furthermore there is a significantly higher ratio of single parent families to couples in London than elsewhere in the United Kingdom. This report will show clearly that single parent families are more likely overall to consider work and formal childcare than couples. Families with children who work 16 or more hours per week5 are entitled to childcare support as part of Working Tax Credit6. The proportion of eligible childcare costs covered by the childcare element was 70% when Working Tax Credit was first introduced in April 2003. It was then increased to 80% from April 2006 onwards. The government have now announced in the 2010 Spending Review that the proportion of childcare costs covered by tax credits will return back to 70% in April 2011. The maximum limits of childcare costs in the current system that can be claimed are:
• Up to £175 per week for one child • Up to £300 per week for two or more children
In the standard tax credits system families are asked to calculate their average weekly costs over the course of a year, and then receive equal payments in each period. An HMRC study7 suggests that families find it difficult to perform the averaging calculation, and this causes high levels of error due to misreporting of childcare costs, which in turn can lead to incorrect payments and budgeting difficulties. Data analysis shows there are distinct seasonal variations in cost (please see figure 6 below) thus increasing the complexity in calculating averages. Mathematical issues and a need to be able to forecast likely variations in childcare cover only exacerbate the level of error in tax credit claims for the childcare element.
5 Families who work, but for less than 16 hours a week, receive childcare benefits via the New Deal run by Jobcentre Plus. 6 In most couples both parents need to work 16 or more hours to be eligible. 7Cognitive Testing to Investigate Customer’s Understanding of Processes Relating to the Childcare Element of Working Tax Credit (WTC): HM Revenue and Customs Research Report 85. This reported: “Both awareness and understanding of the calculation required by HMRC, in order to provide the ‘average weekly cost of childcare’, was extremely low. Participants did not know that, in order to provide an accurate estimate, they needed to make a calculation, and when this calculation was explained, many lacked confidence in making it themselves”.
6
Families targeted by the Actual Costs pilot This section looks at the methodologies on how the target families for this pilot were selected. Cohort 1: 2009 -10 – this was split into two groups:
o Cohort 1a: Out-of-work8 lone parents and couples where at least one partner is out-of-work
o Cohort 1b: In-work lone parents and couples where both partners are in-work, but not already claiming the childcare element
Both groups of families also need to match the following characteristics:
o Have children (age under 15 or disabled children age under 16); o Out of work families including single earner couples (working hours
between 0 and 15 per week) and in-work families but not claiming the childcare element of tax credits;
o Household income up to £16,000 in 2008-09; Cohort 2: 2010 -11
o In-work lone parents and couples already claiming the childcare element.
These families match the following characteristics:
o Have children (age under 15 or disabled children age under 16); o In-work families who are currently receiving childcare support through
Working Tax Credits; o Household income up to £21,000 for lone parents and up to £23,000
for dual earner couples in 2009-10. Two cohorts have been necessary to generate sufficient numbers in the pilot to allow a robust assessment of the regular contact scheme. This has had the advantage that it allows a review of both families who are used to the existing aggregation system and families who are new to childcare benefits.
8 Note that throughout this report “out of work” means those families where parents are either not in work or are working less than 16 hours a week and receiving childcare benefits via the New Deal run by Jobcentre Plus. “In work” then means any family where the parents are working more than 16 hours a week.
7
Regions Targeted by the Pilots For all the cohorts, families for the pilot and control groups were selected from London and the South East. Given the activity and complexity of childcare arrangements within London, and the fact that many London Boroughs run their own subsidised holiday provision, (making the cost to families of holiday provision less than the national average), CAP09 was originally designed for areas outside the capital. The Department for Education (DfE) had already been speaking to local authorities in the South East, as to whether they would be interested in participating in CAP09 pilots, and as childcare costs in the South East tend to be around average in the UK, it was sensible to run the Actual Costs pilot there. As recruitment into the pilot proved to be difficult, first the regional definition was widened to include London and then the earnings and employment definitions were relaxed. In the event about 40% of families in the Actual Costs pilot were resident in London.
8

How were families allocated to pilot and control group? The sample was divided into pilot and control groups. To ensure the pilot group was comparable with the control group, families were allocated at random according to postcode. The purpose of this allocation was to make sure that the pilot and control groups had the same pre-pilot characteristics, which is very important from the evaluation point of view. Secondly, this reduced the possibility of families living next door to each other receiving different offers of support, if one was assigned to the pilot group and one to the control group, as this may have been perceived to be unfair. As families opted into the pilot schemes rather than being randomly allocated to them there was a potential problem of bias in our groups. Pilot families must have a choice to join or not, and there is thus the possibility that families who choose to be paid on an actual costs basis could be fundamentally different from those who choose not to. For example, families who do volunteer could be more likely to have costs which vary throughout the year, or they could be more engaged with the system (and would thus find the four-weekly reporting less difficult). Where possible then, data from other areas collected by HMRC has been used as comparators to spot any bias in results.
9

Processes for families in the pilot For the Actual Costs pilot, the method of reporting costs and of payment is quite different from the current system, and is outlined below:
• Letters were sent to the pilot families outlining the payment of childcare costs on an ‘actual costs’ basis, with the availability of additional budgeting help via transition and / or advance payments. Families in the control group were sent a letter outlining support under the current tax credits system;
• Families not currently working 16 hours a week were advised this support would be available on their movement into work and childcare (Cohort 1a);
• Families in work of more than 16 hours a week but not using registered childcare9 were advised of the availability of childcare entitlement if they used registered providers (Cohort 1b);
• Families already in work and registered childcare were offered regular 4 weekly contact and payment of actual childcare costs with the availability of additional budgeting help via a transition and / or advance payments (Cohort 2);
• Families were invited to call a helpline run by a Department for Education (DfE) contractor10 if they wished to register an interest in the offer;
• A random sample of families who did not call in received an outbound call from the contractor asking if they wish to register their interest;
• Those families with whom the helpline did not make contact, received a reminder letter;
• Those who registered an interest received Keep-In-Touch (KIT) calls after 2, 10 and 18 weeks to ask how their job or childcare search was progressing;
• When families secured work and childcare, they were transferred to a dedicated team in HMRC Tax Credit Office, who managed their claim thereafter.
Most of the initial calls were handled by the DfE contractor’s helpline rather than the normal HMRC tax credits helpline. After families secured work and childcare or if families had queries on tax credits, calls were transferred to a dedicated team in the HMRC Tax Credits Office (TCO). This was to help
9 Or, if they were using registered childcare, were not reporting this to HMRC 10 The contractor provided professional contact centre support and was engaged by the DCSF (now DfE) to process interest in the pilots. HMRC’s Tax Credit Office (TCO) ran the pilots once families engaged but did not have the resources for the initial engagement work.
10
reduce the impact on HMRC resource and operational components necessary to deliver the pilots.
o Families could opt to receive a transition payment’ of up to £500 when they moved into work and childcare (cohort 1a), childcare (cohort 1b) or into the pilot’s payment in arrears system (cohort 2) with a view to covering their costs for the first four weeks (or sometimes for childcare deposit payments for Cohort 1 families);
o They were required to call the dedicated team in the Tax Credit Office
(TCO) at the end of every four weeks to report the costs they had incurred in that period. If the family failed to call, then the TCO team attempted to contact them by telephone and then by letter11. If they were unable to make contact, then the family did not receive any childcare support for that period;
o Upon reporting their costs, families received 80% of these up to
monthly limits set to broadly replicate the weekly limits under the current system. All of this support was paid separately from the rest of their tax credits award (by Giro cheque until April 2010 and by BACS thereafter);
o When families called, they were asked if they expected their costs for
the next four weeks to exceed the costs they had just reported by more than £100. If so, an advance facility was offered where they could draw forward some of their payment from the following period, up to a limit of £200. This was then deducted from the support they received in the next period;
o After their final four weeks on the pilot, they did not receive a payment
unless their costs for that period exceeded any transition payment that they received at the start of the pilot, in which case they received 80% of the difference (up to the relevant limits).
11 TCO staff all state that their experience was that customers rarely responded to Contact Centre impersonal reminders, better but not well to TCO letters and generally very well to TCO phone calls. This was particularly true early on in the pilots where families often had multiple questions and concerns about their benefits and the pilot that the experienced TCO operator was then able to deal with. Certainly the telephone records in the TCO show lengthy calls early on related to payment queries (this category is predominantly about calls in relation to pilot payments especially calls to chase up families for their 4 week actual costs).
11
Management Information This section looks at the data held by HMRC in the TCO Pilot Office, on HMRC’s main Tax Credit systems, on the DfE contractor’s call centre database and at other data research undertaken by HMRC in this area. This management information is analysed for pilot and control groups. A number of key questions were set out for analysis at the start of the pilot and these precede each section in bold grey type.
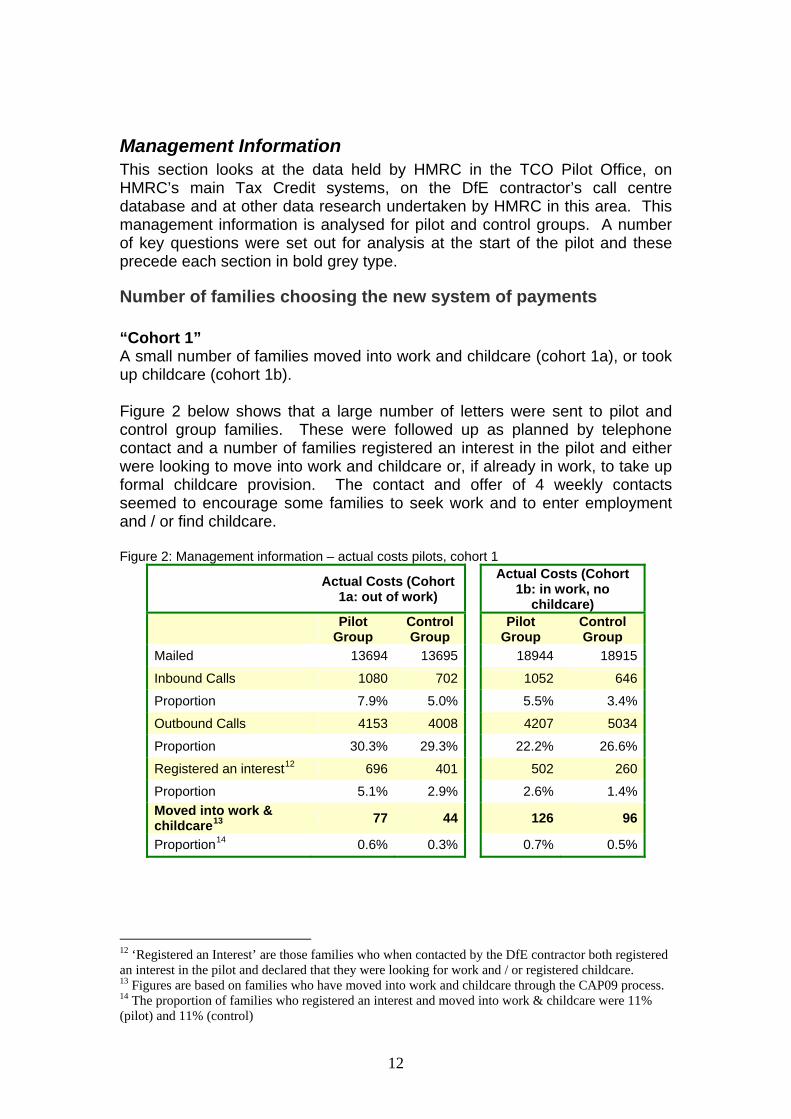
Number of families choosing the new system of payments “Cohort 1” A small number of families moved into work and childcare (cohort 1a), or took up childcare (cohort 1b). Figure 2 below shows that a large number of letters were sent to pilot and control group families. These were followed up as planned by telephone contact and a number of families registered an interest in the pilot and either were looking to move into work and childcare or, if already in work, to take up formal childcare provision. The contact and offer of 4 weekly contacts seemed to encourage some families to seek work and to enter employment and / or find childcare. Figure 2: Management information – actual costs pilots, cohort 1
Actual Costs (Cohort 1a: out of work)
Actual Costs (Cohort 1b: in work, no
childcare)
Pilot
Group Control Group
Pilot Group
Control Group
Mailed 13694 13695 18944 18915
Inbound Calls 1080 702 1052 646
Proportion 7.9% 5.0% 5.5% 3.4%
Outbound Calls 4153 4008 4207 5034
Proportion 30.3% 29.3% 22.2% 26.6%
Registered an interest12 696 401 502 260
Proportion 5.1% 2.9% 2.6% 1.4% Moved into work & childcare13
77 44 126 96
Proportion14 0.6% 0.3% 0.7% 0.5%
12 ‘Registered an Interest’ are those families who when contacted by the DfE contractor both registered an interest in the pilot and declared that they were looking for work and / or registered childcare. 13 Figures are based on families who have moved into work and childcare through the CAP09 process. 14 The proportion of families who registered an interest and moved into work & childcare were 11% (pilot) and 11% (control)
12

Interestingly the proportions recruited under these parts of the Actual Costs pilots were similar to those achieved under a separate pilot offering to pay 100% of childcare costs15. Movement into work Figure 3: Showing movement into work and childcare for each element of cohort 116
Movement into work and childcare (Cohort 1a)
0
10
20
30
40
50
60
70
80
06/07
/2009
20/07
/2009
03/08
/2009
17/08
/2009
31/08
/2009
14/09
/2009
28/09
/2009
12/10
/2009
26/10
/2009
09/11
/2009
23/11
/2009
07/12
/2009
21/12
/2009
04/01
/2010
18/01
/2010
01/02
/2010
15/02
/2010
01/03
/2010
15/03
/2010
29/03
/2010
Movement into childcare (Cohort 1b)
0
20
40
60
80
100
120
140
06/0
9/20
09
20/0
9/20
09
04/1
0/20
09
18/1
0/20
09
01/1
1/20
09
15/1
1/20
09
29/1
1/20
09
13/1
2/20
09
27/1
2/20
09
10/0
1/20
10
24/0
1/20
10
07/0
2/20
10
21/0
2/20
10
07/0
3/20
10
21/0
3/20
10
04/0
4/20
10
Pilot GroupPilot GroupControl GroupControl Group
In both cohorts the propensity for the pilot groups within CAP09 to find work and childcare or additional childcare is greater than for the control group suggesting that the availability of 4 weekly cost budgeting and the provision of transition payments encourages employment and take up of childcare. For Cohort 1a however, HMRC administrative data shows that almost twice as many families, who registered an interest in the pilot, moved into work and childcare before the end of the pilot period, but did so outside the CAP09 process. Hence they did not engage with the alternative ‘better budgeting’ process. Clearly then cost budgeting may well be a factor in family decisions around work and childcare but other factors are also present and may in many cases supersede any perceived process advantages offered by the pilot17. The CAP09 research looks at this and provides valuable insights into the family decision process. In terms of the rate of movement into work in Cohort 1a there is a marked increase in the rate in September which probably relates to the end of the summer school holidays again indicating that work decisions include factors in addition to financial / budgeting issues. The movement into childcare in Cohort 1b shows no such sudden rise which would seem to confirm this. 15 It is interesting in terms of the 100% Pilot objectives in that it provides further evidence that affordability of childcare costs in and of themselves are not a single primary factor driving family decisions to move into work. The response to the Actual Costs Pilot offer of 80% of actual costs resulted in as favourable a response to one where HMRC offered 100% of average costs. 16 Data source – TCO records and HMRC administrative data from its tax credits system 17 The decision to not enter the pilot may in some cases have been accidental, where aspects of the pilot’s design were either unclear or forgotten.
13

“Cohort 2” The third group, those already in work and childcare, and allowing families in with higher incomes, generated considerable interest in joining the pilot18. Whether this is because those already claiming childcare benefits more immediately understood an attraction in claiming actual costs or whether there was something in the delivery system that skewed the response is not known. However following the initial registering of interest when speaking to the DfE contractor a large proportion19 then dropped out when contacted by the TCO to initiate the pilot saying they were no longer interested. The suspicion is that only on speaking to the TCO did families understand the pilot offer and that on hearing there were no enhanced benefits they dropped out. Nonetheless some 868 families did agree to join the pilot.
18 From about 30,000 families mailed with the offer there were over 5000 families registering an interest in the pilot. 19 Of the 5000 families who registered an interest in the pilot with the DfE contractor, The TCO and the DfE contractor then contacted them to join the pilot. On contact however only 868 agreed to join. As is seen below in the section on reasons for non take up the main reason given for changing their mind were not wanting 4 weekly contact with HMRC
14

Number of families who drop out of the pilot system, particularly those who return to the standard system Analysis of the pilot data suggests that there is no significant difference between the cohorts as to why pilot families left the pilots. In three quarters of cases they simply completed the course. Figure 4: Reasons why families left the Actual Costs pilots
Ceased reason Number of cases
Compliance case 2
Do not want cash cheque 1
Do not want contact monthly 1% 9
End Of Pilot Period 73% 786
Income increased over limit 2% 21
Miscellaneous 16% 173
Want to leave Pilot 7% 79
It is not known whether families understood they could leave the pilot part way through however a few (7%) certainly did.
15
Does the pilot system help parents cope better with seasonal variations in childcare costs?
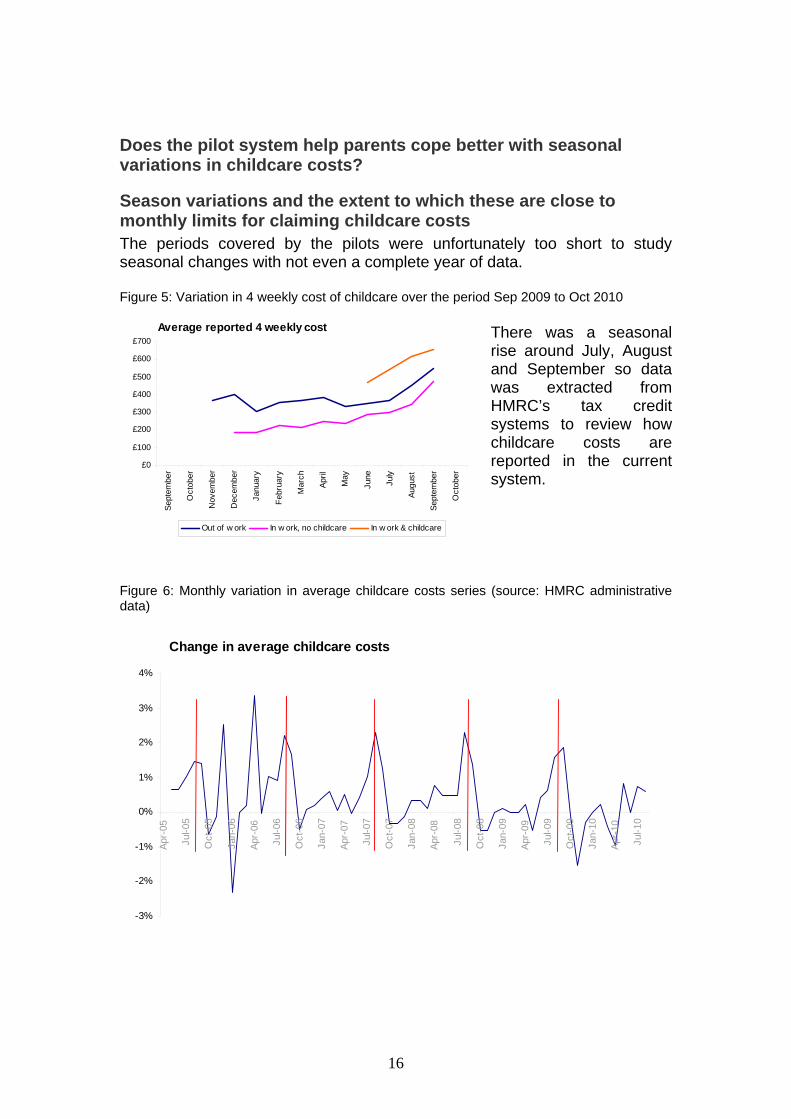
Season variations and the extent to which these are close to monthly limits for claiming childcare costs The periods covered by the pilots were unfortunately too short to study seasonal changes with not even a complete year of data. Figure 5: Variation in 4 weekly cost of childcare over the period Sep 2009 to Oct 2010
Average reported 4 weekly cost
£0
£100
£200
£300
£400
£500
£600
£700
Sept
embe
r
Oct
ober
Nov
embe
r
Dec
embe
r
Janu
ary
Febr
uary
Mar
ch
April
May
June
July
Augu
st
Sept
embe
r
Oct
ober
Out of w ork In w ork, no childcare In w ork & childcare
There was a seasonal rise around July, August and September so data was extracted from HMRC’s tax credit systems to review how childcare costs are reported in the current system.
Figure 6: Monthly variation in average childcare costs series (source: HMRC administrative data)
Change in average childcare costs
-3%
-2%
-1%
0%
1%
2%
3%
4%
Apr-
05
Jul-0
5
Oct
-05
Jan-
06
Apr-
06
Jul-0
6
Oct
-06
Jan-
07
Apr-
07
Jul-0
7
Oct
-07
Jan-
08
Apr-
08
Jul-0
8
Oct
-08
Jan-
09
Apr-
09
Jul-0
9
Oct
-09
Jan-
10
Apr-
10
Jul-1
0
16

These results confirm the existence of a seasonal rise in August and September20. An oddity in this finding is that the analysis is looking at HMRC administrative data which is tracking families’ stated annual average costs across each year. As such there should not be any seasonality as the averaging is designed to smooth out fluctuations in payment. Clearly then there is an issue in the averaging system whereby either families are unable to average their costs or are unable to predict fluctuations in costs in advance21. This aspect will be looked at in more detail later on in the section on error and fraud and overpayments. A review of 4 weekly claims, in addition to highlighting the higher costs in August and September, shows a significant variation in amounts across the cohorts. Figure 7: Variation in 4 weekly cost of childcare over the period September 2009 to October 2010 for each Cohort.
Cohort 1a Cohort 1b Cohort 2 Cohort 1a (out of work at start of pilot) Average 4
weekly claim No. of claims
Average 4 weekly claim
No. of claims
Average 4 weekly claim
No. of claims
June Not available22 5
2009 July Not available 0 August Not available 1 September £554 11 October £420 29 November £364 51 Not available 5 December £401 47 £186 20 January £307 45 £183 26 2010 February £358 49 £226 55 March £363 61 £214 113 April £386 59 £249 108 May £334 51 £236 97 Not available 4 June £351 56 £290 103 £469 488 July £371 48 £294 93 £541 742 August £452 38 £342 79 £618 648 September £545 20 £472 38 £657 631 October £595 7
Note: claims are 4 weekly so it has not been possible to 100% accurately align a claim with a specific month’s costs however the table provides a robust guide of costs over the pilot period. 20 September may be higher perhaps as families realise their higher summer holiday costs and claim after the event for their costs. In 2005/06 there were some policy changes – the limits were increased in April 05 and the % of eligible costs paid in April 06 (70% to 80%), which caused a change in the normal seasonal variations in costs. 21 There is a further complication in the current system in that families can apply for support for fixed periods only, which if short enough is closer to an actual costs system 22 Averages are not taken where there are 5 or less items within a sample as results have a tendency to be skewed.
17
There are a number of possible explanations as to why reported childcare costs varied across the three cohorts:
o Firstly it is noted that the expected summer peak in September has materialised as predicted;
o Families in Cohort 1a are new to work and come from a lower income bracket than Cohort 2. As such lower childcare costs may relate to lower skill or experience levels23 and being new to a job and earning lower salaries.
o Families in Cohort 1b were in the same income bracket as Cohort 1a so may share the same skill levels and job expectations. In addition as they were already in work but not claiming childcare they may already have a better informal network of childcare support thus reducing their financial requirement for formal childcare arrangements.
o Families in Cohort 2 are from a higher income bracket and therefore may be in a more skilled group. They are already established in work and therefore may be in more sustainable employment with better prospects leading to more confidence in payment for the provision of childcare costs.
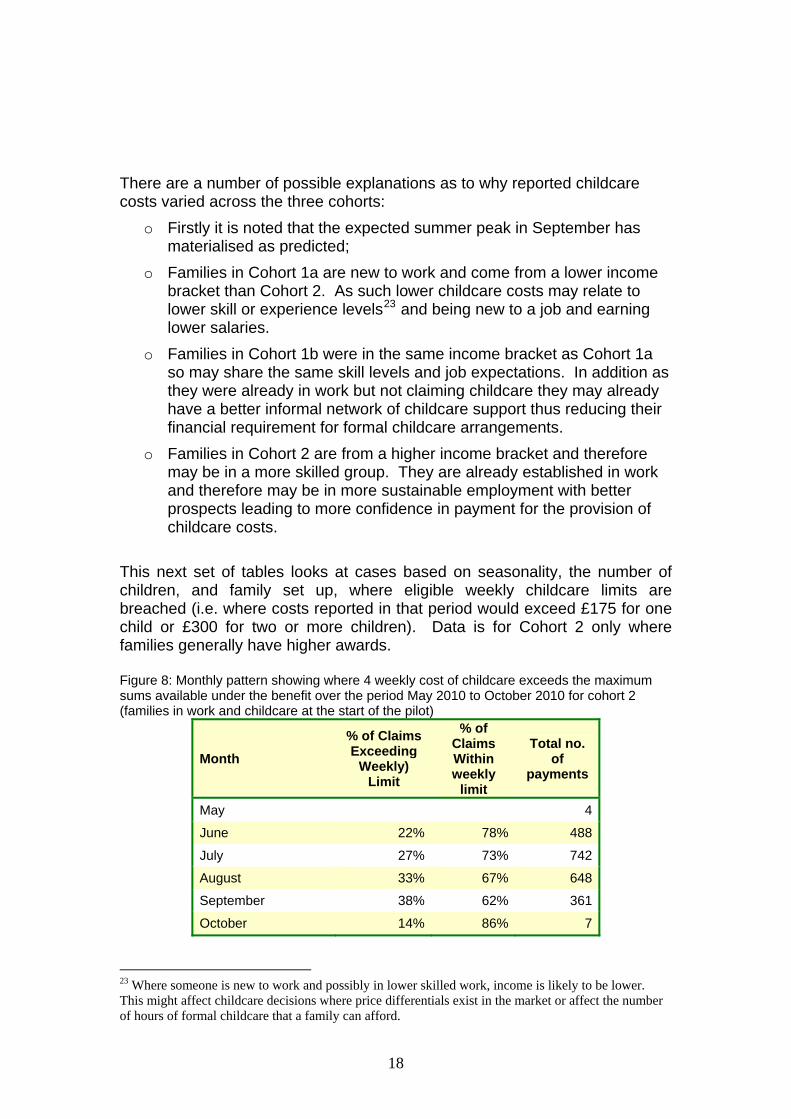
This next set of tables looks at cases based on seasonality, the number of children, and family set up, where eligible weekly childcare limits are breached (i.e. where costs reported in that period would exceed £175 for one child or £300 for two or more children). Data is for Cohort 2 only where families generally have higher awards. Figure 8: Monthly pattern showing where 4 weekly cost of childcare exceeds the maximum sums available under the benefit over the period May 2010 to October 2010 for cohort 2 (families in work and childcare at the start of the pilot)
Month % of Claims Exceeding
Weekly) Limit
% of Claims Within weekly
limit
Total no. of
payments
May 4
June 22% 78% 488
July 27% 73% 742
August 33% 67% 648
September 38% 62% 361
October 14% 86% 7
23 Where someone is new to work and possibly in lower skilled work, income is likely to be lower. This might affect childcare decisions where price differentials exist in the market or affect the number of hours of formal childcare that a family can afford.
18
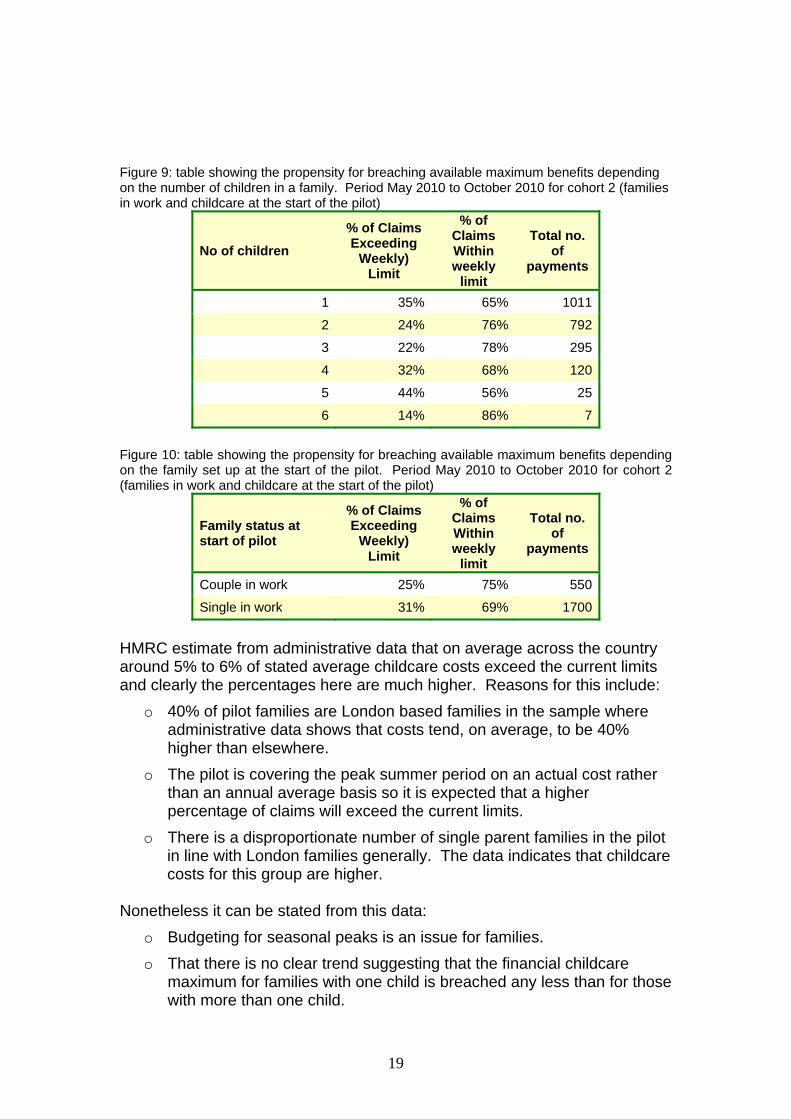
Figure 9: table showing the propensity for breaching available maximum benefits depending on the number of children in a family. Period May 2010 to October 2010 for cohort 2 (families in work and childcare at the start of the pilot)
No of children % of Claims Exceeding
Weekly) Limit
% of Claims Within weekly
limit
Total no. of
payments
1 35% 65% 1011
2 24% 76% 792
3 22% 78% 295
4 32% 68% 120
5 44% 56% 25
6 14% 86% 7
Figure 10: table showing the propensity for breaching available maximum benefits depending on the family set up at the start of the pilot. Period May 2010 to October 2010 for cohort 2 (families in work and childcare at the start of the pilot)
Family status at start of pilot
% of Claims Exceeding
Weekly) Limit
% of Claims Within weekly
limit
Total no. of
payments
Couple in work 25% 75% 550
Single in work 31% 69% 1700
HMRC estimate from administrative data that on average across the country around 5% to 6% of stated average childcare costs exceed the current limits and clearly the percentages here are much higher. Reasons for this include:
o 40% of pilot families are London based families in the sample where administrative data shows that costs tend, on average, to be 40% higher than elsewhere.
o The pilot is covering the peak summer period on an actual cost rather than an annual average basis so it is expected that a higher percentage of claims will exceed the current limits.
o There is a disproportionate number of single parent families in the pilot in line with London families generally. The data indicates that childcare costs for this group are higher.
Nonetheless it can be stated from this data:
o Budgeting for seasonal peaks is an issue for families. o That there is no clear trend suggesting that the financial childcare
maximum for families with one child is breached any less than for those with more than one child.
19

o That single parent families do need higher levels of childcare support than couples possibly because partners in couples can to some extent share childcare duties between them whilst the other parent works, a degree of flexibility which is not available to a lone parent.
20
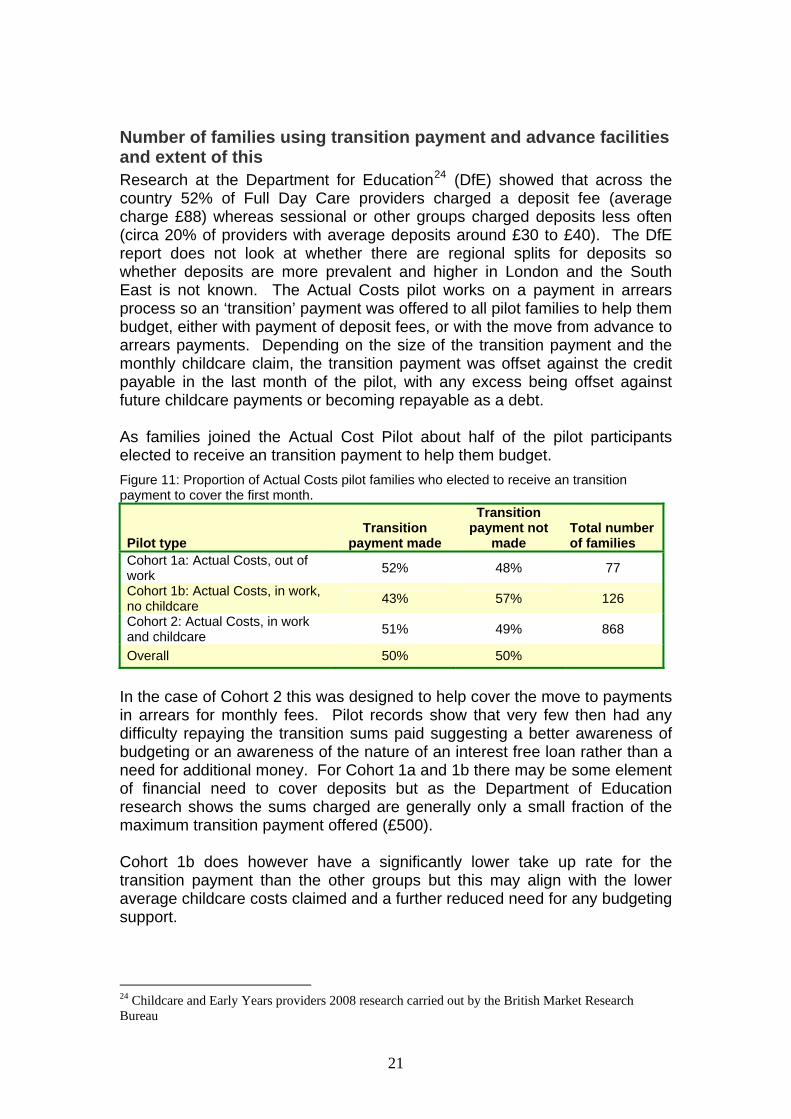
Number of families using transition payment and advance facilities and extent of this Research at the Department for Education24 (DfE) showed that across the country 52% of Full Day Care providers charged a deposit fee (average charge £88) whereas sessional or other groups charged deposits less often (circa 20% of providers with average deposits around £30 to £40). The DfE report does not look at whether there are regional splits for deposits so whether deposits are more prevalent and higher in London and the South East is not known. The Actual Costs pilot works on a payment in arrears process so an ‘transition’ payment was offered to all pilot families to help them budget, either with payment of deposit fees, or with the move from advance to arrears payments. Depending on the size of the transition payment and the monthly childcare claim, the transition payment was offset against the credit payable in the last month of the pilot, with any excess being offset against future childcare payments or becoming repayable as a debt. As families joined the Actual Cost Pilot about half of the pilot participants elected to receive an transition payment to help them budget. Figure 11: Proportion of Actual Costs pilot families who elected to receive an transition payment to cover the first month.
Pilot type Transition
payment made
Transition payment not
made Total number of families
Cohort 1a: Actual Costs, out of work 52% 48% 77
Cohort 1b: Actual Costs, in work, no childcare 43% 57% 126
Cohort 2: Actual Costs, in work and childcare 51% 49% 868
Overall 50% 50%
In the case of Cohort 2 this was designed to help cover the move to payments in arrears for monthly fees. Pilot records show that very few then had any difficulty repaying the transition sums paid suggesting a better awareness of budgeting or an awareness of the nature of an interest free loan rather than a need for additional money. For Cohort 1a and 1b there may be some element of financial need to cover deposits but as the Department of Education research shows the sums charged are generally only a small fraction of the maximum transition payment offered (£500). Cohort 1b does however have a significantly lower take up rate for the transition payment than the other groups but this may align with the lower average childcare costs claimed and a further reduced need for any budgeting support.
24 Childcare and Early Years providers 2008 research carried out by the British Market Research Bureau
21

Where transition payments were made these were not always for the full £500 available. Figure 12: charts showing the proportion of families overall and in each cohort who utilised the transition payment facility and of these how many used the full limit available.
Overall extent of use of initial payments
194
343
534
Full transition paymentLess than full transition paymentNo payment
Extent of use of initial payments, Cohort 1a (out of work at start of pilot)
24
16
37
Full transition paymentLess than full transition paymentNo payment
Extent of use of initial payments, Cohort 1b (in work, no childcare at start of pilot)
8
46
72
Full transition paymentLess than full transition paymentNo payment
Extent of use of initial payments, Cohort 2 (in work and childcare at start of pilot)
162
281
425
Full transition paymentLess than full transition paymentNo payment
Factors in terms of family size, set up etc. that might influence the taking of a transition payment have been examined. Data indicates that lone parents are more likely to ask for a transition payment than couples and that income levels where transition payments are requested are higher in London than the South East. It has not been possible to further stratify the data due to small sample sizes. In addition to the transition payment facility the CAP09 pilot also offered an ‘advance payment’ facility to help families cope with sudden unexpected costs. In the event there were only 9 requests for an advance payment throughout the CAP09 pilot. The facility was not something raised by the TCO on a regular basis during 4 weekly calls but was raised in the initial
22

contact by the DfE contractor suggesting either a lack of need for such additional support or a lack of awareness of the facility.
23
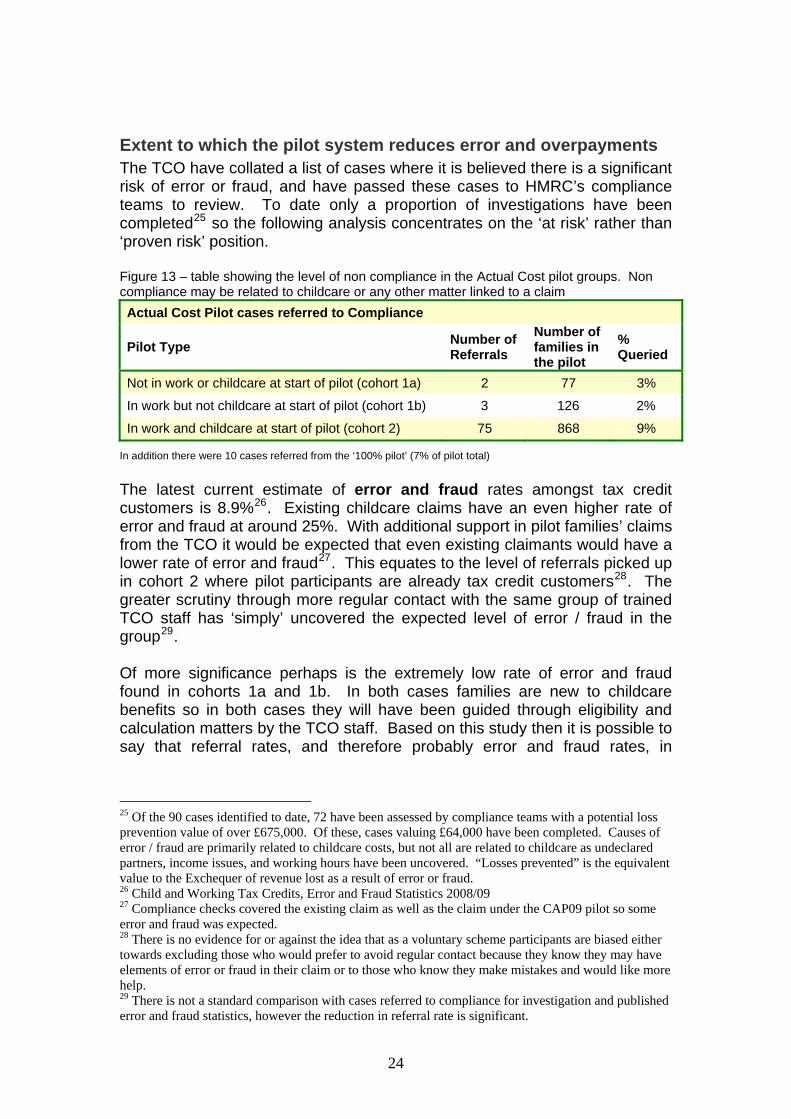
Extent to which the pilot system reduces error and overpayments The TCO have collated a list of cases where it is believed there is a significant risk of error or fraud, and have passed these cases to HMRC’s compliance teams to review. To date only a proportion of investigations have been completed25 so the following analysis concentrates on the ‘at risk’ rather than ‘proven risk’ position. Figure 13 – table showing the level of non compliance in the Actual Cost pilot groups. Non compliance may be related to childcare or any other matter linked to a claim Actual Cost Pilot cases referred to Compliance
Pilot Type Number of Referrals
Number of families in the pilot
% Queried
Not in work or childcare at start of pilot (cohort 1a) 2 77 3%
In work but not childcare at start of pilot (cohort 1b) 3 126 2%
In work and childcare at start of pilot (cohort 2) 75 868 9%
In addition there were 10 cases referred from the ‘100% pilot’ (7% of pilot total) The latest current estimate of error and fraud rates amongst tax credit customers is 8.9%26. Existing childcare claims have an even higher rate of error and fraud at around 25%. With additional support in pilot families’ claims from the TCO it would be expected that even existing claimants would have a lower rate of error and fraud27. This equates to the level of referrals picked up in cohort 2 where pilot participants are already tax credit customers28. The greater scrutiny through more regular contact with the same group of trained TCO staff has ‘simply’ uncovered the expected level of error / fraud in the group29. Of more significance perhaps is the extremely low rate of error and fraud found in cohorts 1a and 1b. In both cases families are new to childcare benefits so in both cases they will have been guided through eligibility and calculation matters by the TCO staff. Based on this study then it is possible to say that referral rates, and therefore probably error and fraud rates, in
25 Of the 90 cases identified to date, 72 have been assessed by compliance teams with a potential loss prevention value of over £675,000. Of these, cases valuing £64,000 have been completed. Causes of error / fraud are primarily related to childcare costs, but not all are related to childcare as undeclared partners, income issues, and working hours have been uncovered. “Losses prevented” is the equivalent value to the Exchequer of revenue lost as a result of error or fraud. 26 Child and Working Tax Credits, Error and Fraud Statistics 2008/09 27 Compliance checks covered the existing claim as well as the claim under the CAP09 pilot so some error and fraud was expected. 28 There is no evidence for or against the idea that as a voluntary scheme participants are biased either towards excluding those who would prefer to avoid regular contact because they know they may have elements of error or fraud in their claim or to those who know they make mistakes and would like more help. 29 There is not a standard comparison with cases referred to compliance for investigation and published error and fraud statistics, however the reduction in referral rate is significant.
24

childcare benefits have reduced by about 7% as a result of working the Actual Cost pilot mechanism30. There has generally been a low rate of overpayment generated by the pilot31. However 7 out of the 9 ‘advance’ payment cases resulted in an overpayment. Of the other 119 Actual Cost families who had an overpayment 27 arose from the family deciding to leave the pilot after the transition payment was made. All 27 cases were in Cohort 2 (where the customer was already in work and childcare, none in cohorts 1a or 1b32. The remaining cases were for standard reasons of changes in circumstances and hardship. The national picture of overpayments33 shows that in 2008/09 some 6.9 million tax credit awards were made of which 1.3 million resulted in overpayments (19%). This includes all award payments for Working Tax Credit and Child Tax Credit. Given that the error and fraud rate for childcare payments at 25% has traditionally been much higher than other awards, it is reasonable to assume the percentage of overpayments for childcare may also be greater. The overpayment cases in the Actual Costs pilot varied slightly between the three cohorts:
o Not in work or childcare (cohort 1a) – 11 out of 77 cases had an overpayment (14%) though three of these related to families who took the transition payment then left the pilot (net 8 out of 74 = 11%)
o In work but not in childcare (cohort 1b) – 13 out of 126 cases had an overpayment (10%) but seven of these cases related to taking the transition payment and leaving the pilot or failing to call in their costs (net 6 out of 119 = 5%)
o In work and childcare – 104 out of 868 cases had an overpayment (12%) but of these 23 took the transition payment and left the pilot and 11 simply stopped calling in their costs (net 70 out of 834 = 8%)
There is no available analysis to confirm the exact link between error and fraud and overpayments. It is known that the main cause of overpayments across all tax credits is the under estimating of income and late notification of changes in circumstances. However with a high rate of error in the childcare element there may be an associated high rate of overpayment. There is a further caveat in that overpayment statistics relate to post finalisation cases so covering the full year whereas the CAP09 pilot ran only over a few months allowing for less time for income or other adjustments to happen. As an 30 The higher rate of error / fraud of 7% in the 100% pilot further supports this thesis as 100% pilot families did not have the advantage of monthly contacts or as much help with their calculations at outset. 31 There were 128 overpayment cases in the Actual Costs pilot representing 12% of all families in the pilot. 32 This may be more to do with existing childcare families deciding they didn’t want a 4 weekly contact or perhaps those who took advantage of an opportunity for perceived financial gain. 33 Child and Working Tax Credit Statistics – Finalised Annual Awards 2008/09 – Supplement on payments in 2008/09
25

actual costs process however TCO staff did question families wherever income and childcare details suggested possible non compliance.
26
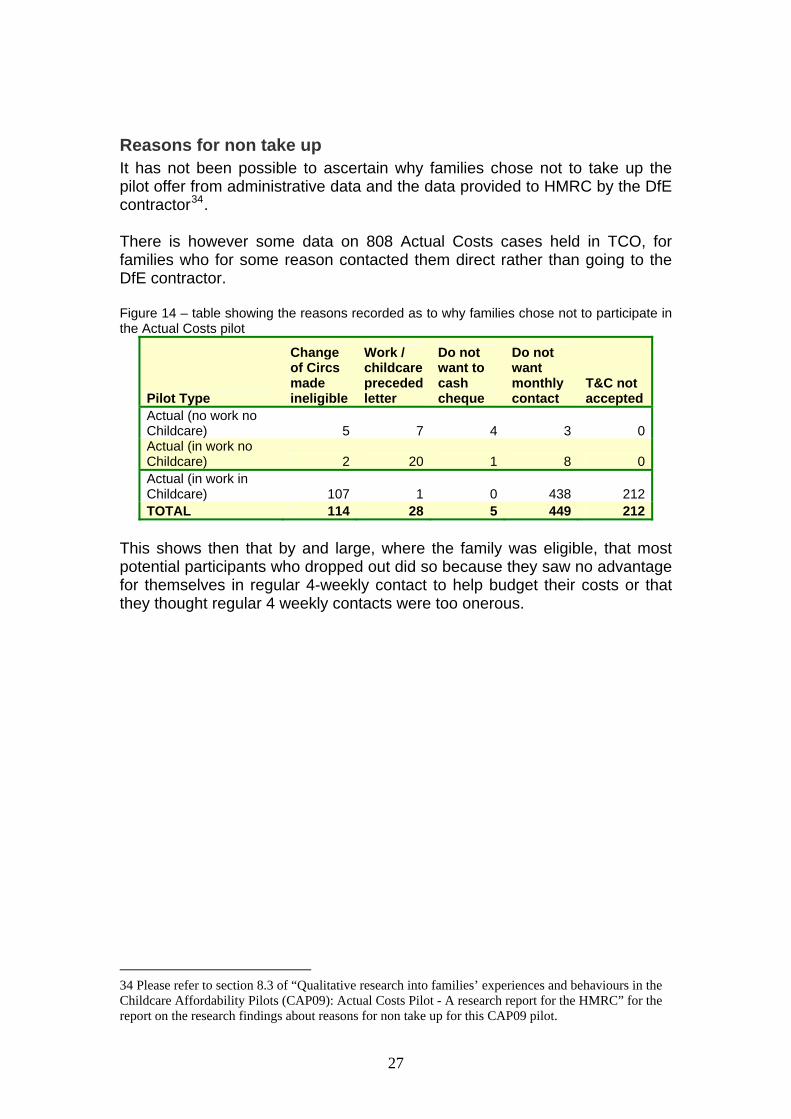
Reasons for non take up It has not been possible to ascertain why families chose not to take up the pilot offer from administrative data and the data provided to HMRC by the DfE contractor34. There is however some data on 808 Actual Costs cases held in TCO, for families who for some reason contacted them direct rather than going to the DfE contractor. Figure 14 – table showing the reasons recorded as to why families chose not to participate in the Actual Costs pilot
Pilot Type
Change of Circs made ineligible
Work / childcare preceded letter
Do not want to cash cheque
Do not want monthly contact
T&C not accepted
Actual (no work no Childcare) 5 7 4 3 0 Actual (in work no Childcare) 2 20 1 8 0 Actual (in work in Childcare) 107 1 0 438 212 TOTAL 114 28 5 449 212
This shows then that by and large, where the family was eligible, that most potential participants who dropped out did so because they saw no advantage for themselves in regular 4-weekly contact to help budget their costs or that they thought regular 4 weekly contacts were too onerous.
34 Please refer to section 8.3 of “Qualitative research into families’ experiences and behaviours in the Childcare Affordability Pilots (CAP09): Actual Costs Pilot - A research report for the HMRC” for the report on the research findings about reasons for non take up for this CAP09 pilot.
27

Cost / benefit analysis – implications for implementing an actual costs system for child care costs A full cost benefit analysis has been completed with the help of the HMRC TCO team. A full set of process maps have been drawn up and set out in Appendix 01 and timings and costs estimated for each stage in Appendix 02. Against these costs, benefits have been estimated in terms of a reduction in referrals / error & fraud in the tax credit system, as a result of more active and regular call handling. All figures in the cost benefit analysis are based on the findings from the CAP09 Actual Cost pilot. Figure 15 – Cost / Benefit Analysis summary – for full analysis please see Appendix 02
CBA Value (£)
Total Costs in pilot (3 months) £67,748 Total costs if run within standard TCO systems (3 months) £61,764
Additional ‘compliance check’ costs (3 months) £22,392
Annualised Cost £336,624
Total benefits Between £320,000 and £420,000
The benefits figure is given as a range because the average yield35 figures in the TCO compliance report look high compared to average yields for childcare tax credit cases. This may partly be down to counting of past year yield gains into the calculation or potential late recording of changes36. The average yield figure in the TCO record is £6,782 however this has been reduced by 40% to 60% to account for any possible over estimation. Arguably the average yield figure could be reduced still further but as these are mainly London cases where awards and yield tends to be higher than elsewhere in the country this has not been done.
This analysis works for the CAP09 pilot but not necessarily if translated to become ‘business as usual’. CAP09 was staffed appropriately37 so allowed families excellent access into phone services therefore a revised cost benefit analysis is needed to assess the efficacy of the Actual Cost process for all tax credit childcare customers. There may be practical difficulties because of the number of families who preferred not to commit to 4 weekly contact with the TCO38. However the pilot was voluntary and perhaps a mandated system
35 Yield is the financial value of the reduction in error and fraud. 36 The family may have reported the change later on in the year anyway, so reducing any financial implications of an overpayment. 37 Staff numbers were sufficient to answer 100% of calls and staff were trained tax credit administrators so able to provide a wide range of help and advice. 38 A concern is that the pilot groups might be ‘biased’ as those who reject regular contact may have characteristics more prone to error or delay.
28

would have fewer issues39 especially if payments stopped if families failed to call 4 weekly to renew their claim40. If it were possible to identify higher risk families and pull only them into a telephone based actual cost system this might reduce the numbers and increase the benefits though a method for other (lower risk) families will be needed for them to record their actual childcare costs too. Under the current tax credit process all families renew their claims over a short period at the start of the financial year. Applying an actual cost system for all families on the basis run in CAP09 then may put a burden on call operatives at this time of peak activity during the year, which could lead to unanswered calls and lower service standards.
39 People generally dislike change so presumably will settle into a ‘norm’ in time if it is mandated. It could however be equally strongly argued that participants of the pilot were volunteers and therefore may more naturally accept change, so a mandated system would raise additional issues. 40 Stopped payments can create other problems however as families realise their mistake and then try to reinstate benefits however recent policy changes to limit back dating to a single month minimise this cost.
29
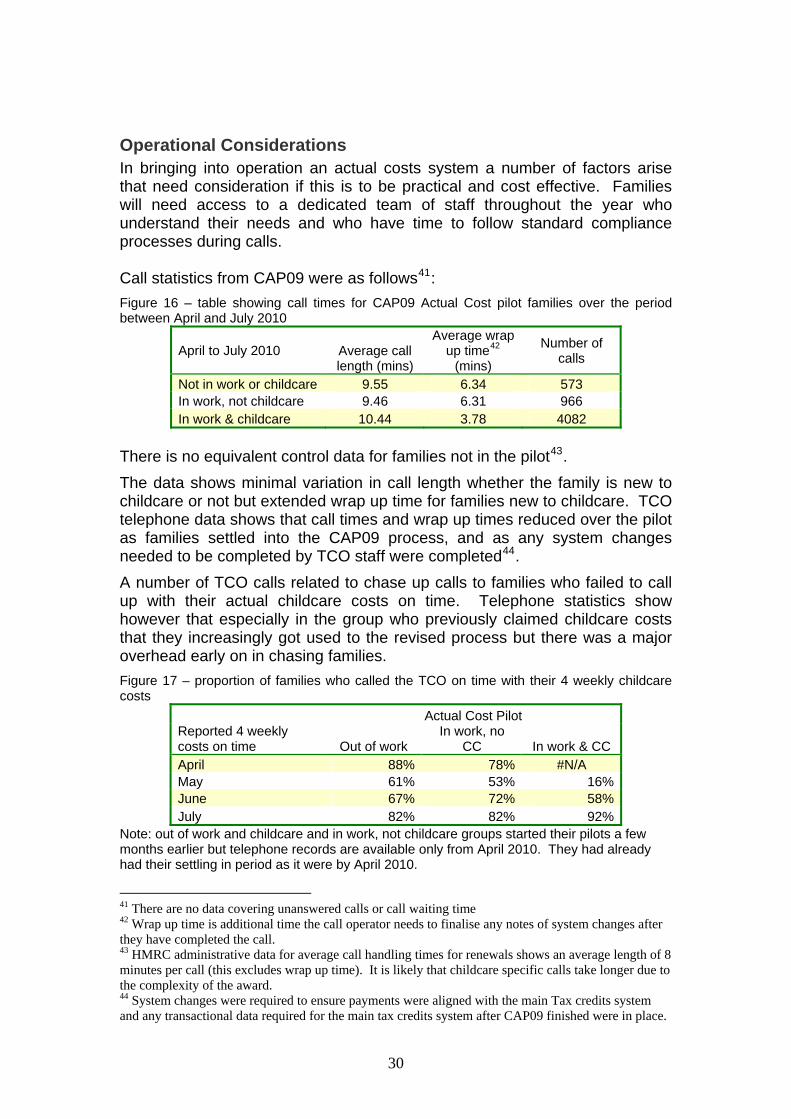
Operational Considerations In bringing into operation an actual costs system a number of factors arise that need consideration if this is to be practical and cost effective. Families will need access to a dedicated team of staff throughout the year who understand their needs and who have time to follow standard compliance processes during calls. Call statistics from CAP09 were as follows41: Figure 16 – table showing call times for CAP09 Actual Cost pilot families over the period between April and July 2010
April to July 2010 Average call length (mins)
Average wrap up time42
(mins)
Number of calls
Not in work or childcare 9.55 6.34 573 In work, not childcare 9.46 6.31 966 In work & childcare 10.44 3.78 4082
There is no equivalent control data for families not in the pilot43. The data shows minimal variation in call length whether the family is new to childcare or not but extended wrap up time for families new to childcare. TCO telephone data shows that call times and wrap up times reduced over the pilot as families settled into the CAP09 process, and as any system changes needed to be completed by TCO staff were completed44. A number of TCO calls related to chase up calls to families who failed to call up with their actual childcare costs on time. Telephone statistics show however that especially in the group who previously claimed childcare costs that they increasingly got used to the revised process but there was a major overhead early on in chasing families. Figure 17 – proportion of families who called the TCO on time with their 4 weekly childcare costs
Actual Cost Pilot Reported 4 weekly costs on time Out of work
In work, no CC In work & CC
April 88% 78% #N/A May 61% 53% 16% June 67% 72% 58% July 82% 82% 92%
Note: out of work and childcare and in work, not childcare groups started their pilots a few months earlier but telephone records are available only from April 2010. They had already had their settling in period as it were by April 2010.
41 There are no data covering unanswered calls or call waiting time 42 Wrap up time is additional time the call operator needs to finalise any notes of system changes after they have completed the call. 43 HMRC administrative data for average call handling times for renewals shows an average length of 8 minutes per call (this excludes wrap up time). It is likely that childcare specific calls take longer due to the complexity of the award. 44 System changes were required to ensure payments were aligned with the main Tax credits system and any transactional data required for the main tax credits system after CAP09 finished were in place.
30

31
To roll the actual costs system out to all childcare families would require a significant increase in trained call handlers. This could be mitigated if families could utilise self serve options at least for their monthly cost updates. However there is the potential of increased error and fraud from self serve channels. Much of the improvement achieved in CAP09 is believed to be linked to both having personal contact with trained staff and having regular contact with the same staff. It is possible that methodologies for risk categorisation of families might be found allowing a light touch approach for ‘lower risks’, thus reducing overall operational costs, whilst minimising any loss of improvement in error and fraud.
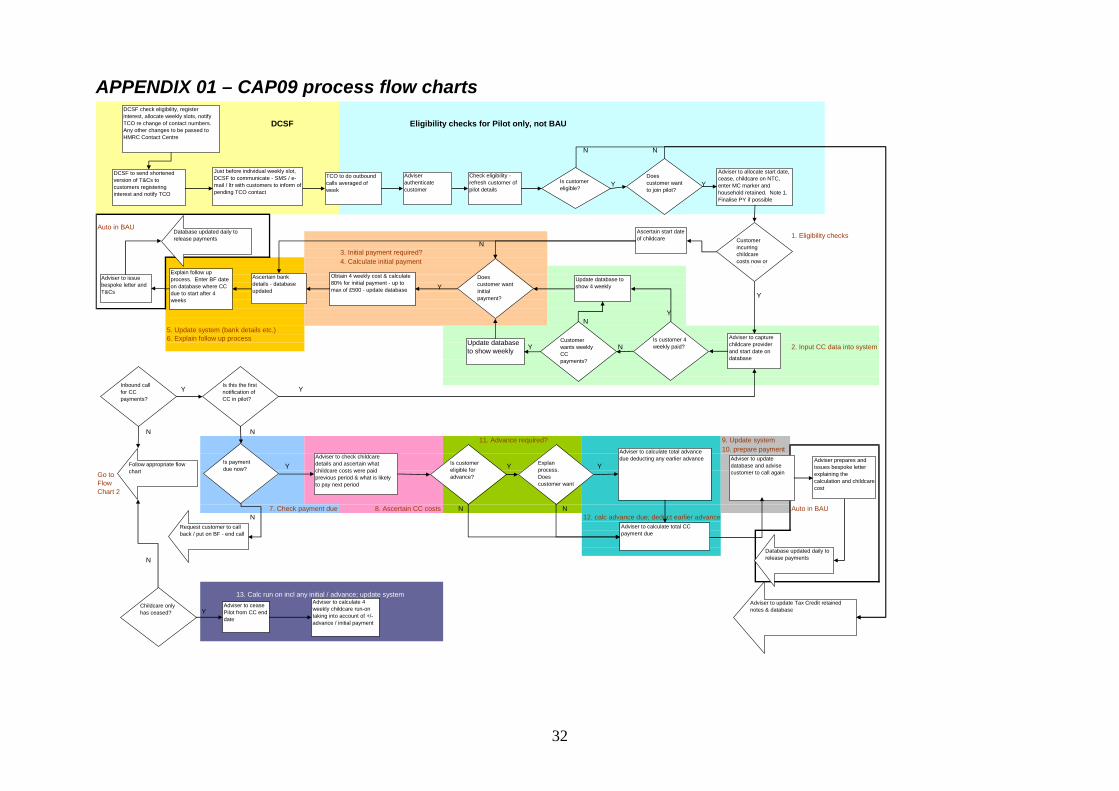
APPENDIX 01 – CAP09 process flow charts
DCSF Eligibility checks for Pilot only, not BAU
N N
Y Y
Auto in BAU1. Eligibility checks
N3. Initial payment required?4. Calculate initial payment
YY
YN
5. Update system (bank details etc.)6. Explain follow up process
Y N 2. Input CC data into system
Y Y
N N11. Advance required? 9. Update system
10. prepare payment
Y Y YGo toFlowChart 2
7. Check payment due 8. Ascertain CC costs N N Auto in BAUN 12. calc advance due; deduct earlier advance
N
13. Calc run on incl any initial / advance; update system
Y
DCSF check eligibility, register interest, allocate weekly slots, notify TCO re change of contact numbers. Any other changes to be passed to HMRC Contact Centre
DCSF to send shortened version of T&Cs to customers registering interest and notify TCO
Just before individual weekly slot, DCSF to communicate - SMS / e-mail / ltr with customers to inform of pending TCO contact
TCO to do outbound calls averaged of week
Adviser authenticate customer
Check eligibility - refresh customer of pilot details
Is customer eligible?
Does customer want to join pilot?
Adviser to allocate start date, cease, childcare on NTC, enter MC marker and household retained. Note 1. Finalise PY if possible
Customer incurring childcare costs now or
t t i
Ascertain start date of childcare
Adviser to capture childcare provider and start date on database
Is customer 4 weekly paid?
Customer wants weekly CC payments?
Update database to show 4 weekly
Update database to show weekly
Does customer want Initial payment?
Obtain 4 weekly cost & calculate 80% for initial payment - up to max of £500 - update database
Ascertain bank details - database updated
Explain follow up process. Enter BF date on database where CC due to start after 4 weeks
Adviser to issue bespoke letter and T&Cs
Database updated daily to release payments
Inbound call for CC payments?
Is this the first notification of CC in pilot?
Is payment due now?
Follow appropriate flow chart
Request customer to call back / put on BF - end call
Adviser to check childcare details and ascertain what childcare costs were paid previous period & what is likely to pay next period
Is customer eligible for advance?
Explan process. Does customer want d ?
Adviser to calculate total advance due deducting any earlier advance
Adviser to calculate total CC payment due
Adviser to update database and advise customer to call again
Adviser prepares and issues bespoke letter explaining the calculation and childcare cost
Database updated daily to release payments
Childcare only has ceased?
Adviser to cease Pilot from CC end date
Adviser to calculate 4 weekly childcare run-on taking into account of +/- advance / initial payment
Adviser to update Tax Credit retained notes & database
32

DCSF
33
14. Benefit end
13. No call from customer re benefits 7. Payment enquiry
15. Change of circumstances 14. Benefit end
16. Pilot / Control: rejoining
17. Complaints received
Auto in BAU
Y
N
Auto in BAUY
Y Y
N N
Auto in BAU
Y N
N Y
Pass to Complaints Team as BAU
Adviser to update database with pilot end date, issue bespoke letter & notify DCSF
Manager to do daily update of database which will issue all payments due
Adviser issues bespoke letter
Update database & issue bespoke letter
Adviser to put MC marker on system and update retained note
B/f has expired and no customer contact
Adviser to calculate 4 weeks childcare run-on taking account of any advance / initial payment
Adviser to deal with or escalate
Update database / NTC and issue bespoke letter
Adviser to update database and NTC system and explain follow up process. End call
Call received at DCSF & channelled to appropriate area (see Flow Chart 1)
Customer wants to cease pilot
No customer contact by b/f date
Employment has ceased / reduced hours to less than 16
Customer wants to rejoin pilot?
Complaints received
Refer to NTC CC
Adviser finds out reason and updates database
Adviser explains consequences
Adviser calculates and childcare payment due
Wxpired b/f list sent to DCSF to issue reminders. Further b/f date recorded on database
Adviser to issue bespoke reminder letter. B/f on database
Adviser to cease childcare element on database
Pass to project leader
Is it relating to pilot
Send Entitlement Ended stencil to appropriate team
Adviser to inform customer of remaining duration of pilot
Customer calls with CC amount before b/f date
Refresh customer pilot details
Is complaint about TCO
WTC entitlement ended?
Pass to DCSF
Update database and end call
Is customer eligible to go back on pilot?
Update NTC system

APPENDIX 02 – Cost Benefit Analysis COSTS
Step on flow chart
(New) Customer incurrs childcare costs now or in next 4 weeks Volume (Hit) rate
Process time [mins] Cost
1 Eligibility checks 1212 10 £3,316Compliance check 9% 15 £5,968.88
2Input childcare data onto system
110320 £6,035.20
3 Initial payment required? 487 50% 10 £1,333.274 Calculate initial payment 487 20 £2,666.54
5Update system (bank details etc.)
48710 £1,333.27
6 Explain follow up process 487 5 £666.64
Automatic on TCO system
System releases payment 11035 £1,508.80
Automatic on TCO system
Letter confirming T&Cs and details
11035 £1,508.80
Additional calls / workAward 5 13 £17.78
17 Complaints/Compliments 18 27 £159.5615 Overpayments 4 6 £6.57
Security 1 4 £1.19
Inbound call for payment of childcare benefit
7 Check payment due 2182 90% 3 £1,790.99
8Ascertain childcare cost details 10 £5,969.97
928 2% 15 £4,568.989 Update system 2138 5 £2,925.29
10 Prepare pa
Compliance check
yment £0.00
11 Advance required? 11 1% 10 £29.25
12Calculate advance due, deduct earlier advance 20 £58.51
Automatic on TCO system
System releases payment 10845 £1,483.42
Automatic on TCO system
Letter confirming T&Cs and details
10845 £1,483.42
13 If no call received 412Contact centre call out 5 £187.87
TCO letter, reminding them to call 5 £187.87TCO phone call 5 £187.87
Additional calls (non pilot customers etc.) (Existing customer) Change of circumstances - Inbo
15 Change of Circumstances 11 10 £30.1015 General Enquiry 2388 12 £7,840.3116 Pilot/Control 309 19 £1,606.3115 Renewals 3 5 £4.10
2407 2% 15 £11,854.04
Benefits end
14
Calculate run on (incl any initial or advance payment; update s
Compliance check
ystem 1103 10 £3,017.60
34

TOTAL COSTS
TOTAL COST £67,748TOTAL COST WITH EXISTING BAU AUTOMATION £61,764
Compliance cost £22,392Grossed up for the year incl compliance (BAU): £336,624
BENEFITSNon compliant Average
No. of cases Hit rate cases yield Total yieldPre-award 1212 7% 85 £3,750 £318,150CoC / enquiry 2399 0 £0Payment 928 0 £0
£318,150It's likely additional E&F will be found at CoC and Payment but this analysisassumes the pre-award checks will cover most E&F
FTE testActual average FTE 12.45
Estimated cost £336,624divided by average salary £27,185
Estimated FTE 12.38 Costs are derived from assumptions as to the average costs per member of staff, the volume of items processed and the time taken to complete an item. Staff costs have allowed for absences and other standard periods of ‘down time’ for training etc.
35

Ref: DFE-RR104 ISBN: 978-1-84775-893-4 © HMRC April 2011